 Matteo Tonezzer
 Sandro C. Izidoro
 João P. A. Moraes
 Le Thi Thanh Dang3
- 1IMEM-CNR, Sede di Trento - FBK, Trento, Italy
- 2Institute of Technological Sciences (ICT), Advanced Campus at Itabira, Universidade Federal de Itajubá, Itabira, Brazil
- 3ITIMS, Hanoi University of Science and Technology, Hanoi, Vietnam
The analysis of ambient (home, office, outdoor) atmosphere in order to check the presence of dangerous gases is getting more and more important. Therefore, tiny sensors capable to distinguish the presence of specific pollutants is crucial. Herein, a resistive sensor based on a carbon modified tin oxide nanowires, able to classify different gases and estimate their concentration, is presented. The C-SnO2 nanostructures are grown by chemical vapor deposition and then used as a conductometric sensor under a temperature gradient. The device works at lower temperatures than pure SnO2, with a better response. Five outputs are collected and combined to form multidimensional data that are specific of each gas. Machine learning algorithms are applied to these multidimensional data in order to teach the system how to recognize different gases. The six tested gases (acetone, ammonia, CO, ethanol, hydrogen, and toluene) are perfectly classified by three models, demonstrating the goodness of the raw sensor response. The gas concentration can also be estimated, with an average error of 36% on the low concentration range 1–50 ppm, making the sensor suitable for detecting the exceedance of the danger thresholds.
Introduction
Increasing pollution is following the progressive urbanization of green areas. Respiratory diseases are increasing due to air contamination in urbanized areas (Jiang et al., 2016; Mo et al., 2018). Consequently, a large number of sensors able to monitor the air quality in workplaces, public places, and residential buildings is required. Such devices clearly need to be tiny, cheap and easy-to-use. A good option could be using metal oxide semiconductor gas sensors, due to their strong corrosion resistance, low cost, simple fabrication, and portability. The huge surface-to-volume ratio of nanostructures improves the sensing performance of metal oxides very much, consenting to detect a gas down to concentrations lower one part per million (ppm). Furthermore, metal oxides (MOs) are sensitive to a wide range of volatile compounds and gases, and this makes them useful for a variety of applications: medical diagnosis (Saidi et al., 2018), defense against terrorist threats (Konstantynovski et al., 2018), agriculture (Sabir et al., 2014), and food and beverages quality (Miller et al., 2014). Finally, adjusting the size and shape of MO nanostructures permits to tune their sensing parameters, owed to their structure-dependent properties (Tonezzer and Iannotta, 2014). Unfortunately, these materials show two weak points: high working temperature and poor selectivity. In order to reduce the MO sensor working temperature, many groups are focusing on decorating it with catalyst. Typical catalysts for SnO2 gas sensors are noble metals such as Pt, Ag, Au, and Pd that increase the sensors response at the same temperature (Iftekhar Uddin et al., 2015; Zhou et al., 2018). This method is effective, but its high cost limits its application.
Selectivity, on the other hand, can be achieved combining a set of these sensors in an electronic nose (Hines et al., 1999; Lee et al., 2002; Tai et al., 2004; Gulbag and Temurtas, 2006; Wolfrum et al., 2006; Cho et al., 2008, 2012; Marco and Gutiérrez-Galvez, 2012; Zhao et al., 2016; Chen et al., 2017; Jiang et al., 2017; Moon et al., 2018; Zhang and Gao, 2019), which however is more cumbersome, complex and expensive. Herein we overcome these problems using carbon modified tin oxide nanowires (Kim et al., 2011, Koo et al., 2017, Wang et al., 2019) and operating them in a temperature gradient. This approach should contain costs much lower than those of an electronic nose, using several different materials.
The idea (a virtual sensor array induced by a thermal gradient) is indeed in between the simple MO resistive sensor and the electronic nose, summarizing the best properties of both (Tonezzer et al., 2018, 2019). Good results can be achieved also with a single nanostructure (Tonezzer, 2019), but that setup is harder to obtain and difficult to replicate for practical purpose out of the laboratory. Using carbon modified SnO2 nanowires as an active material, we could decrease the working temperature range down to 150–270°C. Combining five responses, the nanosensor is able to perfectly classify the six target gases (acetone, ammonia, CO, ethanol, hydrogen, and toluene). It also estimates the gas concentration of each gas with a good average error (36%). This performance is not as good as that of electronic noses but comes from one tiny single material nanosensor that can be easily integrated into distributed networks, mobiles, and wearable electronics.
Materials and Methods
Synthesis of Nanowires
The tin oxide-carbon nanostructures were grown by chemical vapor deposition (CVD) in a horizontal quartz tube positioned inside a Lindberg Blue M furnace. The tin oxide evaporation source (an alumina boat filled with SnO powder) was put at the center of the furnace, where the temperature has its maximum. A Si/SiO2 substrate, deposited with a very thin film of gold catalyst (3–5 nm) was placed at 1 cm from the alumina source.
The quartz tube was pumped down to 80 Pa, and purged with high purity (99.999%) argon. The pump-purge step was cycled three times, and then the tube was pumped down to its limit pressure. The temperature was raised from 25 to 800°C at a rate of 25°C per min. After 5 min at 800°C, an oxygen flow of 0.5 standard cubic centimeters (sccm) was inserted into the tube. After 20 min, 1 sccm of acetylene was added to the process for 10 min, and then the equipment was switched off and cooled down naturally.
Material Characterization
The film grown by CVD was investigated by X-ray diffraction (XRD) using a Philips Xpert Pro working with CuKα radiation at 40 kV. The morphology of the nanostructures was studied by secondary electron microscopy (SEM) with a Hitachi S-4800. Transmission electron microscopy (TEM) was accomplished with a JEM-100CX operated at 90 kV.
Fabrication of the Sensor
Small drops of silver paste were dropped on the nanostructured film in order to get electrical contacts. The resistive sensor is then measured with two micromanipulators in order to measure the resistance of the C-SnO2 nanostructures as the surrounding atmosphere changes.
Gas Sensors Measurements
The resistive gas sensor was measured in a home-built system. The apparatus includes measuring chamber, sensor holder with integrated heater, four micromanipulators, mass flow controllers connected to high purity gas bottles, and Keithley 2410 multimeter connected to a data acquisition system (LabView, National Instruments).
First, the device was kept at 500°C in N2 for 3 h while biased at 1 V in order to improve its base resistance and the stability of the nanostructures. This treatment reduces the drift of the sensor response during the measurements (Tischner et al., 2008). A good linear relation of the I-V curves was found, proving a good ohmic contact between the nanostructures and the silver paste. The device was operated under a continuous voltage of 1 V in the temperature range of 150–270°C. At different times, six different gases (acetone, ammonia, CO, ethanol, hydrogen, and toluene) were inserted into the measuring chamber, adjusting their concentration through mass flow controllers. The concentration values were the same for all the gases: 1, 5, 10, 20, and 50 parts per million (ppm). The total gas flow (target gas + dry air) was kept constant at 400 sccm. Along this paper, the sensor response S is defined as S = Rgas/Rair, where Rgas and Rair are the resistance of the sensor in presence of the target gas or in dry air, respectively. This choice was made because all the target gases were reducing. Selectivity to a target gas A toward any interfering gas B is traditionally defined as the ratio of the sensor response to gas A to the response to gas B (Kalantar-zadeh, 2013). The selectivity of the sensor is defined as the ratio of its best response to its second-best response.
Machine Learning Algorithms
Each measurement set (the five response values at 150, 180, 210, 240, and 270°C) relative to a gas and its concentration, is used as a five-dimensional point, fed to classifiers and then to the support vector regressor that estimates gas concentration. Train and test datasets were composed by 10 and 5 points for each gas, respectively. The classifiers use the label “gas” given together with the measurements in the train set and return a “gas” label for the new measures in the test set, classifying the new points. After the classification, the dataset was split in sub-datasets, each relative to a classified gas, and fed to a support vector regressor with linear kernel using R software. The regressor gave an estimate gas concentration that was compared with the true value in order to calculate its RMS relative error as RMSE = , where N is the number of data in the sub-dataset and Ci and Ei are the gas concentration and gas estimate, respectively.
Results and Discussion
Nanowires Characterization
The morphology of the C-SnO2 nanowires has been investigated through secondary electron microscopy. A typical SEM image of the nanostructures is given in Figure 1a. As can be seen, there are worm-like structures with different size: nanorods with diameters around 150–200 nm and thinner nanowires with diameters down to 20–40 nm. This is different from the case of pure SnO2 nanowires, shown in the inset of Figure 1a, which are similar for the large nanowires (diameters around 150–300 nm), but lack completely the smallest worm-like nanowires. We hypothesize that the different shape of the small nanostructures may derive from the mismatch between the SnO2 crystal lattices due to the presence of carbon. The effect of crystalline defects is more intense for thinner nanowires, which are therefore more tortuous. Figure 1b shows a high-resolution TEM image of two nanowires from the same sample. It can be seen that the nanostructures are smooth and monocrystalline. Two interplanar spacings are visible in Figure 1b: one of 0.24 nm which corresponds to the (020) planes, and one of 0.27, corresponding to the (101) planes of the tin dioxide.
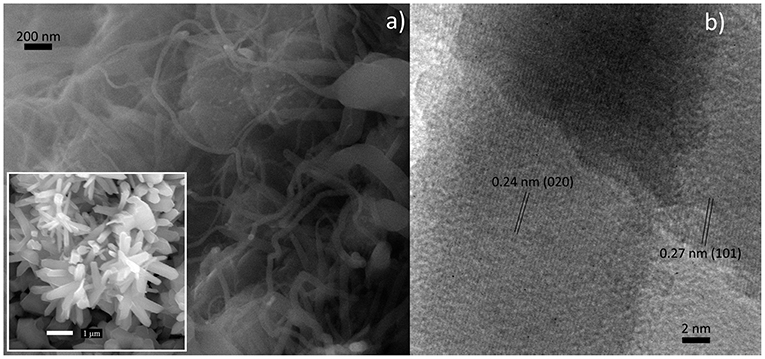
Figure 1. (a) SEM image of the sensor: nanorods and nanowires with different diameters. Inset: The SnO2 nanorods grown without carbon modification. (b) HR-TEM image of two nanowires from the same sample of (a).
The structure of the nanostructures was investigated by XRD, and the results are shown in Figure 2.
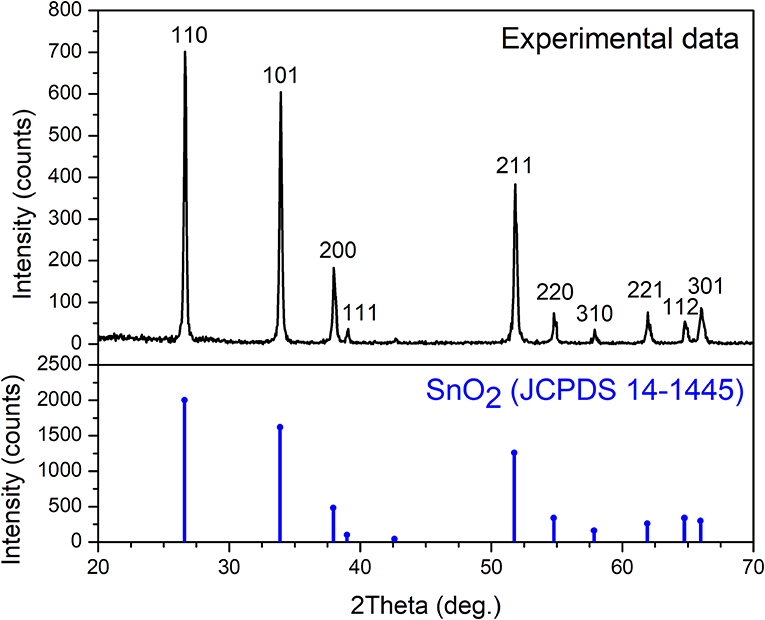
Figure 2. XRD spectra. Top: spectrum of SnO2:C nanowires; Bottom (blue online): reference spectrum of tin oxide (JCPDS 14-1445).
All the diffraction peaks in Figure 2 could be indexed to the tetragonal phase of tin oxide, with lattice parameters of a = b = 4.742 Å and c = 3.186 Å, which is well in agreement with the reference (JCPDS no. 14-1445). No other peaks are present, confirming that the carbon does not crystallize in nanoparticles, nor amasses in amorphous phase.
Unfortunately, TEM and XRD don't show any trace of carbon. Up to now, we can only hypothesize its presence due to the morphology of the nanowires. For this reason, we have performed compositional characterization, and the EDS spectrum is shown in Figure 3.
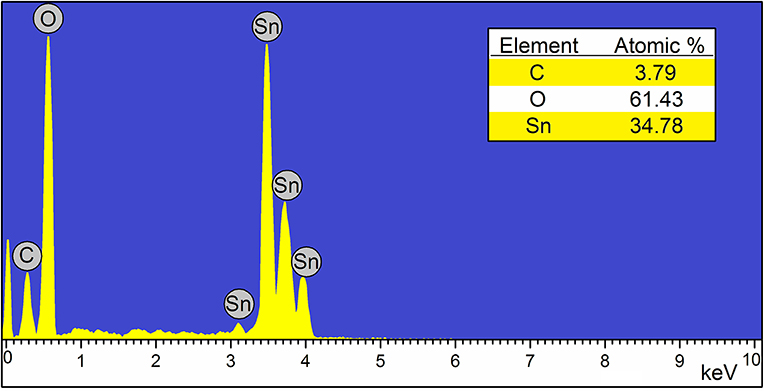
Figure 3. Energy dispersive X-ray spectrometry (EDS) spectrum of the nanomaterial, evidencing the presence of only three elements: tin, oxygen, and carbon.
As can be seen, the presence of carbon is confirmed by energy dispersive X-ray spectrometry. It's percentage is a bit lower than 4%, while the stoichiometry of SnO2 is a bit low in oxygen, probably due to the surface defects.
Response and Traditional Selectivity
Since the basis of our system is a resistive sensor, the first step is obviously to collect a dynamic resistance from it. From this output, the sensor response can be calculated, as defined in section Gas Sensors Measurements. This is a one-dimensional signal, and therefore intrinsically non-selective. All the target gases (acetone, ammonia, carbon monoxide, ethanol, hydrogen, and toluene) were tested at the same concentrations (1, 5, 10, 20, and 50 ppm) in order to facilitate the comparison. The response to various gases has been calculated and compared, showing that the nanosensor is not specific for any gas. The average selectivity of the C-SnO2 sensors (averaged on the different concentrations) is 1.47, 1.30, 1.44, 1.82, and 1.18 at increasing working temperatures. At all the temperatures, the highest responses are found for acetone and ethanol, while the other gases who lower response values. It is obvious that, with the traditional definition, the present sensor is poorly selective, only for two gases. The selectivity as a function of the working temperature is reported in Figure 4. The bar color reflects the gas toward which the device is selective at that temperature (blue is acetone, cyan is ethanol).
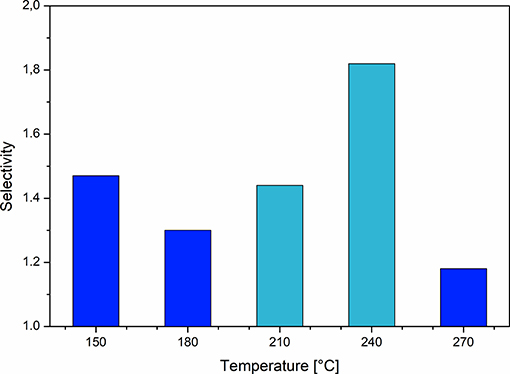
Figure 4. Selectivity as a function of the sensor working temperature. At 150, 180, and 270°C the sensor is selective to acetone, while at 210 and 240°C it is selective to ethanol.
Exploiting different working temperatures, we could get a sensor that is selective to two different gases (Tonezzer et al., 2016), but here the selectivity is too low and does not provide a real discrimination among test gases. Therefore, we use machine learning techniques in order to give the system a way to distinguish the gases by itself.
From Dynamic Resistance to Thermal Response: the Basis for the System Working
The smart sensor working method is summarized in Figure 5 using acetone as an example. The first step is the dynamic resistance of the C-SnO2 nanowires, measured at the various temperatures. As can be seen in the upper plots, the device resistance decreases abruptly when acetone is injected into the system and returns to the initial value when the gas is replaced with air.
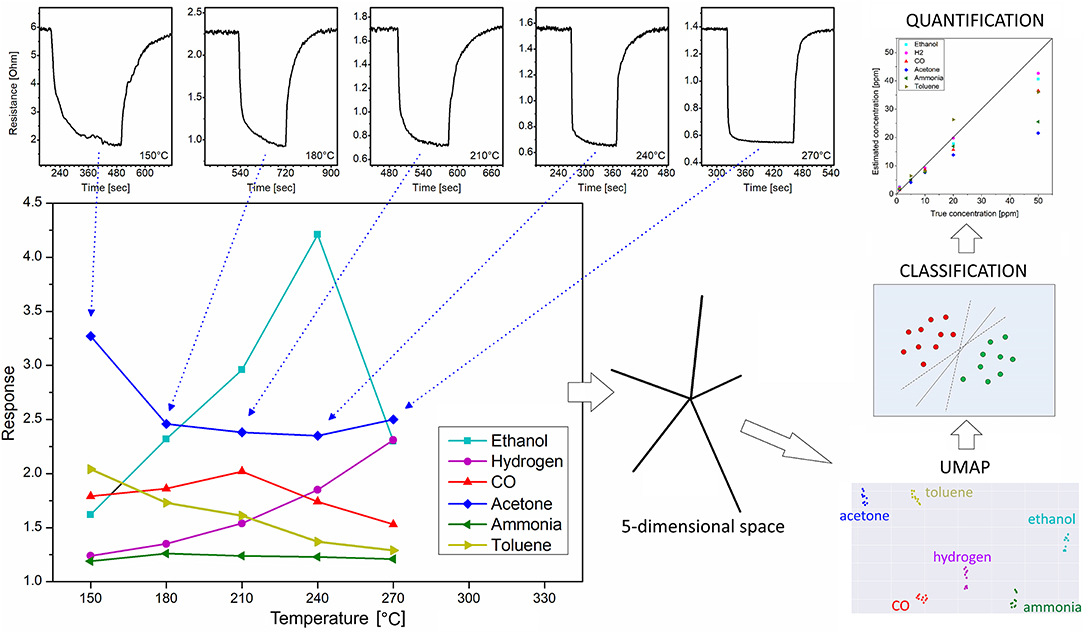
Figure 5. Procedure to obtain the smart sensing: the dynamic response at the five temperatures is used to obtain a segmented line (the blue segmented line in the bottom-left plot of this example); this segmented line is used as a 5D point for both visualization (UMAP) and classification and regression (SVM).
This means that the carbon addition does not change the conduction behavior of SnO2 materials, which is an n-type semiconductor, very sensitive to its surroundings (Tsuda et al., 2000). When the sensor is taken out of the furnace and exposed to air, oxygen is adsorbed on its surface in the form of O− and O2−, draining electrons from the nanowires and decreasing the conductivity. This is its basic state. When the molecules of a reducing gas like acetone, are flowed onto the sensor's nanomaterial, they react with the adsorbed oxygen on the surface, releasing electrons back to the nanowires. This increases the electrons density and decreases the sensor resistance.
As the acetone example in the top part of Figure 5 shows, both response and recovery arise very sharply and then reduce their slope while the system reaches its saturation. When the acetone injection ends and is replaced by air again, the resistance recuperates its original value with negligible drift. This behavior is valid for all tested gases.
The sensor responses calculated from the transient resistance at each temperature, are plotted as a function of the working temperature, as show in the bottom-left part of Figure 5. As can be seen in that plot, the segmented line relative to each gas is different. We should stress that the segmented lines move upwards with increasing gas concentration, but always maintaining their shape. The five values forming each segmented line are then used as a five-dimensional point, which is used by the classifiers and by support vector regressor in order to discriminate which gas is present, and its concentration.
Visual Classification With UMAP
A first step, using the 5D points just obtained, is the classification of each measurement, in order to understand to which target gas it belongs. Machine learning models can be divided into tree-based models, linear models, neural networks, non-parametric models and ensembles. Models in the same category tend to perform similarly for the same task. The choice of a model still is heavily based on trial and error, and, for that reason, models of each of those classes were chosen. When working in classification tasks it is important to select a features space that represents the data, which were accomplished by the sensor data, which is high dimensional. To better inspect the algorithm and to use only relevant features it is common to introduce a dimensionality reduction technique and project the data onto a plane (the screen or the paper). In our case, we shrink the 5D space down to 2D using Uniform Manifold Approximation and Projection for dimension reduction (UMAP) (McInnes et al., 2018). Dimension reduction is indeed important because it allows both visualizing and pre-processing data for machine learning. UMAP is a very novel and powerful technique, very quick and strong. It finds a projection that closely approximates the conditions of the original space, trying to preserve the global and local structures and to keep interpretability of data. The UMAP projection can be seen in Figure 6.
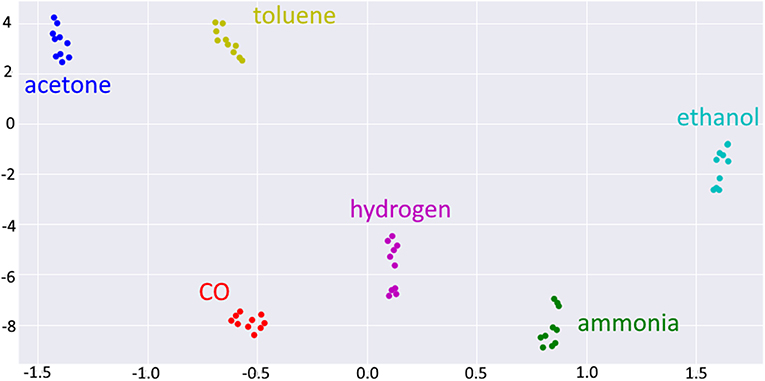
Figure 6. Two-dimensional projection obtained with UMAP from the original 5D raw data points. Colors represent gases: Acetone (blue), Ammonia (green), CO (red), Ethanol (cyan), Hydrogen (purple), and Toluene (yellow).
It is clear from Figure 6 that the points belonging to different gases are well-separated and distinguishable. Unfortunately, this is not enough: dimension-reduction techniques only allow better visualization, but are not classification techniques. In other words, the eyes and the brain of the reader allow him to classify the different gases in Figure 6, but the sensor still doesn't know anything. For this reason, we have implemented several classification methods in order to test the classification performance of our system.
Classification With Different Methods
After the UMAP reduction, in order to better evaluate the performance our system, we have used seven different methods to classify the response data: Random Forest, SVM, Ada Boost, Bagging (KNN), Extra Trees, Decision Trees, and MLP (see Supplementary Material). We must here underline that, in order to avoid overfitting (due to the small number of data), the Stratified K-fold method was used to validate the data. This method consists of splitting the data into k random splits while keeping each class in the split proportional to its true proportion in the whole dataset. The model is trained with k−1 splits and validated on the missing split. The process is repeated k times until all data are used for validation.
To train an ensemble of classifiers there are two methods that stand out, the process of bagging and boosting. Bagging consists of training each classifier with a random sample from the data, and train each model independently. Boosting consists in training the models sequentially. Each model is trained to try to minimize the errors from the previous models and it does so by training the following model with a sample of the data that has a greater percentage of the class that was misclassified by the previous models.
Support vector machines (SVM) are supervised learning models that work by drawing a hyperplane in the features space of the data to maximize the separation of classes. Support vector machines are very popular when dealing with small datasets and should be one of the first models to be considered when dealing with linearly separable data (Haykin, 2009).
Multilayer perceptrons (MLP) are neural networks composed by an input layer followed by sequential hidden layers before the output layer. MLPs are universal function approximators dealing very well with non-linear data and have been very promising in the deep learning community (Haykin, 2009).
Decision Trees build a binary decision tree where each node tests a feature splitting the data into two paths. A classification is made by a path from the root node to the leaf node. Tree-based models had a lot of popularity before the advent of deep learning and still one of the best performant models in machine learning competitions. The models Random Forest, AdaBoost, and Extra trees are ensembles derived from the Decision Tree and were also tested as those variants are more widely used and avoid overfitting to the data (Sheppard, 2017).
Random forests work by creating several decision trees each of which are trained with a random subset of the data by the boosting algorithm. The classification is done by taking the mode of the classes produced by each tree. The AdaBoost works similarly to the random forest but it restricts the decision trees by only allowing shallow trees and trains the model by the boosting algorithm. Extra trees are also similar to the random forest but, when training a random forest the trees try to find for each node the best possible split for the binary tree. Extra trees pick a value a random and use it to build the split, this leads to more diversified trees (Sheppard, 2017).
The K-nearest neighbors algorithm (KNN) is a type of non-parametric model which classifies the data by looking at the k closest points on the feature space and classifying it according to the mode of their classes. KNN is a very common algorithm, especially when dealing with small datasets (Duda et al., 2003).
All methods used were set with the default parameters from the library sklearn (Pedregosa et al., 2011). Table 1 shows the main parameters used in each method.
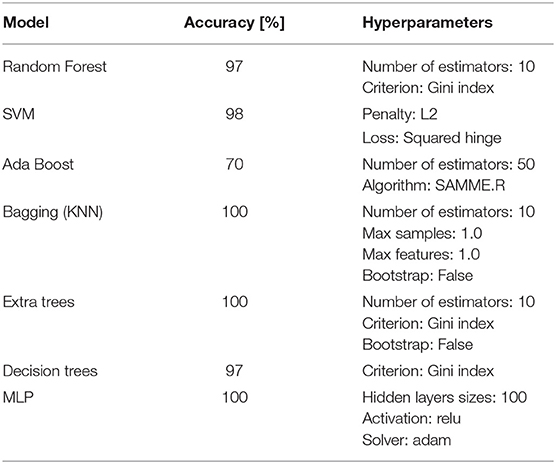
Table 1. Models used to classify response data, their accuracy, and hyperparameters.
The performance of the seven methods is evaluated through their accuracy, reported in Table 1.
As can be seen from Table 1, all the methods (but Ada Boost) behave well on the response data, giving an accuracy from 97 to 100%. This means that the sensor based on SnO2:C nanomaterial gives very good raw output, suitable to distinguish different gases. A wise choice of the classification method allows us to rely on a perfect classification.
Quantitative Prediction
As can Figure 5 shows, the points related to the various gases are in well-separated and distinct clouds. This is just a first step because a gas sensor is expected to evaluate also the concentration of that gas, even at low concentrations like in our case (few parts per million). For this reason, we used a least squares support vector machine (Shao et al., 2018) in order to estimate each gas concentration. To do this, we have split the data sets into smaller sets, one for each gas (we can do this because the classification was perfect). Each train sub-dataset was used to train the regressor, while the test sub-dataset was used to check the performance of our sensor toward that specific gas. The sensor estimates are then compared to the real concentration for that measurement. The average percentage error is calculated on each sub-dataset in order to evaluate the performance of the system for that target gas. These values are given in Table 2.
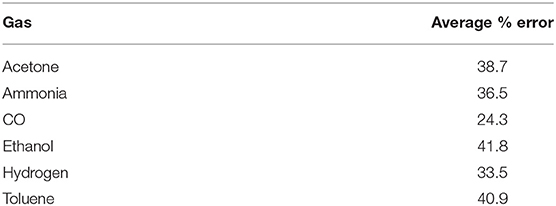
Table 2. Average percentage error of the nanosensor to different gases.
The average percentage errors shown in Table 2 are quite homogeneous, with CO having the lowest value. Even if these values look high, we must underline that being percentage errors, they estimate the order of magnitude of the concentration very well. We must also highlight that the measured concentrations are quite low (1 ppm at minimum), well-below the exposure limits. Therefore, this error combined with the perfect classification obtained in the previous step is more than adequate to warn users of a possible danger due to the presence of gas. In order to better understand the source of the error, we analyzed the error as a function of the actual gas concentration, as shown in Figure 7.
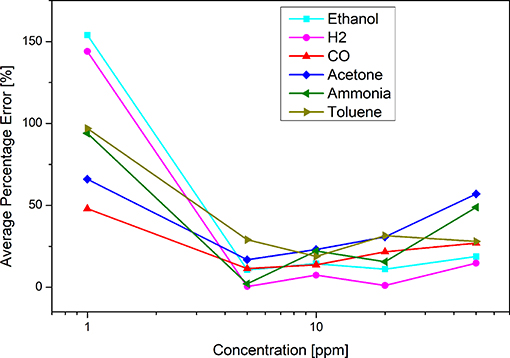
Figure 7. Percentage error as a function of the gas concentration. It is clear that all gases follow a similar trend, with higher error at the extremities of the concentration range.
Since Figure 7 shows a percentage error, one could expect a more or less constant value, but this is not the case. As can be seen, the error is minimal within the range, and greater at the ends. This effect is probably because the system has been trained on the 1–50 ppm range, and therefore loses accuracy toward the ends of this range. Furthermore, we can see that the error is not symmetrical, but is higher at lower concentrations. We must consider that 1 ppm is a rather low concentration, close to the limit of detection of the sensor itself, and this certainly negatively influences its error.
We want to point out that this is a transversal method that works regardless of the measured gases, and therefore can be applied in many different contexts.
Conclusions
Carbon modified SnO2 nanowires were used as active material for a resistive gas sensor. Measuring the response at 5 different working temperatures (150–270°C) and using machine learning techniques, the system was able to distinguish all the tested gases (acetone, ammonia, carbon monoxide, ethanol, hydrogen, and toluene) with a perfect classification (100%). The nanosensor is also able to estimate the gas concentration with a good average error (24–41%, depending on the gas) at low concentrations (1–50 ppm), proving to be useful to detect dangerous concentrations of different gases.
Data Availability Statement
The datasets generated for this study are available on request to the corresponding author.
Author Contributions
All authors listed have made a substantial, direct and intellectual contribution to the work, and approved it for publication.
Conflict of Interest
The authors declare that the research was conducted in the absence of any commercial or financial relationships that could be construed as a potential conflict of interest.
Supplementary Material
The Supplementary Material for this article can be found online at: https://www.frontiersin.org/articles/10.3389/fmats.2019.00277/full#supplementary-material
References
Chen, Z., Zheng, Y., Chen, K., Li, H., and Jian, J. (2017). Concentration estimator of mixed VOC gases using sensor array with neural networks and decision tree learning. IEEE Sensors J. 17, 1884–1892. doi: 10.1109/JSEN.2017.2653400
Cho, J., Li, X., Gu, Z., and Kurup, P. U. (2012). Recognition of explosive precursor using nanowire sensor array and decision tree learning. IEEE Sensors J. 12, 2384–2391. doi: 10.1109/JSEN.2011.2182042
Cho, J. H., Kim, Y. W., Na, K. J., and Jeon, G. J. (2008). Wireless electronic nose system for real-time quantitative analysis of gas mixtures using micro-gas sensor array and neuro-fuzzy network. Sensor Actuat. B-Chem. 134, 104–111. doi: 10.1016/j.snb.2008.04.019
Duda, R. O., Hart, P. E., and Stork, D. G. (2003). Pattern Classification, 2nd Edn. New York, NY: John Wiley and Sons, Inc.
Gulbag, A., and Temurtas, F. (2006). A study on quantitative classification of binary gas mixture using neural networks and adaptive neuro-fuzzy inference systems. Sensor Actuat. B-Chem. 115, 252–262. doi: 10.1016/j.snb.2005.09.009
Haykin, S. O. (2009). Neural Networks and Learning Machines, 3rd Edn. Upper Saddle River, NJ: Pearson Education.
Hines, E. L., Llobet, E., and Gardner, J. W. (1999). Electronic noses: a review of signal processing techniques. IEE Proc. Circ. Devices Sust. 146, 297–310. doi: 10.1049/ip-cds:19990670
Iftekhar Uddin, A. S. M., Phan, D.-T., and Chung, G.-S. (2015). Low temperature acetylene gas sensor based on Ag nanoparticles-loaded ZnO-reduced graphene oxide hybrid. Sensor Actuat. B-Chem. 207, 362–369. doi: 10.1016/j.snb.2014.10.091
Jiang, S., Wang, J., Wang, Y., and Cheng, S. (2017). A novel framework for analyzing MOS E-nose data based on voting theory: application to evaluate the internal quality of Chinese pecans. Sensor Actuat. B-Chem. 242, 511–521. doi: 10.1016/j.snb.2016.11.074
Jiang, X.-Q., Mei, X.-D., and Feng, D. (2016). Air pollution and chronic airway diseases: what should people know and do? J. Thorac. Dis. 8, E31–E40. doi: 10.3978/j.issn.2072-1439.2015.11.50
Kalantar-zadeh, K. (2013). Sensors: An Introductory Course. New York, NY: Springer Science+Business Media.
Kim, H.-R., Haensch, A., Kim, I.-D., Barsan, N., Weimar, U., and Lee, J.-H. (2011). The role of NiO doping in reducing the impact of humidity on the performance of SnO2-based gas sensors: synthesis strategies, and phenomenological and spectroscopic studies. Adv. Funct. Mater. 21, 4456–4463. doi: 10.1002/adfm.201101154
Konstantynovski, K., Njio, G., Börner, F., Lepcha, A., Fischer, T., Holl, G., et al. (2018). Bulk detection of explosives and development of customized metal oxide semiconductor gas sensors for the identification of energetic materials. Sensor Actuat. B-Chem. 258, 1252–1266. doi: 10.1016/j.snb.2017.11.116
Koo, W.-T., Jang, J.-S., Choi, S.-J., Cho, H.-J., and Kim, I.-D. (2017). Metal-organic framework template catalysts: dual sensitization of PdO-ZnO composite on hollow SnO2 nanotubes for selective acetone sensors. ACS Appl. Mater. Interfaces 9, 18069–18077. doi: 10.1021/acsami.7b04657
Lee, D.-K., Lee, D.-D., Ban, S.-W., Lee, M., and Kim, Y. T. (2002). SnO2 gas sensing array for combustible and explosive gas leakage recognition. IEEE Sensors J. 2, 140–149. doi: 10.1109/JSEN.2002.800685
Marco, S., and Gutiérrez-Galvez, A. (2012). Signal and data processing for machine olfaction and chemical sensing: a review. IEEE Sensors J. 12, 3189–3214. doi: 10.1109/JSEN.2012.2192920
McInnes, L., Healy, J., and Melville, J. (2018). UMAP: uniform manifold approximation and projection for dimension reduction. ArXiv e-prints 1802.03426. doi: 10.21105/joss.00861
Miller, D. R., Akbar, S. A., and Morris, P. A. (2014). Nanoscale metal oxide-based heterojunctions for gas sensing: a review. Sensor Actuat. B-Chem. 204, 250–272. doi: 10.1016/j.snb.2014.07.074
Mo, Z., Fu, Q., Zhang, L., Lyu, D., Mao, G., Wu, L., et al. (2018). Acute effects of air pollution on respiratory disease mortalities and outpatients in Southeastern China. Sci. Rep. 8:3461. doi: 10.1038/s41598-018-19939-1
Moon, H. G., Jung, Y., Han, S. D., Shim, Y.-S., Jung, W.-S., Lee, T., et al. (2018). All villi-like metal oxide nanostructures-based chemiresistive electronic nose for an exhaled breath analyzer. Sensor Actuat. B-Chem. 257, 295–302. doi: 10.1016/j.snb.2017.10.153
Pedregosa, F., Varoquaux, G., Gramfort, A., Michel, V., Thirion, A., Grisel, O., et al. (2011). Scikit-learn: machine learning in python. arXiv:1201.0490.
Sabir, S., Arshad, M., and Chaudhari, S. K. (2014). Zinc oxide nanoparticles for revolutionizing agriculture: synthesis and applications. Sci. World J. 2014:925494. doi: 10.1155/2014/925494
Saidi, T., Palmowski, D., Babicz-Kiewlicz, S., Welearegay, T. G., Bari, N. E., Ionescu, R., et al. (2018). Exhaled breath gas sensing using pristine and functionalized WO3 nanowire sensors enhanced by UV-light irradiation. Sensor Actuat. B-Chem. 273, 1719–1729. doi: 10.1016/j.snb.2018.07.098
Shao, Y.-H., Li, C.-N., Liu, M.-Z., Wang, S., and Deng, N.-Y. (2018). Sparse Lq-norm least squares support vector machine with feature selection. Pattern Recogn. 78, 167–181. doi: 10.1016/j.patcog.2018.01.016
Sheppard, C. (2017). Tree-Based Machine Learning Algorithms: Decision Trees, Random Forests, and Boosting. CreateSpace Independent Publishing Platform.
Tai, H., Xie, G., and Jiang, Y. (2004). “An artificial olfactory system based on gas sensor array and back-propagation neural network” in Advances in Neural Networs, eds F. L. Yin, J. Wang, and C. Guo (Berlin: Springer, 892–897.
Tischner, A., Maier, T., Stepper, C., and Köck, A. (2008). Ultrathin SnO2 gas sensors fabricated by spray pyrolysis for the detection of humidity and carbon monoxide. Sensor Actuat. B-Chem. 134, 796–802. doi: 10.1016/j.snb.2008.06.032
Tonezzer, M. (2019). Selective gas sensor based on one single SnO2 nanowire. Sensor Actuat. B-Chem. 288, 53–59. doi: 10.1016/j.snb.2019.02.096
Tonezzer, M., and Iannotta, S. (2014). H2 sensing properties of two-dimensional zinc oxide nanostructures. Talanta 122, 201–208. doi: 10.1016/j.talanta.2014.01.051
Tonezzer, M., Kim, J.-H., Lee, J.-H., Iannotta, S., and Kim, S. S. (2019). Predictive gas sensor based on thermal fingerprints from Pt-SnO2 nanowires. Sensor Actuat. B-Chem. 281, 670–678. doi: 10.1016/j.snb.2018.10.102
Tonezzer, M., Le, D. T. T., Huy, T. Q., and Iannotta, S. (2016). Dual-selective hydrogen and ethanol sensor for steam reforming systems. Sensor Actuat. B-Chem. 236, 1011–1019. doi: 10.1016/j.snb.2016.04.150
Tonezzer, M., Le, D. T. T., Iannotta, S., and Hieu, N. V. (2018). Selective discrimination of hazardous gases using one single metal oxide resistive sensor. Sensor Actuat. B-Chem. 277, 121–128. doi: 10.1016/j.snb.2018.08.103
Tsuda, N., Nasu, K., Fujimori, A., and Siratori, K. (2000). Electronic Conduction in Oxides, 2nd Edn. Berlin: Springer-Verlag.
Wang, L., Fu, H., Jin, Q., Jin, H., Haick, H., Wang, S., et al. (2019). Directly transforming SnS2 nanosheets to hierarchical SnO2 nanotubes: Towards sensitive and selective sensing of acetone at relatively low operating temperatures. Sensor Actuat. B-Chem. 292, 148–155. doi: 10.1016/j.snb.2019.04.127
Wolfrum, E. J., Meglen, R. M., Peterson, D., and Sluiter, J. (2006). Metal oxide sensor array for the detection, differentiation, and quantification of volatile organic compounds at sub-parts-per-million concentration levels. Sensor Actuat. B-Chem. 115, 322–329. doi: 10.1016/j.snb.2005.09.026
Zhang, B., and Gao, P.-X. (2019). Metal oxide nanoarrays for chemical sensing: a review of fabrication methods, sensing modes, and their inter-correlations. Front. Mater. 60:55. doi: 10.3389/fmats.2019.00055
Zhao, L., Li, X., Wang, J., Yao, P., and Akbar, S. A. (2016). Detection of formaldehyde in mixed VOCs gases using sensor array with neural networks. IEEE Sensors J. 15, 6081–6086. doi: 10.1109/JSEN.2016.2574460
Keywords: metal oxide, tin oxide, carbon, hybrid material, gas sensor, selectivity
Citation: Tonezzer M, Izidoro SC, Moraes JPA and Dang LTT (2019) Improved Gas Selectivity Based on Carbon Modified SnO2 Nanowires. Front. Mater. 6:277. doi: 10.3389/fmats.2019.00277
Received: 20 May 2019; Accepted: 21 October 2019;
Published: 07 November 2019.
Edited by:
Xiaogan Li, Dalian University of Technology (DUT), ChinaReviewed by:
Yangong Zheng, Ningbo University, ChinaHaiying Du, Dalian Nationalities University, China
Han Jin, Ningbo University, China
Copyright © 2019 Tonezzer, Izidoro, Moraes and Dang. This is an open-access article distributed under the terms of the Creative Commons Attribution License (CC BY). The use, distribution or reproduction in other forums is permitted, provided the original author(s) and the copyright owner(s) are credited and that the original publication in this journal is cited, in accordance with accepted academic practice. No use, distribution or reproduction is permitted which does not comply with these terms.
*Correspondence: Matteo Tonezzer, bWF0dGVvLnRvbmV6emVyQGNuci5pdA==