 M. E. Ali Mohsin
 Nilesh K. Shrivastava1
 Agus Arsad
 Azman Hassan
- 1Enhanced Polymer Research Group, School of Chemical and Energy Engineering, Universiti Teknologi Malaysia, Skudai, Malaysia
- 2Department of Chemistry, Faculty of Science, UTM Johor Bahru, Johor Bahru, Malaysia
- 3UTM-MPRC Institute for Oil & Gas (IFOG), Faculty of Engineering, Universiti Teknologi Malaysia, Skudai, Malaysia
This study is part of ongoing research on the preparation of electrically conductive and physically stable Polyaniline/Sago starch (PANI/Sago) blend films using a simple one-pot synthesis method. The synthesis of PANI in the presence of Sago to prepare the PANI/Sago blend was done via in situ polymerization using ultrasound irradiation. For in situ polymerization of PANI/Sago blends, ammonium persulfate (APS) was used as an oxidant while hydrochloric acid (HCl) acted as a dopant. The effect of sonication time (0.5–5 h) on the structural properties (1H NMR and FT-IR), electrical conductivity (E.C), optical properties (UV-VIS), and the morphological (FE-SEM) and thermal stability (TGA) of the prepared PANI/Sago blends was studied. 1H NMR and FT-IR results revealed that the polymerization of PANI/Sago for more than 2 h leads to the disintegration/deformation of Sago starch due to excessive kinetic energy generated via the continuous collapsing of cavitation bubbles. In addition to the findings about Sago starch, FT-IR analysis also revealed the dominance of PANI property for the blend sonicated for 2 h as it contains a sharp and intense PANI peak at 1,500 cm−1, which represents the stretching vibration of benzenoid ring. 1H NMR and FT-IR results were found to be in compliance with E.C results, which showed the E.C of the blend sonicated for 2 h was highest. The UV-Vis results in combination with energy band values, thereby supporting the E.C results. The morphology of the prepared blends was found to be highly connected, which helps with good inter- and intra-chain electron transfers within the blends. The variation in sonication time seems to have very little impact on the thermal stability of the blends, as it was found that all blends were thermally stable up to 200°C, and only minor variation was observed beyond that.
Introduction
Among intrinsically conducting polymers (ICP's), polyaniline (PANI) is the most promising due to its electrical, chemical, and environmental stability and optical properties (Razak et al., 2013; Gulrez et al., 2014; Dallas and Georgakilas, 2015; Lv et al., 2015). PANI has grabbed significant attention because of its ability to be doped. Doping is a process through which electrical conductivity can be altered by using protonic acids or by oxidant/reductant factors (Lukasiewicz et al., 2014). However, poor plasticity and low solubility in solvents are the two main limiting factors for PANI's expansion as a commercial polymer (Ali et al., 2007; Razak et al., 2013; Lukasiewicz et al., 2014; Lv et al., 2015). To overcome these limitations, researchers have proposed mixing PANI (as a conductive disperse phase) with non-conductive polymers (as a matrix) and preparing blends or composites (Ali et al., 2007; Razak et al., 2013; Gulrez et al., 2014; Lukasiewicz et al., 2014; Lv et al., 2015). Such blends/composites will ease the processability of PANI and at the same time impart physical properties of the insulating host.
Considering the concerns regarding depletion of oil reserves and the effect of synthetic polymers on climate change, it is best to use biodegradable and bio-based materials for the preparation of PANI blend. Usage of biopolymer in this field is not a new concept as earlier researchers have been known to use cellulose (Ebrahim et al., 2007; Cerqueira et al., 2009; John et al., 2010), chitosan (Ramaprasad et al., 2009; Yavuz et al., 2009; Marcasuzaa et al., 2010), gums (Tiwari, 2007; Tiwari and Singh, 2008), and starch (Saikia et al., 2010; Janaki et al., 2012). Among various biopolymers mentioned, starch has attracted our attention because of its ease of availability and the fact that it is highly economical. There are many varieties of starch available. The one which is relevant to our interest is native Sago starch obtained from palm trees as it is abundantly available in east Asia but it is also the least explored one. Preparation of PANI/Sago blends can be done using oxidative polymerization. Earlier researchers have reported oxidative polymerization to be the most efficient method for the preparation of PANI/maize (Janaki et al., 2012), PANI/taro (Saikia et al., 2010), PANI/starch/hydrocolloid (Lukasiewicz et al., 2014), and PANI-nano-Au/starch composites (Sarma and Chattopadhyay, 2004). However, preparation of PANI/starch blends or composites is not easy, as obtaining homogeneous dispersion of starch is limited by its tendency to aggregate, regardless of the origin of the starch (Kim et al., 2013). To overcome these limitations, many techniques were proposed; of these, the use of ultrasonic irradiation (U.I), a technique which was proposed by Tischer et al., and Grieser et al., is the best so far (Grieser et al., 1999; Tischer et al., 2010). Ultrasound involves the transfer of kinetic energy (10–100 kJ/mol) to the starch solution through a process called cavitation. Cavitation refers to the formation of bubbles that keep growing before collapsing violently in the starch solution, resulting in the polydispersity of aggregates. The ultrasonic irradiation technique is best suited because, apart from the effective dispersion of starch, the synthesis of PANI using U.I was found to be very efficient as well (Xia and Wang, 2002; Lu et al., 2006; Manuel et al., 2014). Therefore, this study involves the oxidative polymerization of PANI/Sago blends using ultrasonic irradiation technique.
The electrical conductivity of PANI and its blends can be altered by twisting a few dominant parameters, including dopant acid concentration, oxidant/monomer ratio, aniline content, reaction temperature, and reaction time. Literature is available on the effect of dopant content and concentration (Pron et al., 1988; Cao et al., 1989; Sapurina and Stejskal, 2008), the effect of oxidant to monomer ratio (Jelmy et al., 2013), the effect of aniline content (Bhadra et al., 2017), and the effect of temperature (Manuel et al., 2014). However, there is a lack of literature explaining the effect of reaction time on the preparation of PANI blends/composites and particularly on the in-situ polymerization of PANI/Starch using a sonication technique. Also, it is important to note that earlier studies related to the polymerization of PANI have reported different reaction times in the range of 1–4 h as optimum (Pron et al., 1988; Cao et al., 1989; Xia and Wang, 2002; Lu et al., 2006; Manuel et al., 2014). Therefore, it is important to study the effect of sonication time and find the optimum sonication time for in-situ polymerization of PANI/Sago blends using the ultrasonic irradiation technique. In doing so, this study also proposes a novel one-pot synthesis method for the polymerization of PANI in the presence of Sago starch, which will be addressed as a PANI/Sago blend throughout this paper, using ultrasonic irradiation. To the best of our knowledge, this is the first report on the effect of sonication time on the polymerization of PANI/Sago blends using the technique reported in this paper. Thus, this work will help to increase the understanding of the subject. The characterization of polymerized PANI/Sago blends was done using Fourier-transform infrared spectroscopy (FT-IR), proton nuclear magnetic resonance (1H NMR), Ultraviolet-visible spectroscopy (UV-Vis), and scanning electron microscope (SEM). The thermal stability was analyzed using Thermogravimetric analysis (TGA), and electrical conductivity was found using a four point probe.
Materials and Methods
Materials
Aniline and ammonium persulfate (APS) were obtained from Sigma Aldrich, Sago starch was supplied by Craun Research Sdn. Bhd. (Sarawak, Malaysia), and hydrochloric acid (HCl 1 M) was procured from Tolsa.
Methodology
The PANI/Sago films were obtained by initially soaking Sago granules in deionized (DI) water overnight; they were then gelatinized by simple mixing at 90°C for 15 min. The synthesis began by activating pre-cooled Sago dispersion with HCl for a certain period of time before this a measured amount of aniline was added to the sonicator. Ultrasonic irradiation was carried out with the probe of the ultrasonic horn immersed directly into the mixture. During the reaction, the temperature of the ice bath was maintained at 0–3°C, to avoid any secondary reactions. The frequency wave generated from the sonicator was kept constant at 10 kHz, with an On/OFF time of 1 s. To this, freshly prepared oxidant (APS) was added dropwise at 30 ml/h (Jelmy et al., 2013). The oxidant/monomer and oxidant/dopant feed mole ratio were chosen as 1, based on literature (Cao et al., 1989; Jelmy et al., 2013). Monomer: Sago ratio was 1:1 and concentration of dopant acid (HCl) was 1 M (Pron et al., 1988; Cao et al., 1989; Sapurina and Stejskal, 2008; Jelmy et al., 2013). The reaction mixture was continuously sonicated for varying time periods, i.e., 0.5, 1, 2, 3, and 5 h. After sonication, the obtained dark green color solution was left undisturbed for 24 h for the completion of polymerization. The final solution with uniform dispersion was then deposited as a film on a flat glass support and dried at 60°C in an oven for 48 h. The dried film was removed and washed with DI water a couple of times before characterization. A complete list of samples prepared and parameters followed is shown in Table 1.
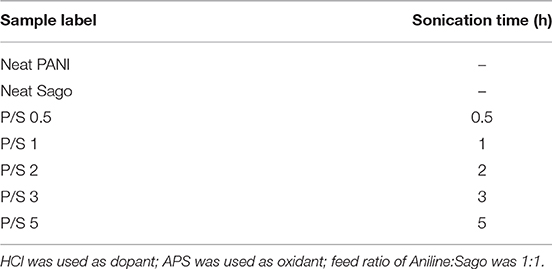
Table 1. List of PANI/Sago blends prepared.
Characterization
The electrical conductivity of the prepared films was measured using a four-point probe Jandel meter (Model RM3000). Each measurement involved three different samples to ensure the repeatability and reproducibility of the results. FTIR spectra in the wavelength range of 4,000–400 cm−1 were recorded using Nicolet 170SX. 1H NMR was obtained on a Bruker 400 spectrometer using deuterated dimethyl sulfoxide-d6 (DMSO) as a solvent. Viscosity measurements were done using Brookfield RVDVIII+ (Spindle: 52) at 26.5°C. A morphological analysis of the blends was done using a Hitachi SU8020 field emission scanning electron microscopy (FE-SEM) at an accelerating voltage of 5 kV. To avoid electrical charging, the blends were coated with a thin layer of gold (~5 nm). By using Perkin Elmer Pyris-7, the thermal stability of the blends was analyzed. The samples were heated from 40 to 900°C at a heating rate of 20°C/min in nitrogen atmosphere (20 ml/min). The UV-Vis analysis was performed using Lambda 1050 UV-VIS spectrophotometer and the energy band gap was calculated using Tauc's relation (Gupta et al., 2010):
where α is the absorption coefficient, Eg is the optical band gap, and hν is the energy of the incident photon. The index n has discrete values such as 1/2, 3/2, 2 or higher depending on whether the transition is direct or indirect and allowed or forbidden. In the direct and allowed cases, the index n is 1/2, whereas for the direct but forbidden cases it is 3/2. For the indirect and allowed cases, n = 2, and for the forbidden cases it is 3 or higher (Reda and Al-Ghannam, 2012).
Results and Discussion
Mechanism for PANI/Sago Blends
A starch molecule with primarily linear chains that is made up of (1–4) α-linkages is called amylose (AM) and starch that is highly branched with (1–6) α-linkages is called amylopectin (AP). To produce a starch film, starch granules should be heated in water first. Upon heating, the starch granules undergo a transition known as gelatinization. During the gelatinization process, the transition of starch granules takes place in a certain order: the adsorption of water by the granules, the swelling of the granules, and the disruption of hydrogen bonding by water molecules takes place upon reaching the critical temperature (Iida et al., 2008). This results in melting of crystallites and leaching of amylose from granules and increasing the viscosity of the obtained gelatinized starch (Cheng et al., 2010). However, the non-solubilized portion of the gelatinized starch termed as “robust ghost” remains intact during this process (Seguchi et al., 1994). At this stage, HCl and aniline were added to the sonicator, which contains Sago, and this was left for sonication for few minutes in order to activate the Sago. After a few minutes, APS as an oxidant was added dropwise over a certain period of time at a rate of 30 ml/h. When subjected to one-pot synthesis using HCl as a dopant in a sonicator, acid hydrolysis and physical/mechanical treatment (sonication) takes place simultaneously. As soon as HCl is added to the sonicator containing gelatinized starch, the hydrolysis of amorphous regions is initiated, as they are more susceptible to acid attack due to the loose packing of starch chains compared to the crystalline regions; this is termed fast hydrolysis (Wang and Copeland, 2015). Following that, the second step of acid hydrolysis takes place, wherein both amorphous and crystalline regions are attacked, and this hydrolysis step is influenced by amylopectin content, the distribution of α-(1–6) branches between the amorphous and crystalline lamellae, and the degree of packing of the double helices within the crystallites. At the same time, sonication helps in breakage the cross-link between amylose/amylopectin, which results in the disintegration of robust ghosts. The cross-link between amylose/amylopectin, which was already weak because of acid hydrolysis, gets detached easily due to the collapse of violent cavitation bubbles generated by sonication (Mason and Lorimer, 1988). The collapse of cavitation bubbles also expedites the oxidative polymerization of aniline to polyaniline process.
The disintegrated robust ghosts result in the detachment of amylose and amylopectin. Therefore, glycosidic polysaccharide bonds (amylose) get detached and react with hydrogen radicals generated in the acidic medium of the aniline/HCl polymerization using APS ((NH4)2S2O8) to form PANI/Sago polysaccharides. These polysaccharides might be converted to glycosides (amylopectin), resulting in structural modification (Zia-ud-Din et al., 2017). During these structural modifications, the protonated PANI attaches to the modified linear starch structure and forms a strong hydrogen bond, as shown in Scheme 1 (Shabana et al., 2019).
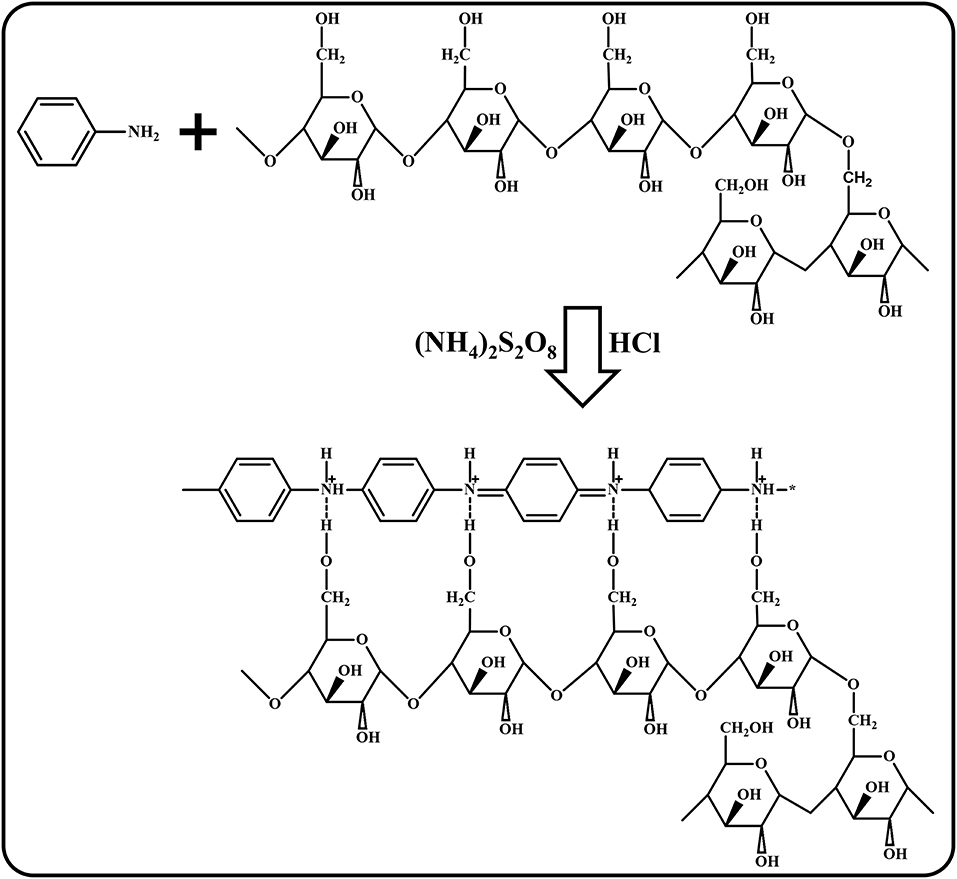
Scheme 1. Polymerization mechanism of PANI/Sago (modified accordingly and redrawn from Shabana et al., 2019).
Fourier Transform Infrared (FT-IR)
The molecular structure of PANI, Sago, and PANI/Sago blends was analyzed using FT-IR spectroscopy and their assignments are tabulated in Table 2. The characteristic peaks of PANI occurred around 1,578, 1,490, 1,300, 1,140, and 800 cm−1 and correspond to the quinoid ring stretch, benzenoid ring stretch, N-H bend, asymmetric C-N stretch, -NH+ = stretch, and aromatic C-H ring bend, as shown in Figure 1 (Furukawa et al., 1988; Tang et al., 1988; Ping, 1996; Kang et al., 1998). The peak around 800 cm−1 is the characteristic of the para-substituted aromatic ring through which the polymerization is expected to progress. The peak around 3,250–3,100 cm−1 is due to the presence of both the free N-H stretch and the O-H stretch from the polymer and the dopant acid, respectively (Jelmy et al., 2013). In the FT-IR spectra of neat Sago starch, characteristic peaks between 1,035 and 1,156 cm−1 were attributed to the C-O bond stretch in C-O-C of bonding, and peaks at 1,078 and 1,154 cm−1 were attributed to C-O stretch in C-O-H bonding (Koroskenyi and McCarthy, 2002; Soetaredjo et al., 2012). Other absorption peaks around 1,644 cm−1 corresponded to the adsorbed water in the starch, and bands around 1,420 cm−1 were ascribed to the angular deformation of C-H (Diop et al., 2011). Absorption around 3,700–3,000 cm−1 resulted from the vibration of the hydroxyl group (O–H) and the (C–H) vibration stretch (Biswas et al., 2008; Diop et al., 2011).
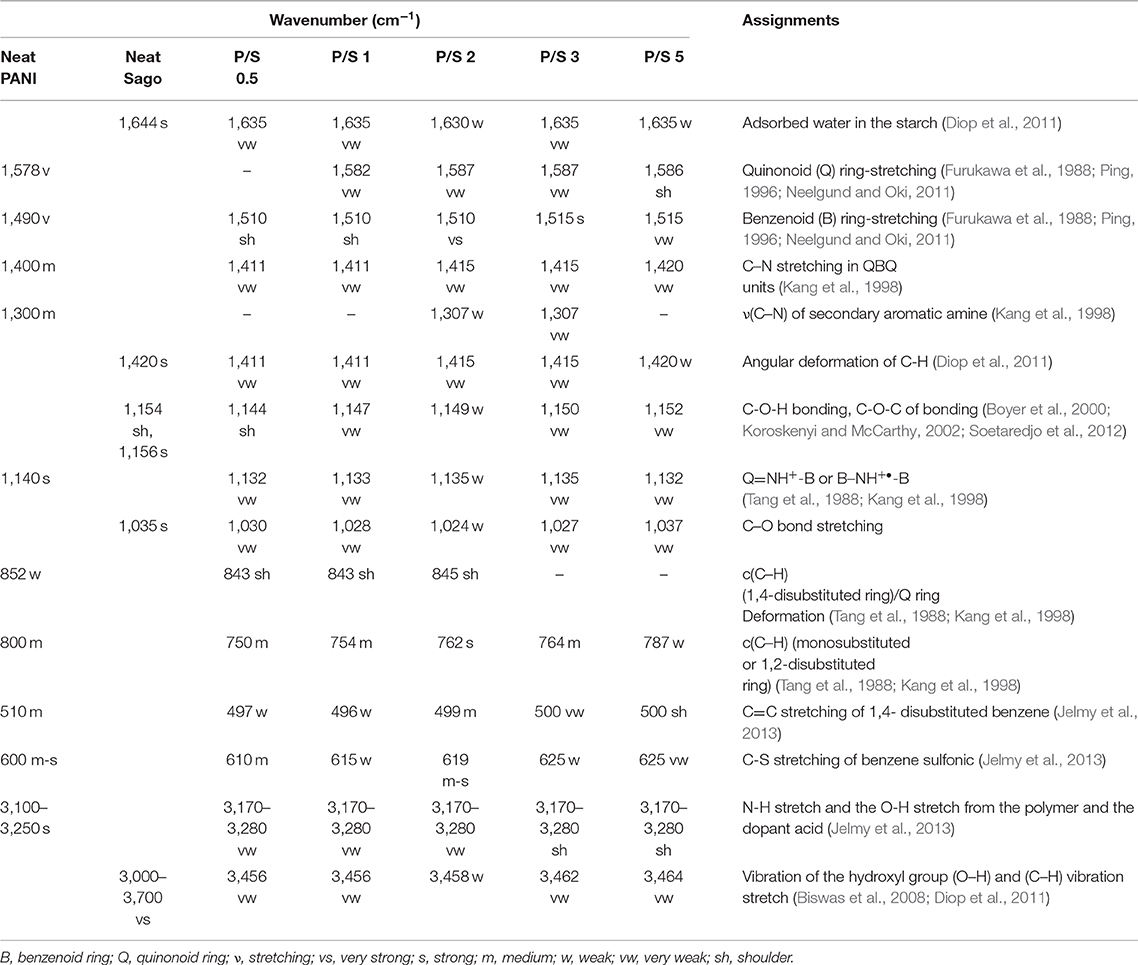
Table 2. Assignments of the IR bands for PANI, Sago, and PANI/Sago blends.
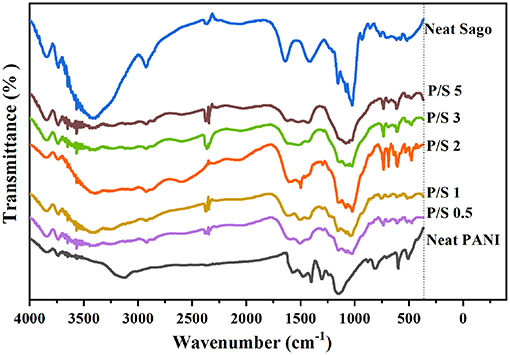
Figure 1. FT-IR of PANI, Sago, and PANI/Sago blends at various sonication times.
In order to understand the effect of sonication time on PANI/Sago blends, the characteristic peaks of PANI at 1,578, 1,490, 1,300, 1,140, and 800 cm−1 and characteristic peaks of Sago at 1,644, 1,420 cm−1, and between 1,035 and 1,156 cm−1 were analyzed and are reported in Table 2 along with the peaks observed for various blends.
In PANI/Sago blends sonicated for varying time periods, the characteristic peaks of PANI and Sago peaks in the range of 1,035–1,644 cm−1 appeared to overlap and merge with each other, though with weakened intensity. The overlapping and merging of PANI and Sago peaks indicated the successful polymerization of PANI in the presence of Sago starch, as these peaks represented the interaction (hydrogen bonding) between PANI and Sago, as shown in Scheme 1 and as supported by literature (Diop et al., 2011; Soetaredjo et al., 2012; Shabana et al., 2019). However, a change in phenomenon was noticed for blends P/S 2 and P/S 3. The peak at 1,490 cm−1 in the neat PANI spectrum, which represents the stretching vibration of the benzenoid ring, shifted slightly and appeared at 1,500 cm−1 for P/S 2 and P/S 3 blends, respectively. The peak at 1,500 cm-1 is the representation of the protonated form of PANI, as the peaks at 1,578 and 1,500 cm−1 are attributed to quinonoid (Q) and benzenoid (B) ring-stretching vibrations, which denote the oxidation state of PANI (Neelgund and Oki, 2011). The high intensity of peak at 1,500 cm−1 is sharper and more intense in P/S 2 blend than in the P/S 3 blend, suggesting a dominance of PANI in the P/S 2 blend. This finding is further supported by E.C results, as shown in Figure 5. However, upon analyzing the P/S 2 and P/S 3 blends for characteristic peaks of Sago between 1,035 and 1,644 cm−1, it was observed that the Sago peaks of P/S 2 were more well-defined, sharp, and intense than the P/S 3 blend. This indicated that the P/S 2 blend was protonated and chemically and structurally more stable. The Sago peaks for P/S 3 and P/S 5, however, were found to be diminished, suggesting a deformation of the Sago structure because of the excessive kinetic energy generated by the collapsing of cavitation bubbles, as explained in NMR analysis.
Nuclear Magnetic Resonance (NMR)
Figure 2A shows the 1H NMR spectra of PANI and its blends with detailed structural information. The peak at 6.86 ppm is due to the protons on the benzene ring and three sharp, equal-strength and equidistant peaks identified at 7.07, 7.2, and 7.33 ppm with a coupling constant of 52 Hz, could be attributed to the proton that was related to nitrogen (Wang et al., 2010). Based on this analysis, it can be deduced that the triplet peaks in Figure 2 resulted from the ammonium protons; in other words, the triplet signals represent the doping protons of PANI (Wang et al., 2010; Abdelkader et al., 2013).
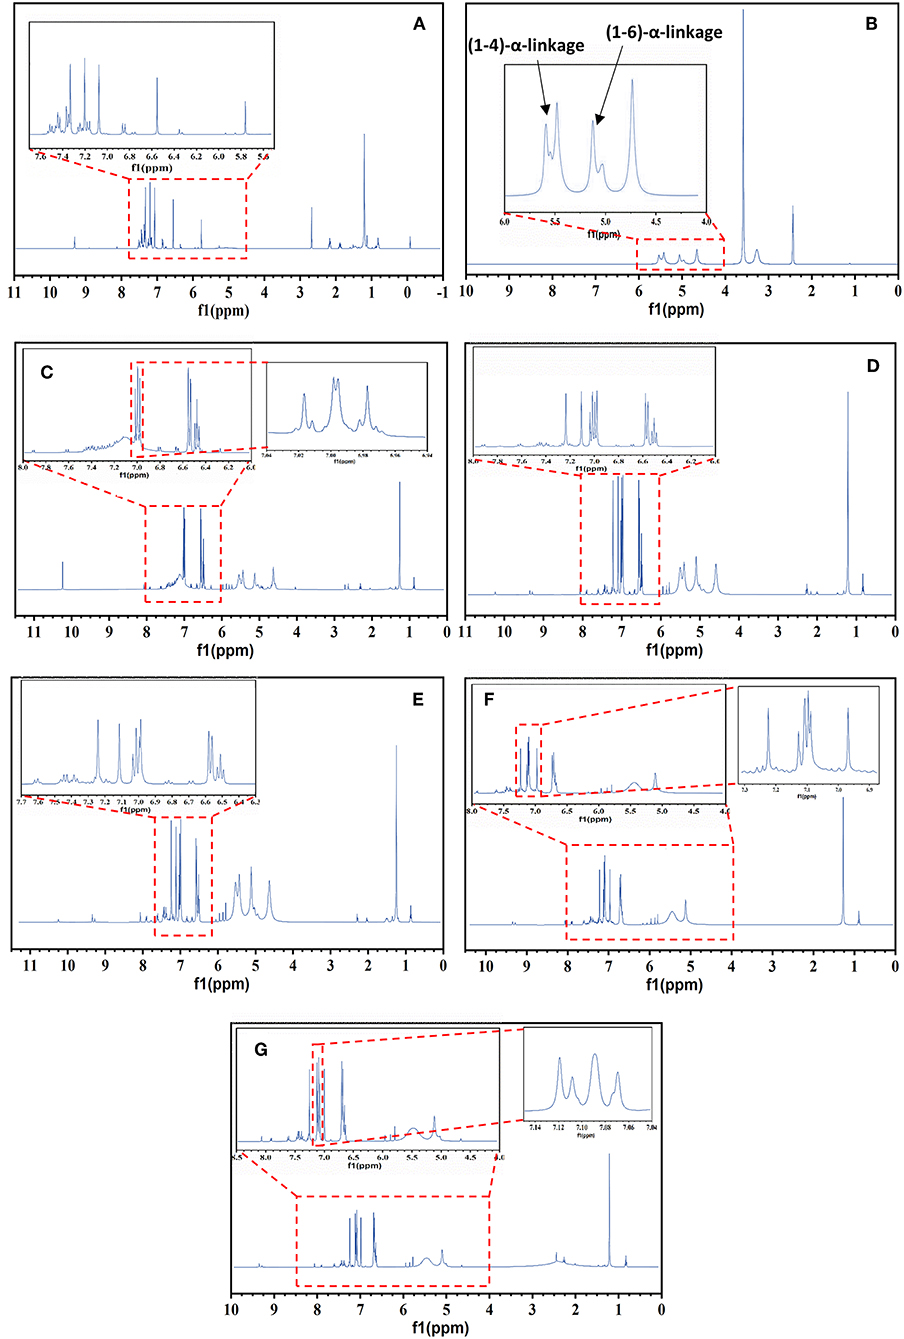
Figure 2. 1H NMR of PANI, Sago, and PANI/Sago blends at various sonication times. (A) Neat PANI; (B) Neat Sago; (C) P/S 0.5; (D) P/S 1; (E) P/S 2; (F) P/S 3; (G) P/S 5.
The equal strength triplet could only be attributed to the proton related to nitrogen as the 14N (natural abundance: 99.62%) atom has a spin quantum number IN = 1 (while IC = 0); this made it possible for the proton on 14N to exhibit the triplet peaks with an integral area ratio of 1:1:1 in the 1H NMR spectrum (Ning, 2000). The low intensity peaks at 1–2 ppm and at 8.15 ppm are due to the water protons bonded by (-NH-and-NH2) groups, respectively (Kanungo et al., 2003), while the signals at 5.8 and 9.3 ppm are from the –NH proton and hydrogen bonded –OH group, respectively (Lukasiewicz et al., 2014). For neat Sago starch, the (1–4) and (1–6) α- linkages are observed in the spectrum at 4.6 and 5.4 and 5.1 ppm, respectively, as shown in Figure 2B (Lukasiewicz et al., 2014).
The impact of sonication time was more evident for the characteristic Sago peaks. For all PANI/Sago blends, no noticeable change was observed for characteristic peaks of PANI upon increasing the sonication time. However, a slight shift in the position of triplet peaks was observed in peaks toward downfield, which was indicative of interaction (hydrogen bonding) between PANI and Sago. Furthermore, some additional weak peaks were observed in blends P/S1–P/S 5, which suggested the growth of a PANI Chain in the blends. However, the characteristic peaks of Sago starch for blends P/S 3 and P/S 5 began to disappear and deform, as seen in Figures 2F,G. The peak attributed to amylose at 4.6 ppm disappeared completely, while the peaks attributed to amylopectin at 5.1 and 5.4 ppm deformed. The disappearance and deformation of Sago peaks could be due to the combination of prolonged acid hydrolysis and the generation of excessive kinetic energy by the collapsing of cavitation bubbles. The disappearance of the amylose peak can be attributed predominantly to the preferential hydrolysis of amorphous regions within starch, which is consistent with the hypothesis reported in literature that amylose is largely located in the amorphous regions of starch granules (Cheng et al., 2010; Sun et al., 2014; Wang and Copeland, 2015). The deformation of amylopectin peaks, however, could be due to the generation of excessive kinetic energy by collapsing of bubbles for prolonged period of time (3 and 5 h, respectively). This in turn leads to the disruption of the crystalline structure of clustered amylopectin.
Ultraviolet-Visible Spectroscopy (UV-Vis)
The structural purity of PANI and its blends can be effectively determined from the UV-Vis spectra, shown in Figure 3. The three characteristic absorption bands of neat PANI observed were around 358 nm, and this was attributed to the π-π* transition in benzene rings; 430 nm, attributed to exciton-couple π-polaron transition, and centered around 900 nm, attributed to polaron–π* transition (Borah et al., 2014). The peaks around 430 and 900 nm are the signature peaks of the ES form of PANI. The UV-Vis absorption pattern of neat PANI obtained are consistent with the previous reported results for neat PANI (Epstein et al., 1994; Kohlman et al., 1996; Molapo et al., 2012). The overall appearance of PANI/Sago blends was similar to that of neat PANI but with a slight decrease in the absorption peak intensities as the sonication time increases. This is due to the distortion of PANI chains on prolonged exposure to irradiation, further supported by the evidence that no characteristic peaks diminished or disappeared, though reduced intensity was observed for P/S 3 and P/S 5 blends. The decrease in peak intensities without peak shifting indicated that PANI was in a protonated form. A correlation between the conductivity of the PANI-salt and the intensity of the longest wavelength band was noticed. The 900 nm band was due to the - species, which was generated on the protonation of PANI, and its intensity was a measure of its doping level. Continued oxidation of the polymer would lead to the conversion of the - to the NH+ group, consequently resulting in a decrease in the intensity of the band at 900 nm and also a decrease in the conductivity of the PANI. Furthermore, to support this claim, the energy band gap for PANI and its blends was calculated using Tauc's plot.
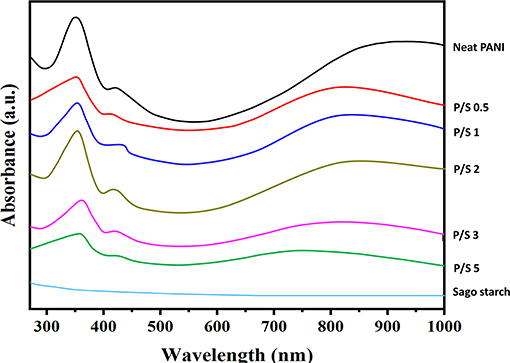
Figure 3. UV-Vis spectrums of PANI, Sago, and PANI/Sago blends at various sonication times.
In the present case, the photon energy (hυ) is plotted against (αhυ)2 for n = 0.5, and this is shown in Figure 4. It gives a straight line fit, which implies that the samples undergo direct transition. Then, the band gap has been extracted by extrapolating the straight portion of the graph on the hυ axis at α = 0 (Oliveira et al., 2016). The energy band gap results obtained from Tauc's plot correlated with electrical conductivity values, as the size of the energy band gap determines whether the polymer is a metal, semiconductor, or insulator. The energy band gap is inversely proportional to electrical conductivity; i.e., the lower the value of energy band the higher the conductivity will be. This confirms that the reduction in electrical conductivity is solely due to prolonged irradiation/sonication, as shown in Figures 4B–D. Thus, sonication time plays a vital role for synthesizing PANI based blends.
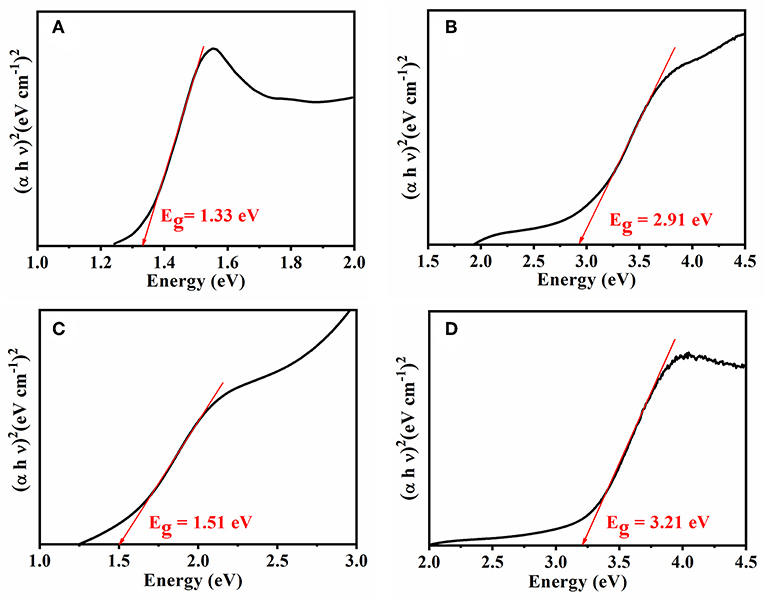
Figure 4. Tauc's plot for the energy band of (A) Neat PANI and (B) PANI/Sago blend at 30 min sonication, (C) PANI/Sago blend at 2 h sonication, and (D) PANI/Sago blend at 5 h sonication.
Electrical Conductivity
Figure 5 shows the variation in electrical conductivity (E.C) values for PANI/Sago blends sonicated for varying times. The E.C of the blend increases with an increase in sonication time, and the highest conductivity is attained for the blend sonicated for 2 h, though it was found to be much lower than that of neat PANI, which was 1.78 Scm−1. The low E.C value for the blends sonicated for less 2 h suggests that the sonication time was not sufficient for the complete polymerization of aniline to PANI. In the in situ polymerization of PANI/Sago blend, PANI oligomers are firstly produced in the early stage of aniline oxidation and are then adsorbed at Sago chains. Once the first PANI chain is produced at the Sago chain, the aniline oxidation will proceed in close vicinity. Therefore, the low E.C values for blends sonicated for 0.5 and 1 h could be due to the presence of PANI oligomers in the blend.
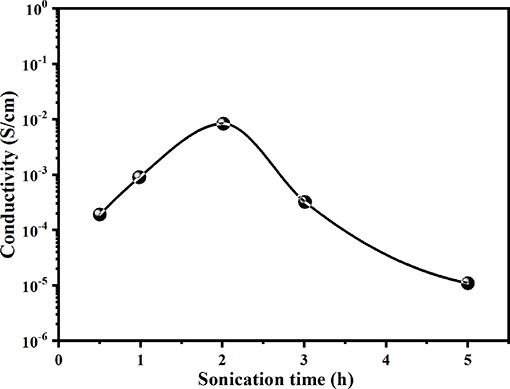
Figure 5. Electrical conductivity of PANI/Sago blends at various sonication times.
Furthermore, it was observed that long polymerization time periods do not favor the E.C of the blend, as reflected by the E.C values. The increase in sonication time beyond 2 h only led to a reduction in the E.C and viscosity of the blend, as shown in Figures 5, 6. These results suggested that polymerization occurred relatively rapidly and was essentially completed in 2 h, further suggesting complete polymerization of aniline to PANI. A similar observation was made by Yong et al., who studied the effect of reaction time on chemical polymerization of aniline using a conventional stirring technique and observed reduction in E.C and viscosity at polymerization times exceeding 4 h (Cao et al., 1989). They reported that prolonged polymerization led to slow hydrolysis, which eventually resulted in reduced E.C and viscosity. We also observed similar results of reduced E.C and viscosity of the prepared PANI/Sago blends, as evidenced by the results in Figures 5, 6. Also, as evident from UV-Vis results, continued sonication of the PANI would lead to the conversion of the -NH2+- to NH+ group, thus resulting in reduced E.C. This study also highlights that the polymerization of PANI using an ultrasonic irradiation technique is much faster than a conventional stirring technique, as reported by Cao et al. (1989).
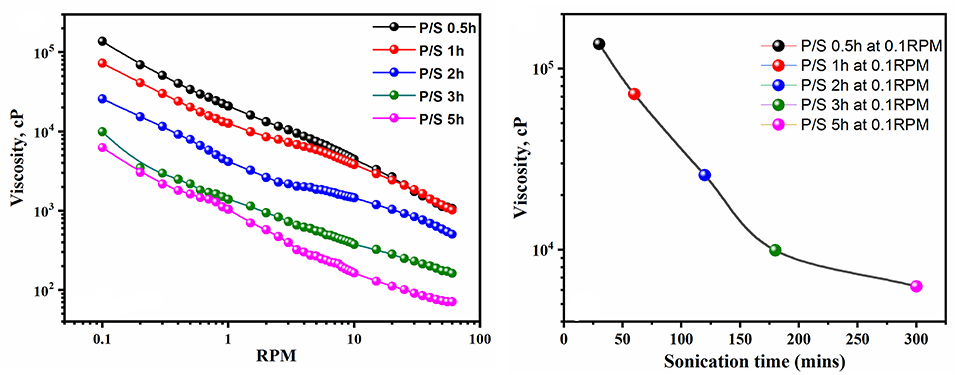
Figure 6. Viscosity of PANI/Sago blends at various times.
Morphology
The FE-SEM of neat PANI, neat Sago starch, and the PANI/Sago blends at various sonication times are shown in Figure 7. Figure 7A is of neat Sago starch that acts as a matrix while Figure 7B is of neat PANI that shows the formation of cylindrical shaped nanostructures with an average diameter of 250 nm. The roughness observed on the PANI surface is attributed to a doping process (John et al., 2010). For PANI/Sago blends it is difficult to demonstrate discrete PANI and Sago by SEM, suggesting a very fine distribution of PANI in the Sago starch matrix. All the PANI/Sago blends (Figures 7C–G) illustrate a highly connected morphology, which helps in good inter- and intra-chain electron transfer within the blends. As the sonication time increases, small voids start to appear in the P/S 3 blend, and they are evident in the P/S 5 blend. This may be due to the bursting of cavitation bubbles for longer periods of time, which increases the kinetic energy in the sonicator bath, leading to the deformation of Sago structure in the blends. These results are complimentary to 1H NMR and FT-IR.
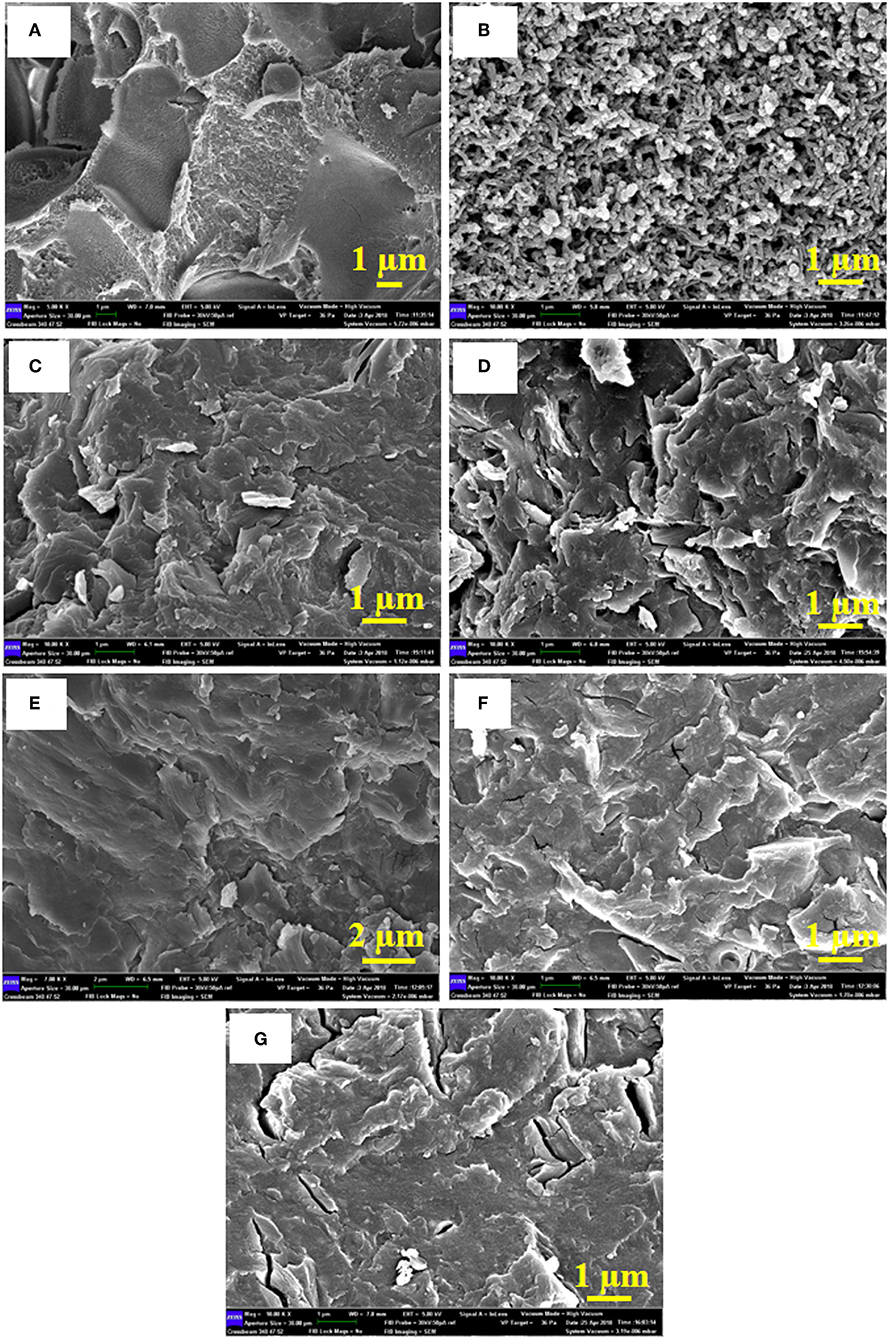
Figure 7. FE-SEM for (A) Neat Sago, (B) Neat PANI, (C) P/S 0.5, (D) P/S 1, (E) P/S 2, (F) P/S 3, and (G) P/S 5.
Thermogravimetric Analysis (TGA)
TG analysis examines the thermal stability of PANI and PANI/Sago blends, as shown in Figure 8. The weight loss in PANI can be segregated into three stages: stage 1 involves weight loss up until ~150°C due to the evaporation of moisture and volatile impurities; stage 2 involves weight loss between 150 and 350°C due to the loss of dopant acid (Neelgund and Oki, 2011); and stage 3 involves weight loss between 400 and 800°C due to the exothermic thermal decomposition of PANI with different degrees of polymerization (Sai et al., 2006). In the case of Sago starch, the weight loss of Sago begins at 290°C with a sharp weight loss from 84 to 18% at 370°C. Compared to neat PANI and native Sago, PANI/Sago showed initial weight loss at a much lower temperature of 200°C. This could be because, at such higher temperatures, the molecular interaction (e.g., hydrogen bonding) between protonic acid, PANI, and Sago is not effective; therefore, a major weight loss takes place (Larimi et al., 2012; Lukasiewicz et al., 2014; Oliveira et al., 2016). The final degradation temperatures for all the blends were higher than those of the Sago starch. No major difference was observed for blends sonicated at different times, but a slight increment was observed for blends sonicated for a longer time. This was obvious as the crystallinity content was higher in the blends sonicated for longer times. In all cases, the final residue after TGA was ~30% of the weight. This result indicated that each blend formed a similar residue irrespective of the sonication time. The PANI and PANI/Sago blends were not completely destroyed because, in a nitrogen atmosphere, the carbonization of polymers takes place, leaving a marked residue.
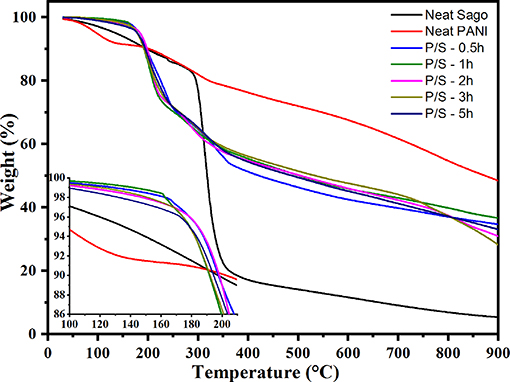
Figure 8. TG analysis of PANI, Sago, and PANI/Sago blends.
Conclusion
The synthesis of PANI/Sago blends was successfully achieved through a facile one-pot synthesis method using ultrasonic irradiation via in situ polymerization technique. The method is economical, easy, and can be scalable to synthesis in bulk quantities. The structural analysis reveals the presence of both PANI and Sago in the synthesized blends. A sonication time of 2 h was found to be optimal for synthesis of PANI/Sago blends; a time <2 h was not enough as PANI was protonated, and more than 2 h of sonication results in deformation of Sago's structure. The highest electrical conductivity value was found for blends sonicated for 2 h. Sonicating blends for more than 2 h resulted in the conversion of the - to NH+ group. This claim is supported by UV-Vis findings, and the energy band gap value obtained from Tauc's model. Not much variation was observed in the thermal stability and morphology of the blends. A well-connected morphology was observed, which helped in good inter- and intra-chain electron transfer within the blends. Therefore, it can be concluded that the optimum time required for the preparation of electrically conductive and physically stable PANI/Sago blend film is 2 h. The prepared films with enhanced electrical conductivity, structural integrity, and thermal stability can be used in applications such as super capacitors, EMI-Shielding, electronic controllers, and self-regulating fuses.
Data Availability Statement
All datasets generated for this study are included in the article/supplementary material.
Author Contributions
Conceptualization of the paper was prepared by MA and AA. Methodology was written and structured by MA, AA, and NS. Validation of the results and analysis are done by MA and NS. Formal analysis by MA, NS, and NB. Investigation by MA, AA, and NS. Resources by AA and AH. Original draft is prepared by MA, NS, and NB. Review and editing by AA, NB, and AH. Project administration—AA and AH. Funding acquisition was managed by AA. All authors contributed to manuscript revision, read, and approved the submitted version.
Conflict of Interest
The authors declare that the research was conducted in the absence of any commercial or financial relationships that could be construed as a potential conflict of interest.
Acknowledgments
The authors would like to thank the Ministry of Higher Education, Malaysia, for providing the Malaysian International Scholarship to MA.
References
Abdelkader, R., Amine, H., and Mohammed, B. (2013). 1H-NMR spectra of conductive, anticorrosive and soluble polyaniline exchanged by an eco-catalyst layered (Maghnite-H+). World J. Chem 2, 86–92. doi: 10.5829/idosi.wjc.2013.8.1.2902
Ali, M., Saion, E., Noorhana, Y., Kassim, A., Dahlan, K. M., Rabaeh, K. A., et al. (2007). Chemical modification and control of polyaniline nanocomposites conductivity by radiation technique in PVA matrix. J. Eng. Sci. Technol. 2, 280–289.
Bhadra, J., Al-Thani, N. J., Madi, N. K., and Al-Maadeed, M. A. (2017). Effects of aniline concentrations on the electrical and mechanical properties of polyaniline polyvinyl alcohol blends. Ar. J. Chem. 10, 664–672. doi: 10.1016/j.arabjc.2015.04.017
Biswas, A., Shogren, R. L., Selling, G., Salch, J., Willett, J. L., and Buchanan, C. M. (2008). Rapid and environmentally friendly preparation of starch esters. Carbohydrate Polym. 74, 137–141. doi: 10.1016/j.carbpol.2008.01.013
Borah, R., Banerjee, S., and Kumar, A. (2014). Surface functionalization effects on structural, conformational, and optical properties of polyaniline nanofibers. Synth. Metals 197, 225–232. doi: 10.1016/j.synthmet.2014.08.018
Boyer, M., Quillard, S., Louarn, G., Froyer, G., and Lefrant, S. (2000). Vibrational study of the FeCl3-doped dimer of polyaniline; a good model compound of emeraldine salt. J. Phys. Chem. B. 104, 8952–8961. doi: 10.1021/jp000946v
Cao, Y., Andreatta, A., Heeger, A. J., and Smith, P. (1989). Influence of chemical polymerization conditions on the properties of polyaniline. Polymer 30, 2305–2311. doi: 10.1016/0032-3861(89)90266-8
Cerqueira, D. A., Valente, A. J. M., Filho, G. R., and Burrows, H. D. (2009). Synthesis and properties of polyaniline–cellulose acetate blends: the use of sugarcane bagasse waste and the effect of the substitution degree. Carbohydrate Polym. 78, 402–408. doi: 10.1016/j.carbpol.2009.04.016
Cheng, W., Chen, J., Liu, D., Ye, X., and Ke, F. (2010). Impact of ultrasonic treatment on properties of starch film-forming dispersion and the resulting films. Carbohydrate Polym. 81, 707–711. doi: 10.1016/j.carbpol.2010.03.043
Dallas, P., and Georgakilas, V. (2015). Interfacial polymerization of conductive polymers: generation of polymeric nanostructures in a 2-D space. Adv. Colloid Interface Sci. 224, 46–61. doi: 10.1016/j.cis.2015.07.008
Diop, C. I. K., Li, H. L., Xie, B. J., and Shi, J. (2011). Effects of acetic acid/acetic anhydride ratios on the properties of corn starch acetates. Food Chem. 126, 1662–1669. doi: 10.1016/j.foodchem.2010.12.050
Ebrahim, S. M., Kashyout, A., and Soliman, M. (2007). Electrical and structural properties of polyaniline/cellulose triacetate blend films. J. Polym. Res. 14, 423–429. doi: 10.1007/s10965-007-9125-7
Epstein, A. J., Joo, J., Kohlman, R., Du, G., MacDiarmid, A. G., Oh, E.-J., et al. (1994). Inhomogeneous disorder and the modified Drude metallic state of conducting polymers. Synth. Metals 65, 149–157. doi: 10.1016/0379-6779(94)90176-7
Furukawa, Y., Ueda, F., Hyodo, Y., Harada, I., Nakajima, T., and Kawagoe, T. (1988). Vibrational spectra and structure of polyaniline. Macromolecules 21, 1297–1305. doi: 10.1021/ma00183a020
Grieser, F., Ashokkumar, M., and Sostaric, J. (1999). “Sonochemistry and Sonoluminescence in Colloidal Systems”, in NATO ASI Series, eds L. A. Crum, T. J. Mason, J. L. Reisse, and K. S. Suslick (Leavenworth, WA: Kluwer Academic Publishers, 345–362.
Gulrez, S. K. H., Ali Mohsin, M. E., Shaikh, H., Anis, A., Manjaly Poulose, A., Yadav, M., et al. (2014). A review on electrically conductive polypropylene and polyethylene. Polym. Composit. 35, 900–914. doi: 10.1002/pc.22734
Gupta, K., Jana, P., and Meikap, A. (2010). Optical and electrical transport properties of polyaniline–silver nanocomposite. Synth. Metals 160, 1566–1573. doi: 10.1016/j.synthmet.2010.05.026
Iida, Y., Tuziuti, T., Yasui, K., Towata, A., and Kozuka, T. (2008). Control of viscosity in starch and polysaccharide solutions with ultrasound after gelatinization. Innov. Food Sci. Emerg. Technol. 9, 140–146. doi: 10.1016/j.ifset.2007.03.029
Janaki, V., Vijayaraghavan, K., Oh, B. T., Lee, K. J., Muthuchelian, K., Ramasamy, A. K., et al. (2012). Starch/polyaniline nanocomposite for enhanced removal of reactive dyes from synthetic effluent. Carbohydrate Polym. 90, 1437–1444. doi: 10.1016/j.carbpol.2012.07.012
Jelmy, E. J., Ramakrishnan, S., Devanathan, S., Rangarajan, M., and Kothurkar, N. K. (2013). Optimization of the conductivity and yield of chemically synthesized polyaniline using a design of experiments. J. Appl. Polym. Sci. 130, 1047–1057. doi: 10.1002/app.39268
John, A., Mahadeva, S. K., and Kim, J. (2010). The preparation, characterization and actuation behavior of polyaniline and cellulose blended electro-active paper. Smart Mater. Struct. 19:045011. doi: 10.1088/0964-1726/19/4/045011
Kang, E., Neoh, K., and Tan, K. (1998). Polyaniline: a polymer with many interesting intrinsic redox states. Prog. Polym. Sci. 23, 277–324. doi: 10.1016/S0079-6700(97)00030-0
Kanungo, M., Kumar, A., and Contractor, A. (2003). Microtubule sensors and sensor array based on polyaniline synthesized in the presence of poly (styrene sulfonate). Anal. Chem. 75, 5673–5679. doi: 10.1021/ac034537h
Kim, H.-Y., Han, J. A., Kweon, D. K., Park, J. D., and Lim, S. T. (2013). Effect of ultrasonic treatments on nanoparticle preparation of acid-hydrolyzed waxy maize starch. Carbohydrate Polym. 93, 582–588. doi: 10.1016/j.carbpol.2012.12.050
Kohlman, R., Joo, J., Min, Y. G., MacDiarmid, A. G., and Epstein, A. J. (1996). Crossover in electrical frequency response through an insulator-metal transition. Phys. Rev. Lett. 77:2766. doi: 10.1103/PhysRevLett.77.2766
Koroskenyi, B., and McCarthy, S. P. (2002). Microwave-assisted solvent-free or aqueous-based synthesis of biodegradable polymers. J. Polym. Environ. 10, 93–104. doi: 10.1023/A:1021120113910
Larimi, S. G., Darzi, H. H., and Darzi, G. N. (2012). Fabrication and characterization of polyaniline/xanthan gum nanocomposite: conductivity and thermal properties. Synth. Metals 162, 171–175. doi: 10.1016/j.synthmet.2011.11.027
Lu, X., Mao, H., Chao, D., Zhang, W., and Wei, Y. (2006). Fabrication of polyaniline nanostructures under ultrasonic irradiation: from nanotubes to nanofibers. Macromol. Chem. Phys. 207, 2142–2152. doi: 10.1002/macp.200600424
Lukasiewicz, M., Ptaszek, P., Ptaszek, A., and Bednarz, S. (2014). Polyaniline–starch blends: synthesis, rheological, and electrical properties. Starch Stärke 66, 583–594. doi: 10.1002/star.201300147
Lv, D., Shen, J., and Wang, G. (2015). A post-oxidation strategy for the synthesis of graphene/carbon nanotube-supported polyaniline nanocomposites as advanced supercapacitor electrodes. RSC Adv. 5, 24599–24606. doi: 10.1039/C4RA13737J
Manuel, J., Kim, M., Fapyane, D., Chang, I. S., Ahn, H.-J., and Ahn, J.-H. (2014). Preparation and electrochemical properties of polyaniline nanofibers using ultrasonication. Mater. Res. Bull. 58, 213–217. doi: 10.1016/j.materresbull.2014.04.058
Marcasuzaa, P., Reynaud, S., Ehrenfeld, F., Khoukh, A., and Desbrieres, J. (2010). Chitosan-graft-polyaniline-based hydrogels: elaboration and properties. Biomacromolecules 11, 1684–1691. doi: 10.1021/bm100379z
Mason, T. J., and Lorimer, J. P. (1988) Sonochemistry (Theory, Applications and Uses of Ultrasound in Chemistry), Ellis Horwood Limited. Chichester; New York, NY: John Wiley Sons. doi: 10.1002/bbpc.19890931025
Molapo, K. M., Ndangili, P. M., Ngece Ajayi, R. F., Mbambisa, G., Mailu, S. M., Njomo, N., et al. (2012). Electronics of conjugated polymers (I): polyaniline. Int. J. Electrochem. Sci. 7, 11859–11875.
Neelgund, G. M., and Oki, A. (2011). A facile method for the synthesis of polyaniline nanospheres and the effect of doping on their electrical conductivity. Polym. Int. 60, 1291–1295. doi: 10.1002/pi.3068
Ning, Y. (2000). Structural Identification of Organic Compounds and Organic Spectroscopy. Beijing: Publishing Company of Science.
Oliveira, L., Graeff, C. Z., de Faria, P. V., Henrique Backes, E., Henrique Cristovan, F., and Roberto Passador, F. (2016). “Preparation and characterization of conductive HDPE/LLDPE/Polyaniline blends,” in AIP Conference Proceedings (Graz: AIP Publishing).
Ping, Z. (1996). In situ FTIR–attenuated total reflection spectroscopic investigations on the base–acid transitions of polyaniline. Base–acid transition in the emeraldine form of polyaniline. J. Chem. Soc. Faraday Trans. 92, 3063–3067. doi: 10.1039/FT9969203063
Pron, A., Genoud, F., Menardo, C., and Nechtschein, M. (1988). The effect of the oxidation conditions on the chemical polymerization of polyaniline. Synth. Metals 24, 193–201. doi: 10.1016/0379-6779(88)90257-3
Ramaprasad, A., Rao, V., Sanjeev, G., Ramanani, S. P., and Sabharwal, S. (2009). Grafting of polyaniline onto the radiation crosslinked chitosan. Synth. Metals 159, 1983–1990. doi: 10.1016/j.synthmet.2009.07.006
Razak, S. I. A., Rahman, W. A. W. A., Sharif, N. F. A., Hasraf, N., Saidi, M. A. A., and Yahya, M. (2013). Polyaniline-coated kenaf core and its effect on the mechanical and electrical properties of epoxy resin. Composite Interfaces 20, 611–622. doi: 10.1080/15685543.2013.821019
Reda, S. M., and Al-Ghannam, S. M. (2012). Synthesis and electrical properties of polyaniline composite with silver nanoparticles. Adv. Mater. Phys. Chem. 2:75. doi: 10.4236/ampc.2012.22013
Sai, V., Mahajan, S., Contractor, A. Q., and Mukherji, S. (2006). Immobilization of antibodies on polyaniline films and its application in a piezoelectric immunosensor. Anal. Chem. 78, 8368–8373. doi: 10.1021/ac060120a
Saikia, J. P., Banerjee, S., Konwar, B. K., and Kumar, A. (2010). Biocompatible novel starch/polyaniline composites: characterization, anti-cytotoxicity and antioxidant activity. Colloids Surf. B Biointerfaces 81, 158–164. doi: 10.1016/j.colsurfb.2010.07.005
Sapurina, I., and Stejskal, J. (2008). The mechanism of the oxidative polymerization of aniline and the formation of supramolecular polyaniline structures. Polym. Int. 57, 1295–1325. doi: 10.1002/pi.2476
Sarma, T. K., and Chattopadhyay, A. (2004). Reversible encapsulation of nanometer-size polyaniline and polyaniline– Au-nanoparticle composite in starch. Langmuir 20, 4733–4737. doi: 10.1021/la0495884
Seguchi, M., Higasa, T., and Mori, T. (1994). Study of wheat starch structures by sonication treatment. Cereal Chem. 71, 636–636.
Shabana, S., Prasansha, R., Kalinina, I., Potoroko, I., Bagale, U., and Shirish, S. H. (2019). Ultrasound assisted acid hydrolyzed structure modification and loading of antioxidants on potato starch nanoparticles. Ultrasonics Sonochem. 51, 444–450. doi: 10.1016/j.ultsonch.2018.07.023
Soetaredjo, F. E., Ismadji, S., Huynh, L.-H., Kasim, N., Tran-Thi, N. Y., and Ayucitra, A. (2012). Facile preparation of sago starch esters using full factorial design of experiment. Starch Stärke 64, 590–597. doi: 10.1002/star.201100169
Sun, Q., Fan, H., and Xiong, L. (2014). Preparation and characterization of starch nanoparticles through ultrasonic-assisted oxidation methods. Carbohydrate Polym. 106, 359–364. doi: 10.1016/j.carbpol.2014.02.067
Tang, J., Jing, X., Wang, B., and Wang, F. (1988). Infrared spectra of soluble polyaniline. Synth. Metals 24, 231–238. doi: 10.1016/0379-6779(88)90261-5
Tischer, P. C. F., Sierakowski, M. R., Westfahl, H. Jr., and Tischer, C. (2010). Nanostructural reorganization of bacterial cellulose by ultrasonic treatment. Biomacromolecules 11, 1217–1224. doi: 10.1021/bm901383a
Tiwari, A. (2007). Gum arabic-graft-polyaniline: an electrically active redox biomaterial for sensor applications. J. Macromol. Sci. Part A Pure Appl. Chem. 44, 735–745. doi: 10.1080/10601320701353116
Tiwari, A., and Singh, V. (2008). Microwave-induced synthesis of electrical conducting gum acacia-graft-polyaniline. Carbohydrate Polym. 74, 427–434. doi: 10.1016/j.carbpol.2008.03.015
Wang, S., and Copeland, L. (2015). Effect of acid hydrolysis on starch structure and functionality: a review. Crit. Rev. Food Sci. Nutr. 55, 1081–1097. doi: 10.1080/10408398.2012.684551
Wang, X., Sun, T., Wang, C., Wang, C., Zhang, W., and Wei, Y. (2010). 1H NMR determination of the doping level of doped polyaniline. Macromol. Chem. Phys. 211, 1814–1819. doi: 10.1002/macp.201000194
Xia, H., and Wang, Q. (2002). Ultrasonic irradiation: a novel approach to prepare conductive polyaniline/nanocrystalline titanium oxide composites. Chem. Mater. 14, 2158–2165. doi: 10.1021/cm0109591
Yavuz, A. G., Uygun, A., and Bhethanabotla, V. R. (2009). Substituted polyaniline/chitosan composites: synthesis and characterization. Carbohydrate Polym. 75, 448–453. doi: 10.1016/j.carbpol.2008.08.005
Keywords: polyaniline, Sago starch, oxidative polymerization, ultrasound irradiation, electrical conductivity
Citation: Ali Mohsin ME, Shrivastava NK, Basar N, Arsad A and Hassan A (2019) The Effect of Sonication Time on the Properties of Electrically Conductive PANI/Sago Starch Blend Prepared by the One-Pot Synthesis Method. Front. Mater. 6:297. doi: 10.3389/fmats.2019.00297
Received: 31 July 2019; Accepted: 06 November 2019;
Published: 29 November 2019.
Edited by:
Hazizan Md. Akil, University of Science Malaysia, MalaysiaReviewed by:
Rafael Guntzel Arenhart, Federal University of Santa Catarina, BrazilMohammad Jawaid, Putra Malaysia University, Malaysia
Copyright © 2019 Ali Mohsin, Shrivastava, Basar, Arsad and Hassan. This is an open-access article distributed under the terms of the Creative Commons Attribution License (CC BY). The use, distribution or reproduction in other forums is permitted, provided the original author(s) and the copyright owner(s) are credited and that the original publication in this journal is cited, in accordance with accepted academic practice. No use, distribution or reproduction is permitted which does not comply with these terms.
*Correspondence: Agus Arsad, YWd1c0BjaGVtZS51dG0ubXk=