 Yong Jia
 Jianhua Yang3
 Jin Jiang
- 1School of Energy and Environment, Anhui University of Technology, Ma Anshan, China
- 2Anhui Xinchuang Energy & Environmental Protection Science & Technology Co. Ltd., Ma Anshan, China
- 3Ma'anshan Weishen Energy-Saving Environmental Protection Technology Co., Ltd., Ma Anshan, China
A catalyst 0.1VP(0.2)O-Cr(0.01)-PEG(1 × 10⁻⁴)/Ti for low-temperature SCR de-NOx was developed and the effects of SO2 and water vapor on its catalytic activity were investigated. Cr doping increases the molar ratio of V5+ to V4+ on the VPO catalyst, which promote oxidation of NO to NO2 and catalytic activity of the VPO catalyst. An appropriate amount of redox-coupled V5+/V4+ also promotes catalytic activity of the VPO catalyst. The denitration efficiency over 0.1VP(0.2)O-Cr(0.01)-PEG(1 × 10⁻⁴)/Ti was above 98% at 150–350°C. Cr doping also promotes the generation of Lewis acid around V5+ center and Brønsted acid (P-OH) on the VPO catalysts. The strong surface acidity of 0.1VP(0.2)O-Cr(0.01)-PEG(1 × 10⁻⁴)/Ti could restrain the adsorption of and oxidation of SO2. Characterization (FT-IR, TG) results indicate that nearly no sulfate was deposited on the surface of 0.1VP(0.2)O-Cr(0.01)-PEG(1 × 10⁻⁴)/Ti after activity test. The competitive adsorption of water molecules and nitric oxide on the catalyst surface decreases the catalytic activity of the VPO catalyst. The addition of Cr and PEG could increase the surface area and the exposure of active site of VPO catalyst, which also increase the unoccupied active sites of VPO catalysts in the presence of water vapor. The catalyst 0.1VP(0.2)O-Cr(0.01)-PEG(1 × 10⁻⁴)/Ti for low-temperature SCR de-NOx shows high catalytic activity and exhibits high resistance to SO2 and water vapor.
Introduction
In addition to coal-fired flue gas, industrial waste gases such as coke oven flue gas, sintering flue gas, and garbage incineration flue gas are other major sources of NOx (Chen et al., 2015; Gamrat et al., 2016; Li et al., 2018). Among these emission sources, NOx is discharged mainly in the form of nitric oxide (NO). The selective catalytic reduction (SCR) process is currently considered to be an efficient technology for controlling NOx emissions (Niu et al., 2016; You et al., 2017). Although the V2O5-WO3(MoO3)/TiO2 catalyst has been widely adopted as a superior catalyst for controlling NOx in coal-fired flue gas, the highest reactive activity of V2O5-WO3(MoO3)/TiO2 is usually at the temperature range of 300–400°C (Niu et al., 2016; You et al., 2017). However, the temperature of coke oven flue gas, sintering flue gas, and garbage incineration flue gas is below 250°C (Chen et al., 2015; Gamrat et al., 2016). The development of catalyst for low-temperature SCR denitration is extremely urgent for the control of NOx emission from industrial flue gas.
Much effort has focused on developing catalysts for low-temperature denitration. Different metal oxides, supporters, and polymetallic catalysts have been investigated for low-temperature denitration (Andreoli et al., 2015; Stakheev et al., 2015; Cha et al., 2016; Chen et al., 2016; Wang et al., 2016). The denitration efficiency of some of these catalysts could reach more than 95% at temperature of 150°C. However, catalyst activities were generally inhibited by SO2 and water vapor because of deposition of (NH4)2SO4 and metal sulfates on the surface of catalyst (Cha et al., 2016; Wang et al., 2016). Accordingly, the development of low-temperature denitration catalysts with excellent SO2 resistance and water resistance is urgent.
The surface acidity of a catalyst plays an important role in the SCR denitration process (Cha et al., 2016). The Eley-Rideal mechanism indicates that NH3 is adsorbed on the Brønsted acid site and transforms into ions (Yu et al., 2016). This species reacts with NO to form an activated complex and then decomposes into N2 and H2O. SO2 is an acidic gas, the adsorption of SO2 on the surface of the catalyst would be restrained by increasing the surface acidity of the catalyst, which could promote the sulfation resistance of SCR catalyst. Vanadium is a widely used as a catalyst component because of its superior redox properties (Busca et al., 1998; Phil et al., 2008; Zhao et al., 2015). Vanadium phosphorus oxides (VPO), which is prepared by reacting vanadium oxides and phosphoric acid, is a type of heteropolyacid. Busca et al. investigated the oxidation of alkanes with VPO and the results show that there are abundant Brønsted acid sites (V-OH, P-OH) on the surface of VPO catalyst (Busca et al., 1986; Bond, 1991; Feng et al., 2015). Moreover, the polarization effect of the V-(O-P) bond could promote the formation of Lewis acid sites on the V4+ center due to the high electronegativity of P (Bond, 1991; Benziger et al., 1997).
Water vapor is another factor which degrades the catalytic performance of low-temperature denitration catalysts. Zhang et al. proposed that the competitive adsorption of water molecules and nitric oxide on the catalyst surface is responsible for the degraded catalytic performance (Zhang et al., 2014). Adsorption and desorption equilibrium of water vapor exist on catalyst surface and the proportion of active sites occupied by water molecules is constant at a certain temperature (Melánová et al., 1999). The amount of unoccupied active sites on the surface of catalysts increases as the specific surface area of the catalyst increases. Accordingly, optimizing the structure and specific surface area of the catalyst could increase its catalytic activity in the presence of water vapor.
The surface acidity and structural properties of a catalyst are closely related to its resistance to SO2 and water vapor (Cha et al., 2016). Vanadium phosphorus oxides (VPO) have been investigated for the oxidation of alkane by several researchers because of their excellent redox properties and surface acidities (Busca et al., 1986; Bond, 1991; Benziger et al., 1997; Melánová et al., 1999; Feng et al., 2015). However, VPO catalyst has been rarely investigated for SCR denitration and the specific surface area of VPO is usually below 20 m2/g. Bagnasco et al. reported that the layered crystalline VPO would be formed by isomorphous substitution with some trivalent metals (Al, Cr, Fe, etc.) and the surface morphology and structural properties of VPO could also be ameliorated by trivalent metals (Bagnasco et al., 1990). In this study, Cr modified VPO catalysts with titanium dioxide as the support material were prepared and polyethylene glycol (PEG) was used to improve the dispersion of active components. The low-temperature SCR denitration performance of VPO-Cr-PEG/TiO2 and the effect of SO2 and water vapor on catalytic activity of VPO-Cr-PEG/TiO2 were investigated. Combining with activity test and characterization, the physicochemical properties of the VPO-Cr-PEG/TiO2 were also investigated.
Experimental
Catalyst Preparation
VPO-Cr was prepared according to a liquid-phase synthesis method. Ammonium metavanadate and chromic nitrate were added to an oxalic acid solution according to a certain mole ratio and the solution was stirred for 1 h. Subsequently, the mixture was stirred for a further 2 h after adding a certain amount of phosphoric acid (85 wt.%), HCl solution(36–38 wt.%), and PEG. Thereafter, the mixture was successively evaporated at 90°C and it was transformed into wet gel. The wet gel was dried at 105°C for 4 h. Afterwards, the product was calcined at 350°C for 3 h, and the active ingredient VPO-Cr-PEG was obtained.
Using commercially available TiO2 (specific surface area is 322 m2/g) as support material, the VPO-Cr-PEG/TiO2 catalyst was prepared by impregnation method. First of all, appropriate quantities of TiO2 and VPO-Cr-PEG were added into distilled water and the mixture was stirred for 2 h. Then the mixture was evaporated in a water bath at 70°C and the solid obtained was calcined at 350°C for 3 h. The catalyst prepared at different conditions such as P/V (molar ratio of P to V, x), Cr/V (molar ratio of Cr to V, y), PEG/V (molar ratio of PEG to V, z) and the weight percentage of active ingredient (w) were denoted as wVP(x)O-Cr(y)-PEG(z)/Ti.
Catalyst Characterization
The specific surface area and average pore size were measured by a surface area analyzer (V-sorbet 2008S). The morphologies of the catalysts were examined with a scanning electron microscope (SEM) operated at 30 kV (JEOLJSM-6380LV). The chemical composition of the catalysts was analyzed by X-ray photoelectron spectroscopy (ESCALAB 250). The redox performance and NO adsorption properties of the catalysts were measured with a Chembet Pulsar TPR/TPD. The crystal structure was determined by X-ray diffraction (XD-3). Infrared spectroscopy measurements were performed with an FT-IR spectrometer (Bomen MB154S).
Activity Test
The SCR denitration activities of the VPO-Cr-PEG/TiO2 catalysts were measured in a conventional fixed-bed reactor (inner diameter = 8 mm). The diagram of the experimental system is present in Figure 1.
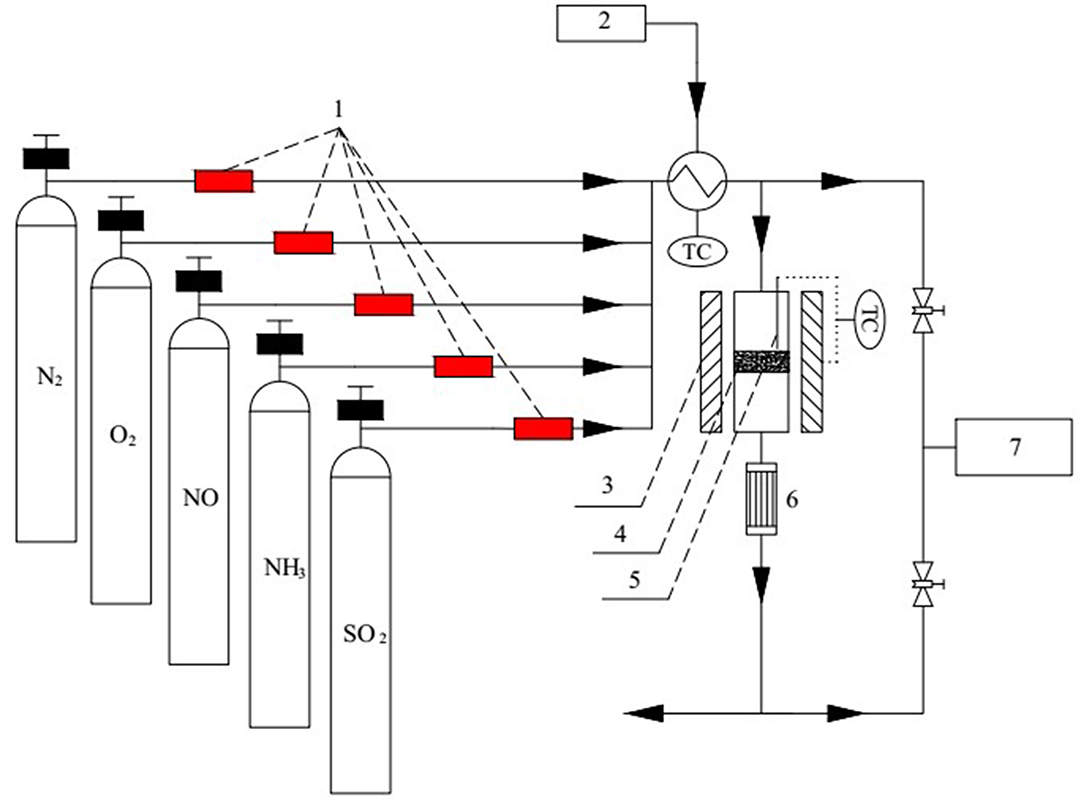
Figure 1. Diagram of the fixed-bed reactor (1-mass flowmeter, 2-preheater, 3-reactor, 4-catalyst, 5-thermocouple, 6-condensator, 7-flue gas analyzer).
Flue gas was simulated by mixing 0.05 vol.% NO, 0.05 vol.% NH3, 6 vol.% O2, 0–0.1 vol.% SO2, and 0–16 vol.% water vapor. The mixture was balanced with N2. The flow rate of each gas was controlled by mass flowmeter. The total gas flow rate was set to 100 mL/min and the corresponding gas hourly space velocity was about 15,000 h−1. Liquid water was injected into the gas pipeline located at the center of a preheater (120°C) and it was evaporated to form water vapor. The NOx concentration at the inlet and outlet of the fixed-bed reactor were measured with a gas analyzer (MRU Varioplus). The denitration efficiency η is expressed as:
Results and Discussion
SCR Denitration Activity
The NH3-SCR deNOx activity of the catalysts were tested at 500 ppm of NH3, 500 ppm of NO, 6 vol.% of O2, and 15,000 h−1 GHSV. The denitration efficiency of catalysts at different temperature are shown in Figure 2.
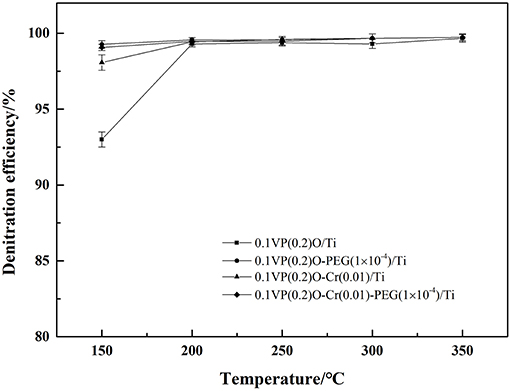
Figure 2. Denitration efficiency of the supported VPO catalysts.
Obviously, the denitration efficiencies of the catalysts increase as temperature increases. The denitration efficiency of 0.1VP(0.2)O/Ti is 93% at 150°C and reaches 99.3% at temperatures above 200°C. The denitration efficiencies of Cr-PEG-modified VPO/Ti catalysts are above 98% at temperatures in the range 150–350°C. Obviously, the addition of Cr and PEG could improve the catalytic activity of VPO/Ti, especially at low reaction temperature.
Influence of SO2 on Catalytic Activity
Selectivity of catalyst is an important parameter for SCR denitration performance. The feed gas consisted of 0.05 vol.% NO, 0.08 vol.% SO2, 6 vol.% O2 and balanced with N2 was passed through catalyst, and the concentration of SO2 and NOx in the outlet gas were measured. Corresponding results are presented in Figures 3, 4.
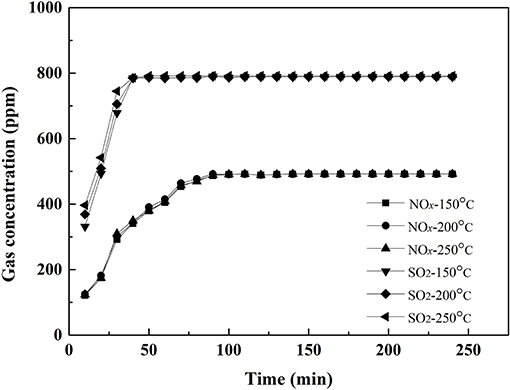
Figure 3. Outlet concentration of NOx and SO2 vs. time over 0.1VP(0.2)O/Ti catalyst.
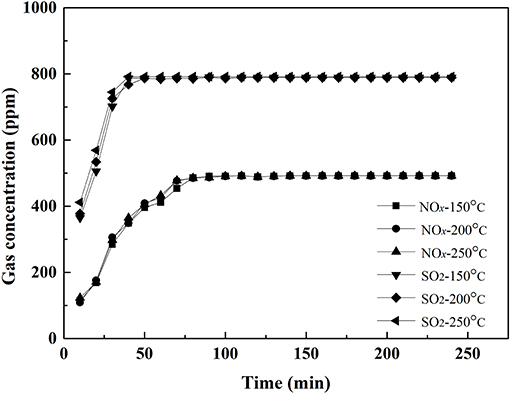
Figure 4. Outlet concentration of NOx and SO2 vs. time over 0.1VP(0.2)O-Cr(0.01)-PEG(1 × 10⁻⁴)/Ti catalyst.
Figure 3 shows the outlet concentration of SO2 and NOx vs. time when the feed gas passed through the 0.1VP(0.2)O/Ti catalyst. The outlet concentration of SO2 increases as time increases and it reached equilibrium and was almost the same as the inlet concentration after 40 min. Results of Figure 3 also indicate that the outlet concentration of NOx reached equilibrium at about 90 min.
Figure 4 shows the outlet concentration of SO2 and NOx vs. time when the feed gas passed through the 0.1VP(0.2)O-Cr(0.01)-PEG(1 × 10⁻⁴)/Ti catalyst. The outlet concentration of NOx and SO2 reached equilibrium a little faster than that of the feed gas passed through 0.1VP(0.2)O/Ti. Both results in Figures 3, 4 also indicate that almost no SO2 oxidized when the feed gas passed through the VPO catalysts.
The feed gases with SO2 mentioned above were cut off after they were in contact with catalysts for 6 h. 0.1VP(0.2)O/Ti and 0.1VP(0.2)O-Cr(0.01)-PEG(1 × 10⁻⁴)/Ti were then separately flushed with nitrogen (200 mL/min) for 1 h in order to remove the physically adsorbed substance. Thereafter, the NH3-SCR deNOx activities of the 0.1VP(0.2)O/Ti and 0.1VP(0.2)O-Cr(0.01)-PEG(1 × 10⁻⁴)/Ti were tested, and experimental results are shown in Figure 5. The experimental conditions were the same as described in Section SCR denitration activity. Compared with the results in Figure 2, the catalytic activity for SCR-deNOx of the 0.1VP(0.2)O/Ti and 0.1VP(0.2)O-Cr(0.01)-PEG(1 × 10⁻⁴)/Ti in Figure 4 did not decrease after exposure to SO2. It indicated that the active components of 0.1VP(0.2)O/Ti and 0.1VP(0.2)O-Cr(0.01)-PEG(1 × 10⁻⁴)/Ti are not sulfated.
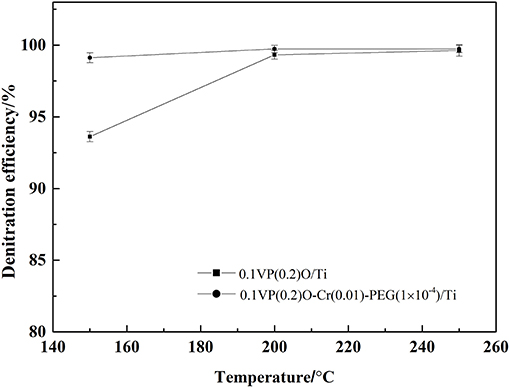
Figure 5. Denitration efficiency of catalysts after SO2 treatment.
Influence of Water Vapor on Catalytic Activity
The NH3-SCR deNOx activity of catalysts were tested in a feed gas containing 0.05 vol.% NH3, 0.05 vol.% NO, 6 vol.% O2, and 4–8 vol.% water vapor. The effect of water vapor concentration on the NH3-SCR deNOx catalytic activity of catalysts is shown in Figure 6.
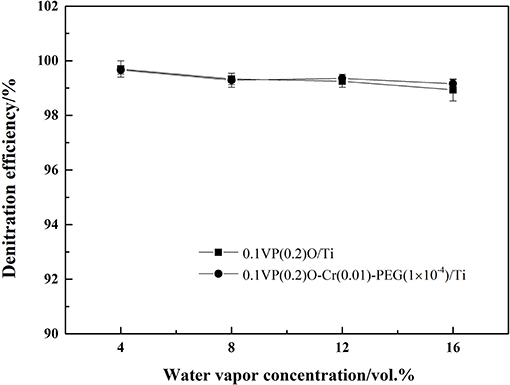
Figure 6. Effect of water vapor on denitration efficiency.
One can see from Figure 6 that the denitration efficiency of 0.1VP(0.2)O/Ti decreased from 99.8 to 99.3% as water vapor concentration increased from 4 to 6 vol.%. A similar trend was also observed for 0.1VP(0.2)O-Cr(0.01)-PEG(1 × 10⁻⁴)/Ti. One possible reason is that the number of active sites occupied by water molecules increases as the concentration of water vapor increases. As can be seen from Figure 6, the denitration efficiency of 0.1VP(0.2)O-Cr(0.01)-PEG(1 × 10⁻⁴)/Ti was slightly higher than that of 0.1VP(0.2)O/Ti when the water vapor concentration was above 12 vol.%. The reason may be that Cr doping ameliorate the surface and structural properties of VPO and PEG improve the dispersion of active components. There are more unoccupied active sites on surface of 0.1VP(0.2)O-Cr(0.01)-PEG(1 × 10⁻⁴)/Ti than that of 0.1VP(0.2)O/Ti in the presence of water vapor in feed gas.
Influence of Water Vapor and SO2 on Catalytic Activity
The feed gas containing 0.05 vol.% NH3, 0.05 vol.% NO, 6 vol.% O2, 8 vol.% water vapor, and 0.02–0.1 vol.% SO2 was passed through the catalysts. The effects of SO2 and water vapor on the denitration efficiency over the 0.1VP(0.2)O/Ti and 0.1VP(0.2)O-Cr(0.01)-PEG(1 × 10⁻⁴)/Ti were investigated and results are presented in Figure 7. It can be seen from Figure 7 that the catalytic activity did not decrease when the SO2 concentration was below 400 ppm. As SO2 concentration increased from 400 to 1,000 ppm, the denitration efficiency over 0.1VP(0.2)O/Ti decreased from 99.4 to 64.5% and the denitration efficiency over 0.1VP(0.2)O-Cr(0.01)-PEG(1 × 10⁻⁴)/Ti descreased from 99.7 to 81%. Obviously, the Cr-PEG-modified VPO/Ti catalyst has higher catalytic activity than the VPO/Ti catalyst in the presence of SO2 and water vapor.
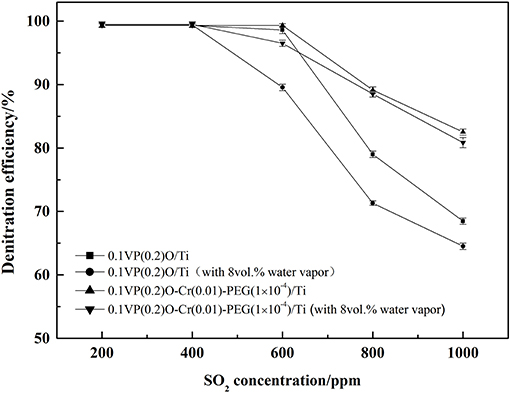
Figure 7. Effect of SO2 and water vapor on the denitration efficiency of the catalysts (200°C).
The sulfation of active components and the surface deposition of ammonium sulfate of catalysts are the primary reason for the decline of the NH3-SCR deNOx catalytic activity in the presence of SO2 and water vapor (Cha et al., 2016; Chen et al., 2016; Wang et al., 2016).
SO2 and water vapor were removed from the feed gas and the denitration efficiency was measured over time. These corresponding results are shown in Figure 8. Obviously, the denitration efficiency of both the 0.1VP(0.2)O/Ti and 0.1VP(0.2)O-Cr(0.01)-PEG(1 × 10⁻⁴)/Ti catalysts gradually recovered to the level observed when SO2 was absent from the feed gas after 40 min. It could be concluded that the decreased catalytic activity of 0.1VP(0.2)O/Ti and 0.1VP(0.2)O-Cr(0.01)-PEG(1 × 10⁻⁴)/Ti was not due to the sulfation of active components and the surface deposition of ammonium sulfate, because the sulfation of active components is irreversible and the decomposition temperature of ammonium sulfate is about 280°C.
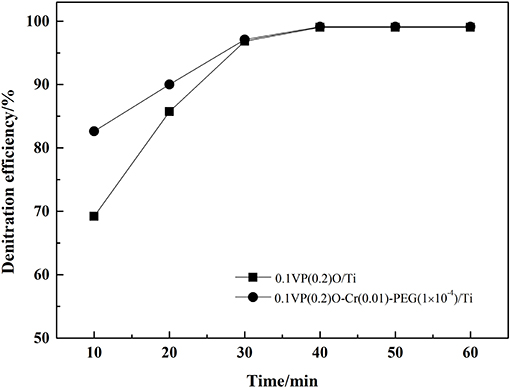
Figure 8. Denitration efficiency of catalyst after remove SO2 and water vapor in feed gas.
The reason for these experimental results may be that parts of ammonia react with SO2 and water vapor in the stainless steel tube located between preheater and reactor. Accordingly, the amount of ammonia reacted with NOx in the reactor is insufficient, which lead to the decrease of denitration efficiency. If this is the case, the denitration efficiency would increase as the ammonia concentration increases. Keeping the concentration of other gas constant as the situation presented in Figure 7, the denitration efficiency vs. NH3 concentration was tested with SO2 and water vapor in the feed gas, and corresponding results are present in Figure 9. Obviously, the denitration efficiency increases as NH3 concentration increases with SO2 and water vapor in the feed gas. When the concentration of NH3 was above 700 ppm, the denitration efficiency over 0.1VP(0.2)O-Cr(0.01)-PEG(1 × 10⁻⁴)/Ti is almost the same as that without SO2 and water vapor in the feed gas. The denitration efficiency of 0.1VP(0.2)O/Ti reaches 98.3% when the NH3 concentration is above 0.08 vol.%.
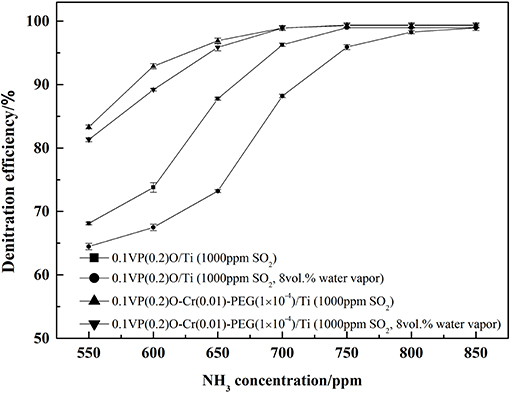
Figure 9. Effect of NH3 concentration on the denitration efficiency in the presence of SO2 and water vapor.
In order to further confirm the above inference, the stainless steel tube between the preheater and the reactor was heated to 120°C by an electric heating belt, and the NH3-SCR deNOx activity of catalysts was tested in the presence of SO2 and water vapor. The generation of ammonium sulfite in the stainless steel tube could be restrained by electric heating belt because the decomposition temperature of ammonium sulfite is about 60°C. The experimental results in Figure 10 show that the denitration efficiency of 0.1VP(0.2)O-Cr(0.01)-PEG(1 × 10⁻⁴)/Ti is almost the same as that without SO2 and water vapor in the feed gas. Moreover, the denitration efficiency did not decrease after 20 h of testing.
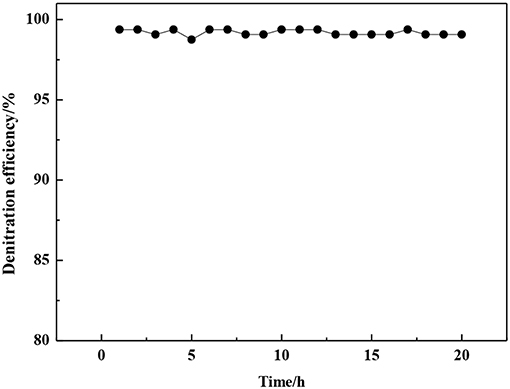
Figure 10. Effects of SO2 and water vapor on denitration efficiency of 0.1VP(0.2)O-Cr(0.01)-PEG(1 × 10⁻⁴)/Ti catalyst.
BET Surface Area of Catalysts
The BET surface areas of the VPO catalysts are displayed in Table 1. It can be seen from Table 1 that Cr doping and PEG could increase the surface area of the VPO/Ti catalyst. The surface area of 0.1VP(0.2)O/Ti is about 171 m2/g, while that of 0.1VP(0.2)O-Cr(0.01)-PEG(1 × 10⁻⁴)/Ti is about 217 m2/g. A similar tendency was observed by Wang and Balaganapathi (Wang et al., 2003; Balaganapathi et al., 2016). PEG could reduce the surface energy during the nucleation process of the active component, which is favorable for uniform nucleation and inhibits the growth of the crystal particle. Meanwhile, PEG decomposes during the calcination of catalysts, and micropores are formed in the catalysts. Accordingly, the surface area of VPO/Ti increases by adding PEG during preparation.
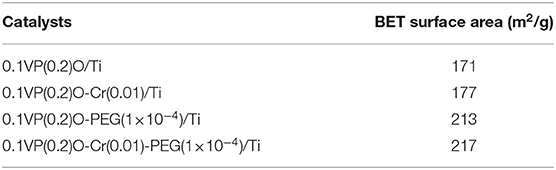
Table 1. BET surface area of catalysts.
Competitive adsorption of water molecules and NOx on the catalyst decreases the denitration efficiency. The adsorption-desorption balance of water vapor exists on the surface of the catalysts at any temperature. Parts of active sites on the catalyst are occupied by water vapor, which inhibits the adsorption of other reactants. Cr doping and PEG increase the surface area and the number of unoccupied active sites on the VPO catalysts in the presence of water vapor, which enhances the water vapor resistance of the VPO catalysts. The BET results are in agreement with the activity tests in Section Influence of water vapor and SO2 on catalytic activity.
XPS Analysis
The chemical state and atomic concentration of elements on the surface of the catalysts were investigated by XPS. The characterization results are shown in Figure 11 and Table 2. Figure 11A shows that the Ti2p spectra of both 0.1VP(0.2)O/Ti and 0.1VP(0.2)O-Cr(0.01)-PEG(1 × 10⁻⁴)/Ti could be fitted by two peaks corresponding to Ti 2p1/2 at 464.5 eV and Ti 2p3/2 at 458.8 eV (Reddy et al., 2006). The binding energy centered at 464.5 and 458.8 eV correspond to Ti4+. Obviously, Cr doping and PEG have little effect on the binding energy of Ti 2p1/2 and Ti 2p3/2 in the 0.1VP(0.2)O/Ti catalyst.
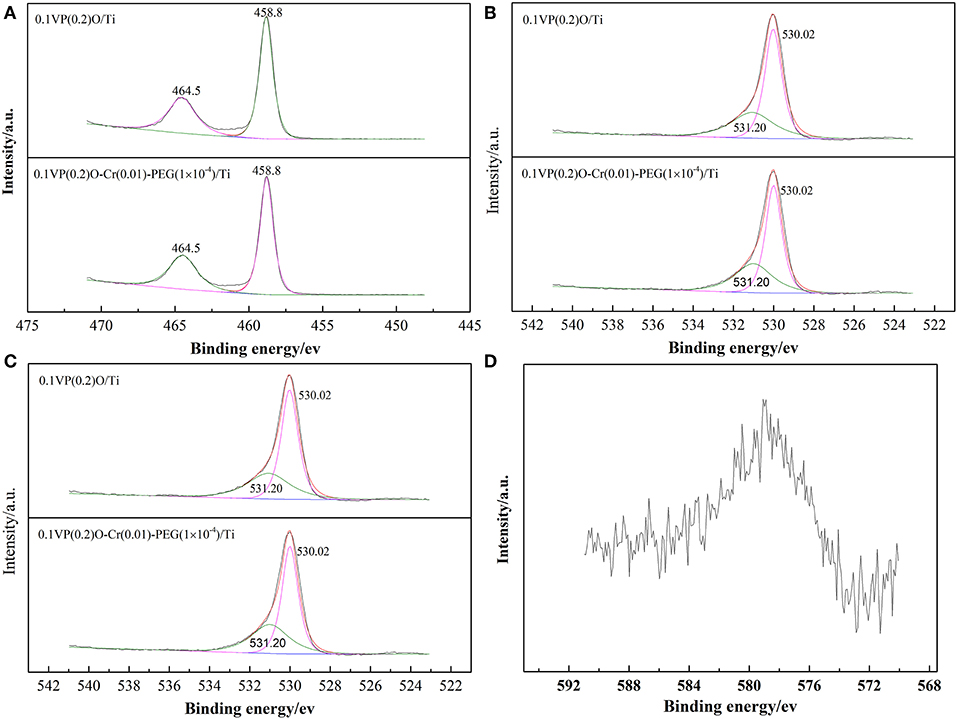
Figure 11. XPS spectra of catalysts (A) Ti 2p (B) O 1s (C) V 2p (D) Cr 2P.
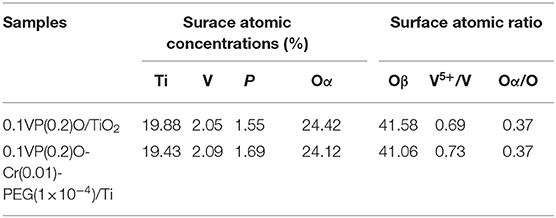
Table 2. Element content of catalysts.
Figure 11B indicates that the overlapped O 1s peak could be fitted by two peaks at 530.02 and 531.2 eV, which represent lattice oxygen Oβ and surface chemisorbed oxygen Oα, respectively (Larachi et al., 2002). Obviously, the binding energies of Oβ and Oα on the surface of 0.1VP(0.2)O-Cr(0.01)-PEG(1 × 10⁻⁴)/Ti is almost the same as that of 0.1VP(0.2)O/Ti. Moreover, the relative fractions of Oα in 0.1VP(0.2)O/Ti and 0.1VP(0.2)O-Cr(0.01)-PEG(1 × 10⁻⁴)/Ti are about 0.37.
Figure 11C shows the V 2p XPS spectra of 0.1VP(0.2)O/Ti and 0.1VP(0.2)O-Cr(0.01)-PEG(1 × 10⁻⁴)/Ti. The binding energies centered at 517.25 and 516.25 eV correspond to V5+ and V4+, respectively (Abon and Volta, 1997; Bayati et al., 2010). Although the binding energy of 0.1VP(0.2)O/Ti showed almost no shift after Cr doping, the molar ratio of V5+ to V4+ in 0.1VP(0.2)O-Cr(0.01)-PEG(1 × 10⁻⁴)/Ti is higher than that of 0.1VP(0.2)O/Ti. The relative percentage of V5+ is 0.69 in 0.1VP(0.2)O/Ti and 0.73 in 0.1VP(0.2)O-Cr(0.01)-PEG(1 × 10⁻⁴)/Ti. Cr doping promotes the formation of V5+ (VOPO4) and the oxidation of NO to NO2, which is favorable for low-temperature SCR activity (Volta, 2001; Taufiq-Yap et al., 2010). An appropriate amount of redox-coupled V5+ and V4+ also promotes the catalytic activity of the VPO catalyst (Centi, 1993; Stakheev et al., 2015; Ren et al., 2016; Salazar et al., 2016).
Figure 11D shows the Cr 2p XPS spectra of 0.1VP(0.2)O-Cr(0.01)-PEG(1 × 10⁻⁴)/Ti. The overlapped peaks at 576–580 eV could be assigned to Cr (Ren et al., 2016). The mixed peaks in Figure 11D are difficult to deconvolute, as the Cr content is relatively low.
NH3-IR Analysis
FT-IR spectroscopy was used to analyze the surface acidity of 0.1VP(0.2)O/Ti and 0.1VP(0.2)O-Cr(0.01)-PEG(1 × 10⁻⁴)/Ti due to ammonia adsorption. Figure 12 shows the spectrum of the adsorbed NH3 species on the surface of the two catalysts. The band centered at 1,401 cm−1 is ascribed to N-H bending vibrations in chemisorbed NH3 on Brønsted acid sites, while the bands centered at 1,619 cm−1 are assigned to on Lewis acid sites.
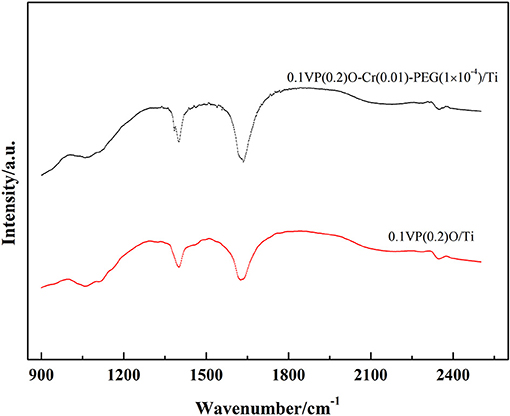
Figure 12. NH3-IR spectra of catalysts.
As Figure 12 shows, the addition of PEG and Cr to VPO/Ti could strengthen the intensity of the Brønsted acid sites and Lewis acid sites. This could be explained as follows: as the surface area of 0.1VP(0.2)O/Ti increases by adding PEG and Cr, the number of exposed surface acid sites also increases. Meanwhile, Cr doping leads to phosphorus deposition on the surface of 0.1VP(0.2)O-Cr(0.01)-PEG(1 × 10⁻⁴)/Ti, which could promote the formation of a Brønsted acid (P-OH). Moreover, the addition of Cr in VPO/Ti could increase the amount of V5+ and Lewis acid sites. A similar tendency was also observed by Pierini (Pierini and Lombardo, 2005a,b).
Brønsted acid sites on the catalyst are widely recognized as active sites for NH3-SCR deNOx. The NH3-IR results in Figure 12 are in good agreement with the activity tests in Figure 2. Furthermore, 0.1VP(0.2)O-Cr(0.01)-PEG(1 × 10⁻⁴)/Ti with strong surface acidity could restrain the surface adsorption of SO2. The NH3-IR spectrum further confirms the experimental results in Section Influence of SO2 on catalytic activity and Section Influence of water vapor and SO2 on catalytic activity.
FT-IR Spectra
Figure 13 shows the FTIR spectra of 0.1VP(0.2)O-Cr(0.01)-PEG(1 × 10⁻⁴)/Ti with/without SO2 and water vapor in the feed gas after the activity test. The characteristic peak centered at 502 cm−1 is attributed to symmetric stretching vibrations in TiO2. The band at around 1,053 cm−1 is ascribed to asymmetric stretching vibrations of V5+ = O. The band at 1,382 cm−1 is attributed to nitrate. The bands around 1,450, 1,631, and 3,432 cm−1 could be attributed to NH3, an -OH group, and H2O, respectively. The bands centered at 2,852 and 2,923 cm−1 are ascribed to symmetric stretching and asymmetric stretching vibrations in methylene, respectively. Obviously, nearly no difference was observed in the FT-IR spectra for 0.1VP(0.2)O-Cr(0.01)-PEG(1 × 10⁻⁴)/Ti after activity test with/without SO2 and water vapor in feed gas. Moreover, the FT-IR spectra also indicate that no sulfate formed on the surface of catalyst after the activity test. The 0.1VP(0.2)O-Cr(0.01)-PEG(1 × 10⁻⁴)/Ti shows excellent resistance to SO2 and water vapor (Figure 10), which is further confirmed by the FT-IR spectra.
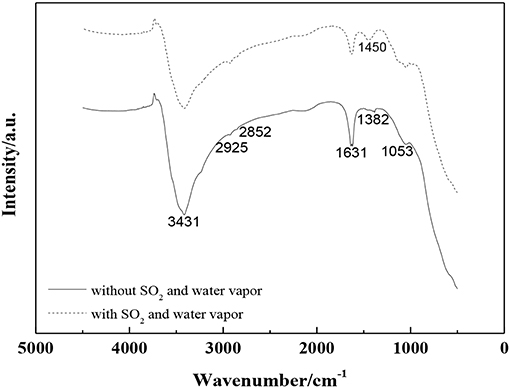
Figure 13. FT-IR spectra of catalyst.
Thermogravimetric Analysis (TG)
The TG curves of 0.1VP(0.2)O-Cr(0.01)-PEG(1 × 10⁻⁴)/Ti before and after the activity test with SO2 and water vapor in the feed gas were present in Figure 14. Obviously, water is lost in the temperature range 25–90°C before and after the activity test. Figure 14 The bound water linked to phosphate groups is lost in the temperature range 70–130°C, and that linked to Cr3+ and VO3+ is lost between 150 and 250°C. Furthermore, mass was lost in the 300–620°C temperature range for both catalysts. This loss could be ascribed to water being coordinated to Cr in the catalysts.
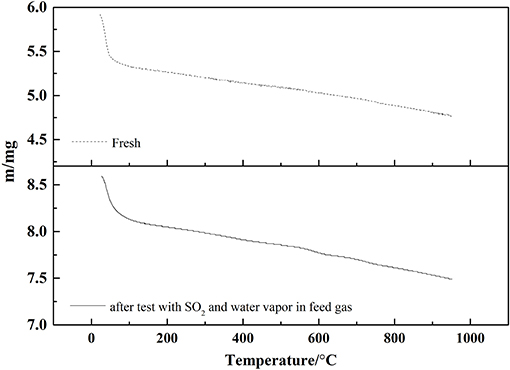
Figure 14. TG curve of catalyst before and after test.
Compared to the 0.1VP(0.2)O-Cr(0.01)-PEG(1 × 10⁻⁴)/Ti catalyst before the activity test, no accelerated mass loss in the range 200–400°C was observed in the TG curves for the 0.1VP(0.2)O-Cr(0.01)-PEG(1 × 10⁻⁴)/Ti catalyst after the activity test. Ammonium sulfate decomposes at a temperature of 230°C, and ammonium bisulfate decomposes at a temperature of 350°C. The TG results further confirmed that there are no ammonium sulfate and ammonium bisulfate deposited on the 0.1VP(0.2)O-Cr(0.01)-PEG(1 × 10⁻⁴)/Ti, which is consistent with the FTIR results shown in Figure 10. This could be explained as follows: SO2 adsorption on the surface of 0.1VP(0.2)O-Cr(0.01)-PEG(1 × 10⁻⁴)/Ti was restrained because of the strong surface acidity of catalysts. Meanwhile, SO2 is hardly to be oxidize to SO3 in the gas phase without catalyst. The ammonium sulfite generated by reaction of SO2 with NH3 is thermally unstable at a reaction temperature of 200°C.
Conclusion
A low-temperature SCR de-NOx catalyst 0.1VP(0.2)O-Cr(0.01)-PEG(1 × 10⁻⁴)/Ti was developed and the effects of SO2 and water vapor on the catalytic activity of catalyst were investigated. The activity test results show that the denitration efficiency over 0.1VP(0.2)O-Cr(0.01)-PEG(1 × 10⁻⁴)/Ti was above 98% at temperatures in the range 150–350°C. Cr doping increases the molar ratio of V5+ to V4+ on the VPO catalyst, which promote oxidation of NO to NO2 and catalytic activity of the VPO catalyst. An appropriate amount of redox-coupled V5+/V4+ promotes the catalytic activity of the VPO catalyst. The addition of Cr increases Brønsted acid (P-OH) and Lewis acid sites around V5+ on the VPO catalysts. The NH3-IR spectra show that the intensity of the Brønsted acid (P-OH, V-OH) and Lewis acid of the VPO catalyst increases after Cr doping. 0.1VP(0.2)O-Cr(0.01)-PEG(1 × 10⁻⁴)/Ti catalyst with strong surface acidity could restrain the SO2 adsorption and the oxidation of SO2 on the catalyst. SO2 had little effect on the catalytic activity of 0.1VP(0.2)O-Cr(0.01)-PEG(1 × 10⁻⁴)/Ti. Characterization (FTIR, TG) results indicate that there was no ammonium sulfate deposited on the surface of 0.1VP(0.2)O-Cr(0.01)-PEG(1 × 10⁻⁴)/Ti and the active components of 0.1VP(0.2)O-Cr(0.01)-PEG(1 × 10⁻⁴)/Ti were not sulfated in the presence of SO2 in feed gas. Generally, competitive adsorption of water molecules and reactant on the active site decreases the catalytic activity of low temperature NH3-SCR denitration catalyst. The addition of Cr and PEG increase the surface area and the unoccupied active sites in the VPO catalysts in the presence of water vapor, which enhance the water vapor resistance of the VPO catalysts. The low-temperature SCR deNOx catalyst 0.1VP(0.2)O-Cr(0.01)-PEG(1 × 10⁻⁴)/Ti shows high catalytic activity and exhibits good resistance to SO2 and water vapor.
Data Availability Statement
All datasets generated for this study are included in the article/supplementary material.
Author Contributions
YJ, JJ, and JY was mainly responsible for the preparation and testing of catalysts. LG is mainly responsible for the characterization of catalysts. MG, YZ, and YC put forward their opinions on the grammar and structure of the whole paper.
Funding
This work was financially supported by the Major National R&D projects of China (2017YFB0601805) and Natural Science Foundation for the Higher Education Institutions of Anhui Province of China (KJ2019A0079).
Conflict of Interest
The authors declare that the research was conducted in the absence of any commercial or financial relationships that could be construed as a potential conflict of interest.
References
Abon, M., and Volta, J. C. (1997). Vanadium phosphorus oxides for N-butane oxidation to maleic anhydride. Appl. Catal. A Gen. 157, 173–193. doi: 10.1016/S0926-860X(97)00016-1
Andreoli, S., Deorsola, F. A., Galletti, C., and Pirone, R. (2015). Nanostructured MnOx catalysts for low-temperature NOx SCR. Chem. Eng. J. 278, 174–182. doi: 10.1016/j.cej.2014.11.023
Bagnasco, G., Ciambelli, P., Ginestra, A. L., and Turco, M. (1990). Determination of the surface acidity of layered metal phosphates by NH3 temperature-programmed desorption. Thermoch. Acta 162, 91–97. doi: 10.1016/0040-6031(90)80330-2
Balaganapathi, T., Kaniamuthan, B., and Vinoth, S. (2016). PEG assisted synthesis of porous TiO2 using sol-gel processing and its characterization studies. Mater. Chem. Phys. 189, 50–55. doi: 10.1016/j.matchemphys.2016.12.016
Bayati, M. R., Golestani-Fard, F., and Moshfegh, A. Z. (2010). Photo-degradation of methelyne blue over V2O5 –TiO2, nano-porous layers synthesized by micro arc oxidation. Catal. Lett. 134, 162–168. doi: 10.1007/s10562-009-0231-5
Benziger, J. B., Guliants, V., and Sundaresan, S. (1997).New precursor to vanadium phosphorus oxide catalysts. Catal. Today 33, 49–56. doi: 10.1016/S0920-5861(96)00135-6
Bond, G. C. (1991). Vanadium oxide monolayer catalysts preparation, characterization and catalytic activity. Appl. Catal. 71, 1–31. doi: 10.1016/0166-9834(91)85002-D
Busca, G., Centi, G., Trifirò, F., and Lorenzelli, V. (1986). Surface acidity of vanadyl pyrophosphate, active phase in n-butane selective oxidation. J. Phys. Chem. 90, 1337–1344. doi: 10.1021/j100398a026
Busca, G., Lietti, L., Ramis, G., and Berti, F. (1998). Chemical and mechanistic aspects of the selective catalytic reduction of NOx, by ammonia over oxide catalysts: a review. Appl. Catal. B Environ. 18, 1–36. doi: 10.1016/S0926-3373(98)00040-X
Centi, G. (1993). Vanadyl pyrophosphate - a critical overview. Catal. Today 16, 5–26. doi: 10.1016/0920-5861(93)85002-H
Cha, W., Ehrman, S. H., and Jurng, J. (2016). CeO2 added V2O5/TiO2 catalyst prepared by chemical vapor condensation (CVC) and impregnation method for enhanced NH3-SCR of NOx at low temperature. J. Environ. Chem. Eng. 4, 556–563. doi: 10.1016/j.jece.2015.10.033
Chen, W. S., Luo, J., Qin, L. B., and Han, J. (2015).Selective autocatalytic reduction of NO from sintering flue gas by the hot sintered ore in the presence of NH3. J. Environ. Manage. 164, 146–150. doi: 10.1016/j.jenvman.2015.09.001
Chen, Y., Zhang, Z. T., Liu, L. L., Mi, L., and Wang, X. D. (2016). In situ DRIFTS studies on MnOx nanowires supported by activated semi-coke for low temperature selective catalytic reduction of NOx with NH3. Appl. Surf. Sci. 366, 139–147. doi: 10.1016/j.apsusc.2016.01.052
Feng, X. Z., Yao, Y., Su, Q., Zhao, L., and Jiang, W. (2015).Vanadium pyrophosphate oxides: the role of preparation chemistry in determining renewable acrolein production from glycerol dehydration. Appl. Catal. B Environ. 164, 31–39. doi: 10.1016/j.apcatb.2014.08.049
Gamrat, S., Poraj, J., Bodys, J., Smolka, J., and Adamczyk, W. (2016). Influence of external flue gas recirculation on gas combustion in a coke oven heating system. Fuel. Process. Technol. 152, 430–437. doi: 10.1016/j.fuproc.2016.07.010
Larachi, F., Pierre, J., Adnot, A., and Bernis, A. (2002). Ce 3d XPS study of composite Cex Mn1-xO2-y wet oxidation catalysts. Appl. Surf. Sci. 195, 236–250. doi: 10.1016/S0169-4332(02)00559-7
Li, X., Zhang, C., Zhang, X. P., Li, W., Tan, P., Ma, L., et al. (2018). Study on improving the SO2 tolerance of low-temperature SCR catalysts using zeolite membranes: NO/SO2 separation performance of aluminogermanate membranes. Chem. Eng. J. 335, 483–490. doi: 10.1016/j.cej.2017.10.184
Melánová, K., Beneš, L., VlcEk, M., Patrono, P., and Massucci, M. A. (1999). Preparation and characterization of vanadyl phosphates modified with two trivalent metal cations. Mater. Res. 34, 895–903. doi: 10.1016/S0025-5408(99)00086-0
Niu, Y. Q., Shang, T., Hui, S., Zhang, X. L., Lei, Y., Lv, Y., and Wang, S. (2016). Synergistic removal of NO and N2O in low temperature SCR process with MnOx/Ti based catalyst doped with Ce and V. Fuel 185, 316–322. doi: 10.1016/j.fuel.2016.07.122
Phil, H. H., Reddy, M. P., Kumar, P. A., Ju, L. K., and Hyo, J. S. (2008). SO2 resistant antimony promoted V2O5/TiO2 catalyst for NH3-SCR of NOx at low temperatures. Appl. Catal. B Environ. 78, 301–308. doi: 10.1016/j.apcatb.2007.09.012
Pierini, B. T., and Lombardo, E. A. (2005a). Structure and properties of Cr promoted VPO catalysts. Mater. Chem. Phys. 92, 197–204. doi: 10.1016/j.matchemphys.2005.01.009
Pierini, B. T., and Lombardo, E. A. (2005b). Cr, Mo and W used as VPO promoters in the partial oxidation of n-butane to maleic anhydride. Catal. Today 107, 323–329. doi: 10.1016/j.cattod.2005.07.084
Reddy, B. M., Rao, K. N., and Reddy, G. K. (2006). Characterization and catalytic activity of V2O5/Al2O3-TiO2 for selective oxidation of 4-methylanisole. J. Mol. Catal. A Chem. 253, 44–51. doi: 10.1016/j.molcata.2006.03.016
Ren, Z., Xu, X., Wang, X., Gao, B., and Yue, Q. (2016). FTIR, Raman, and XPS analysis during phosphate, nitrate and Cr(VI) removal by amine cross-linking biosorbent. J. Colloid Interface Sci. 468, 313–323. doi: 10.1016/j.jcis.2016.01.079
Salazar, M., Hoffmann, S., Singer, V., Becker, R., and Grünert, W. (2016). Hybrid catalysts for the selective catalytic reduction (SCR) of NO by NH3. On the role of fast SCR in the reaction network. Appl. Catal. B Environ. 199, 433–438. doi: 10.1016/j.apcatb.2016.06.043
Stakheev, A. Y., Mytareva, A. I., Bokarev, D. A., Baeva, G. N., and Krivoruchenko, D. S. (2015). Combined catalytic systems for enhanced low-temperature NO x, abatement. Catal. Today 258, 183–189. doi: 10.1016/j.cattod.2015.05.023
Taufiq-Yap, Y. H., Theam, K. L., and Hutchings, G. J. (2010). The effect of Cr, Ni, Fe, and Mn dopants on the performance of hydrothermal synthesized vanadium phosphate catalysts for n-butane oxidation. Petrol. Sci. Technol. 28, 997–1012. doi: 10.1080/10916460903058004
Volta, J. C. (2001). Site isolation for light hydrocarbons oxidation. Top. Catal. 15, 121–129. doi: 10.1023/A:1016645508285
Wang, P., Sun, H., Quan, X., and Chen, S. (2016). Enhanced catalytic activity over MIL-100(Fe) loaded ceria catalysts for the selective catalytic reduction of NOx with NH3 at low temperature. J. Hazard. Mater. 301, 512–521. doi: 10.1016/j.jhazmat.2015.09.024
Wang, X., Xu, L., Chen, X., Ji, W., and Yan, Q. (2003). Novel modifications in preparing vanadium phosphorus oxides and their applications for partial oxidation of n-butane. J. Mol. Catal. A Chem. 206, 261–268. doi: 10.1016/S1381-1169(03)00422-9
You, X. C., Sheng, Z. Y., Yu, D. Q., Yang, L., Xiao, X., and Wang, S. (2017). Influence of Mn/Ce ratio on the physicochemical properties and catalytic performance of graphene supported MnOx-CeO2 oxides for NH3-SCR at low temperature. Appl. Surf. Sci. 423, 845–854. doi: 10.1016/j.apsusc.2017.06.226
Yu, C., Huang, B., Dong, L., Chen, F., and Liu, X. (2016). In situ FT-IR study of highly dispersed MnOx/SAPO-34 catalyst for low-temperature selective catalytic reduction of NOx by NH3. Catal. Today 281, 610–620. doi: 10.1016/j.cattod.2016.06.025
Zhang, M. Y., Li, C. T., and Qu, L. (2014). Catalytic oxidation of NO with O2 over FeMnOx/TiO2: effect of iron and manganese oxides loading sequences and the catalytic mechanism study. Appl. Surf. Sci. 300, 58–65. doi: 10.1016/j.apsusc.2014.02.002
Keywords: Cr doping, VPO, catalyst, low temperature, SCR de-NOx
Citation: Jia Y, Yang J, Jiang J, Gu M, Zhi Y, Guo L and Chen Y (2019) Investigation of the Effect of SO2 and H2O on VPO-Cr-PEG/TiO2 for the Low-Temperature SCR de-NOx. Front. Mater. 6:320. doi: 10.3389/fmats.2019.00320
Received: 17 September 2019; Accepted: 21 November 2019;
Published: 10 December 2019.
Edited by:
Yunfei Bu, Nanjing University of Information Science and Technology, ChinaReviewed by:
Li Yuntao, Chongqing University of Arts and Sciences, ChinaChenmin Xu, Nanjing Normal University, China
Copyright © 2019 Jia, Yang, Jiang, Gu, Zhi, Guo and Chen. This is an open-access article distributed under the terms of the Creative Commons Attribution License (CC BY). The use, distribution or reproduction in other forums is permitted, provided the original author(s) and the copyright owner(s) are credited and that the original publication in this journal is cited, in accordance with accepted academic practice. No use, distribution or reproduction is permitted which does not comply with these terms.
*Correspondence: Lina Guo, amlheW9uZzIwMDBAMTYzLmNvbQ==; NDc4MDU2Mjk2QHFxLmNvbQ==; Yihua Chen, MjM5ODc4MTMzMkBxcS5jb20=