 Yuefei Jia
 Liangbo Zhang1
 Peiyou Li
 Xindi Ma
 Yandong Jia
 Gang Wang
- 1Laboratory for Microstructures, Institute of Materials, Shanghai University, Shanghai, China
- 2School of Materials Science and Engineering, Shaanxi University of Technology, Hanzhong, China
Low-density refractory medium entropy alloys (NbTiVZr, Nb0.5TiVZr, and NbTiV) were produced by vacuum arc melting, then heat-treated at 1,200°C for 1 h, water quenched, and finally annealed at 500°C for 0.5 h. Their respective microstructures, elevated-temperature (600–1,000°C) mechanical properties, and thermal expansion behavior were then investigated. All the alloys are characterized by a BCC structure with a grain size of c. 85–135 μm. The results demonstrated that NbTiVZr alloy exhibits relatively high yield strength and specific strength at 600, 800, and 1,000°C. Moreover, a low coefficient of thermal expansion was also obtained for this alloy when the temperature was below 750°C. This study provides guidance for the engineering application of low-density refractory medium entropy alloys at elevated temperatures.
Introduction
High-entropy alloys (HEAs), a newly emerging class of alloys, have attracted extensive attention due to their stable microstructure and remarkable mechanical properties (Yeh et al., 2004; Gludovatz et al., 2014; Zhang et al., 2014; Miracle and Senkov, 2017; Lei et al., 2018; Yang et al., 2018; Ding et al., 2019; Mu et al., 2019; Wu et al., 2019). In the pioneering days of the development of HEAs, researchers attempted to seek single-phase solid-solution alloys that contain more than five principal elements in an equiatomic ratio or a near-equiatomic ratio (Yeh et al., 2004), such as the single-phase face-centered-cubic (FCC) Co20Cr20Fe20Mn20Ni20 (Cantor et al., 2004), body-centered-cubic (BCC) AlCoCrFeNi (Ma and Zhang, 2012), and hexagonal-close-packed (HCP) HoDyYGdTb (Yu et al., 2017) alloys. With the rapid development of the emerging alloys, different types of HEAs have been reported in recent years, i.e., high-entropy superalloys (Tsao et al., 2015), eutectic HEAs (Lu et al., 2014; Shi et al., 2019), light-weight HEAs (Yang et al., 2014; Youssef et al., 2015; Tseng et al., 2018a; Jia et al., 2019), and refractory HEAs (Senkov et al., 2011a, 2013; Yao et al., 2016; Tseng et al., 2018b; Ma et al., 2019; Nagase et al., 2019; Eleti et al., 2020). Through this research, it has been found that two systems of high-entropy alloys can be applied at high temperature. One is high-entropy alloys based on 3d-transition metal elements (Co, Cr, Cu, Fe, Mn, Ni, Ti, and V) (Gorsse et al., 2017); the other is high-entropy alloys composed of refractory elements with high melting points (Zr, Nb, Mo, Ta, W, Hf, Re, Ru, and Os) (Senkov et al., 2018). However, as a result of considerable reduction in their strength at high temperature, especially when the temperature is above 800°C, all of the available reported HEAs composed of 3d-transition metal elements manifested elevated-temperature properties that were inferior to those of the advanced Ni-based superalloys (Gorsse et al., 2017). Moreover, the relatively lower melting point of the alloys is another limitation for their application.
Refractory alloys are well-known for their great potential in elevated-temperature application fields on account of their high strength at elevated temperature (Satya Prasad et al., 2017). To our knowledge, refractory HEAs were first reported in 2010 by Senkov et al. (2010). They found that BCC MoNbTaW and MoNbTaVW refractory HEAs displayed excellent yield strength (~400 MPa) at 1,600°C (Senkov et al., 2010). However, their research also pointed out that their high densities (~13.75 g/cm3) and low compressive ductility (<3%) were the main drawbacks of these alloys (Senkov et al., 2010, 2011a) at room temperature. In the ensuing years, a large number of refractory HEAs were studied, such as the HfNbTaTiZr (Senkov et al., 2019a), MoNbTiVZr (Senkov et al., 2019a), AlNbTaTiV (Yang et al., 2012), and CrHfNbTiZr (Fazakas et al., 2014) alloys. However, these reported refractory HEAs also presented high density and low room-temperature ductility (Senkov et al., 2019a,b).
To reduce the density and improve the ductility, some researchers tried to remove some elements with high melting points on the basis of the components of refractory HEAs and developed the Nb-Ti-V-Zr refractory medium entropy alloys (RMEAs), which exhibited low density (~6.43 g/cm3) and high ductility (50%) when examined under room-temperature compression (Fazakas et al., 2014). These RMEAs with excellent comprehensive properties at room temperature are candidate materials for potential engineering application. To further expand the application of low-density and high-ductility MEAs at elevated temperature, the elevated-temperature mechanical properties, thermal expansion behaviors, and microstructures of heat-treated NbTiVZr, Nb0.5TiVZr, and NbTiV alloys were investigated systematically. This research can provide insight into the engineering application of the alloys at elevated temperatures.
Experimental Methods
The starting materials were Nb, Ti, V, Zr elements with high chemical purity (>99.95%). The NbTiVZr, Nb0.5TiVZr, and NbTiV alloys were synthesized as button-shaped ingots by an arc-melting technique under a high-purity argon atmosphere. To ensure homogeneous distribution of the elements, the samples were melted five times. All samples were then kept isothermal at 1,200°C for 1 h under a high vacuum, followed by quenching in water, and were then finally aged at 500°C for 0.5 h.
Slow-speed metal saw and wire cutting were used to obtain the samples needed for observing the microstructures and testing the mechanical properties of the heat-treated samples. The structures of the alloys were identified by X-ray diffraction (XRD, Rigaku D/ax-2550 diffractometer) with Cu-Kα radiation, using an operating voltage of 30 kV and a scanning speed of 4°/min. Standard metallographic techniques were applied, consisting of grinding up to 2000 grit with SiC paper and polishing with a colloidal silica suspension, and the samples were then etched with a mixed solution of HF, HNO3, and H2O; the corresponding volume ratio was 1:3:7. Microstructural characterization and chemical analysis were performed using a scanning electron microscope (SEM) equipped with an energy dispersive X-ray spectrometer (EDS) and electron probe microanalyzer (EPMA, 8050G).
The samples, which had a diameter of 2.0 mm and height of ~ 4.0 mm, were prepared for quasi-static uniaxial compression testing at 25, 600, 800, and 1,000°C, respectively, by using a CMT5105 electronic testing machine; five specimens were prepared for each testing temperature. The strain rate was 2.5 × 10⁻⁴ s−1. Before compression testing, the samples were heated to the scheduled temperatures and kept in that state for 20 min to achieve a stable temperature.
The thermal expansion tests were performed by using Quenching Dilatometer (DIL 805) equipment; the heating rate under argon was about 2°C/min and rate of cooling by nitrogen about 20°C/min. The measured samples were cuboid samples with a length of 10 mm, a width of 4 mm, and a thickness of 2 mm. The top and bottom of the specimens were polished to guarantee plane-parallel surfaces.
Results and Discussion
XRD Analysis of Alloys
Figure 1A shows the XRD patterns of the NbTiVZr, Nb0.5TiVZr, and NbTiV alloys. As can be clearly seen, the three alloys have a BCC structure. However, the grain orientations are different; the NbTiVZr alloy tends to the (110) and (211) crystal planes, the Nb0.5TiVZr alloy tends to the (110) crystal plane, and the NbTiV alloy tends to the (200) crystal plane. One of the important characteristics of high-entropy alloy, lattice distortion, is reflected in the energy spectrum of XRD such that the same crystal plane has different diffraction angles. In the three current alloys, the diffraction angle of the same crystal plane differs widely. To better observe the difference in diffraction angle, the angle of the first diffraction peak of the BCC structure is enlarged in Figure 1B. The diffraction peak of the (110) crystal plane shifts to lower angles between the three alloys. The interplanar spacing (d) can be calculated according to the Bragg equation. The d values of the (110) crystal plane for the NbTiVZr, Nb0.5TiVZr, and NbTiV alloys are 0.2265, 0.2311, and 0.2350 nm, respectively. The lattice parameter (a) can be calculated from Figure 1C, where (Nelson and Riley, 1945). Figure 1D shows the lattice parameters of the three alloys, and the data are a1 = 3.2059 Å (NbTiVZr), a2 = 3.2599 Å (Nb0.5TiVZr), and a3 = 3.3068 Å (NbTiV). The calculated results reflect that the NbTiV alloy possesses the largest unit cell volume, and the NbTiVZr alloy has the smallest volume.
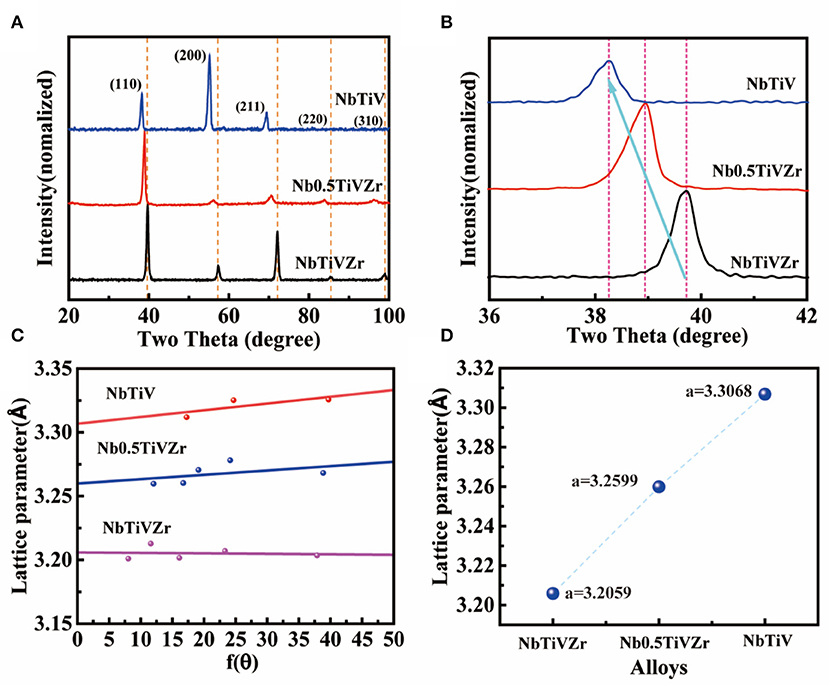
Figure 1. The XRD patterns and lattice parameter of NbTiVZr, Nb0.5TiVZr, and NbTiV alloys. (A) 20°-100°, (B) 36°-42°, (C) the relation between the a values and f (θ), and (D) the a values of the three alloys.
SEM Analysis of Alloys
Figure 2 shows SEM images of NbTiVZr, Nb0.5TiVZr, and NbTiV alloys homogenized at 1,200°C for 1 h, water quenched, and annealed at 500°C for 0.5 h. It can be found that the microstructures of the three alloys are composed of equiaxed grains. Figure 2a shows the microstructure of heat-treated NbTiVZr alloy; as can be seen, the grain boundaries are clear and the grain sizes are distinct. The small grain sizes are about 10 μm, whereas the large grain sizes are around 200–300 μm, as shown in Figures 2a,d. Compared with the NbTiVZr alloy, the distribution of grain size for the heat-treated Nb0.5TiVZr alloy is more uniform, with a mean grain size of about 87.6 μm, as shown in Figures 2b,e. The microstructure of the NbTiV alloy is similar to that of the NbTiVZr alloy, with a variation in grain size of about ~280 μm and an average grain size of about 132.6 μm, as demonstrated in Figures 2c,f.
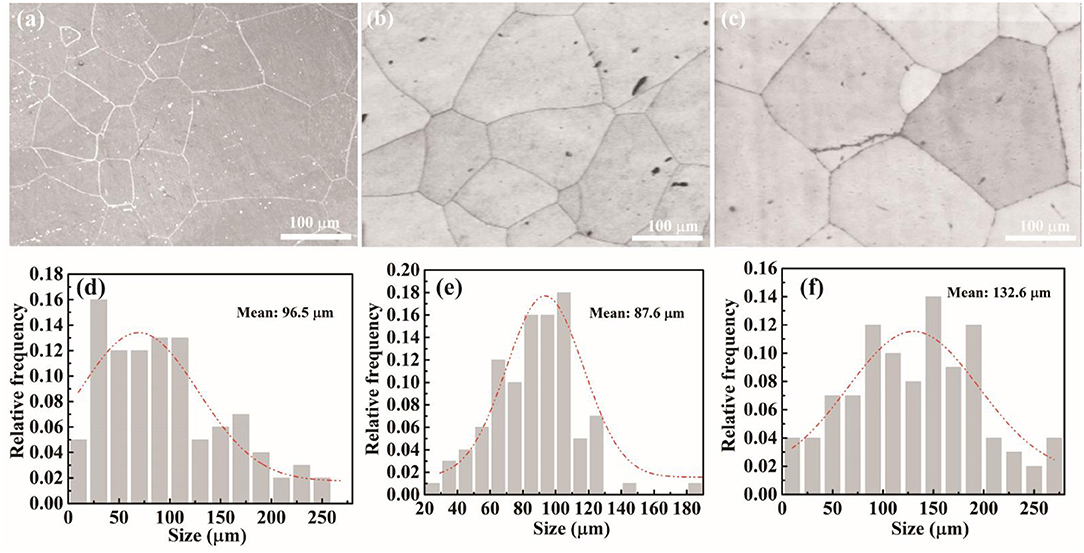
Figure 2. SEM images and corresponding grain size distributions. (a) SEM image of NbTiVZr, (b) SEM image of Nb0.5TiVZr, and (c) SEM image of NbTiV alloys, and (d) the grain size distribution of NbTiVZr alloy, (e) the grain size distribution of Nb0.5TiVZr alloy, and (f) the grain size distribution of NbTiV alloy.
Mechanical Properties of Alloys
Figure 3A shows the room- and elevated temperature (600, 800, and 1,000°C) engineering stress–strain curves of the NbTiVZr alloy. At room temperature, the NbTiVZr alloy shows a high yield strength (~967 MPa) and good ductility (engineering strain of nearly 50%). The yield strength of the NbTiVZr alloy tested at high temperature is lower than that tested at room temperature. The yield strength and the compressive strength are 878 and 1,167 MPa at 600°C, respectively. The strength can reach 750 MPa, maintain that for a short time, then decrease to 500 MPa when the temperature rises to 800°C, which indicates that soft behavior can occur at high temperature. The specimen fractured with the engineering strain at 40%. Likewise, the strength can reach 500 MPa at 1,000°C and then decreases to 200 MPa. However, there is no sign of fracture, even when the engineering strain is larger than 50%.
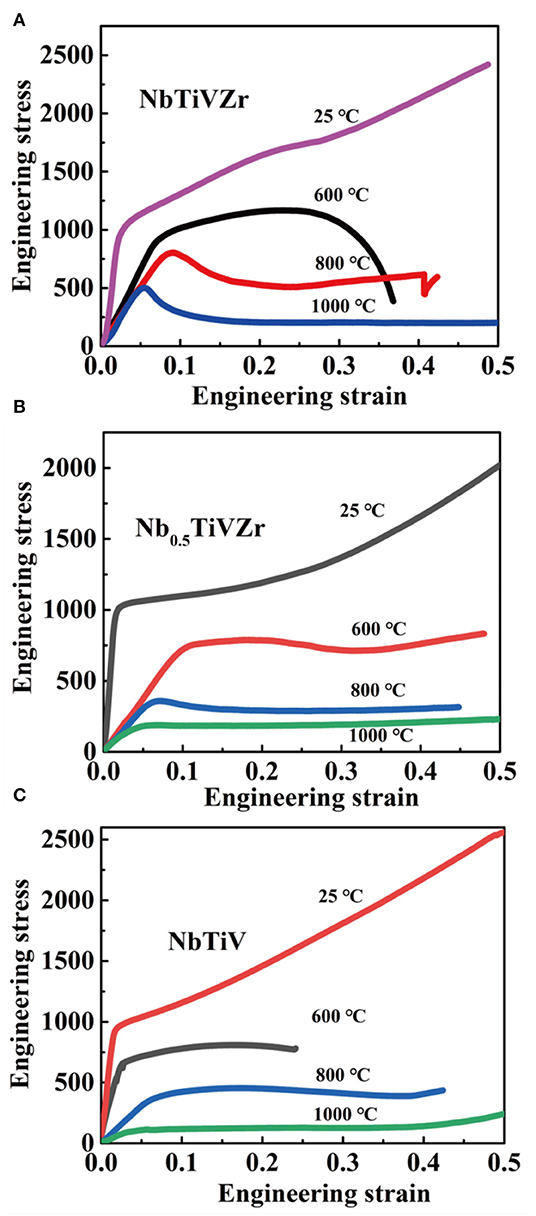
Figure 3. Engineering stress–strain curves of (A) NbTiVZr, (B) Nb0.5TiVZr, and (C) NbTiV alloys compressed at the different temperatures.
Figure 3B shows the engineering stress–strain curves of the Nb0.5TiVZr alloy. At room temperature, the alloy also shows high yield strength (1,025 MPa) and good ductility (>50%). With an increase in temperature, the yield strength of the alloy decreases correspondingly. When the temperature is 600°C, the yield strength and ultimate compression strength decrease to 750 and 787 MPa, respectively. When the temperature rises to 800°C, the yield strength of the alloy decreases to 358 MPa. The stress is then ~300 MPa when the engineering strain is larger than 10%. At 1,000°C, the Nb0.5TiVZr alloy shows a low yield strength of 186 MPa; the sample can maintain this strain for a long time.
Figure 3C shows the engineering stress–strain curves of the NbTiV alloy. At room temperature, the yield strength of the NbTiV alloy (960 MPa) is lower than that of the NbTiVZr alloy; however, the ductility of the NbTiV alloy is similar to that of the NbTiVZr alloy. When the temperature is raised to 600°C, the yield strength and compression strength are 650 and 750 MPa, respectively. Meanwhile, the alloy fractured when the engineering strain was about 25%. When the temperature rises to 800°C, the yield strength can reach 400 MPa; the stress decreases when the strain is higher than 15%. With further increase in temperature (1,000°C), the yield strength decreases to 110 MPa.
It is found that the yield strength of the Nb0.5TiVZr alloy is slightly higher than those of the NbTiVZr and NbTiV alloys at room temperature. According to Figure 2, the average grain size of Nb0.5TiVZr alloy is relatively small. On the contrary, the NbTiVZr alloy has higher elevated-temperature strength in terms of high-temperature mechanical properties. This is due to the high melting point of NbTiVZr alloy and may even be related to the high mixing entropy and sluggish diffusion effect of the alloy. Simultaneously, the NbTiVZr alloy presents a remarkable work-hardening phenomenon at 600°C that is not possessed by the other two alloys. Thus, the NbTiVZr alloy has greater engineering application value, especially at 600°C.
To further study the relationship between yield strength at different temperatures and the composition of the three alloys, a bar graph is plotted in Figure 4A. The Nb0.5TiVZr alloy shows higher yield strength at room temperature compared with the two other alloys. The NbTiVZr alloy shows the highest yield strength at 600°C while the NbTiV alloy shows the lowest yield strength. At 800°C, the difference in yield strength among the three alloys is very obvious. The NbTiVZr alloy still maintains a high yield strength of nearly 800 MPa. However, the yield strengths of the Nb0.5TiVZr and NbTiV alloys decrease to 400 MPa. At 1,000°C, the NbTiVZr alloy still shows a high yield strength (500 MPa). However, those of the Nb0.5TiVZr and NbTiV alloys are below 200 MPa.
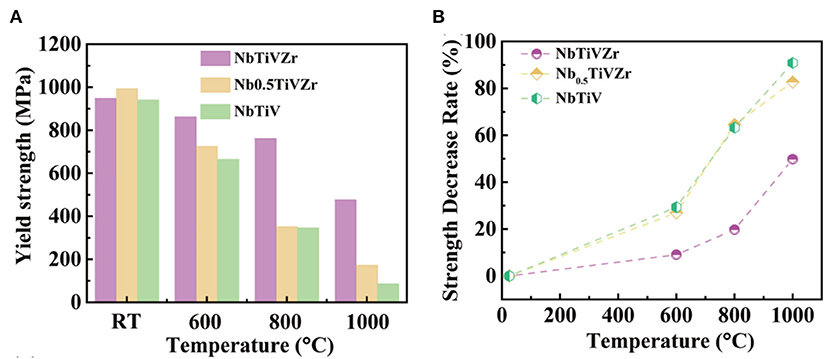
Figure 4. Relationship between yield strength, strength change rate, and temperature for the NbTiVZr, Nb0.5TiVZr, and NbTiV alloys. (A) Yield strength vs. temperature and (B) strength change rate vs. temperature.
Figure 4B shows the variation in the yield strength for the three alloys as temperature increases. The change rate of yield strength (Rys) reflects the sensitivity of yield strength to temperature.
where Srt means that the room-temperature yield strength, Sti represents the yield strength at temperature ti, such as 25, 600, 800, and 1,000°C. In Figure 4B, it can be found that the decrease rate of strength increases with the increase in temperature. Obviously, the NbTiVZr alloy has the lowest Rys values at elevated temperatures, compared with the other two alloys. The Nb0.5TiVZr and NbTiV alloys have similar Rys values at 600°C (30%) and 800°C (65%). At 1,000°C, there is a little difference: 85% for the Nb0.5TiVZr alloy and 95% for the NbTiV alloy. However, for the NbTiVZr alloy, the Rys values are about 15% at 600°C, 20% at 800°C, and 50% at 1,000°C. Compared with the Nb0.5TiVZr and NbTiV alloys, the NbTiVZr alloy is less sensitive to temperature, especially at 600 and 800°C. Therefore, the NbTiVZr alloy has the better high-temperature softening resistance and can be selected for structural components with excessive working.
Figures 5A,B show the room-temperature and elevated-temperature (600–1,000°C) yield strengths and specific yield strengths vs. temperature of NbTiVZr, Nb0.5TiVZr, and NbTiV alloys, compared with Inconel 718 and HfNbTaTiZr HEA. The NbTiVZr and Nb0.5TiVZr alloys have higher yield strength than does HfNbTaTiZr HEA (Senkov et al., 2011b; Tseng et al., 2018b) but lower yield strength than Inconel 718 (Thomas et al., 2006) when the temperature is below 600°C (see Figure 5A). When the temperature is higher than 600°C, the strengths of most alloys (listed in Figure 5) are decreased dramatically. However, the NbTiVZr alloy can maintain a high yield strength at 800°C and also has better resistance to softening at 1,000°C than HfNbTaTiZr HEA. When the temperature is above 600°C, the NbTiVZr alloy has the highest specific strength, as shown in Figure 5B. The Nb0.5TiVZr and NbTiV alloys have higher specific strength than HfNbTaTiZr HEA below 800°C because of their low densities, as shown in Figure 5B. However, the Inconel 718 shows higher specific strength at 600–800°C than the Nb0.5TiVZr and NbTiV alloys. As a whole, the NbTiVZr alloy has a good combination of properties for meeting the requirements of high-temperature application of engineering materials.
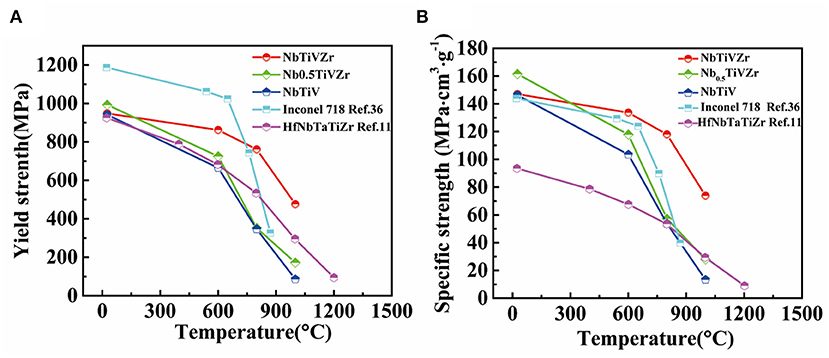
Figure 5. Temperature dependence of yield strength and specific yield strength for NbTiVZr, Nb0.5TiVZr, and NbTiV alloys, Inconel 718, and HfNbTaTiZr HEA. (A) Elevated-temperature yield strength vs. temperature and (B) elevated-temperature specific yield strength vs. temperature.
Solid-Solution-Strengthening of Alloys
From the experiment results, all of the alloys possess a single phase of BCC disordered solid solution. Thus, the high yield strengths of the alloys likely originate from solid-solution-strengthening. The solution-strengthening mechanism of RHEAs was proposed by Senkov et al. (2011b) and then modified by Yao et al. (2017). The solution-strengthening value Δσi contributed by element i can be calculated as follows (Senkov et al., 2011b; Yao et al., 2017):
where A is a material-dependent dimensionless constant of the order of 0.04, G is the shear modulus of the alloy, and fi is the mismatch parameter of element i related to shear modulus and atomic size (Senkov et al., 2011b; Yao et al., 2017):
where is the atomic modulus mismatch parameter and is the atomic size mismatch. The α value is a constant that depends on the type of mobile dislocation. The type of dislocation is a random mixture of edge and screw dislocations in most alloys, so the value of α was designated to be 9. The BCC crystal lattice has the eight nearest-neighbor atoms, thus forming a nine-atom cluster. In a high-entropy alloy, an element i can neighbor different elements, and the lattice distortion near this element is now a function of the atomic size and modulus mismatches between this element and all of its nearest neighbors (Senkov et al., 2011b; Yao et al., 2017):
Here, cj is the atomic fraction of an element j in the alloy, 9 is the number of atoms in the i-centered cluster in the BCC lattice, 8 is the number of atoms neighboring the central atom i, and δG,ij and δr,ij are the differences between elements i and j in terms of shear modulus and atomic radius, respectively, as determined by Equations (6) and (7),
where Gi and Gj are the shear modulus of elements i and j, respectively, and ri and rj are the atomic radii of elements i and j. The solid-solution-strengthening of the alloy Δσ is obtained by summation over Δσi of each constituent. The calculated yield stress is the summation of the yield stress, , by the rule of mixing and Δσ.
As the shear moduli of NbTiVZr, Nb0.5TiVZr, and NbTiV alloys are not yet known, the rule of mixing was used to calculate it.
The atomic radii (r), shear moduli (G), and yield strengths (σ0.2) of pure elements are given in Table 1, as are the calculated Δσ values of NbTiVZr, Nb0.5TiVZr, and NbTiV alloys. According to the results, the range of values for the NbTiVZr, Nb0.5TiVZr, and NbTiV alloys is about 248–259 MPa. However, the solution-strengthening values (Δσ) are different; the Nb0.5TiVZr alloy shows a higher solution-strengthening value than does the NbTiVZr alloy, which is coincident with the yield strengths obtained by experiment. In fact, the values are about 5–8 times the values. This means that the high yield strength of these alloys mainly comes from the solution-strengthening effect despite there being some deviation between the calculated values and experimental values.
Table 1. Atomic radius (r), shear modulus (G) and yield strength (σ0.2) of pure metals (Nb, Ti, V, Zr) as well as the calculated values () using the rule of mixing, solution-strengthening values (Δσ), and calculated yield strengths () of NbTiVZr, Nb0.5TiVZr, and NbTiV alloys.
Thermal Expansion of Alloys
Thermal expansion is the tendency of a material to change its shape, area, and volume in response to a change in temperature. Temperature is a monotonic function of the average molecular kinetic energy of a substance. When a substance is heated, the kinetic energy of its molecules increases. Thus, the molecules begin vibrating/moving more and usually maintain a greater average separation. The relative expansion (also called strain) divided by the change in temperature is termed the material's coefficient of thermal expansion and generally varies with temperature. The change in length measurements of an object due to thermal expansion is related to temperature change by a “coefficient of linear thermal expansion (αl).” The linear thermal expansion can be described as
The temperature dependences of ΔL/L0 for the NbTiVZr, Nb0.5TiVZr, and NbTiV alloys are plotted in Figure 6A. It clearly shows that ΔL/L0 is not linearly dependent on the temperature over the investigated temperature range from 25 to 1,200°C. The value of the coefficient of linear thermal expansion as a function of temperature is shown in Figure 6B and is obtained by differentiation of Equation (3):
Figure 6B shows the linear coefficients of thermal expansion as a function of temperature for the NbTiVZr, Nb0.5TiVZr, and NbTiV alloys, the pure metals (Ti, Zr, V, Nb) (Lu et al., 2005), CoCrFeMnNi HEA (Laplanche et al., 2015), and Inconel 718 Ni-based superalloy (Mannan and Patel, 2006). Below 600°C, the Nb0.5TiVZr alloy shows the lowest αl value and the CoCrFeMnNi HEA shows the highest αl value, as can be seen in Figure 6B. However, when the temperature is above 600°C, the αl value increases sharply. The αl values of the NbTiVZr and NbTiV alloys are relatively stable and are lower than the αl values CoCrFeMnNi HEA and Inconel 718 Ni-based superalloy until 750°C.
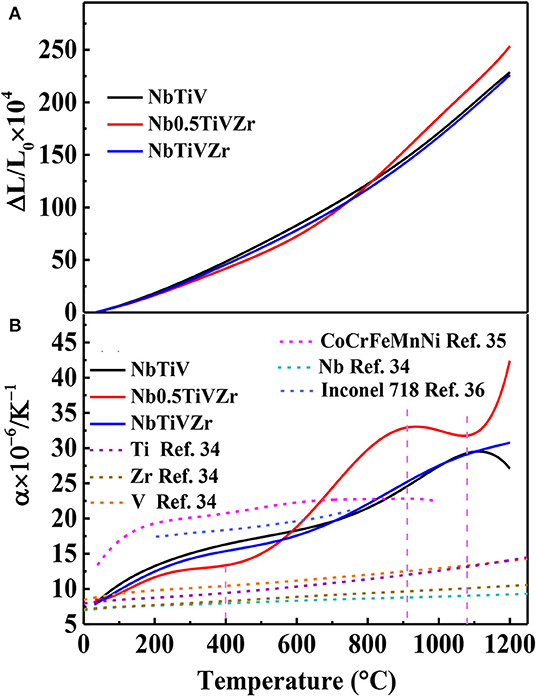
Figure 6. Thermal expansion data. (A) Relative change in specimen length ΔL/L0 of the NbTiV, Nb0.5TiVZr, and NbTiVZr alloys with temperature. (B) Coefficient of thermal expansion a as a function of temperature for NbTiV, Nb0.5TiVZr, and NbTiVZr alloys, Ti, Zr, V, and Nb pure metals, CoCrFeMnNi HEA, and Inconel 718 Ni-based superalloy.
It can be noticed that the coefficients of thermal expansion of the alloys increase with an increase in temperature, which can be attributed to unit cell expansion and the increase in lattice sites along with increasing temperature. The coefficients of thermal expansion are related to the average distance between atoms in the crystal lattice. The lattice vibration is intensified with an increase in temperature, and the average distance between atoms within the lattice is increased, which leads to the increased coefficients of thermal expansion (Xiaoge et al., 2016). Coefficients of thermal expansion generally decrease with increasing bond energy, which also has an effect on the melting point of solids; accordingly, materials with a high melting point are more likely to exhibit a low coefficient of thermal expansion (Chawla et al., 2006). The melting point of the NbTiVZr alloy (1,978°C) is lower than those of the Nb0.5TiVZr and NbTiV alloys (1,906 and 2,018°C, respectively), indicating that the αl value of the NbTiVZr alloy is smaller than those of the Nb0.5TiVZr and NbTiV alloys.
Microstructural Evolution at Elevated Temperatures (600, 800, and 1,000°C)
The NbTiVZr alloy has high strength and good ductility at room temperature, high yield strength at temperatures up to 1,000°C, and the lowest coefficient of thermal expansion compared with the Nb0.5TiVZr and NbTiV alloys. The NbTiVZr alloy has more potential for high-temperature application in engineering. Otherwise, the Nb0.5TiVZr and NbTiV alloys show very poor oxidation. Therefore, the NbTiVZr alloy is chosen for further study of microstructural evolution at elevated temperature.
Figure 7a shows the deformed microstructure of NbTiVZr alloy at 600°C. The grain boundaries (indicated by a yellow arrow) and subgrain boundaries (indicated by a white arrow) are observed in Figure 7a. The grain boundaries are clearly deeply etched, but a number of precipitated inner grains have disappeared due to etching, as shown in Figures 7a,b. The pit left by the precipitated phase can be used to estimate the size of the precipitates. The pits are marked in red and the matrix in blue in Figure 7c. The statistical result is shown in the graph inserted between Figures 7b,c. The size of the precipitates is 0.3–1.4 μm, concentrating in the range 0.3–0.6 μm.
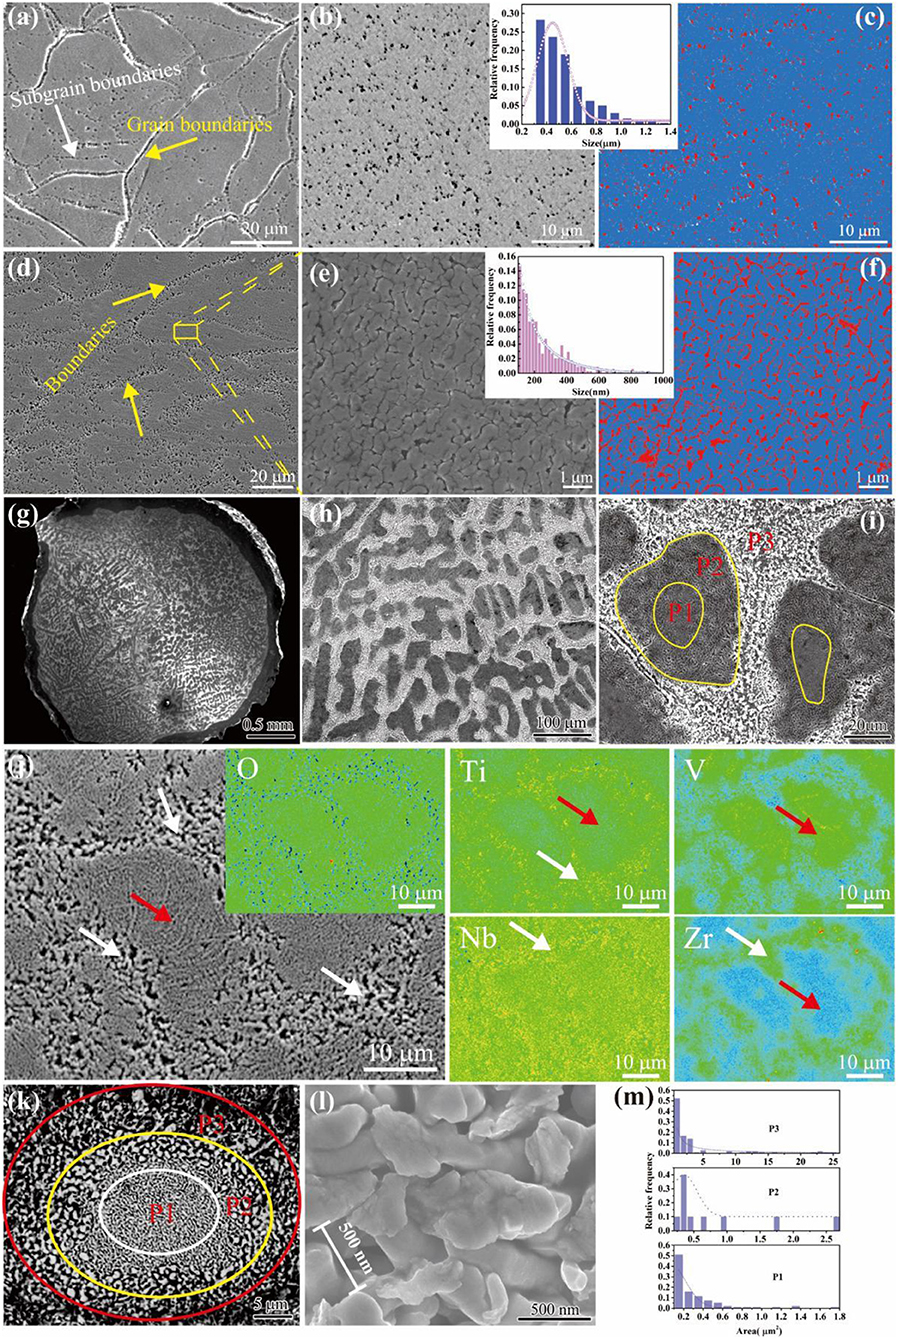
Figure 7. Microstructural evolution of NbTiVZr alloy at elevated temperature. (a–c) SEM images showing the deformed microstructure at 600°C; (d–f) SEM images showing the deformed microstructure at 800°C. (g–k) SEM images showing the deformed microstructure at 1000 °C; (m) the statistical results from (k). O, Ti, V, Nb, and Zr are the EPMA mapping images corresponding to the SEM image (j). (l) the enlarged image from P2.
Figures 7d–f show the deformed microstructure of NbTiVZr alloy at 800°C. The pits occur at the boundaries, as precipitates have been taken away by etching. It can be found that the grain boundaries are more numerous and are surrounded by an increasing number of precipitates as temperature is increased. For the inner grain, a relatively loose microstructure can also be found. The pore structure is obvious in Figure 7e. The pore structures of the inner grain are marked in red and the matrix in blue in Figure 7f. The size of the pore structures ranges from 100 nm to 1 μm, and most are about 100–200 nm, calculated through Figure 7f and shown in the graph inserted between Figures 7e,f.
Figures 7g–l show the deformed microstructure of NbTiVZr alloy at 1,000°C. It has a distinct microstructure composed of white and gray parts, as shown in Figure 7g. The white areas are interconnected, but the gray areas are divided by the white parts, as shown in Figure 7h. For the gray areas, fewer pores are found in the inner part. The microstructure can be divided into three parts: the compact inner part (labeled P1), the loose edge part (labeled P2), and the external white part (labeled P3). Figure 7j shows the high-magnification SEM image. The elements O, Ti, V, Nb, and Zr are represented in the EPMA mapping images corresponding to the SEM image in Figure 7j. The distribution of oxygen is relatively uniform. However, the distributions of Ti, V, Nb, and Zr are non-uniform. The white arrows point to areas that are Ti, Nb, and Zr enriched, corresponding to P3. The red arrows pointed to areas that are V enriched, corresponding to P1 and P2. Figure 7k shows the pore structures in P1, P2, and P3. The central part of P1 in Figure 7k was magnified, as shown in Figure 7k, showing that the size of the pore structure is about 500 nm. The areas of the pore structures were calculated and are plotted in Figure 7m. It can be found that the areas of the pore structures from P1 to P3 show an obvious gradient change. The areas of P1, P2 and P3 regions are about 0.1–1.8, 0.2–2.5, and 0.5–25 μm2, respectively. Their special structures are formed with the combination of temperature, stress, and oxygen.
Conclusion
In summary, the structures of NbTiVZr, Nb0.5TiVZr, and NbTiV low-density refractory medium entropy alloys are BCC with lattice parameters of a1 = 3.2059 Å, a2 = 3.2599 Å, and a3 = 3.3068 Å, respectively. The grain size of the alloys is about 85–135 μm. The NbTiVZr alloy shows higher strength at elevated temperature (~ 878 MPa at 600°C; ~750 MPa at 800°C; ~500 MPa at 1,000°C) compared with the Nb0.5TiVZr and NbTiV alloys. The coefficients of thermal expansion of these NbTiVZr, Nb0.5TiVZr, and NbTiV alloys (BCC) are lower than that of the CoCrFeMnNi high-entropy alloy (FCC) when the temperature is <800°C. In addition, the NbTiVZr alloy exhibits more stable thermal expansion behavior than do the Nb0.5TiVZr and NbTiV alloys.
Data Availability Statement
The datasets generated for this study are available on request to the corresponding author.
Author Contributions
YuJ, YaJ, and GW designed the experiment and finished the manuscript. YuJ, LZ, and PL prepared the samples, performed the compression test, and microstructure characterization. XM, LX, and SW analyzed the raw data and revised the manuscript. All authors contributed to the article and approved the submitted version.
Funding
This project was supported by the National Natural Science Foundation of China (No. 51971123) and the Natural Science Foundation of Shanghai (17ZR1440800).
Conflict of Interest
The authors declare that the research was conducted in the absence of any commercial or financial relationships that could be construed as a potential conflict of interest.
References
Cantor, B., Chang, I. T. H., Knight, P., and Vincent, A. J. B. (2004). Microstructural development in equiatomic multicomponent alloys. Mater. Sci. Eng. A 375–377, 213–218. doi: 10.1016/j.msea.2003.10.257
Chawla, N., Deng, X., and Schnell, D. (2006). Thermal expansion anisotropy in extruded SiC particle reinforced 2080 aluminum alloy matrix composites. Mater. Sci. Eng. A 426, 314–322. doi: 10.1016/j.msea.2006.04.054
Ding, Q., Zhang, Y., Chen, X., Fu, X., Chen, D., Chen, S., et al. (2019). Tuning element distribution, structure and properties by composition in high-entropy alloys. Nature 574, 223–227. doi: 10.1038/s41586-019-1617-1
Eleti, R. R., Chokshi, A. H., Shibata, A., and Tsuji, N. (2020). Unique high-temperature deformation dominated by grain boundary sliding in heterogeneous necklace structure formed by dynamic recrystallization in HfNbTaTiZr BCC refractory high entropy alloy. Acta Mater. 183, 64–77. doi: 10.1016/j.actamat.2019.11.001
Fazakas, É., Zadorozhnyy, V., Varga, L. K., Inoue, A., Louzguine-Luzgin, D. V., Tian, F., et al. (2014). Experimental and theoretical study of Ti20Zr20Hf20Nb20X20 (X=V or Cr) refractory high-entropy alloys. Int. J. Refractory Metals Hard Mater. 47, 131–138. doi: 10.1016/j.ijrmhm.2014.07.009
Gludovatz, B., Hohenwarter, A., Catoor, D., Chang, E. H., George, E. P., and Ritchie, R. O. (2014). A fracture-resistant high-entropy alloy for cryogenic applications. Science 345, 1153–1158. doi: 10.1126/science.1254581
Gorsse, S., Miracle, D. B., and Senkov, O. N. (2017). Mapping the world of complex concentrated alloys. Acta Mater. 135, 177–187. doi: 10.1016/j.actamat.2017.06.027
Jia, Y., Jia, Y., Wu, S., Ma, X., and Wang, G. (2019). Novel ultralight-weight complex concentrated alloys with high strength. Materials 12:1136. doi: 10.3390/ma12071136
Laplanche, G., Gadaud, P., Horst, O., Otto, F., Eggeler, G., and George, E. P. (2015). Temperature dependencies of the elastic moduli and thermal expansion coefficient of an equiatomic, single-phase CoCrFeMnNi high-entropy alloy. J. Alloys Compd. 623, 348–353. doi: 10.1016/j.jallcom.2014.11.061
Lei, Z., Liu, X., Wu, Y., Wang, H., Jiang, S., Wang, S., et al. (2018). Enhanced strength and ductility in a high-entropy alloy via ordered oxygen complexes. Nature 563, 546–550. doi: 10.1038/s41586-018-0685-y
Lu, X. G., Selleby, M., and Sundman, B. (2005). Theoretical modeling of molar volume and thermal expansion. Acta Mater. 53, 2259–2272. doi: 10.1016/j.actamat.2005.01.049
Lu, Y., Dong, Y., Guo, S., Jiang, L., Kang, H., Wang, T., et al. (2014). A promising new class of high-temperature alloys: eutectic high-entropy alloys. Sci. Rep. 4:6200. doi: 10.1038/srep06200
Ma, S. G., and Zhang, Y. (2012). Effect of Nb addition on the microstructure and properties of AlCoCrFeNi high-entropy alloy. Mater. Sci. Eng. A 532, 480–486. doi: 10.1016/j.msea.2011.10.110
Ma, Y., Wu, S., Jia, Y., Hu, P., Bu, Y., Chen, X., et al. (2019). Hexagonal closed-packed precipitation enhancement in a NbTiHfZr refractory high-entropy alloy. Metals 9:485. doi: 10.3390/met9050485
Mannan, S. K., and Patel, S. J. (2006). INCONEL alloy 783: an oxidation resistant, low expansion superalioy for gas and steam turbine applications. Mater. Sci. Forum. 546–549, 1271–1276. doi: 10.4028/www.scientific.net/MSF.546-549.1271
Miracle, D. B., and Senkov, O. N. (2017). A critical review of high entropy alloys and related concepts. Acta Mater. 122, 448–511. doi: 10.1016/j.actamat.2016.08.081
Mu, Y. K., Jia, Y. D., Xu, L., Jia, Y. F., Tan, X. H., Yi, J., et al. (2019). Nano oxides reinforced high-entropy alloy coatings synthesized by atmospheric plasma spraying. Mater. Res. Lett. 7, 312–319. doi: 10.1080/21663831.2019.1604443
Nagase, T., Mizuuchi, K., and Nakano, T. (2019). Solidification microstructures of the ingots obtained by Arc melting and cold crucible levitation melting in TiNbTaZr medium-entropy alloy and TiNbTaZrX (X = V, Mo, W) high-entropy alloys. Entropy 21:483. doi: 10.3390/e21050483
Nelson, J. B., and Riley, D. P. (1945). An experimental investigation of extrapolation methods in the derivation of accurate unit-cell dimensions of crystals. Proc. Phys. Soc. 57, 160–177. doi: 10.1088/0959-5309/57/3/302
Satya Prasad, V. V., Baligidad, R. G., and Gokhale, A. A. (2017). “Niobium and other high temperature refractory metals for aerospace applications,” in Aerospace Materials and Material Technologies : Volume 1: Aerospace Materials, eds N. E. Prasad and R. J. H. Wanhill (Singapore: Springer Singapore, 267–288.
Senkov, O. N., Gorsse, S., and Miracle, D. B. (2019a). High temperature strength of refractory complex concentrated alloys. Acta Mater. 175, 394–405. doi: 10.1016/j.actamat.2019.06.032
Senkov, O. N., Miracle, D. B., Chaput, K. J., and Couzinie, J.-P. (2018). Development and exploration of refractory high entropy alloys—a review. J. Mater. Res. 33, 3092–3128. doi: 10.1557/jmr.2018.153
Senkov, O. N., Rao, S. I., Butler, T. M., and Chaput, K. J. (2019b). Ductile Nb alloys with reduced density and cost. J. Alloys Compd. 808:151685. doi: 10.1016/j.jallcom.2019.151685
Senkov, O. N., Scott, J. M., Senkova, S. V., Miracle, D. B., and Woodward, C. F. (2011b). Microstructure and room temperature properties of a high-entropy TaNbHfZrTi alloy. J. Alloys Compd. 509, 6043–6048. doi: 10.1016/j.jallcom.2011.02.171
Senkov, O. N., Senkova, S. V., Woodward, C., and Miracle, D. B. (2013). Low-density, refractory multi-principal element alloys of the Cr–Nb–Ti–V–Zr system: microstructure and phase analysis. Acta Mater. 61, 1545–1557. doi: 10.1016/j.actamat.2012.11.032
Senkov, O. N., Wilks, G. B., Miracle, D. B., Chuang, C. P., and Liaw, P. K. (2010). Refractory high-entropy alloys. Intermetallics 18, 1758–1765. doi: 10.1016/j.intermet.2010.05.014
Senkov, O. N., Wilks, G. B., Scott, J. M., and Miracle, D. B. (2011a). Mechanical properties of Nb25Mo25Ta25W25 and V20Nb20Mo20Ta20W20 refractory high entropy alloys. Intermetallics 19, 698–706. doi: 10.1016/j.intermet.2011.01.004
Shi, P., Ren, W., Zheng, T., Ren, Z., Hou, X., Peng, J., et al. (2019). Enhanced strength-ductility synergy in ultrafine-grained eutectic high-entropy alloys by inheriting microstructural lamellae. Nat. Commun. 10:489. doi: 10.1038/s41467-019-08460-2
Thomas, A., El-Wahabi, M., Cabrera, J. M., and Prado, J. M. (2006). High temperature deformation of Inconel 718. J. Mater. Process. Technol. 177, 469–472. doi: 10.1016/j.jmatprotec.2006.04.072
Tsao, T. K., Chang, Y. J., Chang, K. C., Yeh, J. W., Chiou, M. S., Jian, S. R., et al. (2015). Developing new type of high temperature alloys–high entropy superalloys. Int. J. Metallurgical Mater. Eng. 1:107. doi: 10.15344/2455-2372/2015/107
Tseng, K., Yang, Y., Juan, C., Chin, T., Tsai, C., and Yeh, J. (2018a). A light-weight high-entropy alloy Al 20 Be 20 Fe 10 Si 15 Ti 35. Sci. China Technol. Sci. 61, 184–188. doi: 10.1007/s11431-017-9073-0
Tseng, K.-K., Juan, C.-C., Tso, S., Chen, H.-C., Tsai, C.-W., and Yeh, J.-W. (2018b). Effects of Mo, Nb, Ta, Ti, and Zr on mechanical properties of equiatomic Hf-Mo-Nb-Ta-Ti-Zr alloys. Entropy 21:15. doi: 10.3390/e2101001
Wu, S. W., Wang, G., Wang, Q., Jia, Y. D., Yi, J., Zhai, Q. J., et al. (2019). Enhancement of strength-ductility trade-off in a high-entropy alloy through a heterogeneous structure. Acta Mater. 165, 444–458. doi: 10.1016/j.actamat.2018.12.012
Xiaoge, C., An, T., Hongsong, Z., Yanxu, L., Haoming, Z., and Yongde, Z. (2016). Thermal conductivity and expansion coefficient of Ln2LaTaO7 (Ln= Er and Yb) oxides for thermal barrier coating applications. Ceram. Int. 42, 13491–13496. doi: 10.1016/j.ceramint.2016.05.141
Yang, T., Zhao, Y. L., Tong, Y., Jiao, Z. B., Wei, J., Cai, J. X., et al. (2018). Multicomponent intermetallic nanoparticles and superb mechanical behaviors of complex alloys. Science 362, 933–937. doi: 10.1126/science.aas8815
Yang, X., Chen, S., Cotton, J., and Zhang, Y. (2014). Phase stability of low-density, multiprincipal component alloys containing aluminum, magnesium, and lithium. Jom 66, 2009–2020. doi: 10.1007/s11837-014-1059-z
Yang, X., Zhang, Y., and Liaw, P. K. (2012). Microstructure and compressive properties of NbTiVTaAlx high entropy alloys. Procedia Eng. 36, 292–298. doi: 10.1016/j.proeng.2012.03.043
Yao, H. W., Qiao, J. W., Gao, M. C., Hawk, J. A., Ma, S. G., Zhou, H. F., et al. (2016). NbTaV-(Ti,W) refractory high-entropy alloys: Experiments and modeling. Mater. Sci. Eng. A 674, 203–211. doi: 10.1016/j.msea.2016.07.102
Yao, H. W., Qiao, J. W., Hawk, J. A., Zhou, H. F., Chen, M. W., and Gao, M. C. (2017). Mechanical properties of refractory high-entropy alloys: Experiments and modeling. J. Alloys Compd. 696, 1139–1150. doi: 10.1016/j.jallcom.2016.11.188
Yeh, J. W., Chen, S. K., Lin, S. J., Gan, J. Y., Chin, T. S., Shun, T. T., et al. (2004). Nanostructured high-entropy alloys with multiple principal elements: novel alloy design concepts and outcomes. Adv. Eng. Mater. 6, 299–303. doi: 10.1002/adem.200300567
Youssef, K. M., Zaddach, A. J., Niu, C. N., Irving, D. L., and Koch, C. C. (2015). A novel low-density, high-hardness, high-entropy alloy with close-packed single-phase nanocrystalline structures. Mater. Res. Lett. 3, 95–99. doi: 10.1080/21663831.2014.985855
Yu, P. F., Zhang, L. J., Ning, J. L., Ma, M. Z., Zhang, X. Y., Li, Y. C., et al. (2017). Pressure-induced phase transitions in HoDyYGdTb high-entropy alloy. Mater. Lett. 196, 137–140. doi: 10.1016/j.matlet.2017.02.136
Keywords: refractory medium-entropy alloy, mechanical properties, microstructure, thermal expansion, low-density alloy
Citation: Jia Y, Zhang L, Li P, Ma X, Xu L, Wu S, Jia Y and Wang G (2020) Microstructure and Mechanical Properties of Nb–Ti–V–Zr Refractory Medium-Entropy Alloys. Front. Mater. 7:172. doi: 10.3389/fmats.2020.00172
Received: 20 January 2020; Accepted: 11 May 2020;
Published: 25 June 2020.
Edited by:
Zhefeng Zhang, Institute of Metals Research (CAS), ChinaReviewed by:
Junwei Qiao, Taiyuan University of Technology, ChinaQing Wang, Dalian University of Technology, China
Copyright © 2020 Jia, Zhang, Li, Ma, Xu, Wu, Jia and Wang. This is an open-access article distributed under the terms of the Creative Commons Attribution License (CC BY). The use, distribution or reproduction in other forums is permitted, provided the original author(s) and the copyright owner(s) are credited and that the original publication in this journal is cited, in accordance with accepted academic practice. No use, distribution or reproduction is permitted which does not comply with these terms.
*Correspondence: Yandong Jia, amlheWFuZG9uZzIwMDhAMTYzLmNvbQ==; Gang Wang, Zy53YW5nQHNodS5lZHUuY24=