 Yi Yang1
 Shengting Li
 Cheng Li
- 1Xiandai Investment Co., Ltd., Changsha University of Science and Technology, Changsha, China
- 2Key Laboratory of Transport Industry of Road Structure and Material, Research Institute of Highway, Ministry of Transport, Beijing, China
- 3School of Highway, Chang’an University, Xi’an, China
- 4Hunan Communication Polytechnic, Changsha, China
- 5School of Traffic and Transportation Engineering, Changsha University of Science and Technology, Changsha, China
- 6School of Traffic and Transportation Engineering, Changsha University of Science and Technology, Changsha, China
Embankment subgrade soils classifying as A-4 to A-7-6 according to the AASHTO Soil Classification System can exhibit low bearing strength, high volumetric instability, and freeze-thaw susceptibility. These characteristics of soil are frequently identified as main factors leading to accelerated damage of pavement systems. Cement stabilization has been widely used to improve these soils conditions. The present study aims to help designers and practitioners better understand how cement stabilizations can influence soil index properties and mechanical properties before and after saturation. In this study, a total of 28 cohesive and granular soil materials obtained from nine construction sites were tested using 4–12% type I/II Portland cement contents. Specimens were prepared using a 2 inch by 2 inch compaction apparatus and tested for 28-day unconfined compressive strength (UCS) with and without vacuum saturation. Results indicated that statistically significant relationships exist between soil index properties, UCS, and cement content. Based on the laboratory test results, a laboratory evaluation procedure for cement stabilization mix design for both granular and cohesive soils is proposed.
Introduction
Embankment subgrade soils classifying as A-4 to A-7-6 according to the AASHTO Soil Classification System can exhibit low bearing strength, high volumetric instability, and freeze-thaw susceptibility, which are frequently identified as main factors leading to accelerated damage of pavement systems (White and Bergeson, 2001; White et al., 2004, 2008, 2018; Zhang et al., 2016, 2019; Li et al., 2020). Soil stabilization with cement has been studied during the past six decades over a variety of soil types (Balmer, 1958; Mitchell, 1976; Uddin et al., 1997; Lo and Wardani, 2002; Lorenzo and Bergado, 2004; Sariosseiri, 2008; Sariosseiri et al., 2011; Sarkar et al., 2012; Rashid et al., 2014; Riaz et al., 2014; Yang et al., 2018; Li et al., 2020). Previous research indicated that Portland cement stabilized materials generally show superior performance than any other chemical stabilizer (Parsons and Milburn, 2003; Henry et al., 2005; Zhang et al., 2016, 2019; Li et al., 2017, 2018, Li C. et al., 2019). Multiple regression analysis is a valuable tool applied in geotechnical engineering (Li S. et al., 2019). Horpibulsuk (2012) reported the effectiveness of various percentages cement mixture on the specimen’s strength development. Three strength development zones were presented: active, inert, and deterioration zone. In the active zone, the pores smaller than 0.1 micron significantly decreased due to cement hydration process, so the strength increased significantly. However, as content of cement additives increased, the desired water was not adequate for hydration, so the strength and quantity of cementitious materials decreased. Various studies have previously developed similar relationships between cement dosage and modified soil strength and other engineering properties, such as liquid limit, plasticity index, etc (Qubain et al., 2006; Sariosseiri et al., 2011; Du et al., 2013; Rashid et al., 2014). Spangler and Patel (1950) showed that the plastic limit was increased as cement content increased, and plasticity index was decreased as cement admixture content increased because the liquid limit was decreased.
To understand how the cement content can influence the strength and soil index properties of both cohesive and granular materials, the present study conducted a comprehensive laboratory evaluation. A total of 28 granular and cohesive materials were tested using 4–12% type I/II Portland cement contents. The laboratory results were analyzed using multi-variate statistical analysis to assess influence of the cement content and soil index properties on post-stabilization material properties. Based on the laboratory test and statistical analysis results, a laboratory testing and evaluation procedure for cement stabilization mix design for both granular and cohesive soils is proposed.
Materials and Methods
In this study, a total of 28 granular and cohesive materials obtained from nine construction sites were tested using 4–12% type I/II Portland cement contents. Table 1 summarizes the parent materials, particle size analyses, Atterberg limits, and soil classifications test results of the materials. The cohesive soils were collected from 25 test beds of eight project sites, and the parent materials of the cohesive soils were either glacial till or loess. The cohesionless granular soils were collected from three test beds of one project site, and their parent material was alluvium material.
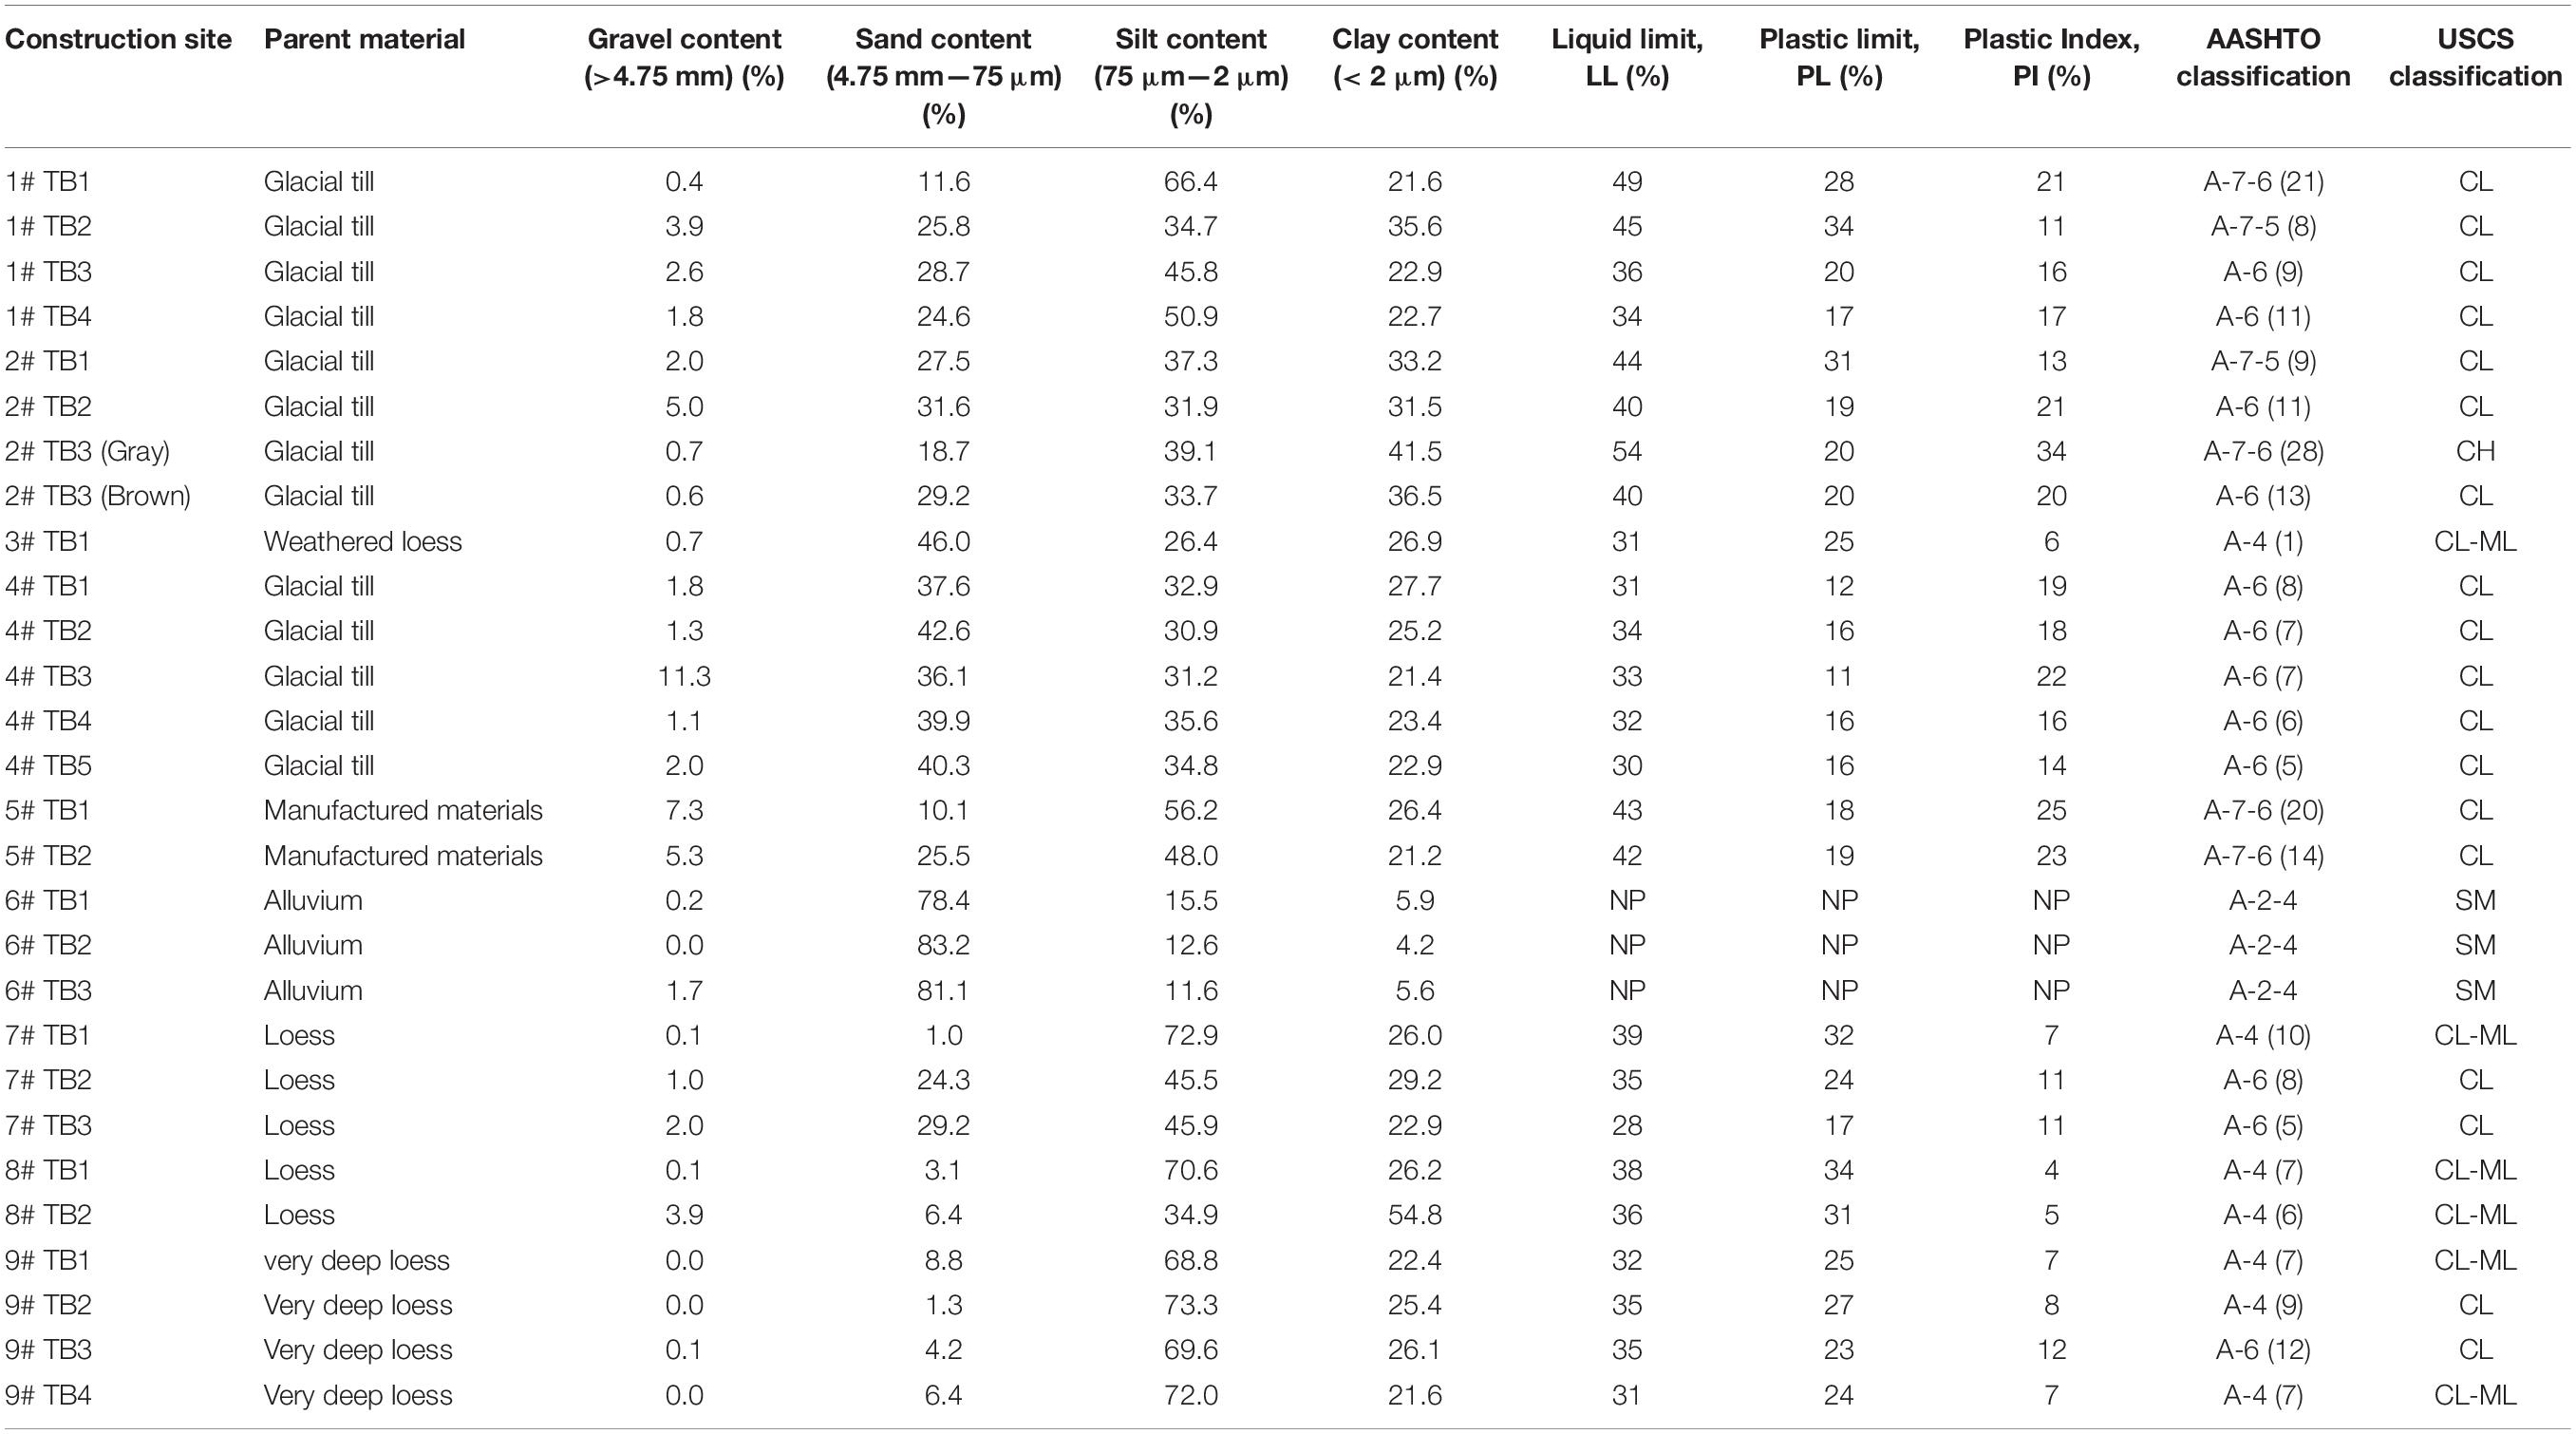
Table 1. Soil index properties of the granular and cohesive subgrade materials tested in this study.
Testing and Analysis Methods
To classify the materials tested in this study, particle size analysis was conducted in accordance with ASTM D422-63 (2007) (ASTM, 2007). The distribution of particle sizes larger than 75 μm (opening size of the No. 200 sieve) was determined by sieving, and the distribution of particle sizes smaller than 75 μm was determined by the hydrometer method. Atterberg limit testing was conducted in accordance with ASTM D4318-10 (2000) (ASTM, 2000) using the wet preparation method. Liquid limit tests were performed using the multipoint method. Based on these results, each sample was classified according to the AASHTO Soil Classification System and Unified Soil Classification System (USCS).
Soil Compaction Test
The relationship between the moisture and dry unit weight of embankment materials was determined in accordance with ASTM D698 (2013) (ASTM, 2013) and ASTM D1557 (2009) (ASTM, 2009). Appropriate methods were chosen based on the grain size distributions for each sample. The tests were performed at five moisture contents, and the optimum moisture-density characteristics were obtained by fitting the data to the Li and Sego Fit model as described in Eq. 1
where γd = dry density of the soil, Gs = specific gravity of the soil, γw = density of water, w = moisture content of the soil, Sm = maximum degree of saturation, wm = moisture content at Sm, and n and p are shape factors.
ISU 2 Inch by 2 Inch Test
ISU 2 inch by 2 inch compaction apparatus is described in O’Flaherty et al. (1963). The test procedure was used to prepare 50.8 mm (2 inch) diameter by 50.8 mm (2 inch) height samples for unconfined compressive strength (UCS) testing. Standard Proctor optimum moisture content for each sample was determined based on the Li and Sego Fit model, and each sample was compacted at that moisture content. For cement treated materials, the optimum moisture content was determined using Eq. 2 with a water to cement (w/c) ratio of 0.25:
The test procedure involved placing loose material in the compaction apparatus and dropping a 2.27 kg hammer from a drop height of about 0.31 m in a 50.8 mm diameter steel mold. O’Flaherty et al. (1963) provided guidance on the number of blows required to obtain standard Proctor densities for different soil types, 6, 7, 14 drop-hammer blows for AASHTO soil types A-7/A-6, A-4, and A-3/A-2/A-1, respectively. The number of blows were selected based on the soil type and equal number of blows were applied on both sides of the sample, to compact the sample uniformly.
After compaction, the 2 inch by 2 inch specimens were sealed using plastic wrap and aluminum foil, and were placed in sealed plastic bag. According to Winterkorn and Pamukcu (1990), cement stabilized specimens cured for 7 days at 43°C can be used to simulate 28 day curing strength. Unstabilized specimens were tested shortly after compaction (no curing). Three samples were prepared at each cement content.
UCS Test
The cured specimens were tested for UCS accordance with ASTM D 1633 (2014) (ASTM, 2014b). The standard requires use of either 101.6 mm diameter by 116.4 mm height Proctor samples with a height to diameter ratio (h/d) of 1.15 or 71.1 mm diameter by 142.2 mm height samples with a h/d ratio of 2.0. Instead, 2 inch by 2 inch. specimens were used in this study which have a h/d ratio of 1.0. Based on laboratory evaluations, White et al. (2005) concluded that the UCS determined from 2 inch by 2 inch specimens can be multiplied by 0.86 to correlate with UCS of Proctor sized samples (h/d = 1.15) or 0.90 to correlate with samples that have h/d = 2. The ASTM D1633 (2014) (ASTM, 2014b) also provides a similar guidance in relating UCS on samples with h/d = 2 multiplying a factor of 1.10 to samples with h/d = 1.15 for conversion.
The cured specimens were tested in unsaturated and saturated condition. The specimens were saturated using the vacuum saturated method as described in ASTM C593 (2014) (ASTM, 2014a). The specimens were placed on a perforated Plexiglas plate in a vacuum vessel as shown in Figure 1, and the chamber was evacuated to 609 MmHg for 30 minutes. Then the vacuum vessel was flooded to a depth sufficient to cover the soil specimens. After 1 h of soaking, the specimens were removed from the vessel to conduct UCS testing. For samples that become fragile and cannot be removed from water for UCS testing, the UCS is reported as 0 kPa.
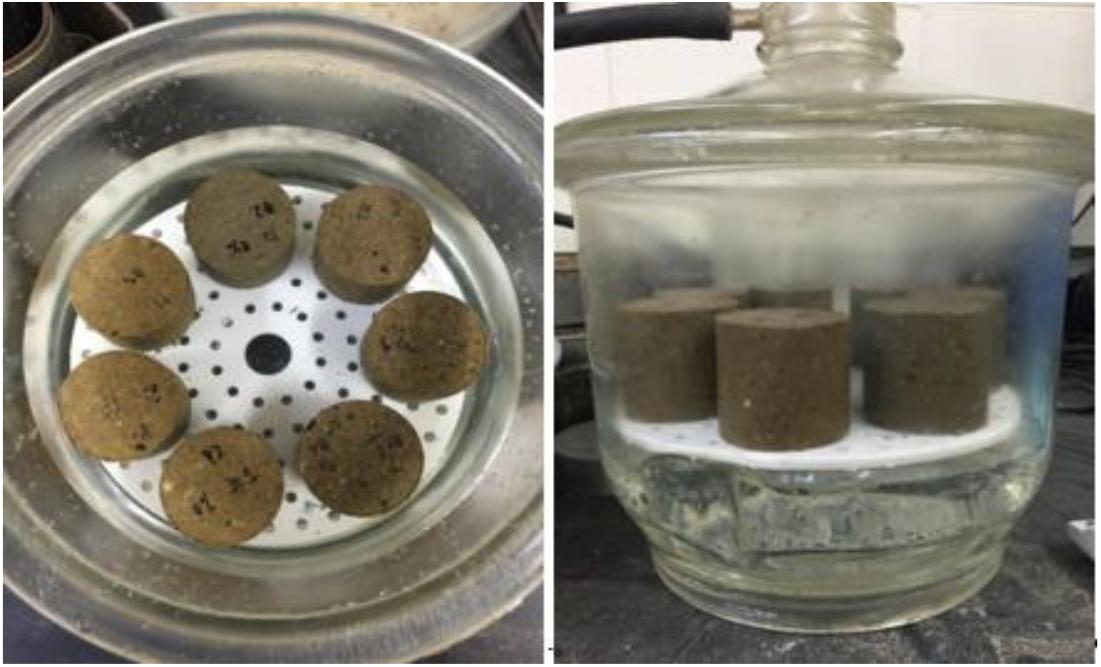
Figure 1. Vacuum saturation of cement stabilized specimens.
Multiple Regression Analysis
The multiple regression analysis was performed to evaluate that how the cement content and pre-treatment soil index properties can influence the soil index properties and UCS of the soils. Regression analyses were performed by incorporating the parameters as independent variables into a general multiple linear regression model as shown in Eq. 3.
where
Predicted parameters = UCS, PI, GI, and F200,
b0 = intercept,
bn = regression coefficients, and Xn = various parameters (cement content, LL, F200, clay content, PI, and sand content).
Statistical significance of each variable was assessed based on p and t values. A statistical analysis software, JMP 10 was used to generate the statistical models based on testing data. The criteria for identifying the significance of a parameter was: p value < 0.05 = significant, <0.10 = possibly significant, >0.10 = not significant, and t- value < −2 or > + 2 = significant. The p-value indicated the significance of a parameter and the t-ratio value indicates the relative importance. The best fit model was determined based on the strength of the regression relationships assessed by the coefficient of determination (R2) values.
Laboratory Test Results
In the following sections, the results and analysis are separately for F200, Atterberg limits, GI, and UCS, to present the influence of cement stabilization on these properties.
Fines Content (F200)
Results of F200 versus cement content are presented in Figure 2. The results indicated that F200 of both the cohesive and granular soils greatly decreased with increasing cement content due to the fine soil particles of the materials were bonded by the cement hydration and pozzolanic reactions.
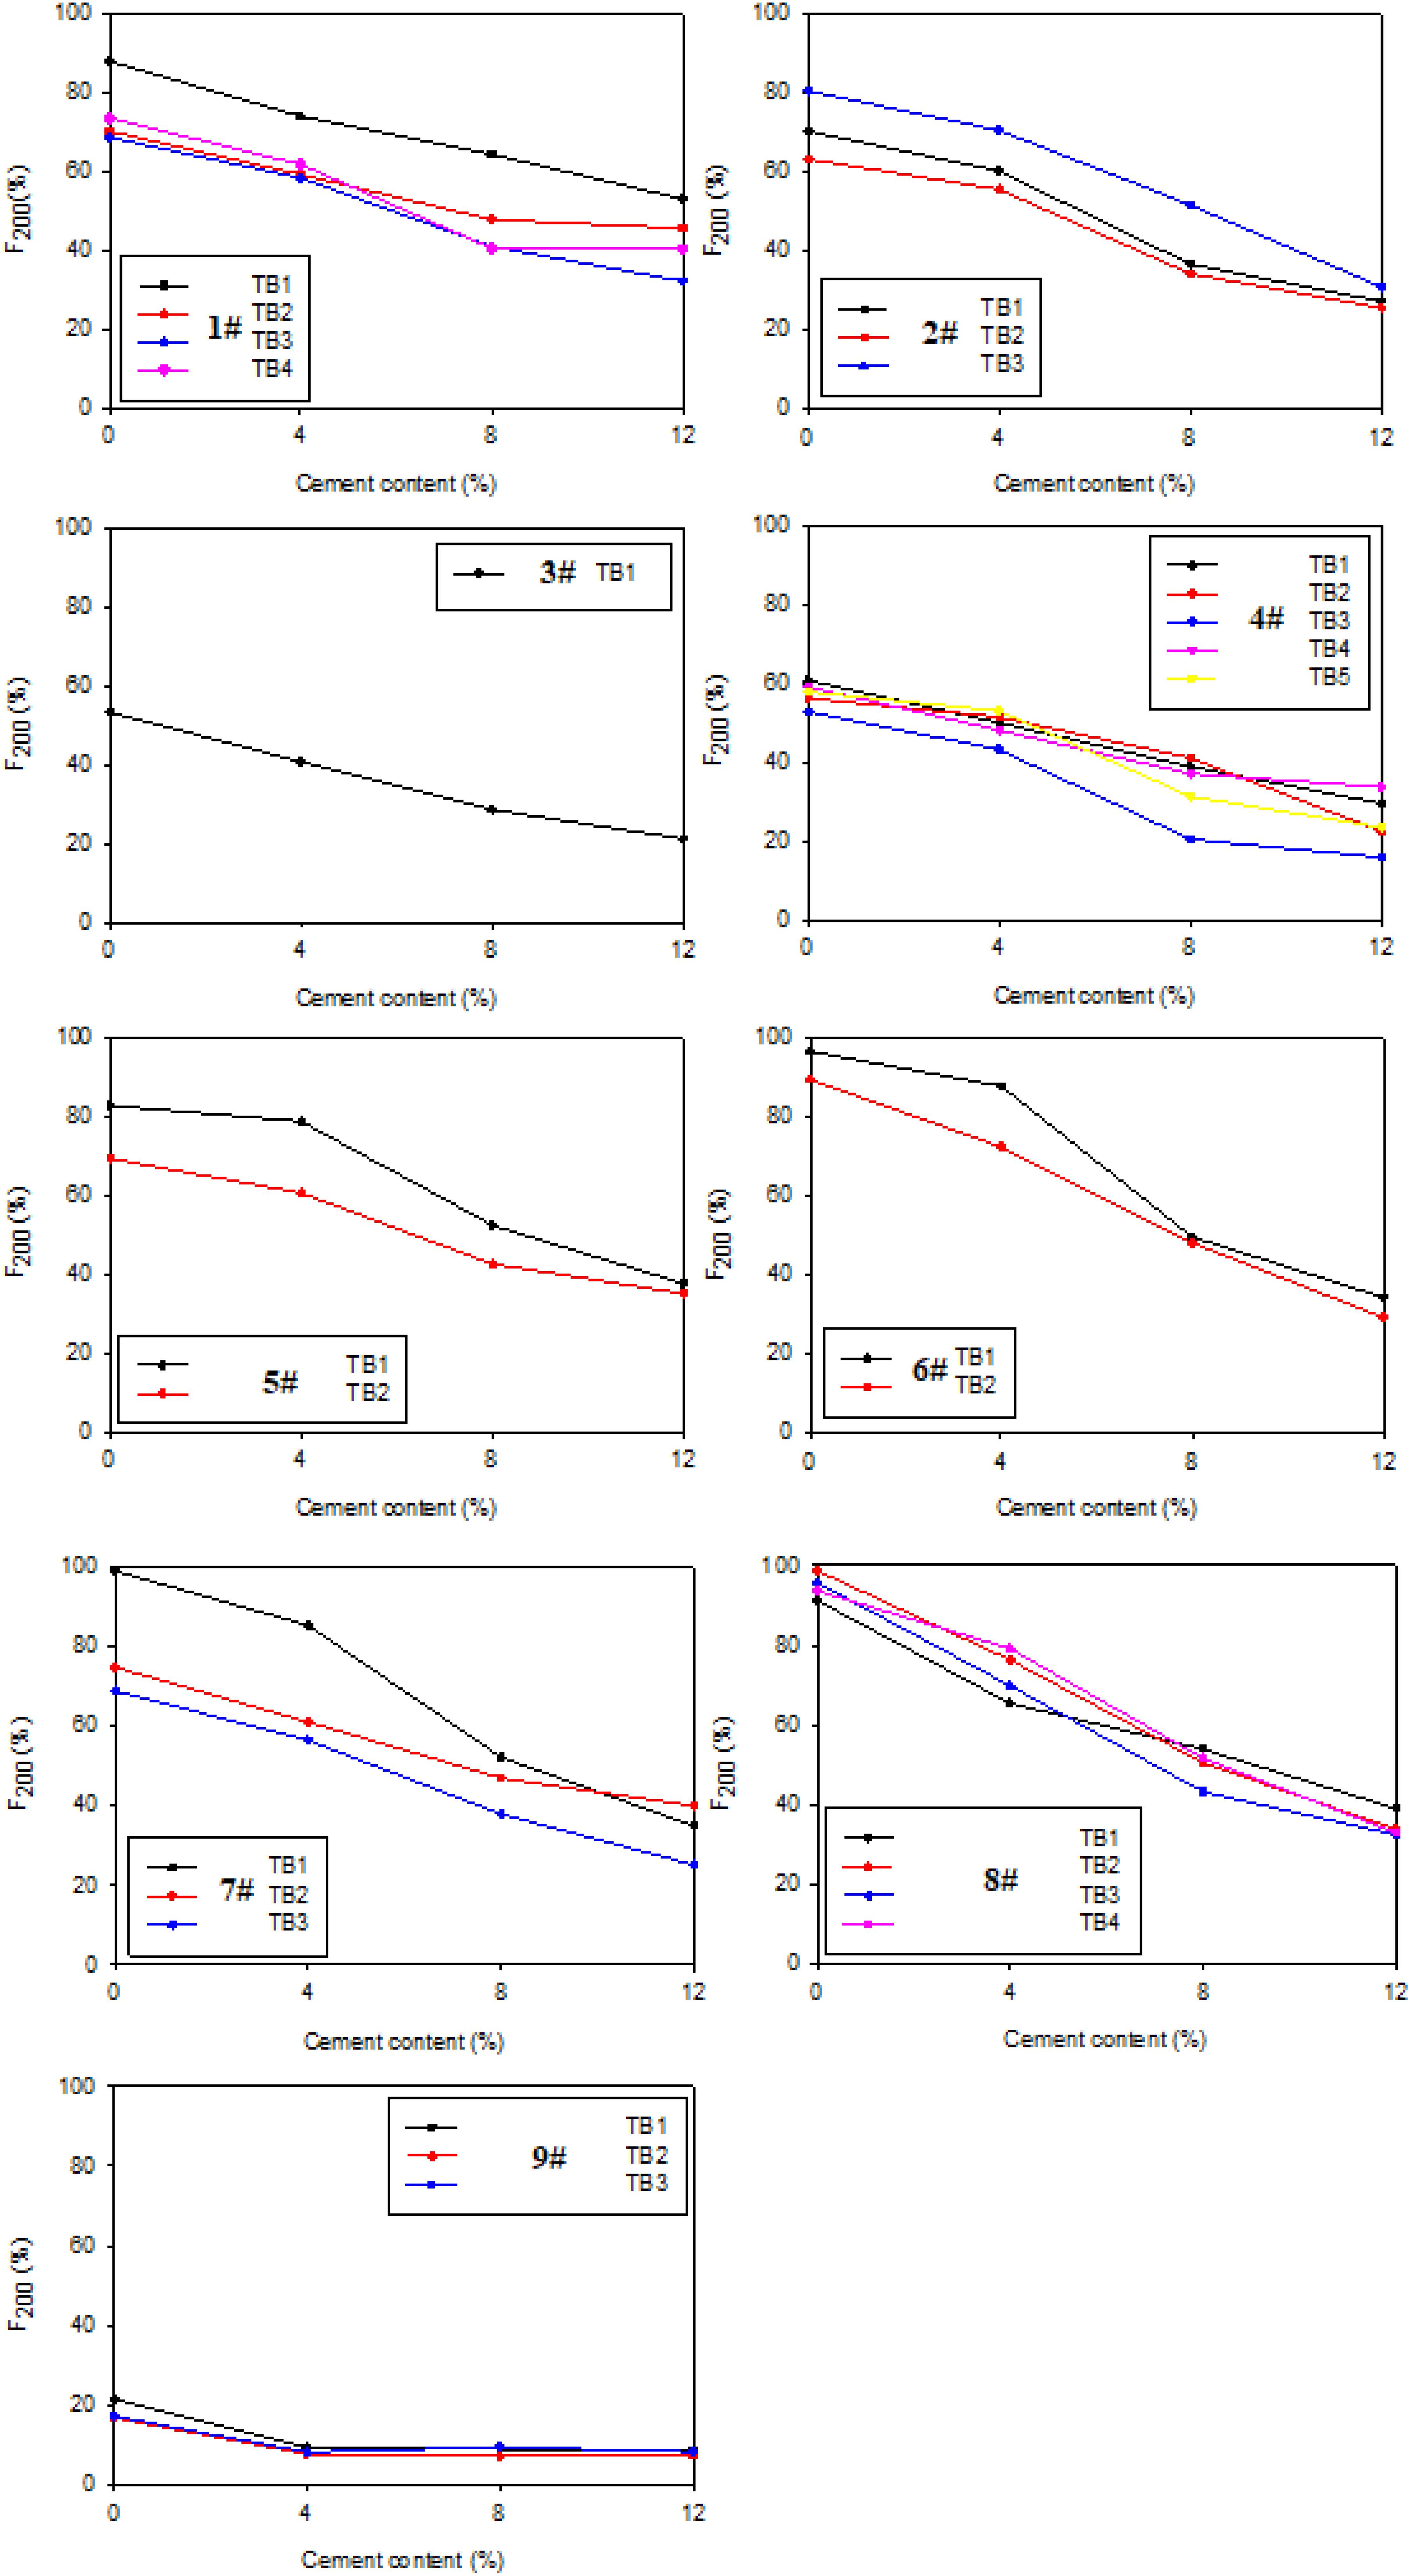
Figure 2. F200 versus cement content.
Statistical analysis was conducted to predict F200 after treatment as a function of cement content, F200 before treatment, and Atterberg limits. Cement content, F200 before treatment, and LL were found to be statistically significant as shown in Table 2. PI and PL parameters were not statistically significant. The measured versus predicted F200 of soils after cement treatment from the multi-variate model are presented in Figure 3. The model showed an R2 of about 0.9 and RMSE of about 7%.
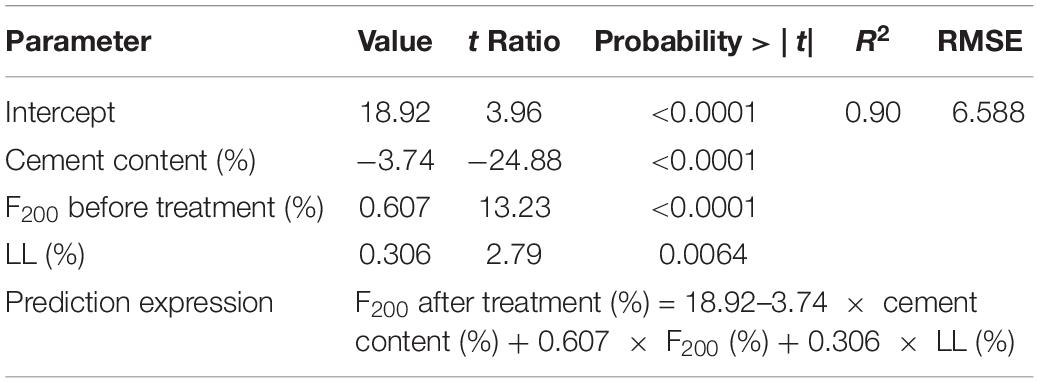
Table 2. Multi-variate analysis results to predict F200 after cement stabilization.
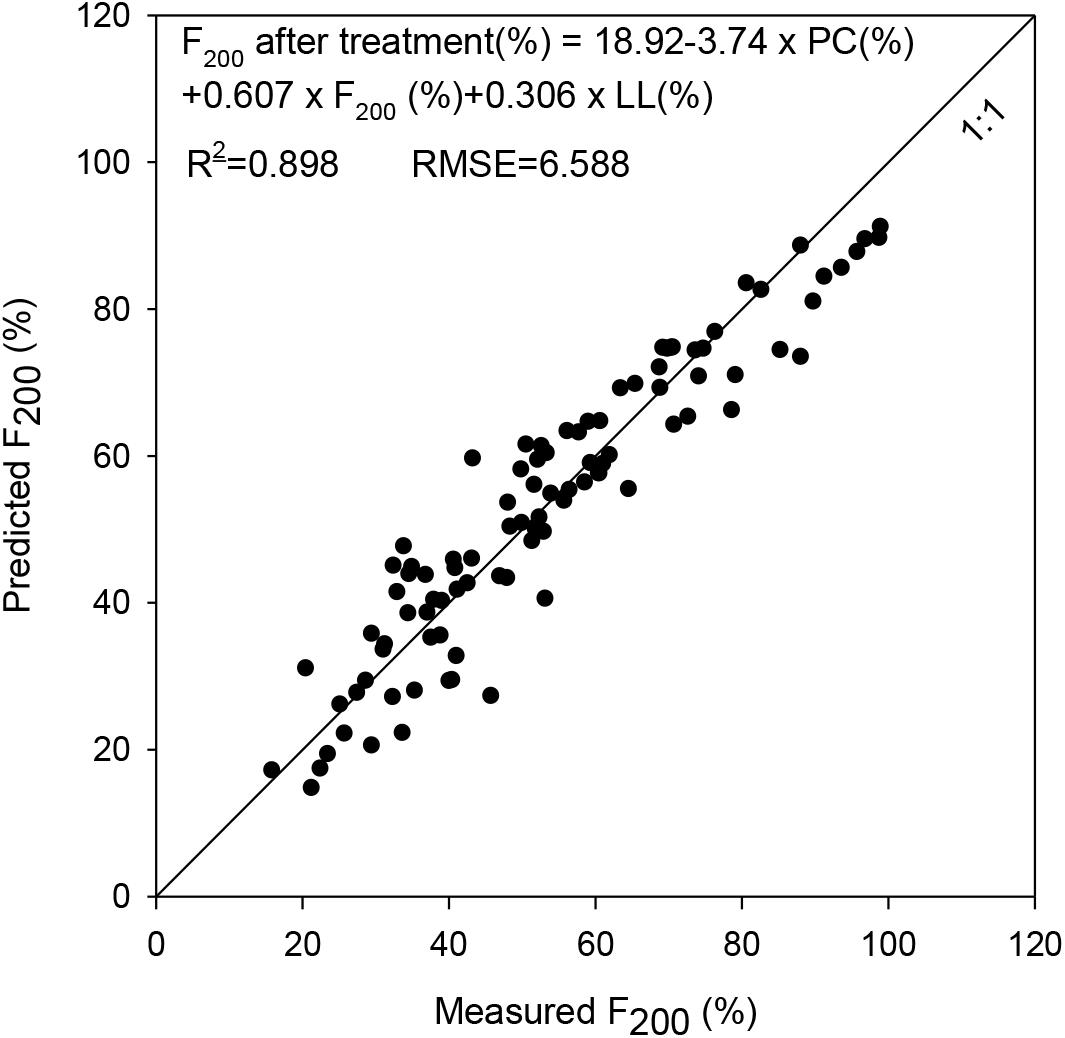
Figure 3. Comparison of measured F200 and predicted F200 of the cement treated soils.
Atterberg Limits
The F200 versus PI results of the untreated and cement treated soils with 4, 8, and 12% cement content are shown in Figure 4. The test results show that both of the PI and F200 decreased as the cement content increased. For soils treated with 12% cement, the PI values are zero, which indicates that the treated soils become to non-plastic.
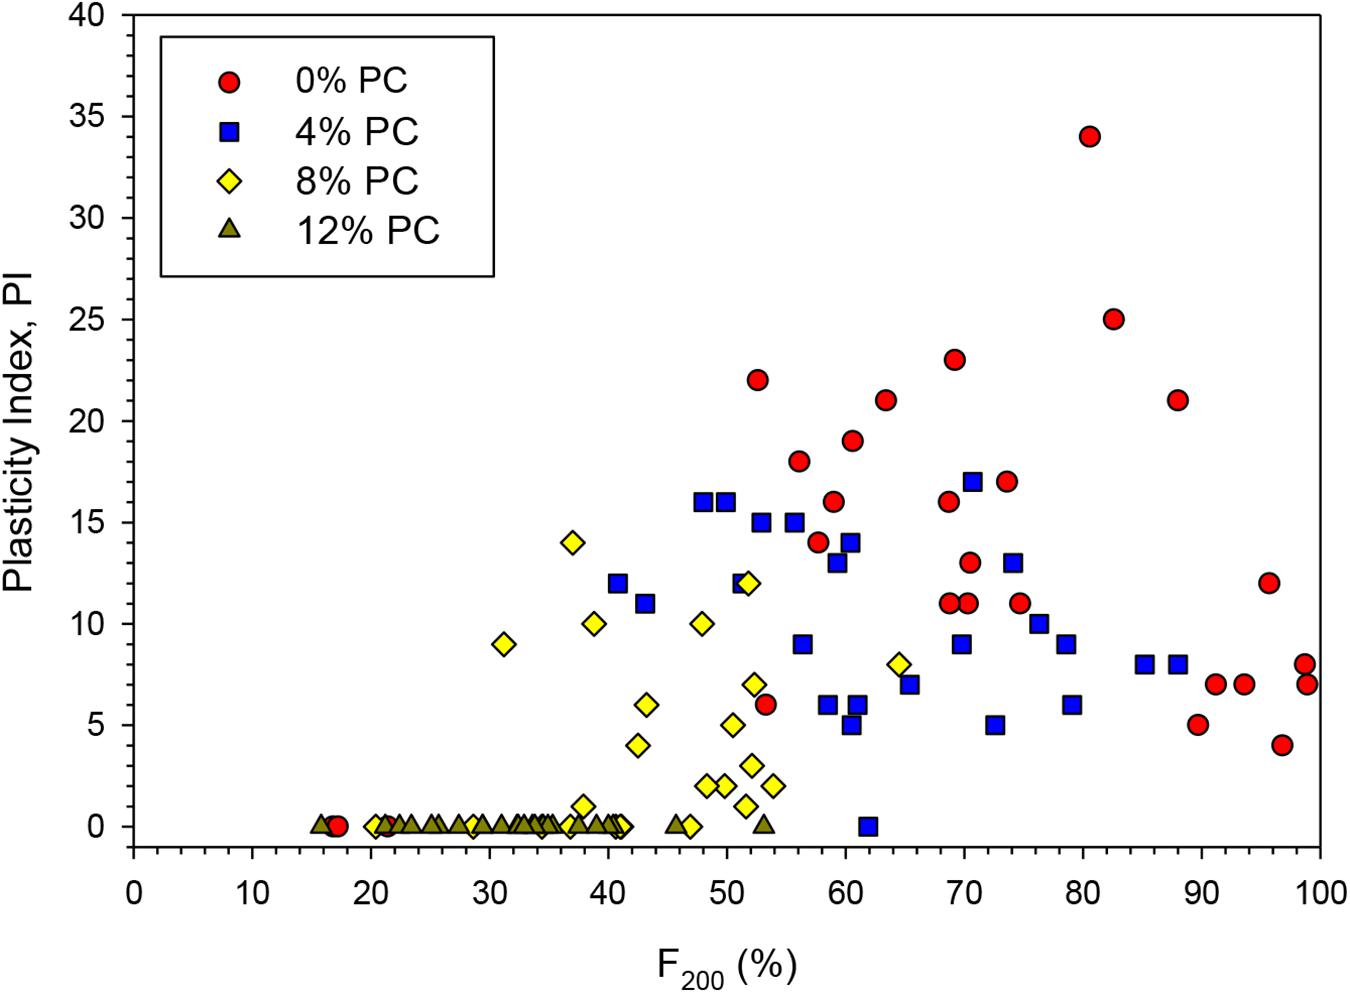
Figure 4. PI versus F200 for the untreated and cement treated soils.
Statistical analysis was conducted to predict PI after treatment as a function of cement content, clay content, silt content, and LL. Results are summarized in Table 3. Cement content and clay content were found to be statistically significant, while the remaining parameters were not statistically significant. Measured versus predicted PI (after treatment) results from the multi-variate model are presented in Figure 5. The model showed an R2 of about 0.5 and RMSE of about 5%.
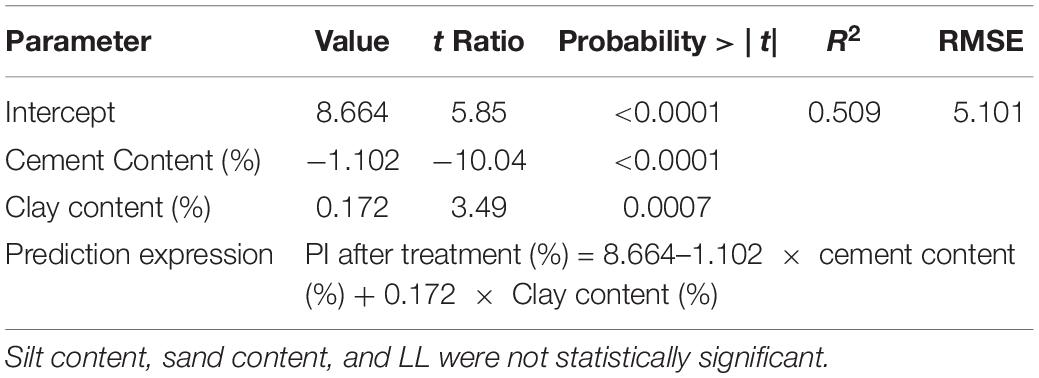
Table 3. Multi-variate analysis results to predict PI after cement stabilization.
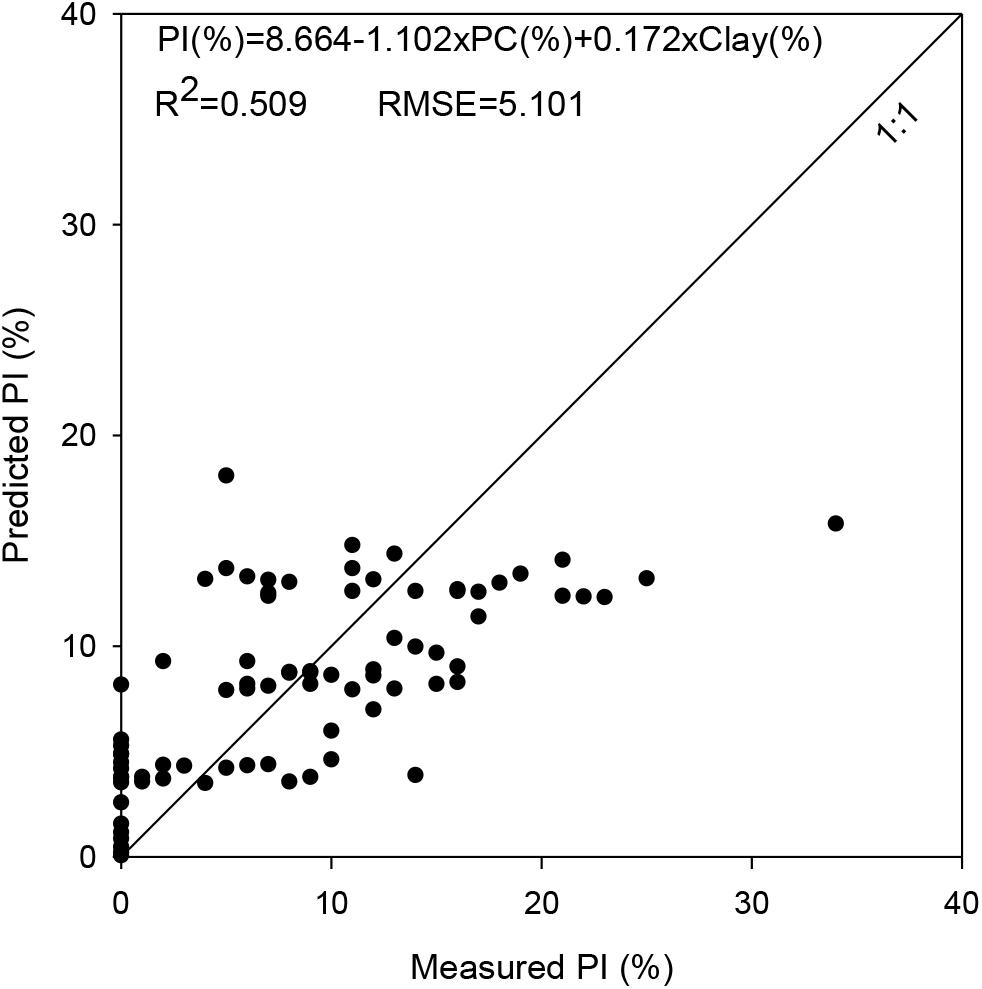
Figure 5. Comparison of measured PI and predicted PI of the cement treated soils.
AASHTO Group Index (GI)
For a majority of the soils, the GI values decreased with increasing cement content. Statistical analysis was conducted on the laboratory test results to predict GI after treatment as a function of cement content, clay content, silt content, F200, LL, and PI. Results are summarized in Table 4. Cement content, F200, LL, and PI were found to be statistically significant, while the remaining parameters were not statistically significant. Measured versus predicted GI (after treatment) results from the multi-variate model are presented in Figure 6. The model showed an R2 of about 0.7 and RMSE of about 3.
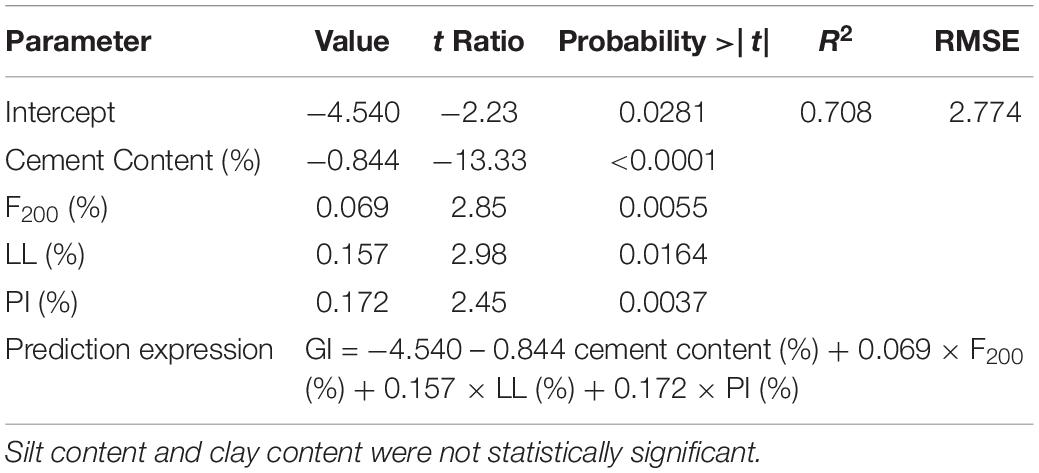
Table 4. Multi-variate analysis results to predict GI after cement stabilization.
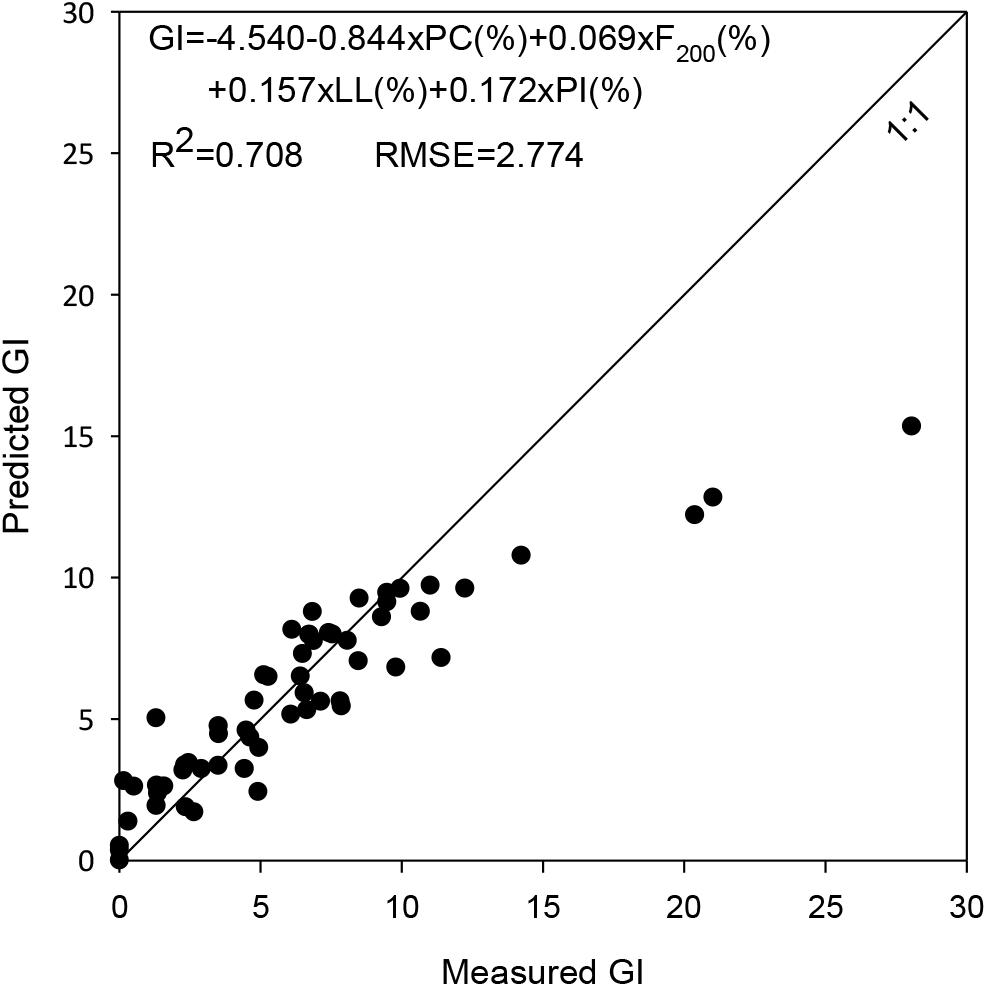
Figure 6. Comparison of measured group index and predicted group index.
Unconfined Compressive Strength
The results of unsaturated and vacuum saturated UCS of the materials at different cement contents are used for determining relationships between the cement content and pre- and post-saturation strength of the materials.
Results indicated that increasing UCS with increasing cement content, as expected. For a majority of the unstabilized materials, the soil specimens became fragile after vacuum saturation and could not be retrieved from the vessel. For those soils, UCS of 0 kPa is reported herein. Vacuum saturated stabilized specimens resulted in UCS measurements that were on average about 1.5 times lower than the unsaturated specimens. The ratio of unsaturated and vacuum saturated UCS of stabilized specimens ranged from about 1.1 to 2.5.
Statistical analysis was also conducted to predict unsaturated and vacuum saturated UCS as a function of cement content, sand content, clay content, silt content, F200, LL, and PI. Results are summarized in Tables 5, 6. The cement content, sand content, F200, and LL were found to be statistically significant, while the remaining parameters were not statistically significant. Measured versus predicted UCS results from the multi-variate model are presented in Figure 7. The models showed an R2 of about 0.855 and RMSE of about 515 kPa for vacuum saturated UCS and 672 kPa for unsaturated UCS.
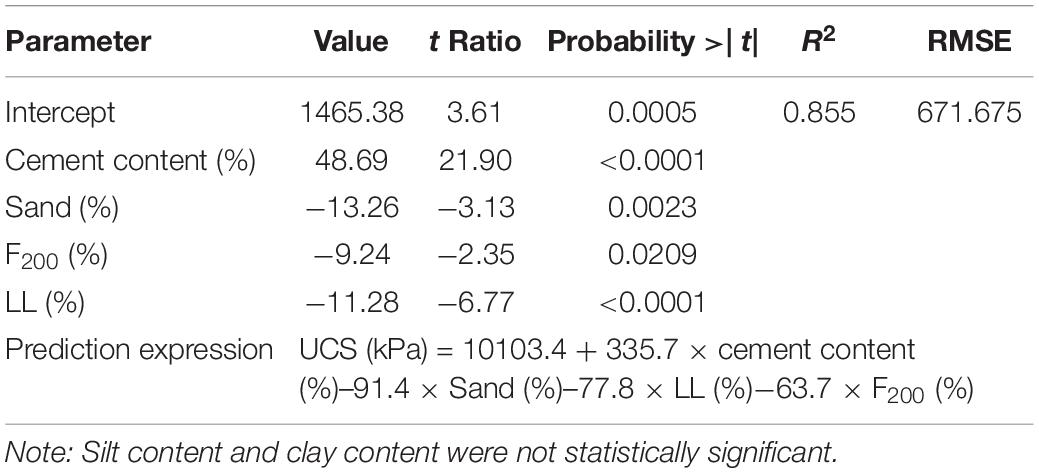
Table 5. Multi-variate analysis results to predict unsaturated UCS.
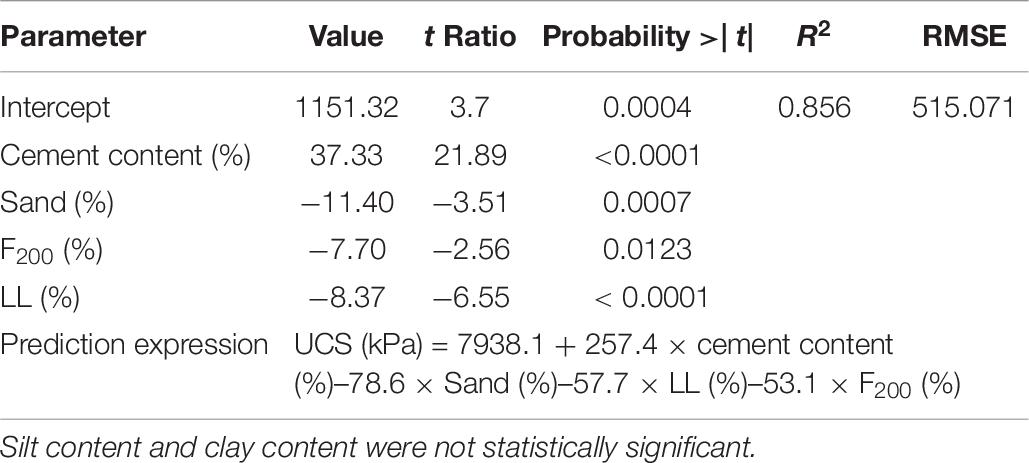
Table 6. Multi-variate analysis results to predict vacuum saturated UCS.
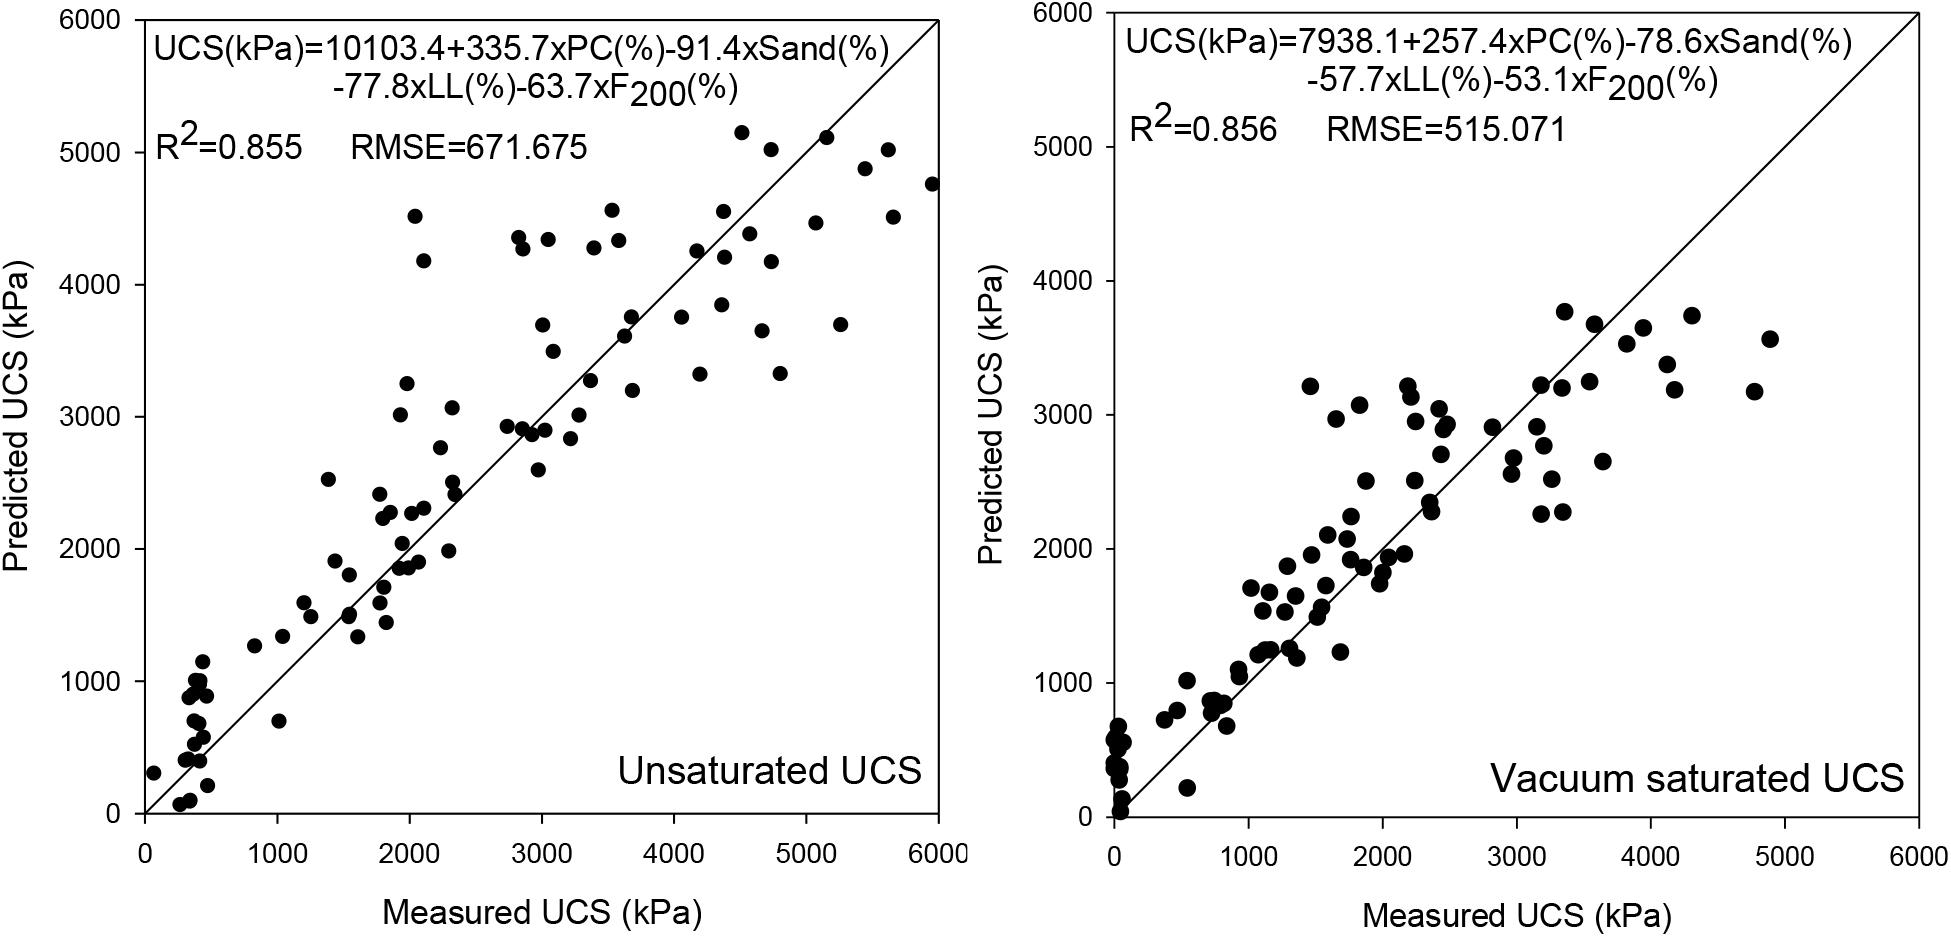
Figure 7. Comparison of the measured and predicted UCS of unsaturated and vacuum saturated specimens.
Proposed Testing and Evaluation Procedure
Based on the test results and experience obtain from this laboratory evaluation, a mix design procedure is proposed for sampling and testing, and requirements of cement stabilized soils.
Sampling and Materials
Each soil sample to be used in chemical stabilization shall be 35 kg. The cement used for stabilization shall meet the requirements of Type I or I/II.
Sample Preparation and Testing
The sulfate content of the soil shall be determined. If the soil consists of soluble sulfate content > 3,000 ppm or the material classifies as unsuitable, chemical stabilization shall not be performed unless consulted with the engineers.
For each soil type, prepare three samples each for the following five mixes:
1. Mix 1: Untreated soil.
2. Mix 2: 2% cement.
3. Mix 3: 4% cement.
4. Mix 4: 6% cement.
5. Mix 5: 8% cement.
To determine the quantity of cement to be added to the soil, multiply the cement percentage by the dry weight of the soil. Use cement that is from the same source(s) that will be used during construction.
Moisture–Density Relationship
First, the moisture–density relationship of the different mixtures shall be determined. Then, UCS testing shall be performed at target moisture contents, as described below.
The moisture versus dry density relationship of untreated and cement-treated samples shall be determined using one of the following alternatives:
Alternative 1:
Untreated Samples: The maximum dry density and optimum moisture content of the untreated samples shall be determined using standard Proctor test in accordance with ASTM D698 (2013) (ASTM, 2013). A minimum 3-point Proctor is recommended.
Treated Samples: The maximum dry density and optimum moisture content shall be determined in accordance with ASTM D558 (2019) (ASTM, 2019). All treated samples must be compacted within 1 h of mixing. A minimum 3-point Proctor is recommended.
Alternative 2:
The maximum dry density and optimum moisture content of untreated and treated samples shall be determined using the ISU 2 inch by 2 inch. Moisture–Density Test Method, per Chu et al. (1995). In preparing samples using the 2 inch by 2 inch method, use the method of O’Flaherty et al. (1963) for guidance on the total number of drop-hammer blows depending on the soil type to obtain results similar to the standard Proctor test.
Alternative 3:
First, determine the optimum moisture content of the untreated soil using standard Proctor test in accordance with ASTM D698 (2013) (ASTM, 2013). Then use the following equation to determine the optimum moisture content of treated samples, by using a water to cement (w/c) ratio of 0.25:
Unconfined Compressive Strength
The UCS tests shall be performed on compacted samples at respective optimum moisture contents for untreated and treated soils, in accordance with ASTM D1633-00 (2014) (ASTM, 2014b). As an alternative, tests can be performed on 2 inch by 2 inch samples prepared per Alternative 2 above.
For each mix, prepare three samples for UCS testing for a total of 12 samples. Wrap each sample immediately after compaction with a plastic wrap and aluminum foil and store in a moisture-proof and airtight bag. All treated samples shall be cured at 38°C for 7 days. Untreated samples shall be cured for no more than 24 h.
After curing, all samples shall be vacuum saturated in accordance with ASTM C593 (2014) (ASTM, 2014a). For samples that become fragile and cannot be retrieved from water for UCS testing, report the UCS as 0 kPa.
Target Cement Content Determination
The data obtained from UCS testing shall be plotted on a graph with cement content on x-axis and saturated UCS on y-axis. The average UCS of three samples shall be reported on the y-axis. The cement content corresponding to a saturated UCS of 700 kPa shall be determined. A 0.5% cement shall be added to determine the target cement content for the field application, as illustrated in Figure 8.
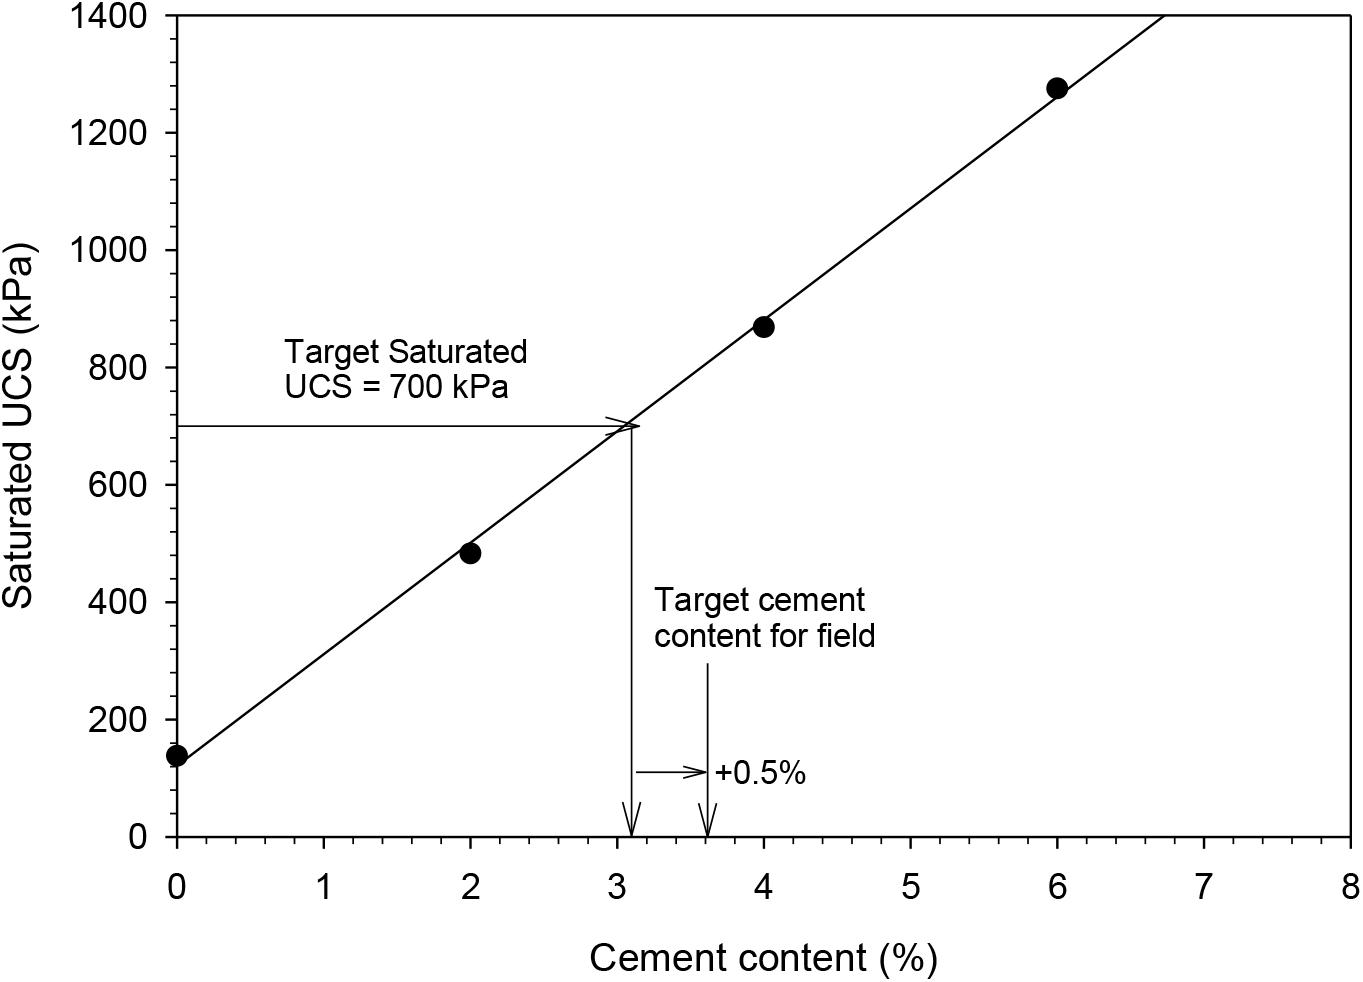
Figure 8. Determination of target cement content for field application.
Summary and Conclusion
Results of a laboratory study focused on cement stabilization of 28 soils obtained from 9 active construction sites are presented in this paper. The materials consisted of glacial till, loess, and alluvium sand. Type I/II Portland cement was used for stabilization of these materials. 2 inch by 2 inch specimens of treated and untreated specimens were prepared, cured, and tested for UCS with and without vacuum saturation. The F200, Atterberg limits, and AASHTO GI were determined before and after treatment. The results were analyzed using multi-variate regression analysis to assess influence of the various soil index properties on post-stabilization material properties. Key findings from the test results and analysis are as follows:
1. F200 of the material decreased with increasing cement content for a majority of the soils. The percent cement content, F200 before treatment, and liquid limit were found to be statistically significant in predicting the F200 after treatment. The multi-variate model showed an R2 of about 0.9 and RMSE of about 7% in predicting the F200 after treatment.
2. With the exception of a few materials, the liquid limit and plasticity index of all materials decreased with increasing cement content. The percent cement content and clay content parameters were found to be statistically significant in predicting the plasticity index of materials after stabilization. The multi-variate model showed an R2 of about 0.5 and RMSE of about 5%.
3. The GI values decreased with increasing cement content for a majority of the soils. The percent cement content, F200, liquid limit, and plasticity index parameters were found to be statistically significant in predicting the group index values after treatment. The multi-variate model showed an R2 of about 0.7 and RMSE of about 3.
4. The UCS of specimens increased with increasing cement content, as expected. The average saturated UCS of the unstabilized materials varied between 0 and 400 kPa. The average saturated UCS of stabilized materials varied between 0.3 and 2,000 kPa at 4% cement content, 0.8 and 3700 kPa at 8% cement content, and 1.1 and 4,900 kPa at 12% cement content. The laboratory testing and evaluation procedure for cement stabilization mix design targets a 700 kPa saturated UCS. The UCS of the saturated specimens was on average 1.5 times lower than that of the unsaturated specimens.
5. The percent cement content, sand content, fines content, and liquid limit were found to be statistically significant in predicting unsaturated and vacuum saturated UCS. The models showed an R2 of about 0.85 and RMSE of about 500 kPa for vacuum saturated specimens and 700 kPa for unsaturated specimens.
Data Availability Statement
All datasets presented in this study are included in the article/supplementary material.
Author Contributions
SL conducted the laboratory works and data analysis, and prepared the project report and manuscript. YY prepared part of the manuscript. CL, LY, PZ, LW, and TH reviewed the article and gave some valuable feedbacks. All authors contributed to the article and approved the submitted version.
Funding
The authors would like to thank the Science and Technology Innovation Special Fund Project of Central Government Public Welfare Research Institutes (Grant No. 2019-C504) and Guizhou Province Department of Transport Research Project Fund (Grant No. 2020-122-013) for sponsoring this study. The financial supports provided by Natural Science Foundation of Shaanxi Province in China (Grant No. 2019JQ-498), the key scientific and technological projects of transportation industry (Project No. 2019-MS2-039), and the Science and Technology Progress and Innovation Project of Hunan Provincial Department of Transportation (Grant No. 201904) are greatly appreciated.
Conflict of Interest
YY was employed by the Xiandai Investment Co., Ltd.
The remaining authors declare that the research was conducted in the absence of any commercial or financial relationships that could be construed as a potential conflict of interest.
Acknowledgments
A project report “Cement stabilization of embankment materials” that the corresponding author SL submitted to Iowa DOT in 2015, which has been documented in the National Transportation Library. The manuscript summarizes the key findings of the technical report, so the manuscript is more concise and can help more readers to learn this work.
References
ASTM (2000). Standard Test Methods for Liquid Limit, Plastic Limit, and Plasticity Index of Soils. Annual BOOK of ASTM Standards, ASTM D4318 - 00. West Conshohocken, PA: ASTM.
ASTM (2007). ASTM D422 - 63(2007)e1 Standard Test Method for Particle Size Analysis of Soils. West Conshohocken, PA: American Standards for Testing Methods.
ASTM (2009). Standard Test Methods for Laboratory Compaction Characteristics of Soil Using Modified Effort (56,000 ft-lbf/ft3(2,700 kN-m/m3)). West Conshohocken, PA: ASTM International.
ASTM (2013). Standard Test Methods for Laboratory Compaction Characteristics of Soil Using Standard Effort (12,400 ft-lbf/ft3(600 kN-m/m3))1. West Conshohocken, PA: ASTM International.
ASTM (2014a). Standard Specification for Fly Ash and Other Pozzolans for Use With Lime for Soil Stabilization. Annual Book of ASTM Standards, ASTM C593-05. West Conshohocken, PA: ASTM.
ASTM (2014b). Standard Test Methods for Compressive Strength of Molded Soil-Cement Cylinders. Annual Book of ASTM Standards, ASTM D1633-17. West Conshohocken, PA: ASTM.
ASTM (2019). Standard Test Methods for Moisture-Density (Unit Weight) Relations of Soil-Cement Mixtures ASTM D558 / D558M - 19. West Conshohocken, PA: American Standards for Testing Methods.
Balmer, G. G. (1958). Shear Strength And Elastic Properties Of Soil-Cement Mixture Under Triaxial Loading. Skokie, IL: Portland Cement Association Research and Development Laboratories.
Chu, T. Y., Davidson, D. T., Goecker, W. L., and Moh, Z. C. (1955). Soil Stabilization with lime fly ash mixtures: preliminary studies with silty and clayey soils. Highway Res. Board Bull. 108, 102–112.
Du, Y.-J., Jiang, N.-J., Liu, S.-Y., Jin, F., Singh, D. N., and Puppala, A. J. (2013). Engineering properties and microstructural characteristics of cement-stabilized zinc-contaminated kaolin. Can. Geotechn. J. 51, 289–302. doi: 10.1139/cgj-2013-0177
Henry, K. S., Olson, J. P., Farrington, S. P., and Lens, J. (2005). Improved Performance of Unpaved Roads During Spring Thaw. Hanover: Engineer Research and Development Center Cold Regions Research.
Horpibulsuk, S. (2012). Strength and Microstructure of Cement Stabilized Clay. London: INTECH Open Access Publisher.
Li, C., Ashlock, J. C., Lin, S., and Vennapusa, P. K. R. (2018). In situ modulus reduction characteristics of stabilized pavement foundations by multichannel analysis of surface waves and falling weight deflectometer tests. Construct. Build. Mater. 188, 809–819. doi: 10.1016/j.conbuildmat.2018.08.163
Li, C., Ashlock, J. C., White, D. J., and Vennapusa, P. K. R. (2019). Mechanistic-based comparisons of stabilised base and granular surface layers of low-volume roads. Intern. J. Pavem. Eng. 20, 112–124. doi: 10.1080/10298436.2017.1321417
Li, S., Wu, L., Bian, X., Song, C., Li, P., and Han, Z. (2019). “Statistically analysis for stability of various protection modes of expansive soil cutting slope,” in Proceedings of the 2019 International Conference on Virtual Reality and Intelligent Systems (ICVRIS), Jishou.
Li, C., Vennapusa, P. K. R., Ashlock, J., and White, D. J. (2017). Mechanistic-based comparisons for freeze-thaw performance of stabilized unpaved roads. Cold Reg. Sci. Technol. 141, 97–108. doi: 10.1016/j.coldregions.2017.06.004
Li, C., Zheng, J., Zhang, Z., Sha, A., and Li, J. (2020). Morphology-based indices and recommended sampling sizes for using image-based methods to quantify degradations of compacted aggregate materials. Construct. Build. Mater. 230:116970. doi: 10.1016/j.conbuildmat.2019.116970
Lo, S. R., and Wardani, S. P. R. (2002). Strength and dilatancy of a stabilized by a cement and fly ash mixture. Can. Geotechn. J. 39, 77–89.
Lorenzo, A., and Bergado, D. T. (2004). Fundamental parameters of cement-admixed clay-New approach. J. Geotechn. Geoenviron. Eng. 130, 1042–1050. doi: 10.1061/(asce)1090-0241(2004)130:10(1042)
Mitchell, J. K. (1976). “The properties of cement-stabilized soils,” in Proceeding of the Residential Workshop On Materials And Methods For Low Cost Road, Rail, And Reclamation Works, Leura.
O’Flaherty, C. A., Edgar, C. E., and Davidson, D. T. (1963). “The iowa state compaction apparatus: a small sample apparatus for use in obtaining density and strength measurements of soils and soil-additives,” in Proceedings of the Special Report Prepared for Presentation at the 42nd Annual Meeting of the Highway Research Board, Ames.
Parsons, R. L., and Milburn, J. P. (2003). Engineering behavior of stabilized soils. Transport. Res. Record J. Transport. Res. Board 1837, 20–29.
Qubain, B. S., Heirendt, K. M., and Li, J. (2006). “Quality assurance and quality control requirements for lime and cement subgrade stabilization,” in Proceedings of the Pavement Mechanics and Performance-GeoShanghai International Conference, Wayne, PA.
Rashid, A. S. A., Kalatehjari, R., Noor, N. M., Yaacob, H., Moayedi, H., and Sing, L. K. (2014). Relationship between liquidity index and stabilized strength of local subgrade materials in a tropical area. Measurement 55, 231–237. doi: 10.1016/j.measurement.2014.05.018
Riaz, S., Aadil, N., and Waseem, U. (2014). Stabilization of subgrade soils using cement and lime: a case study of Kala Shah Kaku, Lahore, Pakistan. Pak. J. Sci. 66, 39–44.
Sariosseiri, F. (2008). Critical State Framework For Interpretation Of Geotechnical Properties Of Cement Treated Soils. Ph. D thesis, Washington State University, Pullman, WA.
Sariosseiri, F., Razavi, M., Carlson, K., and Bahareh, G. (2011). Stabilization of soils with portland cement and CKD and application of CKD on slope erosion control. Geo Front. 2011, 778–787.
Sarkar, G., Islam, M. R., Alamgir, M., and Rokonuzzaman, M. (2012). Study on the geotechnical properties of cement based composite fine-grained soil. Intern. J. Adv. Struct. Geotechn. Eng. 1, 42–49.
Spangler, M., and Patel, O. (1950). “Modification of a Gumbotil soil by lime and Portland cement admixtures,” in Proceedings of the Twenty-Ninth Annual Meeting of the Highway Research Board Held, Washington, DC.
Uddin, K., Balasubramaniam, A. S., and Bergado, D. T. (1997). Engineering behaviors of cement-treated bangkok soft clay. Geotechn. Eng. J. 28, 89–119.
White, D. J., and Bergeson, K. L. (2001). Long-term strength and durability of hydrated fly-ash road bases. Transport. Res. Record 1755, 151–159. doi: 10.3141/1755-16
White, D. J., Ceylan, H., Jahren, C. T., Phan, T. H., Kim, S. H., Gopalakrishnan, K., et al. (2008). Performance Evaluation Of Concrete Pavement Granular Subbase–Pavement Surface Condition Evaluation. Moines, IA: State Library of Iowa.
White, D. J., Harrington, D., and Thomas, Z. (2005). Fly Ash Soil Stabilization For Non-Uniform Subgrade Soils, Volume I: Engineering Properties And Construction Guidelines. Ames, IA: Center for Portland Cement Concrete Pavement Technology (PCC Center).
White, D. J., Vennapusa, P., and Jahren, C. T. (2004). Determination of the Optimum Base Characteristics for Pavements. Ames, IA: Iowa Department of Transportation.
White, D. J., Vennapusa, P., Tutumluer, E., Vavrik, W., Moaveni, M., and Gillen, S. (2018). Spatial verification of modulus for pavement foundation system. Transport. Res. Record 2672, 333–346. doi: 10.1177/0361198118782266
Winterkorn, H. F., and Pamukcu, S. (1990). “Soil stabilization and grouting,” in Foundation Engineering Handbook, ed. H.-Y. Fang (New York, NY: Van Nostrand Reinhold).
Yang, B., Zhang, Y., Ceylan, H., Kim, S., and Gopalakrishnan, K. (2018). Assessment of soils stabilized with lignin-based byproducts. Transport. Geotech. 17, 122–132. doi: 10.1016/j.trgeo.2018.10.005
Zhang, Y., Johnson, A. E., and White, D. J. (2016). Laboratory freeze–thaw assessment of cement, fly ash, and fiber stabilized pavement foundation materials. Cold Reg. Sci. Technol. 122, 50–57. doi: 10.1016/j.coldregions.2015.11.005
Keywords: soil stabilization, cement stabilization, unconfined compressive strength, fines content, Atterberg limits, AASHTO group index
Citation: Yang Y, Li S, Li C, Wu L, Yang L, Zhang P and Huang T (2020) Comprehensive Laboratory Evaluations and a Proposed Mix Design Procedure for Cement-Stabilized Cohesive and Granular Soils. Front. Mater. 7:239. doi: 10.3389/fmats.2020.00239
Received: 29 May 2020; Accepted: 29 June 2020;
Published: 30 July 2020.
Edited by:
Hui Yao, Beijing University of Technology, ChinaReviewed by:
Yang (Alex) Zhang, Australian Road Research Board (ARRB), AustraliaShifan Wu, Nanyang Technological University, Singapore
Copyright © 2020 Yang, Li, Li, Wu, Yang, Zhang and Huang. This is an open-access article distributed under the terms of the Creative Commons Attribution License (CC BY). The use, distribution or reproduction in other forums is permitted, provided the original author(s) and the copyright owner(s) are credited and that the original publication in this journal is cited, in accordance with accepted academic practice. No use, distribution or reproduction is permitted which does not comply with these terms.
*Correspondence: Shengting Li, c3QubGlAcmlvaC5jbg==