 Philipe Kiefer1
 Martin Maiwald1
 Joachim Deubener1*
 Robert Balzer2
 Harald Behrens2
 Tina Waurischk3
 Stefan Reinsch3
 Ralf Müller3
- 1Institute of Non-Metallic Materials, Clausthal University of Technology, Clausthal-Zellerfeld, Germany
- 2Institute of Mineralogy, Leibniz University Hannover, Hanover, Germany
- 3Federal Institute of Materials Research and Testing (BAM), Berlin, Germany
To explore the impact of ambient and structural water on static fatigue, the initiation and growth of 3279 Vickers induced median radial cracks were automatically recorded and analyzed. We find that humidity is more efficient in initiating cracks and promoting their growth than water, which is dissolved in the glass structure. In particular for slow crack growth (< 3 × 10⁻⁶ m s–1), tests in dry nitrogen showed a considerable decrease in the crack growth exponent with increasing water content of the glasses. On the other hand, if tests were performed in humid air, the crack growth exponent was independent of the water content of the hydrous glasses, while stress intensity decreased slightly. These observations indicate that water promotes the processes at the crack-tip regardless of its origin. However, ambient water is more efficient.
Introduction
Water is omnipresent at glass surfaces. In particular at the crack-tip, where vapor and liquid water (due to capillary condensation) can react with the stressed glass network. However, the glass-water interaction is complex and not adequately understood, although the control of such the environmental reactions at the crack-tip is essential for improving the practical strength and the endurance limit of glassy products.
The basic idea of studying hydrous glasses is to create a situation where water species (hydroxyl groups and water molecules) are already present in the glass structure and to confront them with environmental water molecules reacting at the crack-tip. This approach requires several steps. Firstly, water-containing glasses must be synthesized to shed light on the influence of dissolved H2O on the glass structure. The structural effects depend on composition as was shown by previous studies on borate (Bauer et al., 2015), borosilicate (Bauer et al., 2017; Behrens et al., 2018), silicoborate (Balzer et al., 2019b), phosphate (Balzer et al., 2019a), aluminosilicate (Balzer et al., 2020), and soda-lime silicate glasses (Kiefer et al., 2019). Secondly, volumetric and mechanical properties of hydrous glasses need to be investigated. Due to their technical importance, these investigations were carried out on soda-lime silicate glasses (Kiefer et al., 2019). For a microscope slide glass, it was found that density, elastic moduli and Vickers hardness decrease with increasing water content, whereas the Poisson’s ratio and the water content of the hydrous glasses are positively correlated. On the one hand, the trends reported by previous work reflect the non-linear change in the concentrations of hydroxyl groups and water molecules in the glasses. On the other hand, the properties were found to be environmentally sensitive, if the glass surface was involved, e.g., during indentation hardness measurements. It was observed that for dry glasses in humid atmospheres and for hydrous glasses in dry atmospheres, the indent size changed with the duration of the indentation, indicating that water was capable to relax stressed bonds in both scenarios. Particularly, the response times of water species coming from the environment and those being dissolved in the glass structure were found to be effectively equal. Recently, the hydrous glass approach was applied to capture crack growth in a nominal dry (0.13 mol% H2O) and a hydrous microscope slide glass (17.08 mol% H2O) using the double cantilever beam (DCB) technique (Waurischk et al., 2020). Under vacuum, crack propagation rates > 10–7 m s–1 in the hydrous glass were shifted to higher stress intensity, whereas under humid environment (air) crack propagation rates of the hydrous glass were shifted to lower stress intensity with respect to the dry glass. The apparent toughening effect of the dissolved water in the glass under vacuum was explained by higher energy dissipation during fracturing. Water-related internal friction bands observed in dynamic-mechanical spectroscopy studies (Reinsch et al., 2013; Waurischk et al., 2020) supported this idea. With respect to the behavior in air, it was suggested that the dissipation mechanism was overwhelmed by environmental water, which led to the weakening, i.e., a decrease in stress intensity (Waurischk et al., 2020).
With this background, the hydrous glass approach was employed in this study with respect to the sub-critical growth of Vickers induced median radial cracks. A series of 5 microscope slide glasses with water contents ranging from 0.75 to 17.08 (mol%) was tested in two different environments (dry N2 gas and air) to explore water-dependent effects. In spite of the limitations due to unknown amplitude of the residual stress field in this case, the technique of indentation allowed, in principle, automated experiments as well as automated data processing and analysis (Kiefer et al., 2020). Thus, to demonstrate statistical significance, the growth of in total 3279 cracks was recorded (= 6.165 million frames) and automatically analyzed to determine the mean crack length within the first minute of propagation of each glass with high accuracy.
Experimental
Preparation of Hydrous Glasses
Samples of hydrous soda-lime silicate glasses from a previous study were used (Kiefer et al., 2019). These were synthesized from commercial microscope slides (MSG) with a molar composition SiO2/Na2O/CaO/MgO/Al2O3/K2O/(Fe2O3/TiO2) = 73.2/13.3/6.6/6.2/0.5/0.2/(0 +) as analyzed by X-ray fluorescence (Axios, PANalytical). Oxides in parentheses were present in a nominal molar amount < 0.05. Hydration was performed using an internally heated pressure vessel (IHPV) in which welded Pt-capsules were placed. Samples were heated to 1673 K at a pressure of 500 MPa for 20 h. The Pt-capsules were filled with powder of the crushed MSG glass and the required amount of water. Details of the hydration procedure using the IHPV apparatus were provided in Berndt et al. (2002). The water contents were analyzed using Fourier transformed infrared spectroscopy and Karl-Fischer-titration. The results of these characterizations were published in Kiefer et al. (2019). Two platelets of ∼20 × 5 × 1 mm3 in size with diamond polished surfaces (< 1 μm) were prepared from each hydrated glass for Vickers indentation. The glasses were labeled 0W-MSG500 (0.75; 0), 1W-MSG500 (3.15; 0.214), 2W-MSG500 (5.89; 0.374), 4W-MSG (11.62; 0.605), and 6W-MSG500 (17.08; 0.739). The names refer to the nominal water content in wt% and the synthesis pressure in MPa, e.g., 4W-MSG500 = 4 wt% water, 500 MPa. The first value in parentheses behind the name indicates the analyzed water content in mol%, while the second value is the ratio cH2O/(cOH + cH2O) where cH2O and cOH represent the contents of water dissolved as molecules and hydroxyl groups, respectively, in the glass structure (Kiefer et al., 2019).
Automated Data Processing of Vickers Induced Crack Growth
To initiate radial crack growth in the hydrous glass samples, the surfaces were indented with a Vickers diamond under a fixed load of 17.66 N using a universal hardness-testing machine (ZHU 2.5, Zwick&Roell, Ulm, Germany). The automated protocol included a loading and unloading step of 5 s each [resulting in an (un)loading rate of ± 3.53 N s–1] and a dwell time of 15 s (Figure 1). Crack initiation and propagation were observed through a long distance objective at a magnification of 20x (N PLAN L, Leica, Wetzlar, Germany) of an inverted microscope (DM-ILM, Leica, Wetzlar, Germany) and recorded with a 5.3 megapixel CMOS sensor of a monochrome camera (PL-D725MU-T, PixelINK, Ottawa, Canada). The microscope was positioned directly below the hardness tester and the tip of the Vickers diamond was aligned to be parallel to the optical axis of the microscope. To increase the stiffness of the experimental setup, a steel plate with a thickness of 20 mm replaced the original microscope table. For each of the 62–143 indents per sample a video was recorded at an acquisition rate of 30 frames per second for durations of 60 s (= 1800 frames) or 65 s (= 1950 frames). The start of the image acquisition was triggered by a LabView script at the beginning of the unloading ramp (t = 0). The videos were recorded without any compression as.seq files using the TroublePix software (Norpix, Montreal, Canada). Decomposition of the videos into single Tagged Image File Format (.tiff) files was carried out using the BatchProcessor software (Norpix, Montreal, Canada). Each.tiff image was automatically analyzed via a self-written MatLab code (Mathworks, Natick, MA, United States) that was capable to measure the Euclidean distance between the center of the indent and the tip of the corner cracks for each crack of the single images. The detection of the crack tip was performed using the gray scale values. Lengths determined by the automated analysis were in excellent agreement (< 2 μm) with scanning electron microscope (SEM) measurements.
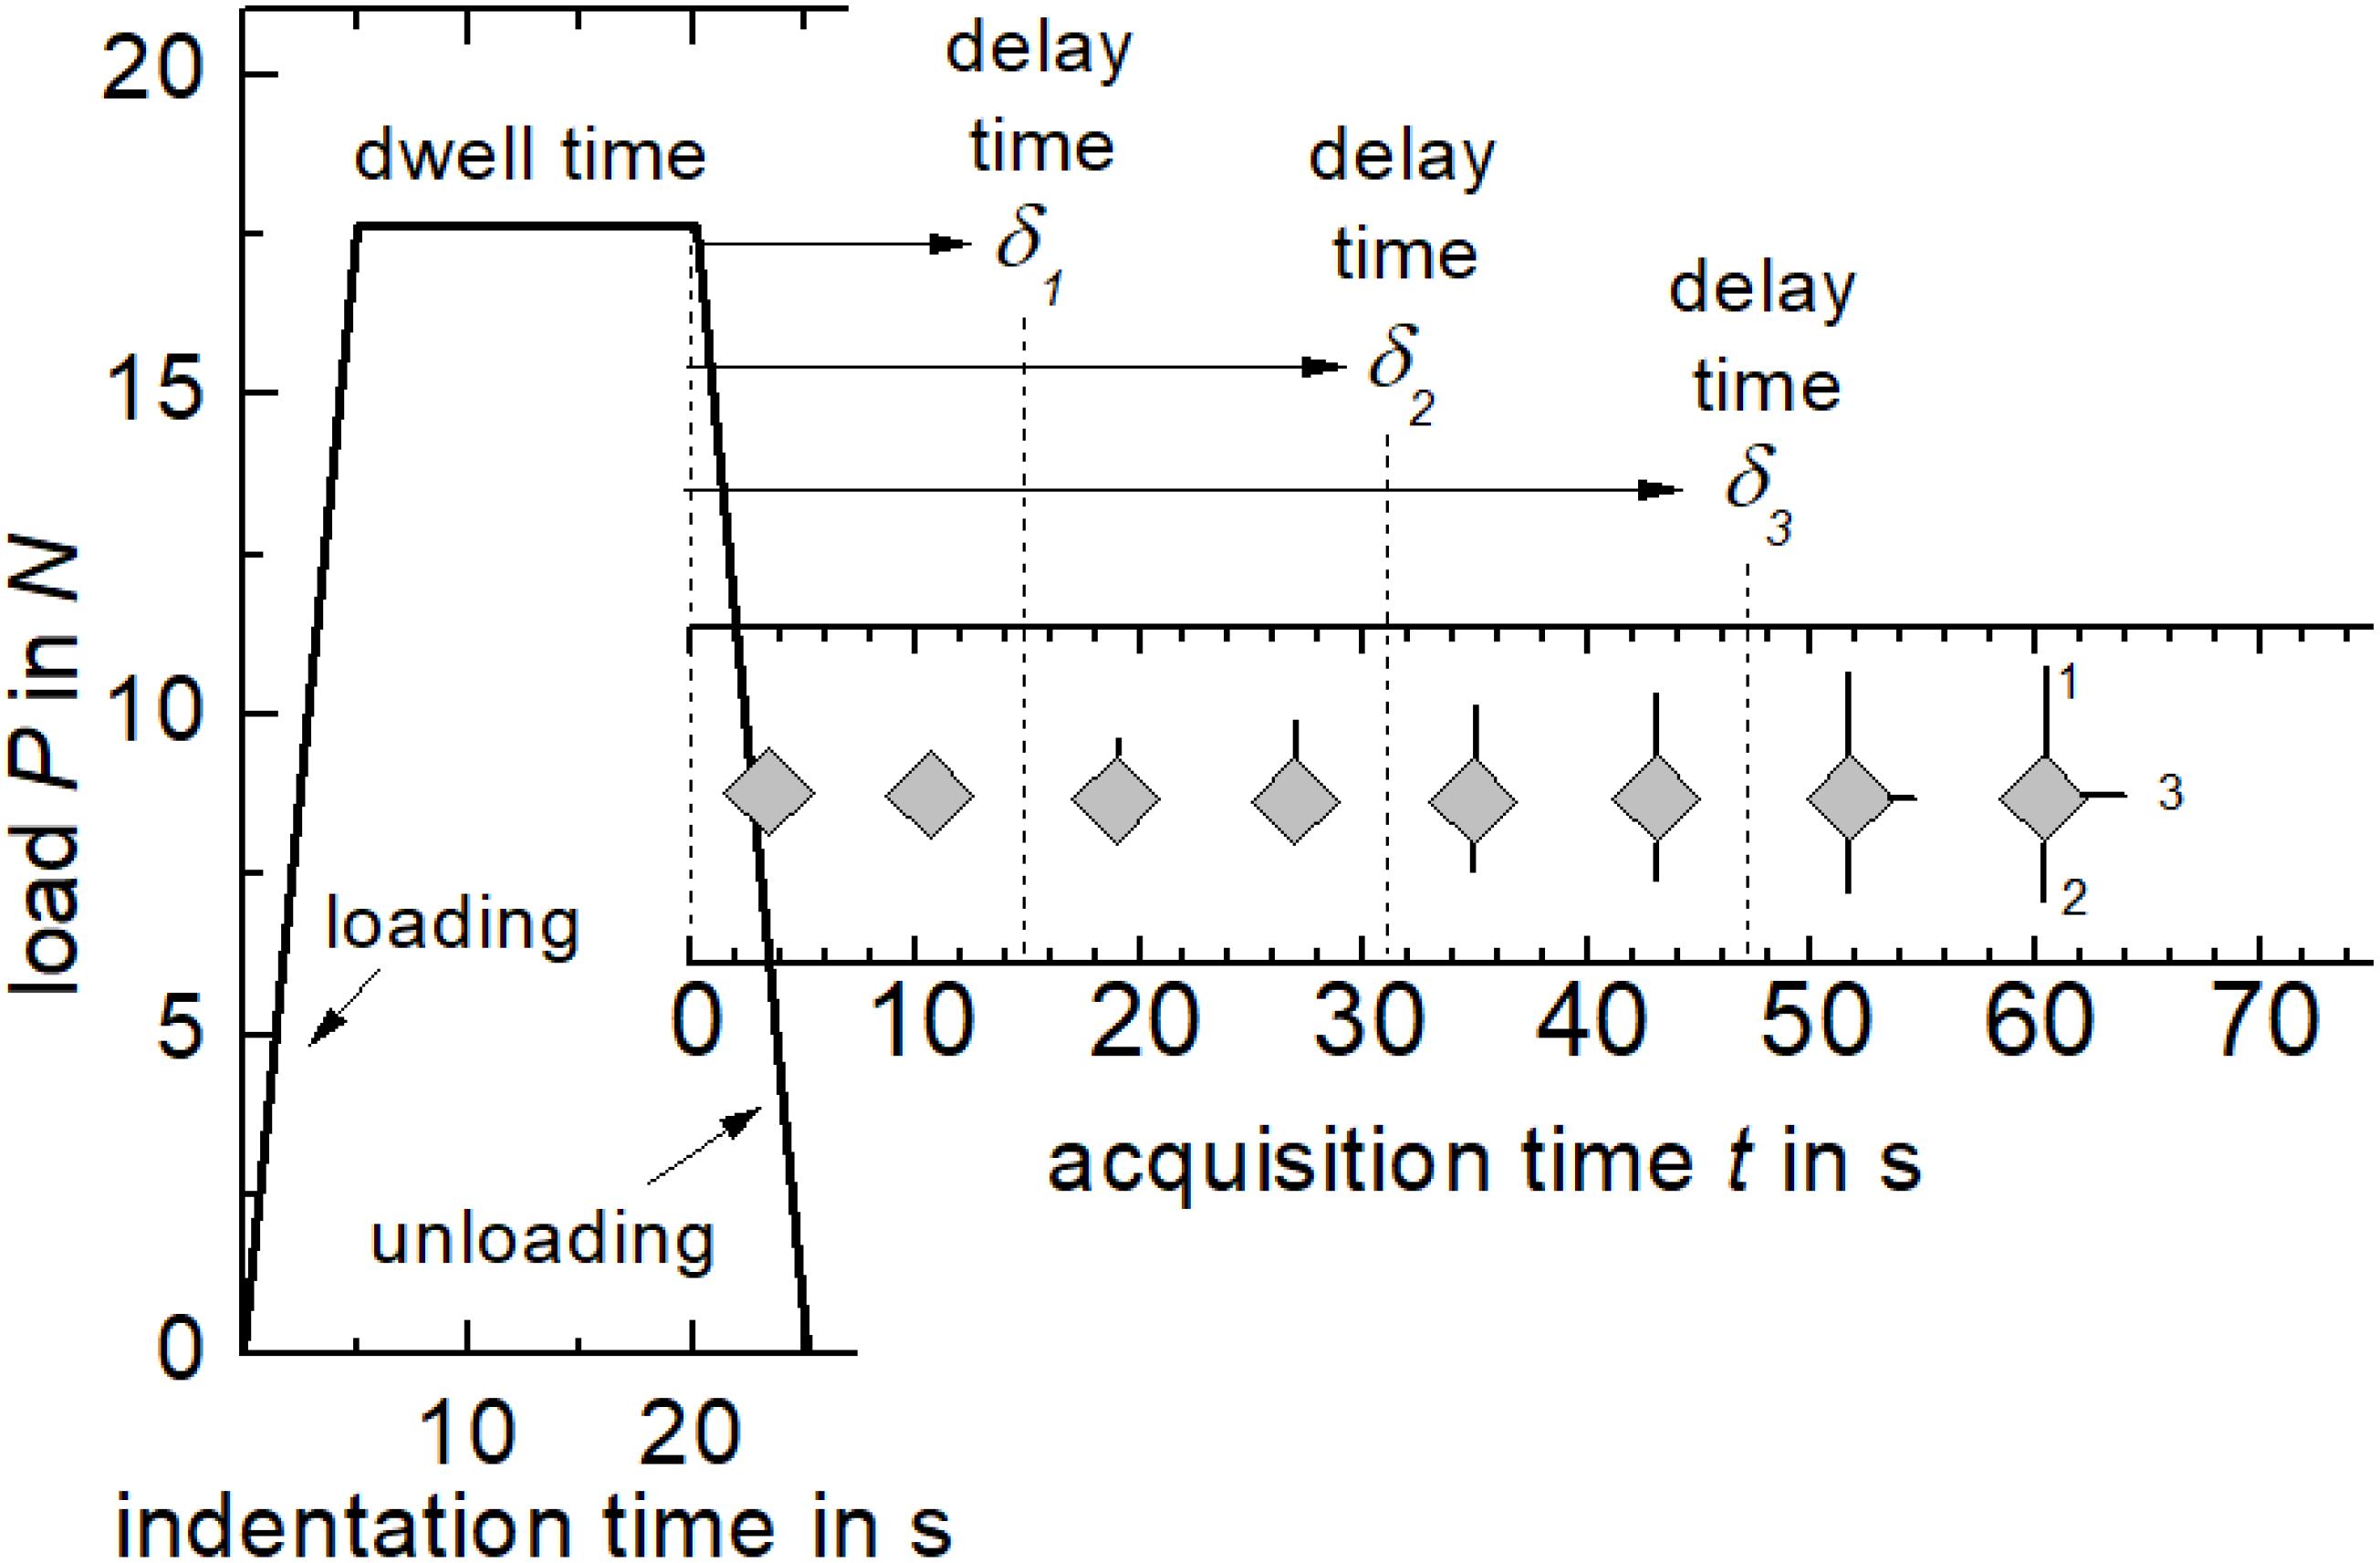
Figure 1. Scheme of the load-time curve of the Vickers indentation. Automated image acquisition was triggered at the start of the unloading ramp. Radial cracks at the corner of the indent were observed to grow after a delay time δ.
To study the impact of humidity, the measurements with the above setup were carried out in two different environments. On the one hand, the indentations were conducted in a glovebox (labmaster130, MBraun, Garching, Germany) providing a dry nitrogen atmosphere with a H2O partial pressure pH2O ≤ 30 Pa at 25°C. On the other hand, the second platelet of each specimen was measured in a cleanroom with a constant humidity of pH2O = 942 Pa at 18°C. Humidity in the glovebox was monitored with a dew point sensor (Michell Instruments, Easydew EA2-TX, Ely, United Kingdom) connected to a data logger (Ahlborn, Almemo 8590-9, Holzkirchen, Germany). In the cleanroom humidity was monitored using a FHAD462 sensor connected to an Almemo 2470-2S data logger (both Ahlborn, Holzkirchen, Germany).
Results
Table 1 summarizes the total number of median radial cracks that were initiated during Vickers indentation and counted at the end of the video acquisition of the series in dry environment after 60 s and of the series in humid environment after 65 s, respectively. Representative images of Vickers induced cracks and their growth by video capturing were presented in a previous paper (Kiefer et al., 2020). According to Wada et al. (1974), the probability of crack initiation was determined by the crack number-to-corner number ratio, with 4 corners per indent z of the Vickers diamond. Inspection of Table 1 reveals that the probability of crack initiation is higher for each glass when tested under the humid conditions of the cleanroom. Under the dry conditions of the glovebox, the frequency of initiated cracks first decreases with the water content to about 48% (4W-MSG500) and then increases to ∼82% for the glass with the highest water content. Under humid conditions, the probability of crack initiation does not depend significantly on the water content of the glass.
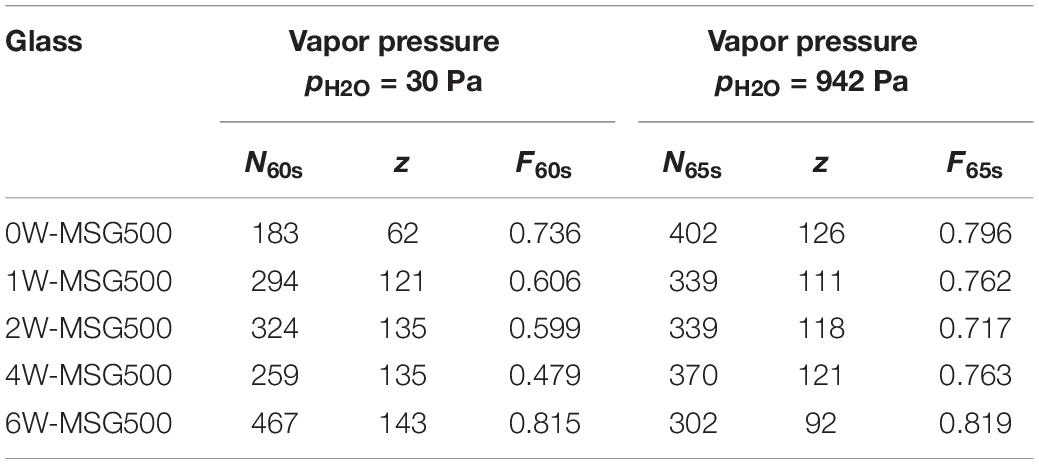
Table 1. Total number of cracks initiated after 60 s (N60s) and 65 s (N65s), number of indents (z) and the probability of crack initiation F60s and F65s.
In order to analyze a possible delay in crack initiation in more detail, cumulative frequency functions F(δ) were generated for each glass (Figure 2). This was done by arranging the delay of each crack in ascending order (δ1 ≤ δ2 ≤ δ3 ≤ ⋯ ≤ δN, the minimum first and the maximum last) followed by relating its rank number Ri to the total number of possible cracks (4z). With the commonly used median rank approximation of Benard and Bosi-Levenbach (Benard and Bosi-Levenbach, 1953) one has:
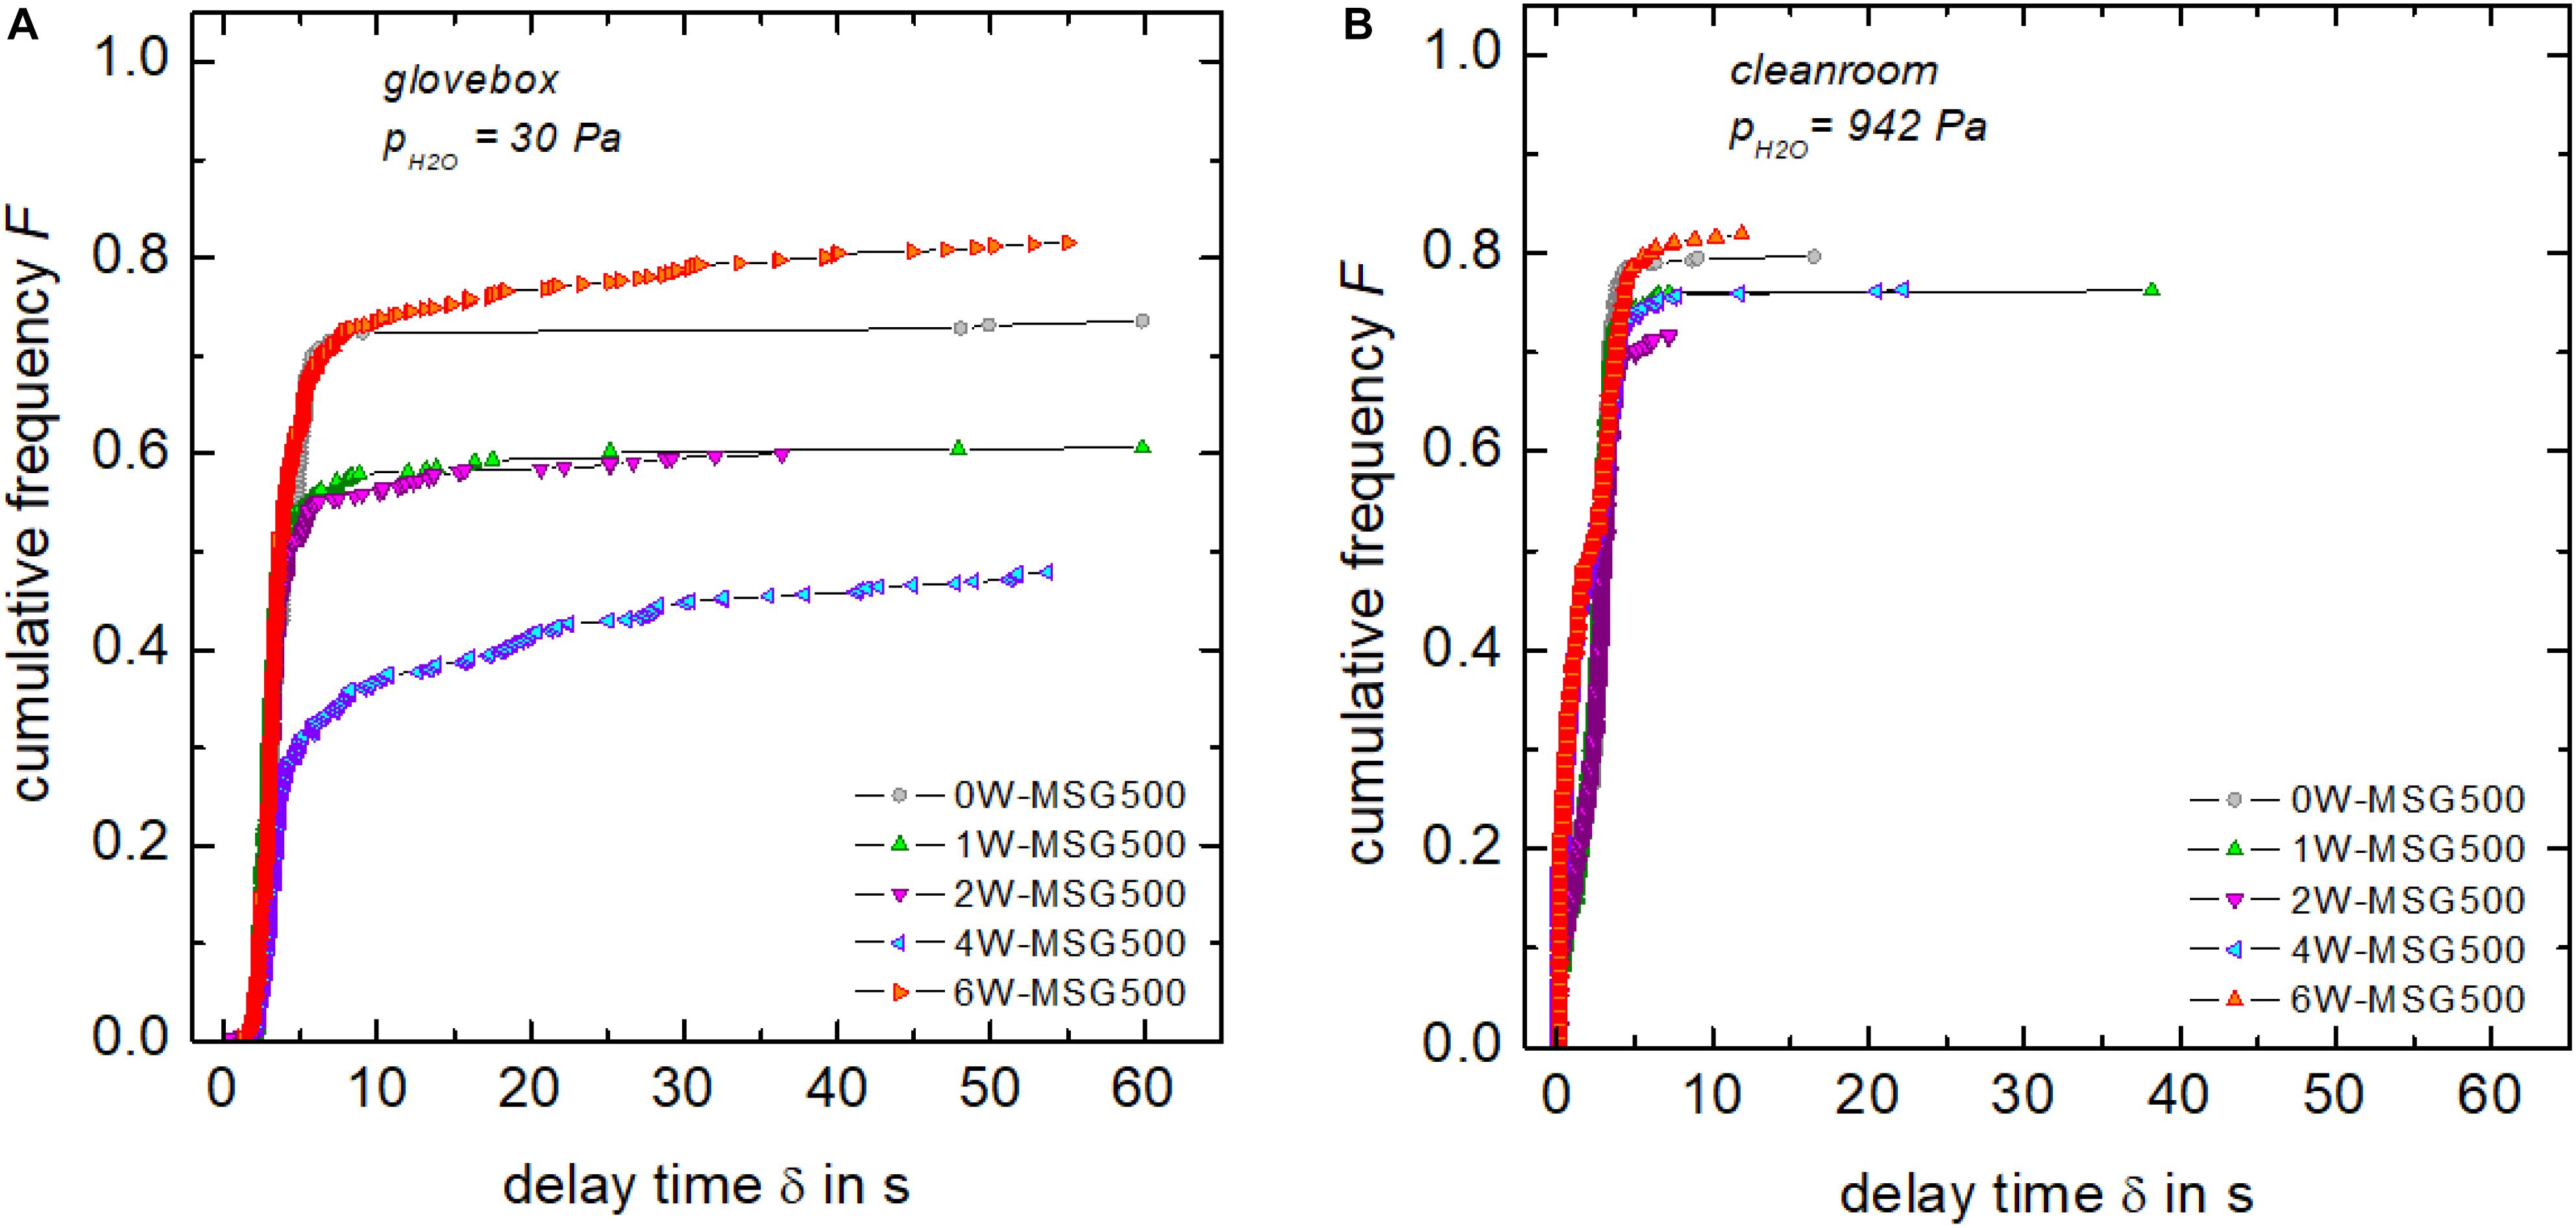
Figure 2. Cumulative frequency distribution F(δ) of the number of initiated cracks tested in dry (A) and humid (B) environments. Lines connecting data points are intended as visual guides.
For example, F = (1−0.3)/(4 × 62 + 0.4) = 0.0028 for the first crack (δ = 1.03 s) of 0W-MSG500 (pH2O = 30 Pa), while F = (183−0.3)/(4 × 62 + 0.4) = 0.736 for the latest crack (δ = 59.87 s). Under humid conditions, crack initiation for all glasses occured almost completely while unloading (δ < 5 s). When tested in dry nitrogen gas, differences in the temporal evolution of crack initiation between the nominally anhydrous and hydrous glasses were evident. With increasing water content, crack initiation becomes increasingly delayed and often occurs after unloading is completed (δ > 5 s). In summary, Figure 2 clearly shows that humidity shortens the delay time.
In order to analyze crack growth in detail, the propagation time (t−δ) was calculated by subtracting the delay δ from the acquisition time t for each crack. Figure 3 primarily shows that the crack length strongly depend on the H2O partial pressure, which has been noted already in previous studies (Benbahouche et al., 2012; Striepe et al., 2013). After 55 s, cracks have reached about 70–120 μm under dry conditions, whereas in the humid environment, crack lengths in the range 100–160 μm were detected. Further, large differences in the initial propagation rates from crack to crack are evident, leading to a broad distribution of crack lengths already shortly after their initiation (<5 s). This feature underlines the demand of analyzing crack propagation using large data sets with N > 200 (Kiefer et al., 2020).
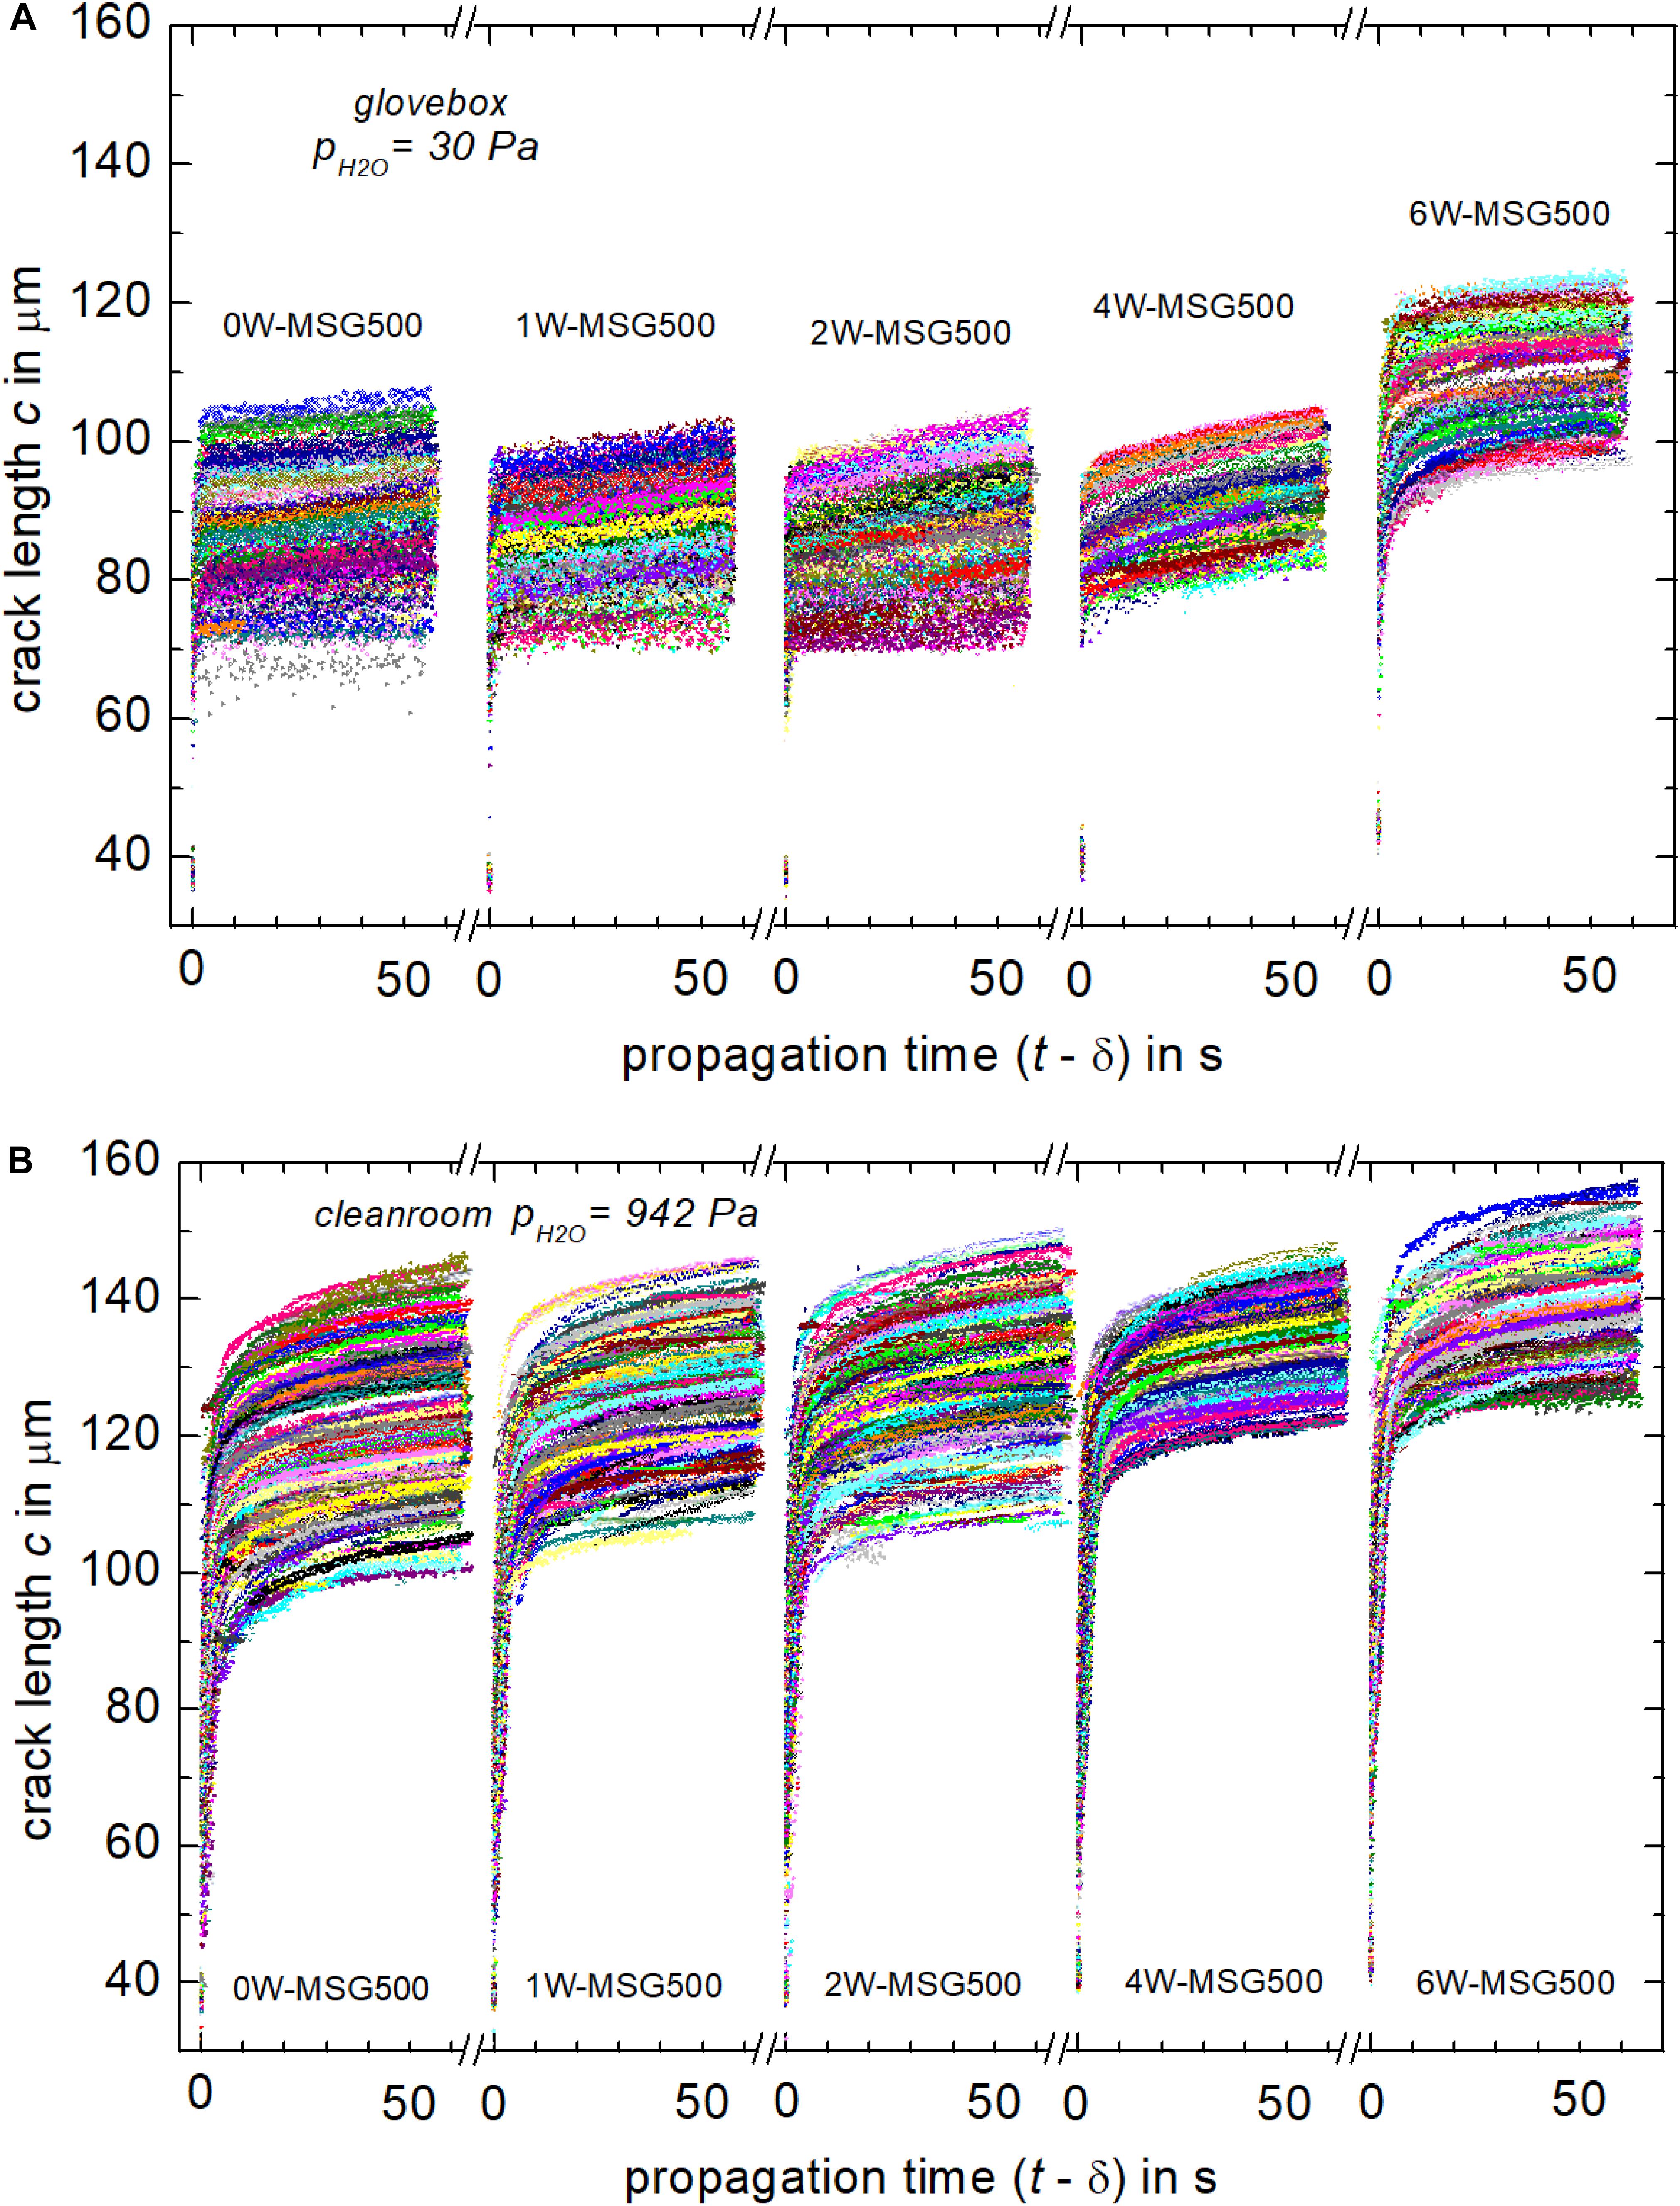
Figure 3. Length vs. propagation time of cracks grown in hydrous glasses in 30 Pa partial pressure of H2O (A) and in 942 Pa partial pressure of H2O (B).
Figure 4 exemplarily shows cumulative distribution functions of the crack length c50s (t−δ = 50 s). Cumulative frequency analyses using CumFreq1 software indicated that c50s were consistent with a Weibull distribution for all glasses and environments. Two-parameter Weibull distributions {F = 1−exp[−(c50s/cm)β] with scale parameter cm and shape parameter β} were fitted using the OriginPro 2019 software (OriginLab, Northampton, MA, United States) with median-rank regression (MRR) and maximum likelihood estimators (MLE). For MRR, data series were generated by arranging the length c50s of each crack in ascending order while simultaneously relating its rank number Ri to the total number N of observed cracks. For F(c50s) one has:
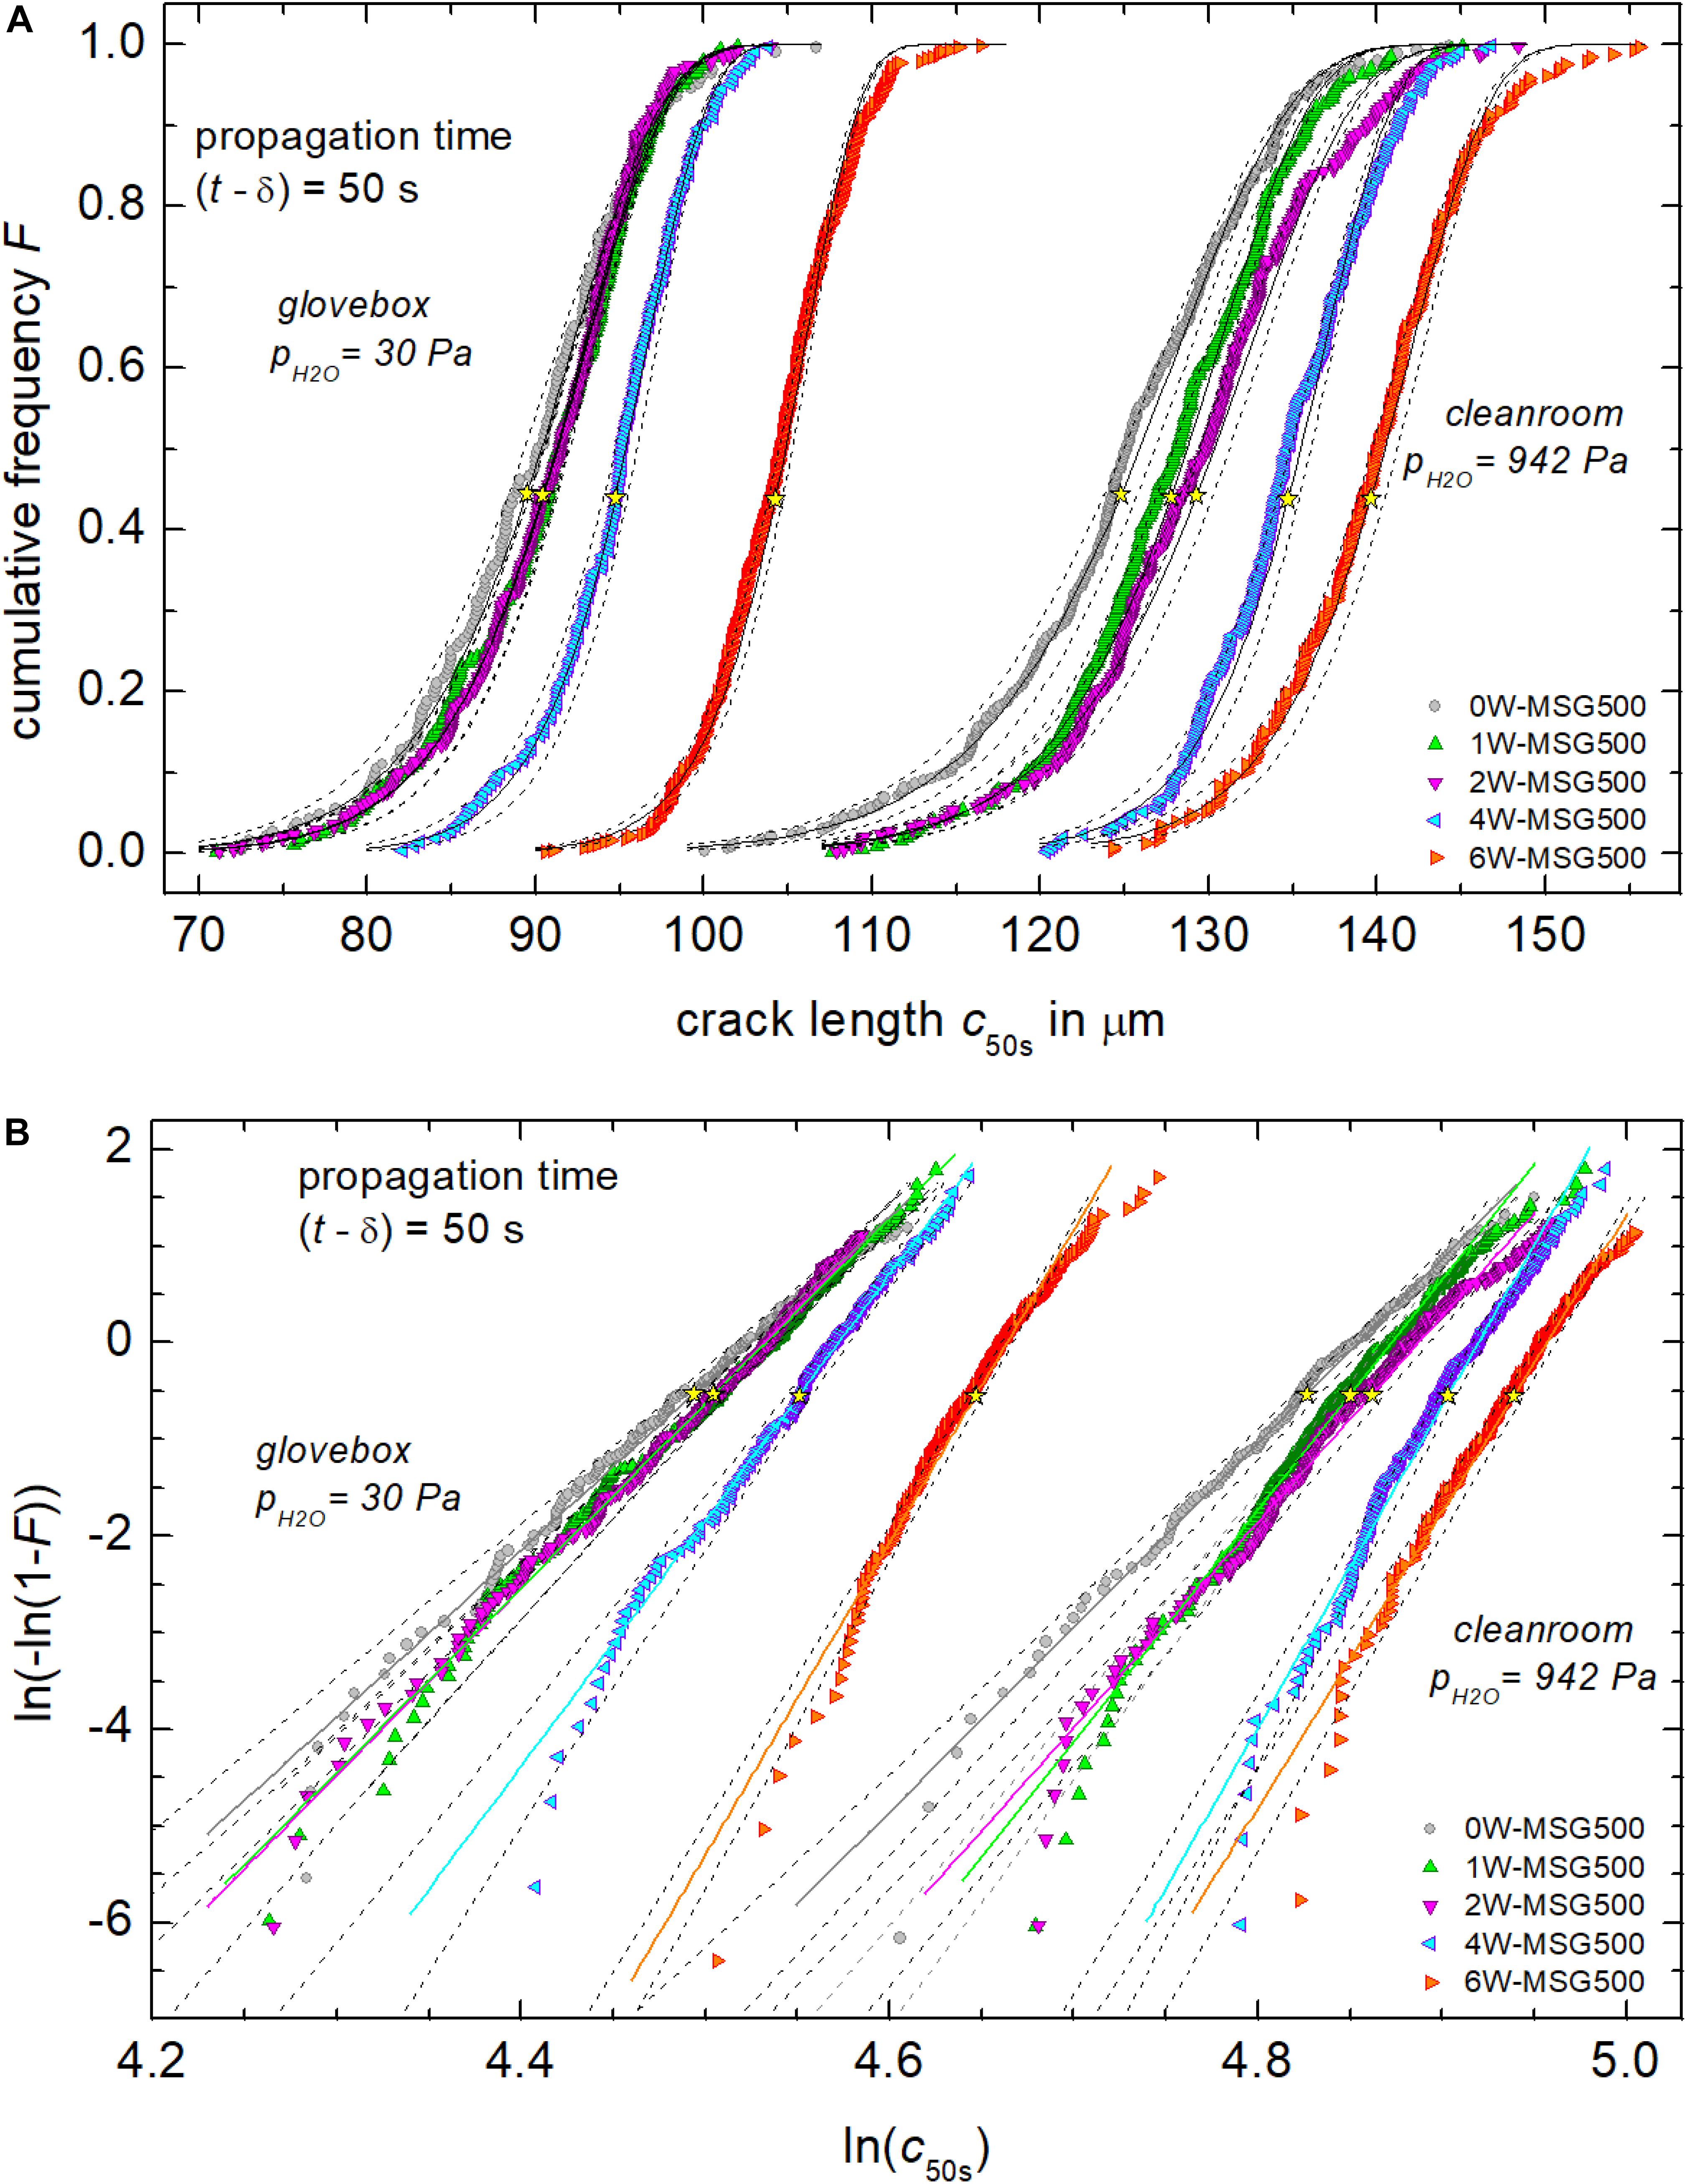
Figure 4. Cumulative frequency F of the crack length c50s in dry and humid environments (A). Part (B) shows corresponding Weibull plots of cumulative frequencies. Solid lines are the best fit (MMR and MLE) through the data with parameters compiled in Table 2, while dotted lines are 95% confidence intervals. Yellow stars indicate the mean crack length cav.
MLE does not make use of data sorting, which could lead to self-correlation of the data. In this case, data points in Figure 4 were plotted according to median ranks and the lines according to the MLE solutions. Graphs of the confidence interval of Figure 4 were used to give preference for either MRR or MLE solutions. Results of the fitting procedure were compiled in Table 2. These fitted Weibull distributions were found to be negatively skewed and of small tail. It is noteworthy that independent from the fitting procedure a few short and long cracks outside the 95% confidence interval are present in most hydrous glasses (Figure 4B). One should note that a more rigorous analysis of fracture data requires unbiassing factors, which must be calculated for any specific Weibull distribution, see e.g., ASTM C1239 – 06a. The unbiased MLE treatment improves the size of the confidence intervals, whereas for large datasets it affects only marginally the fit parameters cm and β.
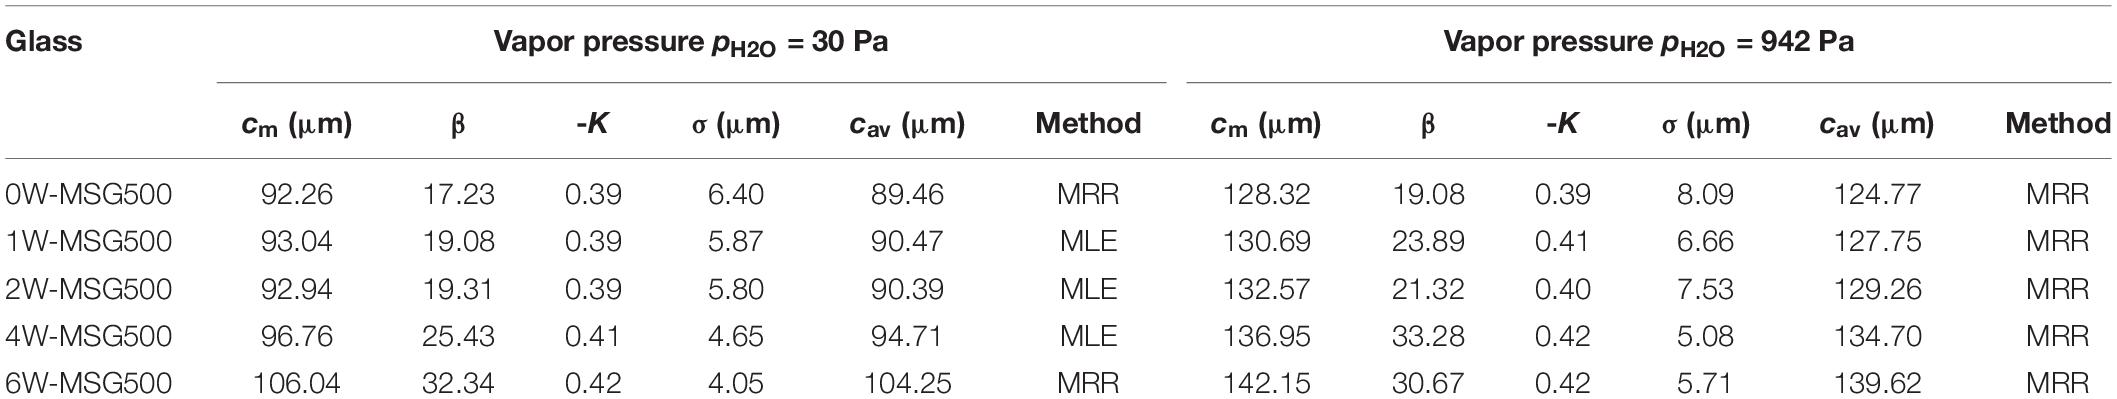
Table 2. Scale parameter cm, shape parameter β, skewness parameter K, standard deviation σ, and mean length cav of Weibull distributed crack lengths c50s (propagation time t−δ = 50 s). The skewness parameter K calculates as K = (cav-cm)/σ. Weibull distributions were fitted using median-rank regression (MRR) and maximum likelihood estimators (MLE).
Distributions of randomly selected propagation times indicated that the small skewness of the Weibull distributions of Figure 4 is typical, i.e., -K is nearly constant (0.39–0.42). Hence, the mean length cav instead of the modal length cm of cracks was taken to simplify the evaluation of the crack propagation rate within these limits. Figure 5 shows that the crack growth is largely influenced by the humidity. After 50 s of propagation, cracks have reached mean lengths in the range of 90–104 μm at low H2O partial pressure and 125–139 μm under higher pH_2O. Within the two series, a trend of longer cracks at higher water contents of the glasses is evident.
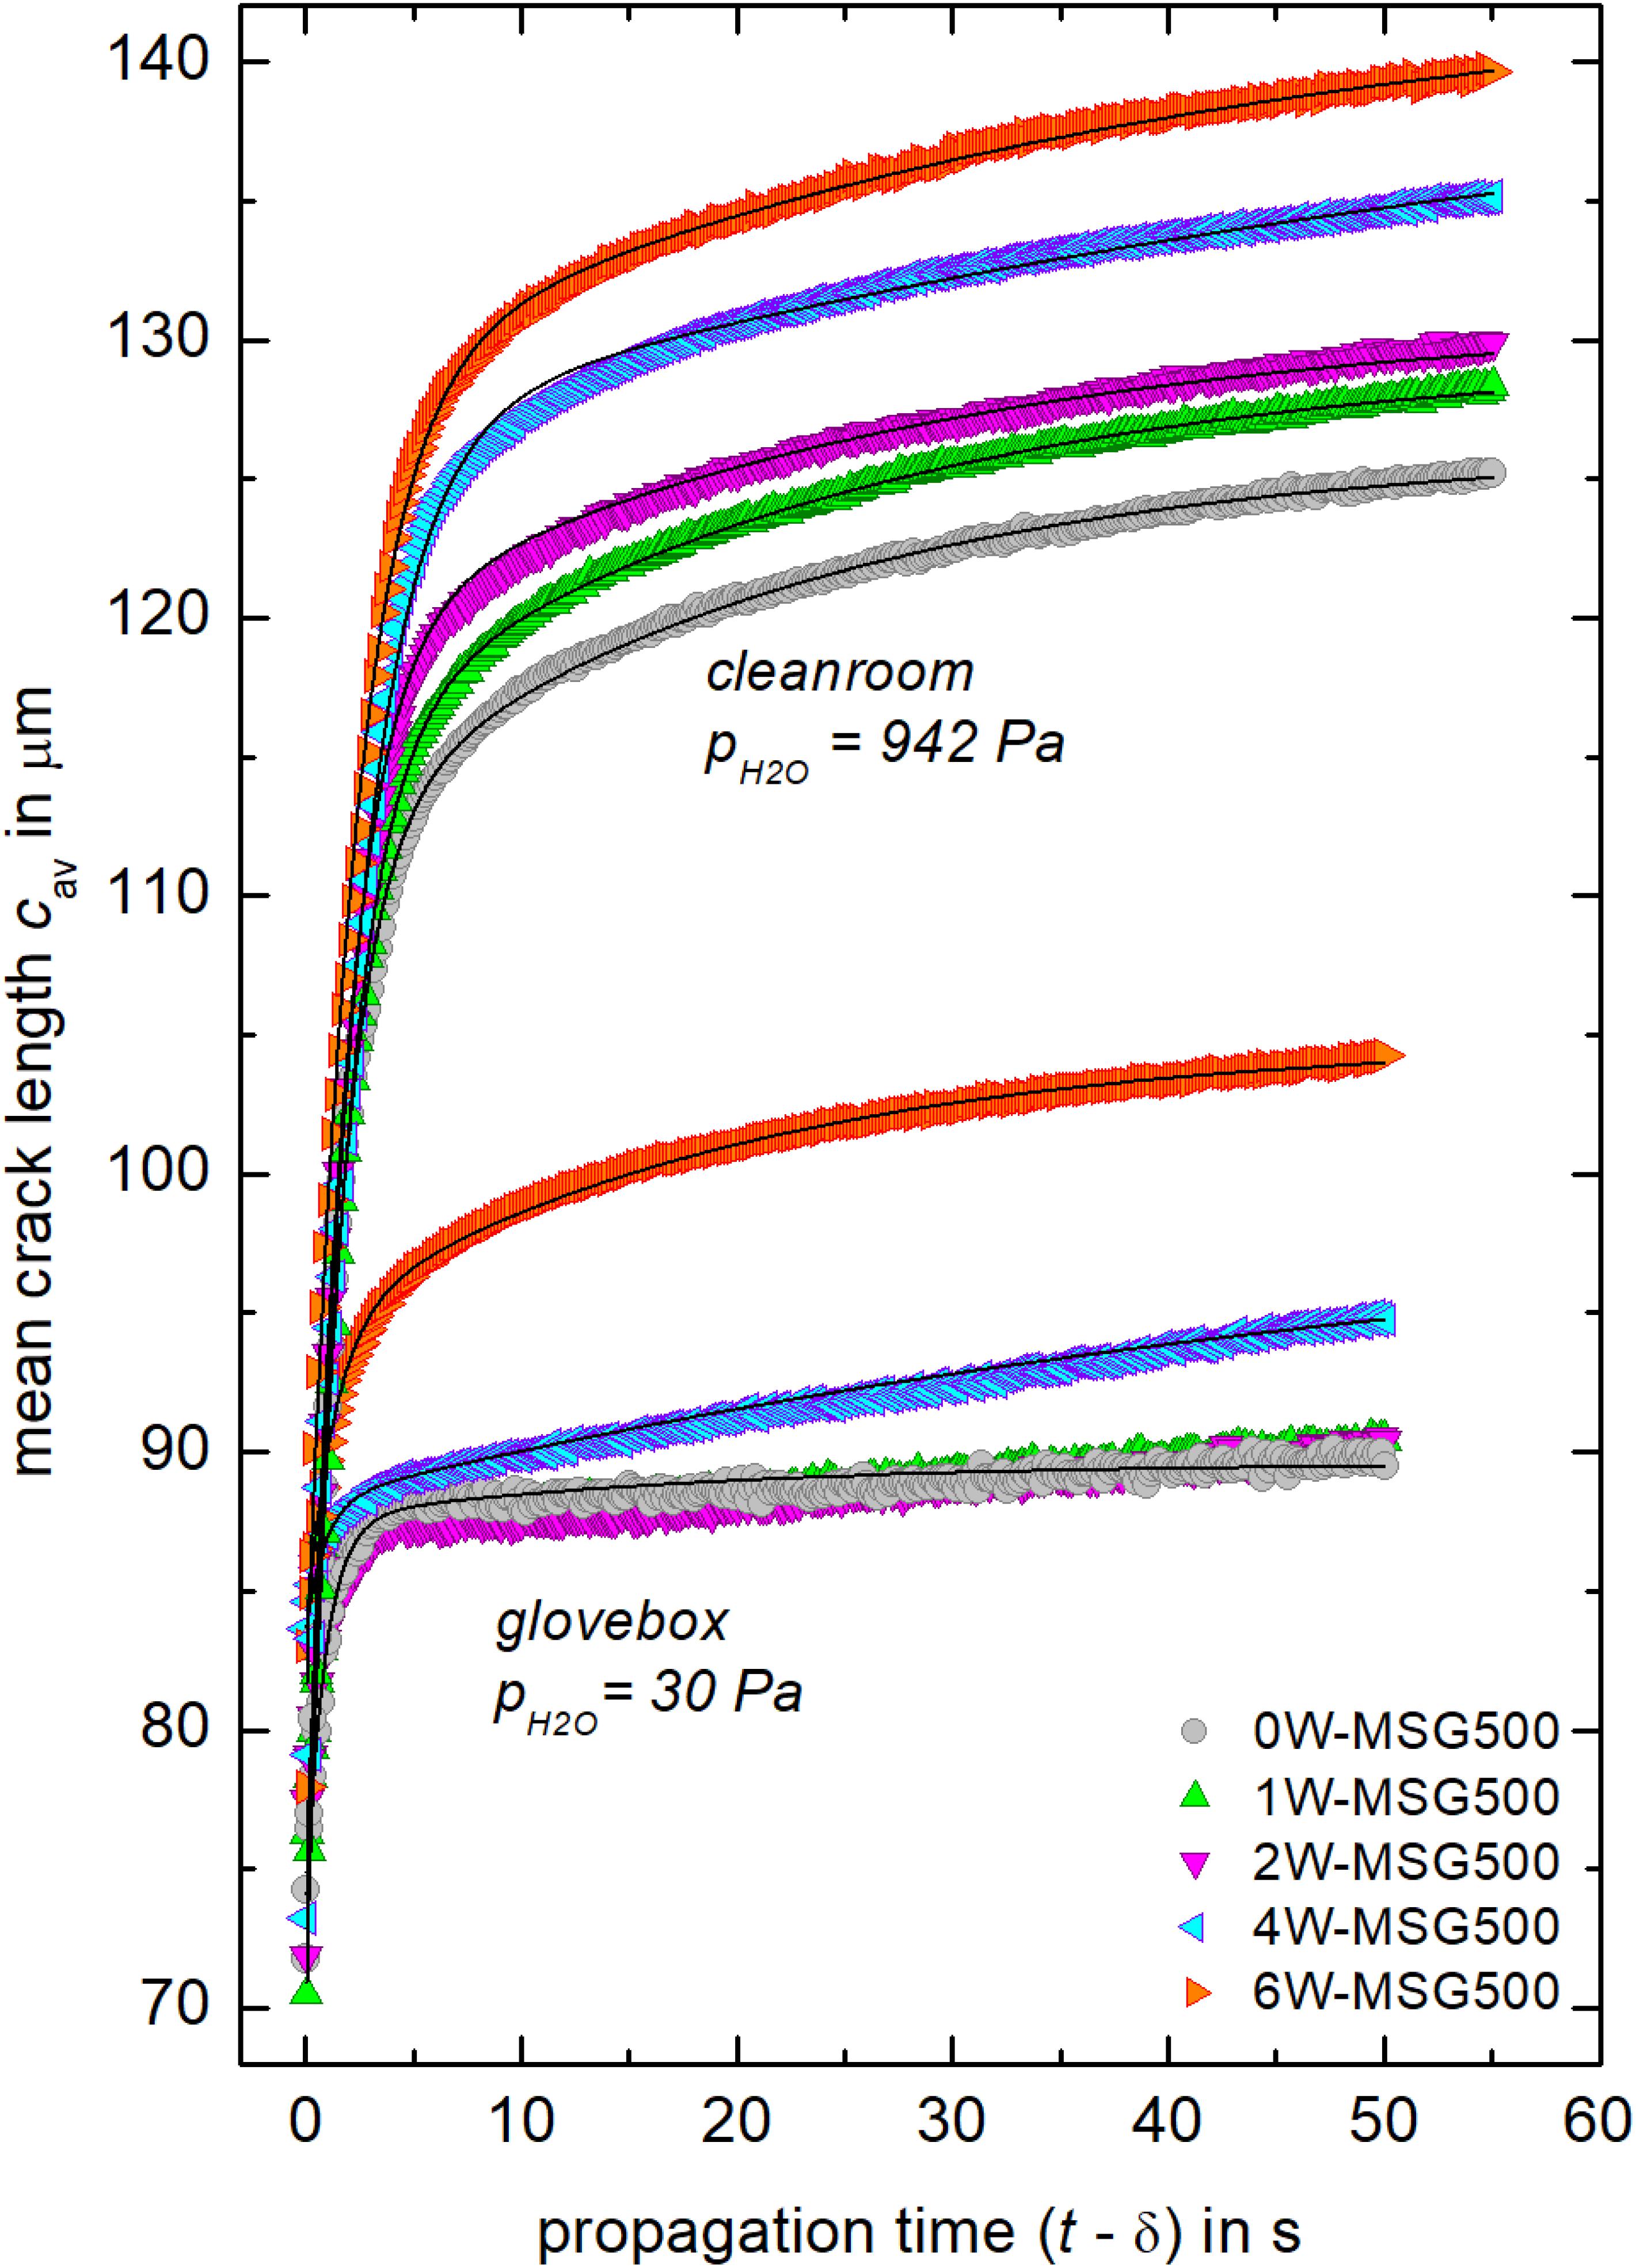
Figure 5. Mean crack length cav as a function of the propagation time (t−δ). Solid lines are best representation of data as fitted by Equation (3) with R2 = 0.977–0.999.
A two-phase exponential growth model was used to describe the dependence of average crack length on propagation time since a single-phase power-law (Dériano et al., 2004; Striepe et al., 2013; Striepe and Deubener, 2013; Pönitzsch et al., 2016; Kiefer et al., 2020) noticeably overestimates the early stage (t−δ) ≤ 5 s of most tests in higher humidity. The fitting procedure was carried out for cav data of each glass and testing environment of Figure 5, which resulted in smoothed crack length data of the form:
where c∞, S1, t1, S2 and t2 are adjustable parameters. The mean crack propagation rate vav was derived by taking the first derivative with respect to the propagation time:
Discussion
Figure 2 highlights the environmental sensitivity of crack delay times. To check if an additional influence of the water speciation on crack delay is present, crack initiation probabilities for δ = 1, 2, 3, 6, and 60 s were extracted from Figure 2 and plotted vs. the ratio of dissolved water molecules to total water content of the hydrous glasses (Figure 6). On one hand, Figure 6 shows that the influence of the water speciation is almost constant with time, i.e., the crack initiation probability develops almost uniformly. On the other hand, Figure 6A indicates a lower probability of crack initiation of glasses in which dissociated H2O and water molecules are present in equal fractions. The latter would imply that OH-groups delay cracking while water molecules speed up cracking. Reasons for this compositional effect need to be addressed in a future work. However, one has to note that similar patterns have been found for density and mechanical properties of hydrous glasses, where OH initiated an increase in the elastic moduli, whereas the trend caused by water molecules was the opposite (Kiefer et al., 2019). Further, one has to stress that this analysis is limited to a time maximum of 1 min, which rules out effects taking place during longer observation times. For instance, Bechgaard et al. (2018) reported that initiation of radial cracks in calcium aluminosilicate glasses was shorter when tested in humid atmospheres, but proceeded within 24 h after indentation.
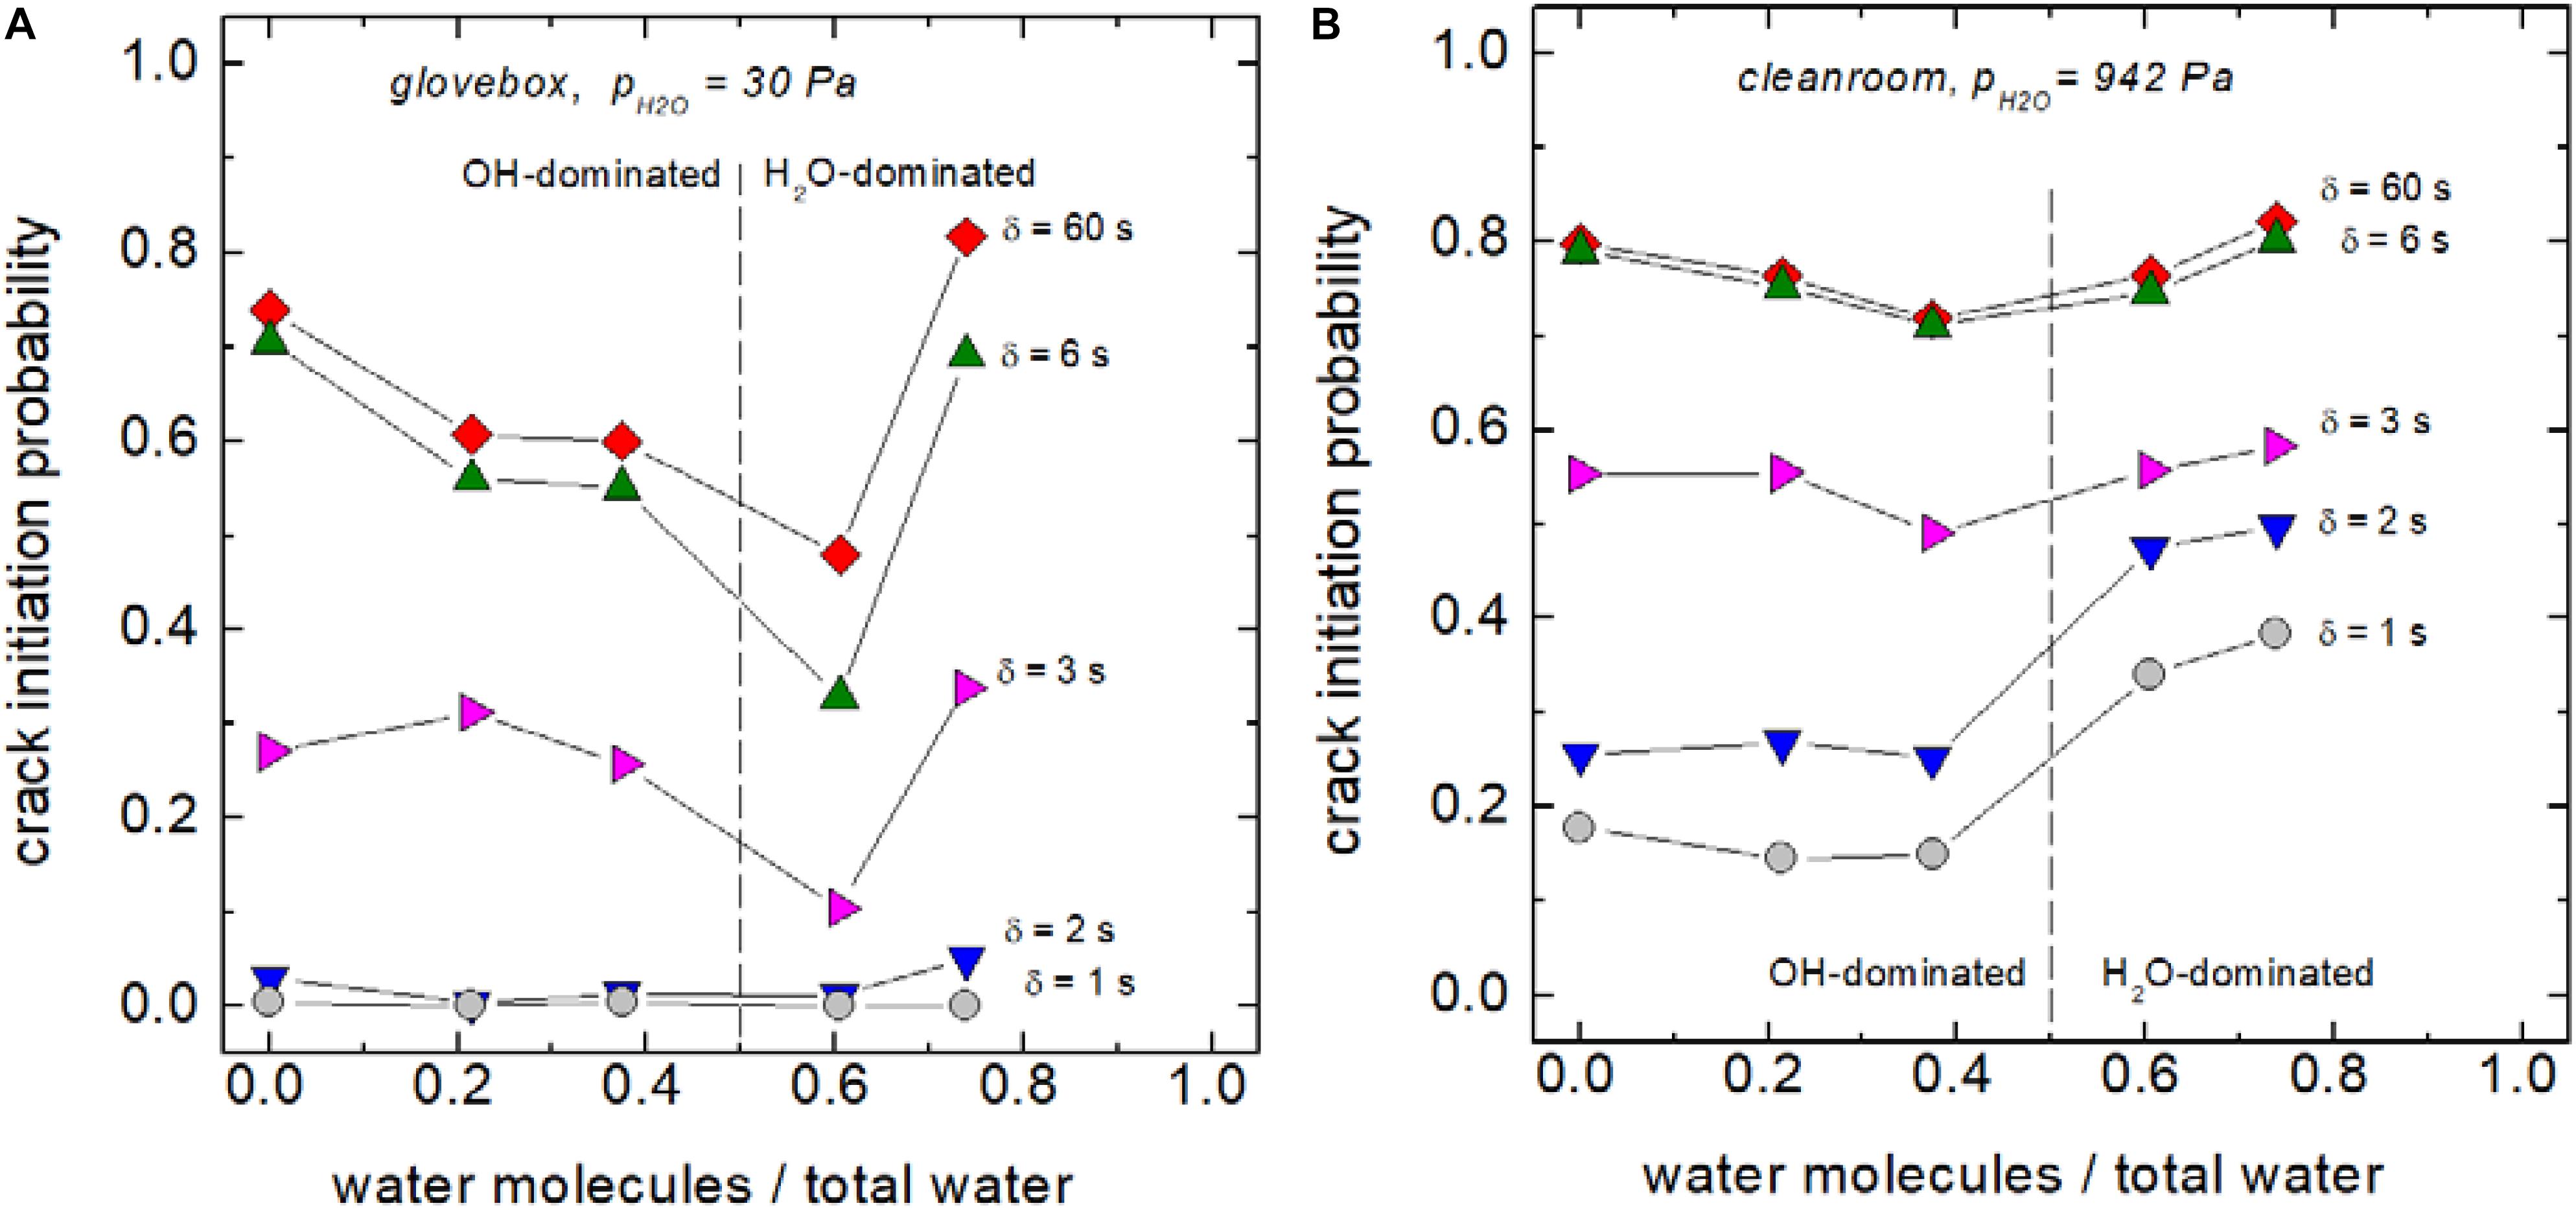
Figure 6. Temporal evolution of the crack initiation probability as a function of the water speciation in low (A) and high (B) humidity.
The stress intensity KI at the tip of median radial cracks, which are induced by Vickers indentation, can be approximated as (Lawn and Fuller, 1975; Marshall and Lawn, 1977; Lawn and Marshall, 1979; Ponton and Rawlings, 1989; Li et al., 1989; Ghosh et al., 1991):
with χ = residual stress factor, P = load and, m = crack length exponent. A recent attempt to calibrate KI of 185 single cracks revealed that χ and m are broadly distributed. Mean values and standard deviations of the m and χ distributions were 1.47 ± 0.44 and 0.052 ± 31.3, respectively (Kiefer et al., 2020). The value of the mean exponent (1.47 ≈ 3/2) confirmed theoretical considerations for a point loading indenter (Lawn and Fuller, 1975; Marshall and Lawn, 1977; Lawn and Marshall, 1979). In contrast, the value of the residual stress factor χ is specific and accounts for the elastic-plastic properties of the glass, the angular position along the crack front and the environmental condition of the fatigue experiment. As humidity levels and glass compositions of this study differ from that of Kiefer et al. (2020), χ = 0.052 is not applicable here and χ remains a tuneable parameter. If one assumes that the residual stress factor χ scales with the square root of the Young’s modulus-to-hardness ratio (E/HV)1/2 (Anstis et al., 1981; Miyoshi, 1985) and setting χB = χ(E/HV)–1/2, Equation (5) can be rewritten as:
The calibration factor χB accounts now mainly for the environmental reactions at the crack-tip. Thus, an interrelation between stress intensity KI/χB and the mean crack propagation rate vav can be established by plotting vav calculated with Equation (4) vs. the right-hand side of Equation (6). For the determination of KI/χB, Young’s modulus E of each hydrous glasses was taken from a previous study (Kiefer et al., 2019) and hardness was calculated using the mean value of the half diagonal length a of the Vickers indent as recorded for t < δ. For instance, see data points at t-δ≈ 0 of Figure 2A for a, while Vickers hardness is HV = P/(2.157 × 10–3 a2) in units of HV (GPa), P (N), and a (μm). Figure 7 shows that in this Wiederhorn diagram (Wiederhorn, 1967, 1974), humidity clearly shifts the lines toward lower stress intensity values and within the two series, KI/χB decreases with increasing water content of the glasses. Figure 7 also displays that the slope n [n = lg(vav)/lg(KI/χB)] of the lines is affected by the testing conditions. For the series tested under high pH2O (942 Pa), it is found that n = 20–27, whereas for the glasses tested in low humidity, n increased from 23 to 88 with decreasing water content (Table 3). Noticeably, the hydrous glass 4W-MSG500 shows two segments. A first segment at the early stage of the crack propagation (vav > 2 × 10⁻⁷ m s–1) of n = 68 and a second segment at the later stage of n = 16. Values of n in the range between 16 and 27 were reported for crack growth, which is controlled by the reaction of water molecules of the environment with the glass at the crack-tip (so called stage I reactions) (Wiederhorn, 1967, 1974; Gehrke et al., 1987). In contrast, higher values are typical for water-independent crack propagation (stage III reactions) (Wiederhorn, 1967, 1974; Wiederhorn and Johnson, 1974; Gehrke et al., 1987). Based on this classification, one can assign 0W-MSG500, 1W-MSG500, and 2W-MSG500 to stage III reactions at low pH2O of the glove box (30 Pa), while the more hydrous glasses 4W-MSG500 (at least at low propagation rates) and 6W-MSG500 show already stage I reactions. This implies that for hydrous glasses of high water contents, dissolved water promotes crack growth in a similar way as water molecules originating from the gas phase. One explanation for this would be that water readily escapes from the freshly fractured surface of hydrous glasses increasing the pH2O of the vapor at the crack tip similar to the stress-induced emission of sodium during the fracture of anhydrous soda-lime silicate glass (Lanford et al., 1979). This effect was related to the local stress increase during crack propagation and can result in an increased sodium concentration at the fractured surface, thus triggering local glass corrosion (Célarié et al., 2007). Another explanation would favor friction of an adhesive water film that is formed by allocated water at the surfaces near to the crack-tip (Wondraczek et al., 2006), which would drop the precondition of water evaporation from the hydrous glass surface into the vapor phase. However, more research is needed to provide new evidence in support of these explanatory attempts.
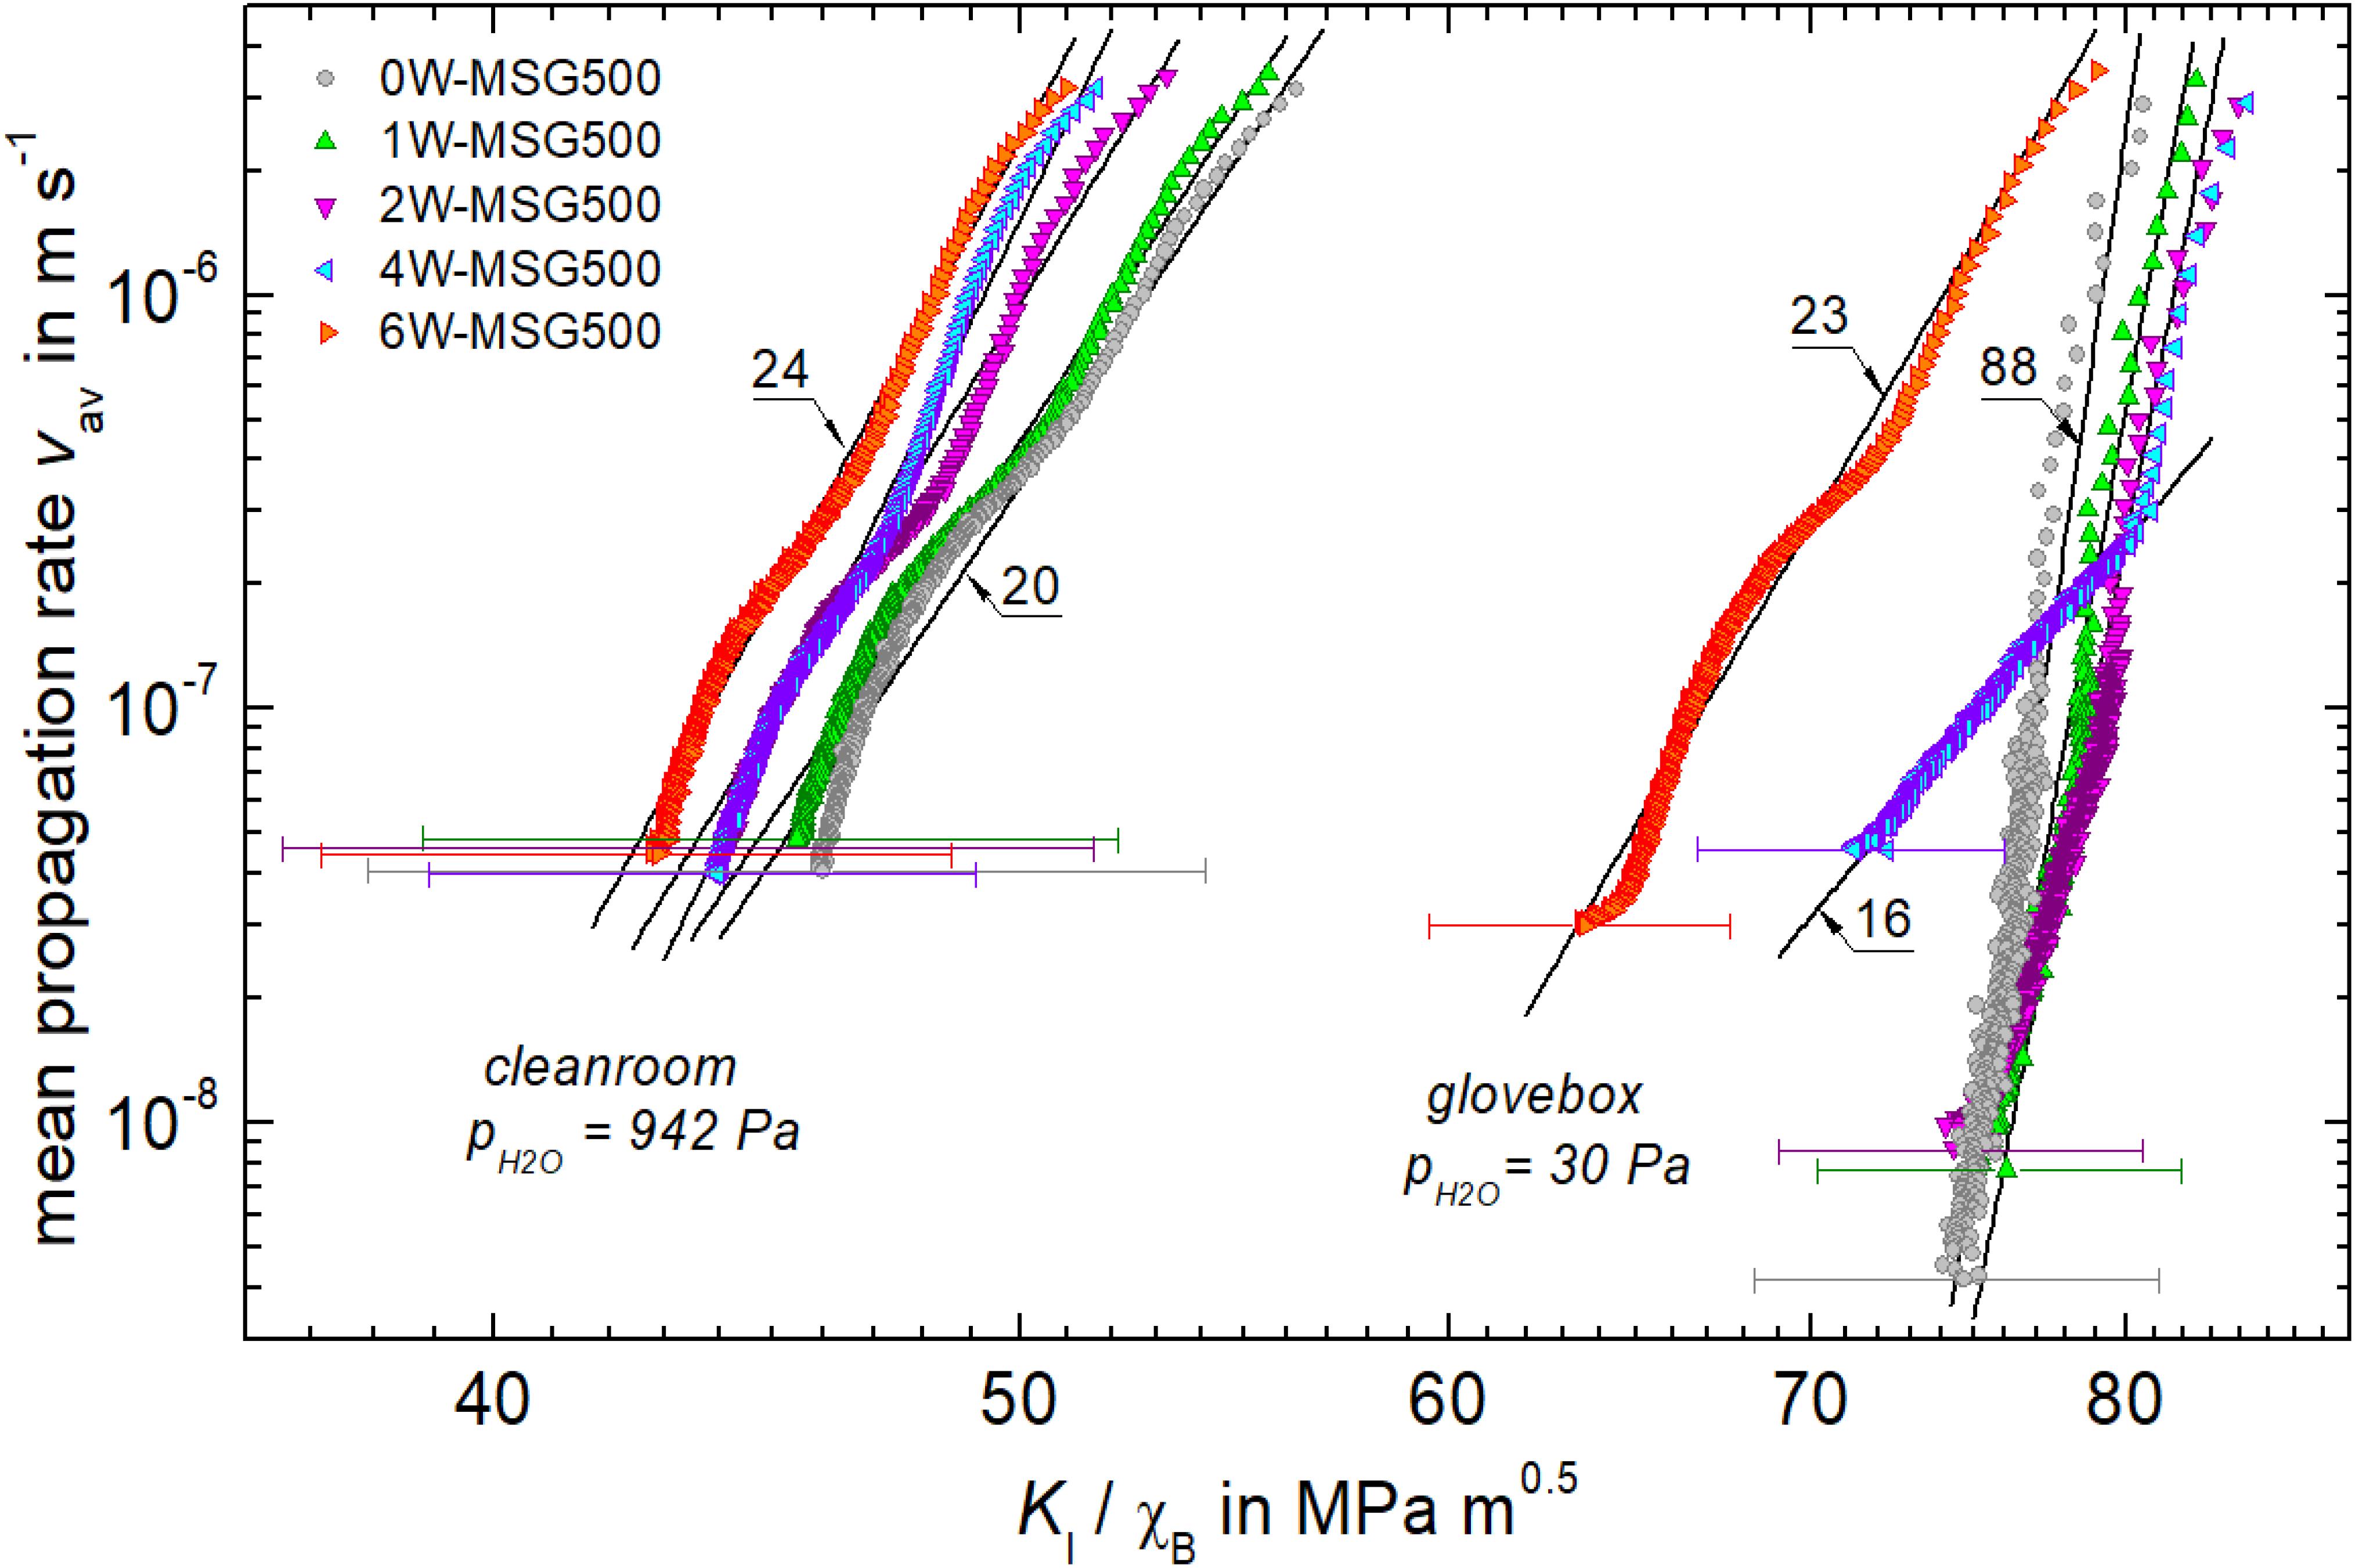
Figure 7. Mean crack propagation rate vav vs. uncalibrated stress intensity KI/χB. Lines of slope n (as indicated) are best linear fits through data. Error bars show standard deviation of the crack length distributions of Table 2.
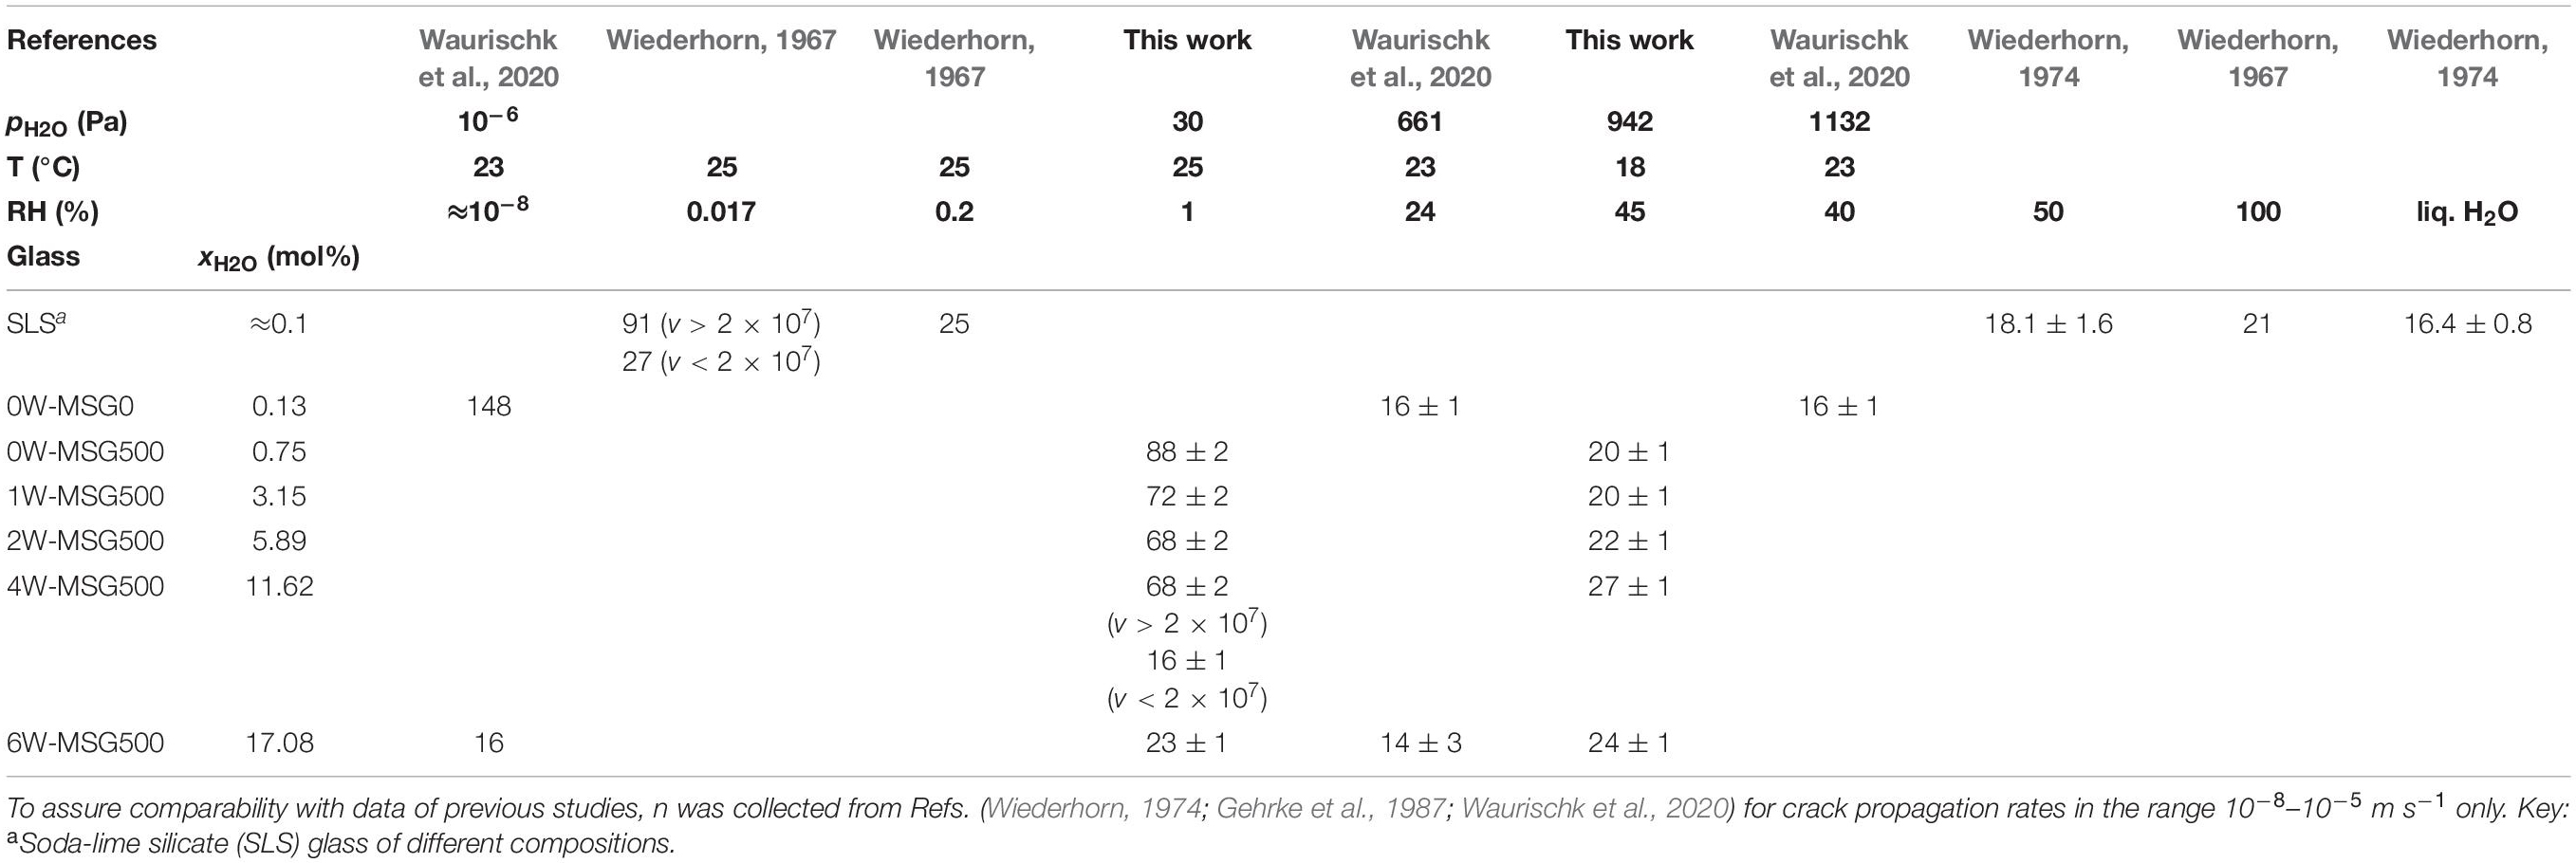
Table 3. Crack growth exponent n of the equation vav = A(KI/χB)n and v = AKIn of Vickers induced and DCB cracks in soda-lime silicate glasses, respectively.
Figure 7 shows that the calibration factor χB is close to 0.01 as the critical stress intensity KIC is about unity for dry and hydrous soda-lime silicate glasses (Wiederhorn, 1974; Gehrke et al., 1987; Waurischk et al., 2020). However, the true value of χB of the individual glasses is still unknown and for its determination a calibration procedure has to be applied (Quinn and Bradt, 2007; Marshall et al., 2015; Kiefer et al., 2020). Figure 8 shows such an attempt for 6W-MSG500, as for this glass stable crack growth in air and vacuum was studied earlier using double cantilever beam geometry (DCB) (Waurischk et al., 2020). Due to the large scatter in the DCB data, however, reconciliation of both data sets while respecting the order of decreasing KI with increasing humidity is difficult and it does not result in more precise identification of χB.
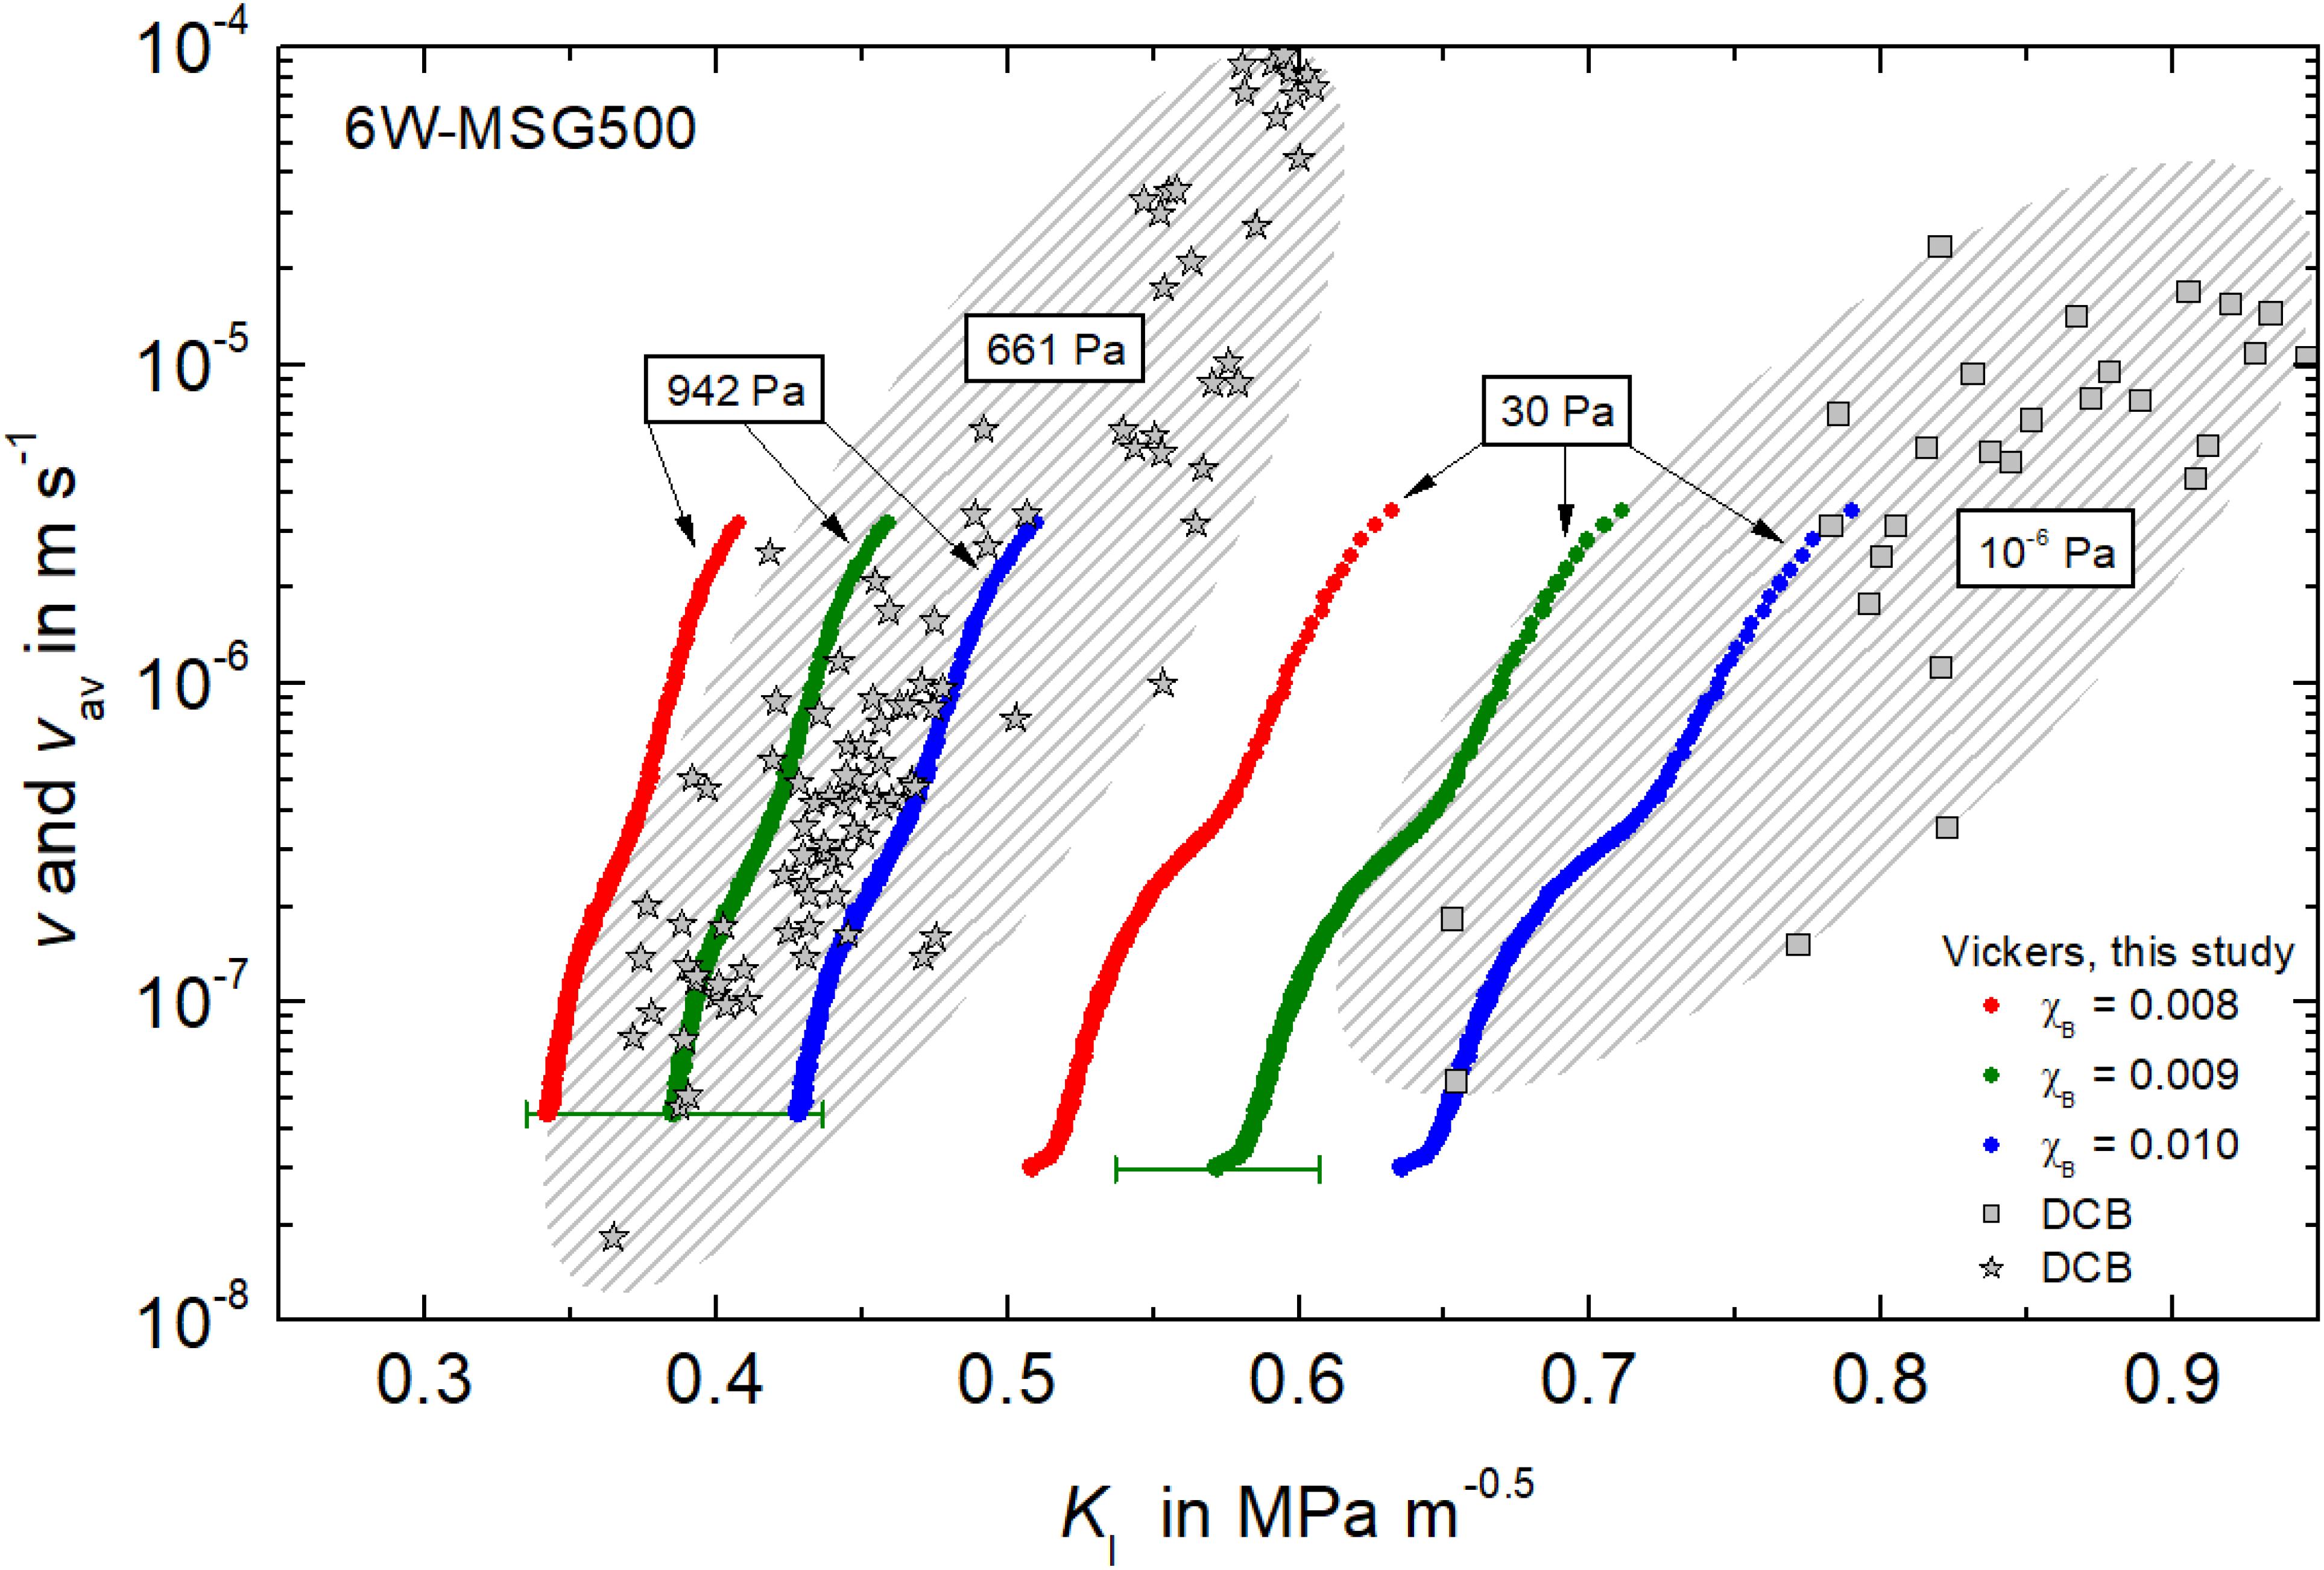
Figure 8. Mean crack propagation rate vav (N = 259 and 370) and crack propagation rates v of single cracks (stress calibrated DCB specimens) of the hydrous glass 6W-MSG500. Stress intensities KI of the Vickers induced vav data of this study are shown for χB = 0.008 (red dots), 0.009 (green dots) and 0.010 (blue dots). Partial pressure of H2O as indicated. DCB data from Waurischk et al. (2020). Error bars show standard deviation of the crack length distributions of Table 2.
Conclusion
Automated recording and analysis of a large number of Vickers induced cracks is a promising route to determine the crack growth exponent with higher accuracy. Water is found to promote slow (<3 × 10⁻⁶ m s–1) crack growth independently of its origin. However, water molecules of the environment are more efficient in reducing stress intensity than dissolved water species of the glass structure. When tested in low partial pressure of H2O, hydrous glasses show a noticeable decrease in the crack growth exponent, which is assumed to be caused by an energy dissipation step.
Data Availability Statement
The datasets generated for this study are available on request to the corresponding author.
Author Contributions
PK, MM, RB, and JD produced the manuscript. JD, HB, TW, SR, and RM contributed to the critical revision and direction of the manuscript. All authors contributed to the article and approved the submitted version.
Funding
We gratefully acknowledge financial support by the Deutsche Forschungsgemeinschaft (DFG) by the priority program SPP 1594.
Conflict of Interest
The authors declare that the research was conducted in the absence of any commercial or financial relationships that could be construed as a potential conflict of interest.
Footnotes
References
Anstis, G. R., Chantikul, P., Lawn, B. R., and Marshall, D. B. (1981). A critical evaluation of indentation techniques for measuring fracture toughness: I direct crack measurements. J. Am. Ceram. Soc. 64, 533–538. doi: 10.1111/j.1151-2916.1981.tb10320.x
Balzer, R., Behrens, H., Reinsch, S., and Fechtelkord, M. (2019a). Structural investigation of hydrous phosphate glasses. Phys. Chem. Glass. Eur. J. Glass Sci. Technol. B 60, 49–61. doi: 10.13036/17533562.60.2.041
Balzer, R., Behrens, H., Schuth, S., Waurischk, T., Reinsch, S., Müller, R., et al. (2019b). The influence of H2O and SiO2 on the structure of silicoborate glasses. J. Non Cryst. Solids 519:119454. doi: 10.1016/j.jnoncrysol.2019.05.030
Balzer, R., Behrens, H., Waurischk, T., Reinsch, S., Müller, R., Kiefer, P., et al. (2020). Water in alkali aluminosilicate glasses. Front. Mater. 7:85. doi: 10.3389/fmats.2020.00085
Bauer, U., Behrens, H., Fechtelkord, M., Reinsch, S., and Deubener, J. (2015). Water- and boron speciation in hydrous soda-lime-borate glasses. J. Non Cryst. Solids 423–424, 58–67. doi: 10.1016/j.jnoncrysol.2015.05.004
Bauer, U., Behrens, H., Reinsch, S., Morin, E. I., and Stebbins, J. F. (2017). Structural investigation of hydrous sodium borosilicate glasses. J. Non Cryst. Solids 465, 39–48. doi: 10.1016/j.jnoncrysol.2017.03.023
Bechgaard, T. K., Mauro, J. C., and Smedskjaer, M. M. (2018). Time and humidity dependence of indentation cracking in aluminosilicate glasses. J. Non Cryst. Solids 491, 64–70. doi: 10.1016/j.jnoncrysol.2018.04.009
Behrens, H., Bauer, U., Reinsch, S., Kiefer, P., Müller, R., and Deubener, J. (2018). Structural relaxation mechanisms in hydrous sodium borosilicate glasses. J. Non Cryst. Solids 497, 30–39. doi: 10.1016/j.jnoncrysol.2018.05.025
Benard, A., and Bosi-Levenbach, E. C. (1953). The plotting of observations on probability paper. Stat. Neerl. 7, 163–173.
Benbahouche, S., Brient, A., Rouxel, T., and Sangleboeuf, J.-C. (2012). Effect of water corrosion on cracks and Vickers imprints in glass. Int. J. Fracture 175, 199–206. doi: 10.1007/s10704-012-9712-4
Berndt, J., Liebske, C., Holtz, F., Freise, M., Nowak, N., Ziegenbein, D., et al. (2002). A combined rapid-quench and H2-membrane setup for internally heated pressure vessels: description and application for water solubility in basaltic melts. Am. Mineral. 87, 1717–1726. doi: 10.2138/am-2002-11-1222
Célarié, F., Ciccotti, M., and Marlière, C. (2007). Stress-enhanced ion diffusion at the vicinity of a crack tip as evidenced by atomic force microscopy in silicate glasses. J. Non Cryst. Solids 353, 51–68. doi: 10.1016/j.jnoncrysol.2006.09.034
Dériano, S., Jarry, A., Rouxel, T., Sangleboeuf, J. C., and Hampshire, S. (2004). The indentation fracture toughness (KC) and its parameters: the case of silica-rich glasses. J. Non Cryst. Solids 344, 44–50. doi: 10.1016/j.jnoncrysol.2004.07.021
Gehrke, E., Ullner, C., and Hähnert, M. (1987). Correlation between multistage crack-growth and time-dependent strength in commercial silicate-glasses: 1. influence of ambient media and types of initial cracks. Glastechn. Ber. Glass Sci. Technol. 60, 268–278.
Ghosh, A., Kobayashi, A. S., Li, Z., Henager, C. H., and Bradt, R. C. (1991). Vickers Microindentation Toughness of a Sintered SiC in the Median-Crack Regime, No. PNL-SA-16927. Richland, WA: Pacific Northwest Lab.
Kiefer, P., Balzer, R., Deubener, J., Behrens, H., Waurischk, T., Reinsch, S., et al. (2019). Density, elastic constants and indentation hardness of hydrous soda-lime-silica glasses. J. Non Cryst. Solids 521:119480. doi: 10.1016/j.jnoncrysol.2019.119480
Kiefer, P., Deubener, J., Müller, R., and Behrens, H. (2020). Statistical analysis of propagation rates of indentation-induced radial cracks in soda-lime-silica glass. J. Non Cryst. Solids 527:119739. doi: 10.1016/j.jnoncrysol.2019.119739
Lanford, W. A., Davis, K., Lamarche, P., Laursen, T., Groleau, R., and Doremus, R. H. (1979). Hydration of soda-lime glass. J. Non Cryst. Solids 33, 249–266.
Lawn, B. R., and Fuller, E. R. (1975). Equilibrium penny-like cracks in indentation fracture. J. Mater. Sci. 10, 2016–2024. doi: 10.1007/bf00557479
Lawn, B. R., and Marshall, D. B. (1979). Hardness, toughness, and brittleness: an indentation analysis. J. Am. Ceram. Soc. 62, 347–350. doi: 10.1111/j.1151-2916.1979.tb19075.x
Li, Z., Ghosh, A., Kobayashi, A. S., and Bradt, R. C. (1989). Indentation fracture toughness of sintered silicon carbide in the Palmqvist crack regime. J. Am. Ceram. Soc. 72, 904–911. doi: 10.1111/j.1151-2916.1989.tb06242.x
Marshall, D. B., Cook, R. F., Padture, N. P., Oyen, M. L., Pajares, A., Bradby, J. E., et al. (2015). The compelling case for indentation as a functional exploratory and characterization tool. J. Am. Ceram. Soc. 98, 2671–2680. doi: 10.1111/jace.13729
Marshall, D. B., and Lawn, B. R. (1977). An indentation technique for measuring stresses in tempered glass surfaces. J. Am. Ceram. Soc. 60, 86–87. doi: 10.1111/j.1151-2916.1977.tb16106.x
Miyoshi, T. (1985). Study on evaluation of KIC for structural ceramics. Trans. Jpn. Soc. Mech. Eng. Ser. A 51, 2489–2497.
Pönitzsch, A., Nofz, M., Wondraczek, L., and Deubener, J. (2016). Bulk elastic properties, hardness and fatigue of calcium aluminosilicate glasses in the intermediate-silica range. J. Non Cryst. Solids 434, 1–12. doi: 10.1016/j.jnoncrysol.2015.12.002
Ponton, C. B., and Rawlings, R. D. (1989). Vickers indentation fracture toughness test, part 1: review of literature and formulation of standardised indentation toughness equations. Mater. Sci. Technol. 5, 865–872. doi: 10.1179/mst.1989.5.9.865
Quinn, G. D., and Bradt, R. C. (2007). On the Vickers indentation fracture toughness test. J. Am. Ceram. Soc. 90, 673–680. doi: 10.1111/j.1551-2916.2006.01482.x
Reinsch, S., Müller, R., Deubener, J., and Behrens, H. (2013). Internal friction of hydrated soda-lime-silicate glasses. J. Chem. Phys. 139:174506. doi: 10.1063/1.4828740
Striepe, S., and Deubener, J. (2013). Effect of lithium-to-magnesium ratio in metaphosphate glasses on crack-tip condensation and sub-critical crack growth. J. Non Cryst. Solids 375, 47–54. doi: 10.1016/j.jnoncrysol.2013.04.063
Striepe, S., Deubener, J., Smedskjaer, M. M., and Potuzak, M. (2013). Environmental effects on fatigue of alkaline earth aluminosilicate glass with varying fictive temperature. J. Non Cryst. Solids Solids 379, 161–168. doi: 10.1016/j.jnoncrysol.2013.08.005
Wada, M., Furukawa, H., and Fujita, K. (1974). “Crack resistance of glasses on knoop scratch test,” in Proceedings of the X Int. Congr. Glass, vol. 11, Ceram. Soc, eds M. Kunugi, M. Tashiro, and N. Soga (Kyoto), 39–46.
Waurischk, T., Müller, R., Reinsch, S., Kiefer, P., Deubener, J., Balzer, R., et al. (2020). Crack growth in hydrous soda-lime silicate glass. Front. Mater. 7:66. doi: 10.3389/fmats.2020.00066
Wiederhorn, S. M. (1967). Influence of water vapor on crack propagation in soda-lime glass. J. Am. Ceram. Soc. 50, 407–414. doi: 10.1111/j.1151-2916.1967.tb15145.x
Wiederhorn, S. M. (1974). “Subcritical crack growth in ceramics,” in Fracture Mechanics of Ceramics, Vol. 2, ed. R. C. Bradt (New York: Plenum Press), 613–646. doi: 10.1007/978-1-4615-7014-1_12
Wiederhorn, S. M., and Johnson, H. (1974). Fracture of glass in vacuum. J. Am. Ceram. Soc. 57, 336–341.
Keywords: slow crack growth, automated analysis, hydrous glass, Vickers indentation, indentation fracture toughness
Citation: Kiefer P, Maiwald M, Deubener J, Balzer R, Behrens H, Waurischk T, Reinsch S and Müller R (2020) Automated Analysis of Slow Crack Growth in Hydrous Soda-Lime Silicate Glasses. Front. Mater. 7:268. doi: 10.3389/fmats.2020.00268
Received: 24 February 2020; Accepted: 20 July 2020;
Published: 14 August 2020.
Edited by:
Ashutosh Goel, Rutgers, The State University of New Jersey, United StatesReviewed by:
John Matthewson, Rutgers, The State University of New Jersey, United StatesTimothy Michael Gross, Corning Inc., United States
Copyright © 2020 Kiefer, Maiwald, Deubener, Balzer, Behrens, Waurischk, Reinsch and Müller. This is an open-access article distributed under the terms of the Creative Commons Attribution License (CC BY). The use, distribution or reproduction in other forums is permitted, provided the original author(s) and the copyright owner(s) are credited and that the original publication in this journal is cited, in accordance with accepted academic practice. No use, distribution or reproduction is permitted which does not comply with these terms.
*Correspondence: Joachim Deubener, am9hY2hpbS5kZXViZW5lckB0dS1jbGF1c3RoYWwuZGU=