 Zhong Li1Jike Yang1,2Huihua Guo2Sith Kumseranee3Suchada Punpruk3Magdy E. Mohamed4
 Mazen A. Saleh4
 Tingyue Gu1*
- 1Department of Chemical and Biomolecular Engineering, Institute for Corrosion and Multiphase Technology, Ohio University, Athens, OH, United States
- 2Corrosion and Protection Center, University of Science and Technology Beijing, Beijing, China
- 3PTT Exploration and Production, Bangkok, Thailand
- 4Research and Development Center, Saudi Arabian Oil Company, Dhahran, Saudi Arabia
It is known that starved sulfate-reducing bacterial biofilms corrode carbon steel more aggressively because they use electrons from elemental iron oxidation as an alternative source of energy. This work used carbon source starvation to vary MIC (microbiologically influenced corrosion) severity for studying subsequent MIC impacts on the degradation of X80 carbon steel mechanical properties. X80 square coupons and dogbone coupons were immersed in ATCC 1249 culture medium (200 ml in 450-ml anaerobic bottles) inoculated with Desulfovibrio vulgaris for 3-day pre-growth and then for an additional 14 days in fresh media with adjusted carbon source levels for starvation testing. After the starvation test, the sessile cell counts (cells/cm2) on the dogbone coupons in the bottles with carbon source levels of 0, 10, 50, and 100% (vs that in the full-strength medium) were 8.1 × 10⁶, 3.2 × 10⁷, 8.3 × 10⁷, and 1.3 × 10⁸, respectively. The pit depths from the X80 dogbone coupons were 1.9 μm (0%), 4.9 μm (10%), 9.1 μm (50%), and 6.4 μm (100%). The corresponding weight losses (mg/cm2) from the square coupons were 1.9 (0%), 3.3 (10%), 4.4 (50%), and 3.7 (100%). The 50% carbon source level had the combination of carbon starvation without suffering too much sessile cell loss. Thus, both its pit depth and weight loss were the highest. The electrochemical tests corroborated the pit depth and weight loss trends. The tensile tests of the dogbone coupons after the starvation incubation indicated that sulfate-reducing bacteria (SRB) made X80 more brittle and weaker. Compared with the fresh (no-SRB-exposure) X80 dogbone coupon’s ultimate tensile strain of 13.6% and ultimate tensile stress of 860 MPa, the 50% carbon source level led to the lowest ultimate tensile strain of 10.3% (24% loss when compared with the fresh dogbone) and ultimate tensile stress of 672 MPa (22% loss). The 100% carbon source level had a smaller loss in ultimate tensile strain than the 50% carbon source level, followed by 10% and then 0%. Moreover, the 100% carbon source level had a smaller loss in ultimate tensile strength than the 50%, followed by 10% and 0% in a tie. This outcome shows that even in the 17-day short-term test, significant degradation of the mechanical properties occurred and more severe MIC pitting caused more severe degradation.
Introduction
Sulfate-reducing bacteria (SRB) are the most ubiquitous microorganisms in anaerobic environments, and they are the most important microbes in MIC (microbiologically influenced corrosion) in the oil and gas systems which are mostly anaerobic and often involve seawater containing sulfate (Little and Lee, 2007; Sheng et al., 2007; Xu et al., 2016; Jia et al., 2017; Jogdeo et al., 2017). SRB MIC can induce mechanical degradations of metallic materials (Abedi et al., 2007; AlAbbas et al., 2013; Al-Nabulsi et al., 2015; Wu et al., 2015). A failure of a X52 pipeline in the northern part of Iran was reported in 2004 due to SRB causing deterioration of the mechanical properties of the pipeline steel (Abedi et al., 2007). The deterioration of the mechanical properties is usually exhibited as losses of tensile stress and strain (Służalec, 1992).
The SRB are anaerobic bacteria that use sulfate as the terminal electron acceptor in their respiration (Dannenberg et al., 1992; Heidelberg et al., 2004; Lv and Du, 2018). When lactate is used as the organic carbon source, the following oxidation reaction occurs in the cytoplasm of the SRB under enzyme catalysis (Xu and Gu, 2011; Xu and Gu, 2014; Xu et al., 2016; Li et al., 2018; Dou et al., 2019; Gu et al., 2019):
where the apostrophe in the reduction potential E°' of the two reactions indicates a pH of 7.0. When there is a lack of carbon source in the local environment such as at the bottom of the sulfate-reducing bacterial biofilm, elemental iron can provide the electrons for the SRB survival through extracellular Fe oxidation, as shown in Eq. 2. Fe like lactate can provide energy according to the reduction potential values listed in Eqs 1, 3. Like lactate, Fe oxidation can be coupled with sulfate reduction to provide energy for SRB (Biswas and Bose, 2005; Li et al., 2018). This means that carbon source starvation of a pre-existing sulfate-reducing bacterial biofilm accelerates SRB MIC of Fe (Xu and Gu, 2014; Dou et al., 2019):
Because elemental iron releases electrons extracellularly and the electrons are used in sulfate reduction inside the cytoplasm of the SRB, extracellular electron transfer (EET) is required. Thus, this kind of MIC is labeled as EET-MIC, which is the result of the demand of electroactive sessile cells for energy. The starved cells are more eager to harvest the extracellular electrons for energy production in order to survive, which can lead to more severe corrosion (Gu and Xu, 2013; Flemming et al., 2016; Liu et al., 2018).
In this work, carbon source starvation was used as a means to vary MIC severity in the study of the MIC impact on the degradation of X80 mechanical properties. Starvation also induced changes in dissolved H2S and headspace H2 levels, which were used to study their impact on the degradation as well.
Small X80 square coupons in anaerobic bottles were used for weight loss analysis after the starvation testing. They were also used as working electrodes in electrochemical glass cells for electrochemical tests. The X80 dogbone coupons were used for gas measurements, sessile cell counting, pitting analysis, and tensile testing.
Experimental
Materials
The composition of X80 carbon steel is listed in Table 1. Twenty X80 square coupons (with a 1-cm2 exposed surface on the top) were used as weight loss samples (12 required) and working electrodes (eight required) in the electrochemical tests. X80 steel was also machined to create dogbone coupons for sulfate-reducing bacterial immersion and subsequent tensile testing. The dimensions of the dogbone coupons were based on the ASTM E8/E8M standard (ASTM-E8/E8M-13a, 2013) (Figure 1). Each dogbone coupon was painted with Teflon, except for a middle 2.5-cm section (with four sides unpainted), with a total exposed area slightly over 4 cm2. The surfaces of the square coupons for weight losses and electrodes were sequentially polished with 180, 400, and 600 grit abrasive papers. The surfaces of the dogbone coupons were polished to 1,200 grit by the supplier prior to shipping. After painting, all the coupons were cleaned with pure isopropanol and dried under UV light for 20 min. The chemicals used in this work were purchased from Fisher Scientific (Pittsburgh, PA, United States) or Sigma-Aldrich (St Louis, MO, United States).

TABLE 1. Elemental composition of X80 steel (mass %).
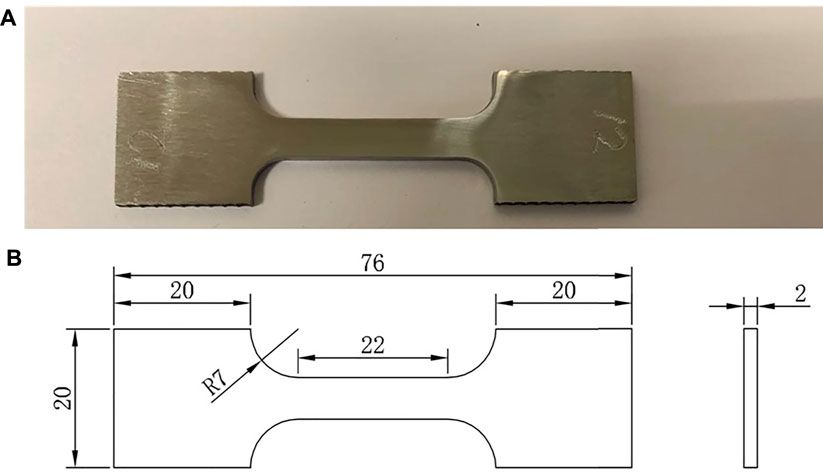
FIGURE 1. (A) Dogbone of X80 carbon steel; (B) dimensions in millimeters.
Culture Media and Inoculum
Desulfovibrio vulgaris (ATCC 7757) was selected in this research as a typical pure-strain SRB. The culture medium was an ATCC 1249 medium (composition in Table 2), which is a modified Baar's medium for sulfate reducers. The initial pH in each anaerobic bottle prior to each inoculation was adjusted to 7 by using HCl or NaOH solution as required before sterilization in an autoclave at 121°C for 40 min. After autoclaving, the SRB culture media were deoxygenated using filter-sterilized N2 sparging for more than 45 min. About 100 ppm L-cysteine was then added to the culture media as an oxygen scavenger to reduce dissolved oxygen further and to mitigate possible oxygen leakage. All incubations were carried out at 37°C anaerobically. About 200 mL of the deoxygenated sterilized culture medium and 2 ml of SRB seed culture were put into each 450-ml anaerobic bottle for 3-day SRB pre-growth in the full-strength ATCC 1249 medium. Each bottle contained three square coupons (at the bottom) or one dogbone coupon (leaning on the wall at a 30° angle with the bottom). The dogbone was not pulled or stressed during incubation. This was compatible with the field situation in which a support beam normally under no load or of a small load is corroded by SRB. When a large load (e.g., a heavy truck on a bridge) finally comes, the beam fails. After the 3-day pre-growth, the square coupons, including the working electrode coupons (already in the epoxy resin), and the dogbone coupons were covered with mature biofilms. They were transferred into other 450-ml anaerobic bottles with fresh culture media containing different levels of the carbon source (0, 10, 50, and 100% vs the carbon source in the standard ATCC 1249 medium) for an additional 14-day carbon starvation incubation. Both lactate and citrate were adjusted to vary the carbon source levels in the ATCC 1249 medium, although only lactate is known to be utilized by D. vulgaris as a carbon source.
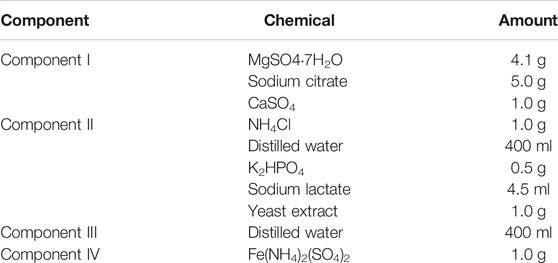
TABLE 2. Chemical composition of ATCC 1249 medium.
Weight Loss
In this study, because the dogbone coupons were too heavy to obtain the milligram weight losses accurately, small X80 coupons with a 1-cm2 exposed top surface were used for the weight loss analysis. After the starvation incubation, the square coupons were cleaned with fresh Clarke's solution to remove biofilms and corrosion products before weighing to obtain the weight loss data. Each weight loss data point was the average of three replicate coupons from the same anaerobic bottle.
Surface and Biofilm Analysis
After 14 days of starvation incubation, the X80 square coupons were retrieved. A scanning electron microscope (SEM) (FEI Quanta 250, Hillsboro, OR, United States) was used to observe the biofilm morphology on the square coupon surfaces. Before biofilm observation, the coupons were first cleaned with pH 7.40 phosphate-buffered saline (PBS) solution for 15 s, and then soaked in 2.5% (w/w) glutaraldehyde solution for 8 h at 10°C to fix the biofilm. Afterward, the coupons were dehydrated with 50% (v/v), 70%, 80%, 90%, and 95% ethanol sequentially for 10 min at each concentration and 100% ethanol for 30 min at the end (Cui et al., 2020). Then, the coupon surfaces were sputter coated with Au to provide surface conductivity. Subsequently, the same coupons were cleaned using Clarke’s solution to remove biofilms and corrosion products before pit image analysis under the SEM and finally used for weight loss measurements.
Electrochemical Measurements
A VersaSTAT 3 potentiostat from Princeton Applied Research (Oak Ridge, TN, United States) was used to measure the electrochemical responses of the X80 working electrodes for varied carbon source levels in D. vulgaris broths. Each glass cell contained 200 ml of culture medium with a varied carbon source (0, 10, 50, and 100%) and 250 ml of headspace. It was inoculated with 2 ml of SRB seed culture before 3-day pre-growth incubation at 37°C. A saturated calomel electrode was used as the reference electrode, and a platinum plate (10 mm × 10 mm × 1 mm) was used as the counter electrode. Open circuit potential (OCP), linear polarization resistance (LPR), and potentiodynamic polarization analyses were performed. The LPR was scanned at a rate of 0.1667 mV/s in the range of −10 mV to +10 mV vs the OCP. Electrochemical impedance spectroscopy (EIS) was performed at the OCP by applying a sinusoidal signal of 10 mV (amplitude) in the frequency ranging from 104 to 10–2 Hz. Potentiodynamic polarization curves were scanned at the end of the 14-day starvation incubation from the OCP to −200 mV vs. the OCP using one working electrode, and from the OCP to +200 mV vs. the OCP using a replicate working electrode in a different glass cell at a rate of 0.1667 mV/s. The corrosion potential (Ecorr), corrosion current density (icorr), and anodic and cathodic Tafel slopes (βa and βc) were determined from the Tafel analysis of the polarization curves.
Gas Measurements, Sessile Cell Counts, Pit Depths, and Tensile Testing
After the starvation test, the concentrations of H2S and H2, as well as the total pressure in the headspace of each anaerobic bottle containing one dogbone coupon were measured using a portable H2S sensor (GAXT-H-DL, BW Technologies, Calgary, Alberta, Canada), a portable H2 sensor (BH-90A, Forensics Detectors, Palos Verdes Peninsula, CA, United States), and a digital manometer (Xplorer GLX-PS-2002, PASCO scientific, Roseville, CA, United States), respectively. The H2S sensor has an upper detection limit of 100 ppm (v/v). If a headspace sample had a high concentration, dilution was required. A 125-ml bottle sealed with 1 atm air was injected with 10 ml of headspace gas for 12.5× dilution. After mixing, a syringe was used to flush and flood the sensor’s sample port with 40 ml of the headspace gas before taking a meter reading.
The pH value of each SRB broth was measured for all dogbone bottles after the starvation incubation. After the starvation incubation, the dogbone coupons were taken out and rinsed three times in PBS of pH 7.40 to remove loosely attached planktonic cells and culture medium. Sessile cells on each dogbone coupon’s exposed section were removed using a small disposable brush into 10 ml of PBS solution in a disposable plastic weighing dish. Then, the brush, the coupon, and 10 ml PBS solution were vortexed together in a 50-ml conical tube for 30 s.
After the sessile cell counting using a hemocytometer had been carried out (Li et al., 2015), each dogbone coupon was cleaned using Clarke’s solution before it was scanned using an Infinite Focus Microscope (IFM) (Model ALC13, Alicona Imaging GmbH, Graz, Austria) to obtain the pit depth profiles.
Finally, all the dogbone coupons after SRB incubation and a fresh X80 dogbone coupon were subjected to tensile testing on an electromechanical universal testing machine (E44.304, MTS system, MN, United States) to obtain stress–strain curves. The strain rate used in the testing was 0.004 s−1.
Results and Discussion
Weight Loss Using Square Coupons
After the 14-day carbon starvation incubation, the coupon weight losses for the carbon source levels of 0, 10, 50, and 100% were obtained. They are shown in Figure 2. The highest weight loss was 4.4 mg/cm2 for 50% carbon source and the lowest was 1.9 mg/cm2 for 0% carbon source. The weight loss for 10% carbon source 3.3 mg/cm2 and weight loss for 100% carbon source 3.7 mg/cm2 were close. It is to be noted that 0% carbon source had the lowest weight loss instead of the highest. This was because the extreme starvation had led to much loss of sessile cells (Xu and Gu, 2014; Dou et al., 2019).
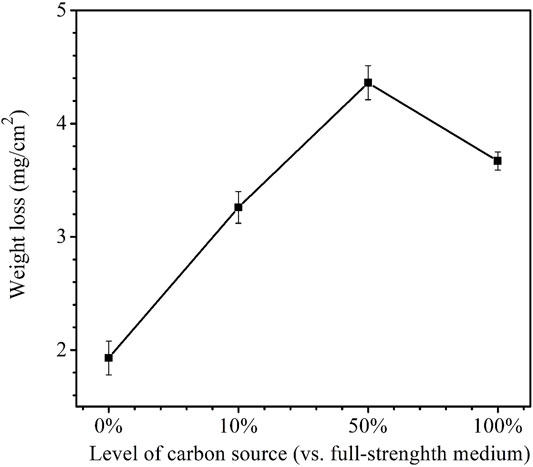
FIGURE 2. Weight losses after 14-day starvation incubation in 450-ml anaerobic bottles with varied carbon source levels. (Each error bar represents a range of readings from three coupons in the same anaerobic bottle.).
Surface and Biofilm Analyses Using Square Coupons
The SEM images in Figure 3 depict the surface morphologies of the D. vulgaris biofilms under different carbon sources after 14-day carbon starvation incubation. The amount of sessile cells on their surfaces were increasing with increasing carbon source levels, from 0% carbon source level to 100% carbon source level as expected. The SEM images in Figure 4 are consistent with the weight loss findings that 50% carbon source level caused the most severe corrosion and 0% the least.
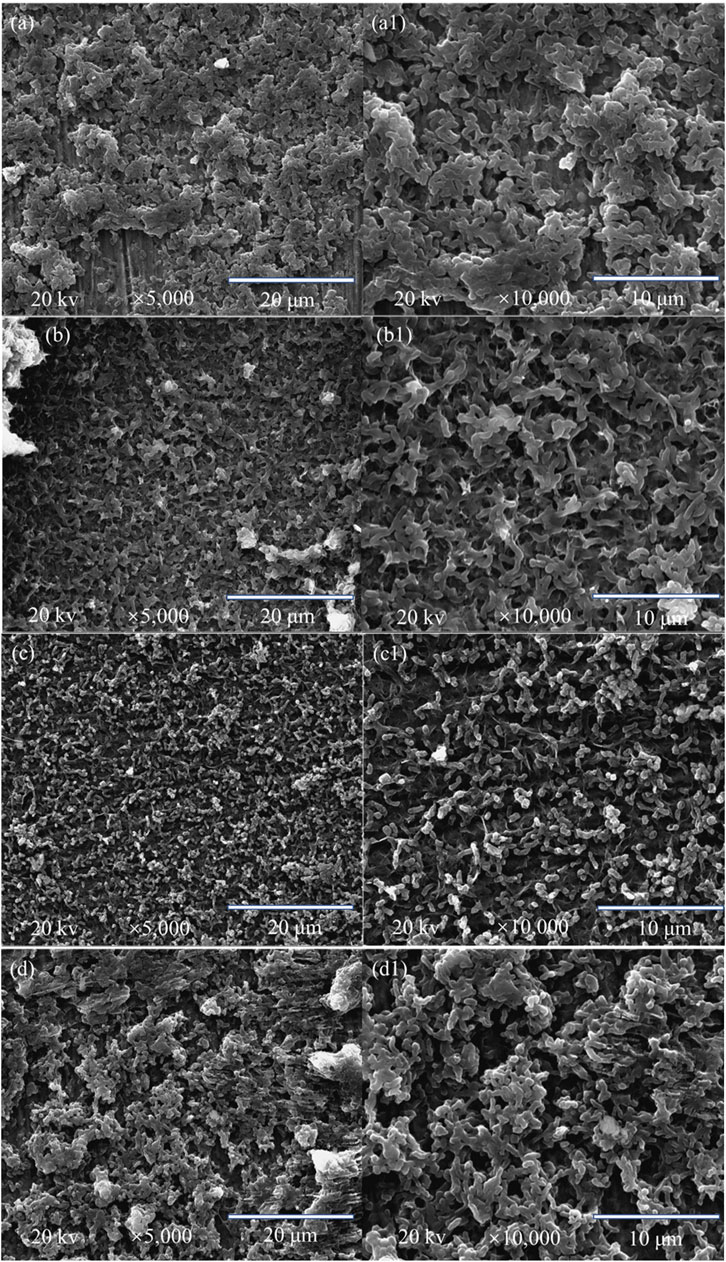
FIGURE 3. SEM images of the square coupon surfaces after 14-day starvation incubation in anaerobic vials with 200 ml of D. vulgaris broth, 250 ml of headspace, and carbon source levels of 0% (a,a1), 10% (b,b1), 50% (c,c1), and 100% (d,d1).
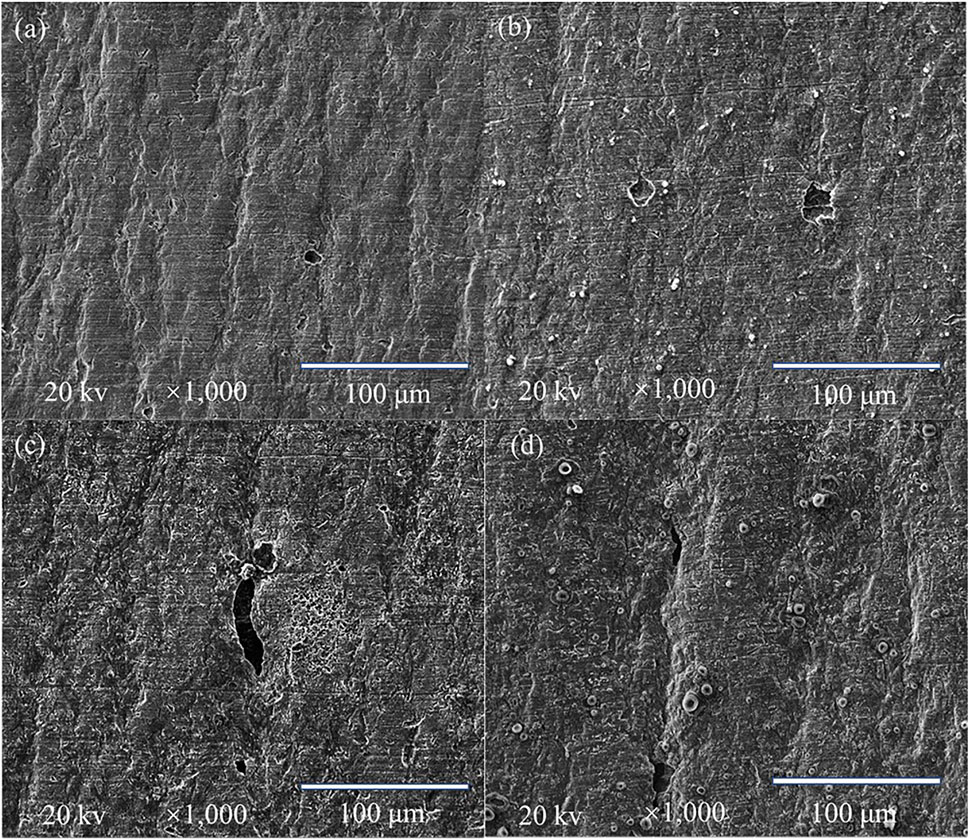
FIGURE 4. SEM images for the X80 square coupons (with corrosion products removed) after 14-day starvation incubation in an anaerobic vial with 200 ml of D. vulgaris broth, 250 ml of headspace, and carbon source levels of 0% (A), 10% (B), 50% (C), and 100% (D).
Electrochemical Tests Using Square Coupons
The variations of the OCP during the 14-day carbon starvation are shown in Figure 5. A lower OCP indicates a higher tendency for the working electrode to lose electrons (i.e., undergoing oxidation) or be corroded. During the starvation period, 50% carbon source had the lowest OCP and 0% the highest, which is consistent with the weight loss trend. In MIC, sometimes, the OCP trends are not always correct because the OCP only indicates to a tendency without factoring in the actual corrosion speed. The kinetic electrochemical data on corrosion resistance or corrosion current are more reliable (Jia et al., 2019). In corrosion kinetics, Rp is inversely proportional to the corrosion rate. Figure 6 shows that the Rp for the 50% carbon source level is the lowest, corresponding to the highest corrosion rate, followed by 100, 10, and 0% carbon source levels. The 1/Rp here is consistent with the weight loss trend.
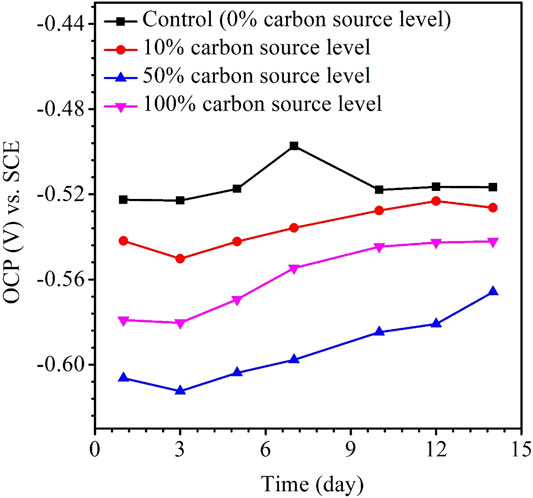
FIGURE 5. Variations of the OCP vs. time for X80 during 14-days starvation incubation.
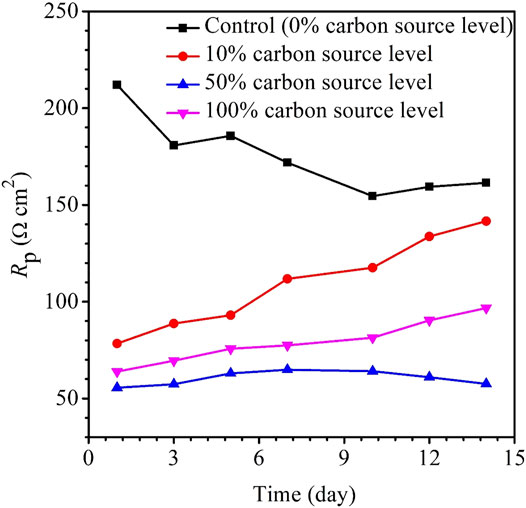
FIGURE 6. Variations of Rp vs time for X80 during 14-days starvation incubation.
The EIS Nyquist and Bode plots of the X80 square coupons for different carbon source levels on different days during the 14-day starvation incubation are shown in Figure 7. The corresponding fitted parameters are listed in Table 3. The Nyquist plots of the square coupons indicate a capacitive behavior and a diffusion phenomenon. The equivalent circuit model is shown in Figure 8, in which Rs is solution resistance, Rf and Qf are the resistance and constant-phase element of the biofilm, respectively. Rct is the charge-transfer resistance, Qdl the constant-phase element of the electric double layer, and W is the Warburg element describing the diffusion process. The presence of W in Figures 7, 8 and Table 3 was caused by the mass transfer resistance effect exerted by the biofilm and corrosion product film on the X80 working electrode (Yin et al., 2018). The impedance spectra for different carbon source levels fitted well with the two-time constant circuit model. The 50% carbon source level had the smallest diameters of the semi-circles in the Nyquist plots (Figure 7) and the smallest value of (Rct + Rb) (Table 3), which means that the 50% carbon source level exhibited the highest corrosion rate (Dou et al., 2019). The EIS results are consistent with the LPR results (Figure 6), supporting the weight loss trend (Figure 2).
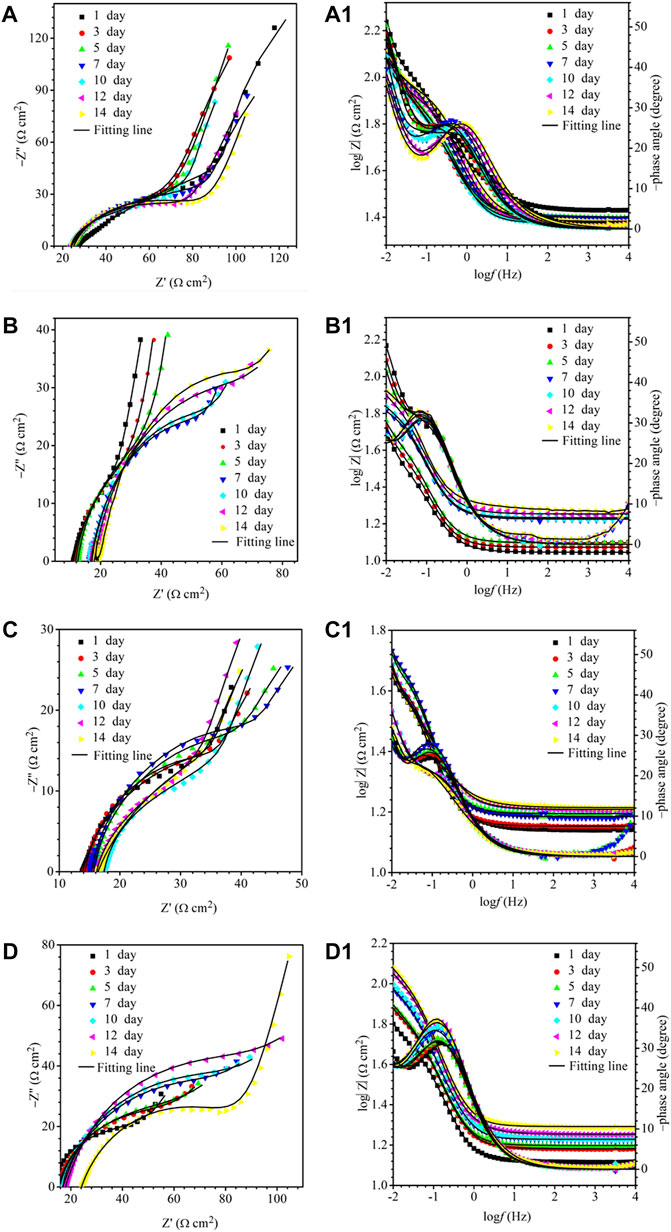
FIGURE 7. Nyquist and Bode plots for X80 during 14-days incubation in an anaerobic vial with 200 ml of D. vulgaris broth, 250 ml of headspace, and carbon source levels of 0% (a,a1), 10% (b,b1), 50% (c,c1), and 100% (d,d1).
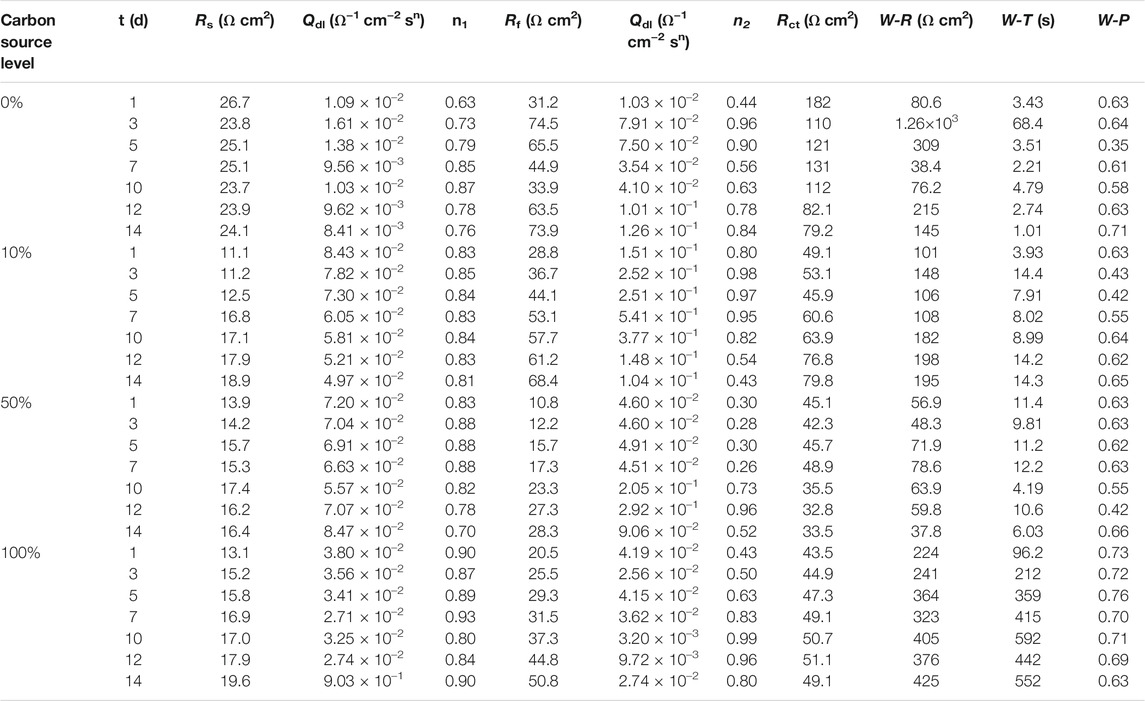
TABLE 3. Electrochemical parameters obtained from fitting EIS spectra in Figure 7.
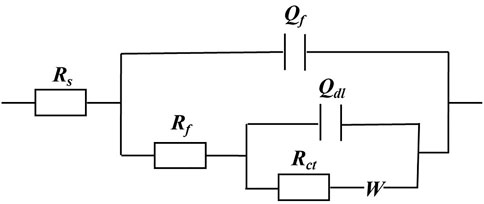
FIGURE 8. Equivalent electrical circuit model for fitting EIS data in Figure 7.
The Tafel plots are shown in Figure 9. Because potentiodynamic polarization scans use a large voltage range, they may alter the surface of the working electrode. Thus, Tafel scans are usually performed only once at the end. In this work, they were performed at the end of the 14-day starvation period after all the other electrochemical measurements. The fitted Tafel parameters are listed in Table 4. The icorr data here are consistent with the weight loss trend showing 50% carbon source having the highest value (145 μA/cm2), followed by 100% carbon source (98 μA/cm2), 10% carbon source (84 μA/cm2), and 0% carbon source (41 μA/cm2). The icorr trend here is consistent with the weight loss trend. This work showed that LPR, EIS, and Tafel scans, all confirmed the weight loss trend, suggesting that the electrochemical methods are valuable in MIC studies. Furthermore, the weight loss only reflects the cumulative corrosion outcome, but nondestructive LPR and EIS can provide transient corrosion behaviors.
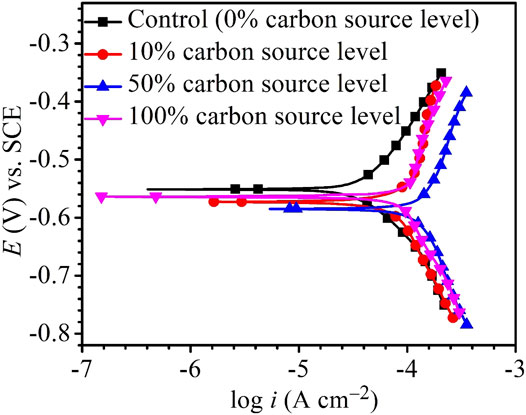
FIGURE 9. Potentiodynamic polarization curves at the end of 14-days starvation incubation.
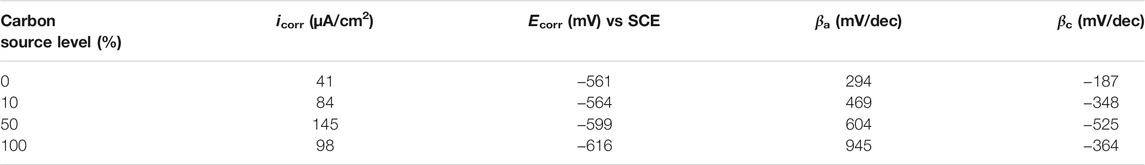
TABLE 4. Fitted electrochemical parameters from Tafel analysis of Figure 9.
Dogbone Bottles: H2 Concentration, H2S Concentration, Total Pressure
Table 5 shows that a higher carbon source level led to a higher concentration of H2. This H2 trend is reasonable because it is known that D. vulgaris produces H2 during lactate oxidation, and later it consumes H2 when there is a shortage of organic carbon (Wang et al., 2020).
HS− can absorb one proton to become H2S or lose one proton to become S2− as shown below (Gu and Xu, 2013):
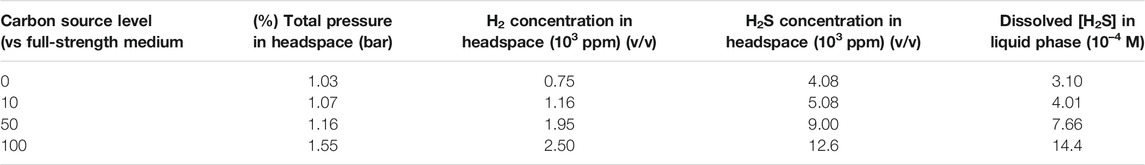
TABLE 5. Headspace gas concentrations and total pressure as well as calculated [H2S] after 14-day carbon starvation incubation in dogbone bottles.
The H2S data in Table 5 indicate that better SRB growth (as a result of a higher carbon source level) produced more H2S from sulfate reduction. The dissolved H2S concentrations in the liquid phases were estimated based on H2S equilibrium at 37°C (Ning et al., 2014). The dissolved [H2S] in the culture medium data was plotted together with broth pH data at the end of the 14-day starvation incubation as shown in Figure 10. Figure 10 clearly indicates that a higher dissolved H2S concentration corresponds to a higher pH. This contradicts the conventional thinking of more H2S in a system for more acidic liquid pH (lower pH). This is because in abiotic H2S corrosion testing, externally introduced H2S acidifies the liquid phase due to H2S dissociation, which releases protons. However, in the SRB broth, H2S is as a reservoir of H+, but its H+ originally comes from the broth itself rather than being externally introduced. Thus, it is not rational to argue for acidification by biogenic H2S in the SRB system. More dissolved H2S in the SRB system results in a higher and not a lower pH.
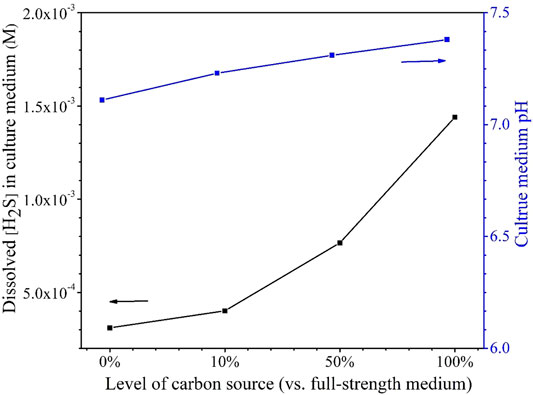
FIGURE 10. Dissolved [H2S] in the culture media and broth pH after 14-days starvation incubation in 450-ml anaerobic bottles.
It is known that sulfate respiration does not normally change scalar and vectorial protons (Peck, 1993). On the contrary, better SRB growth allows more H2S to escape to the headspace, thus taking away more proton from the broth. This is why Figure 10 shows a higher carbon source level leading to a higher broth pH (7.38 for 100% carbon source, 7.31 for 50% carbon source, 7.23 for 10% carbon source, and 7.11 for 0% carbon source). In fact, SRB are used to increase the pH of acid mine drainage for exactly the same reason as demonstrated here (Bai et al., 2013). The above 7.00 pH values in Figure 10 also suggest that acid attack and H2S attack were not important contributors to the MIC in this work (Wang et al., 2020).
Sessile Cell Counts on Dogbone Coupons
After the 14-day starvation incubation, the sessile cell count was found to be higher for a larger carbon source level as was expected (Figure 11). The cell counts on the dogbone coupons in the bottles with the carbon source levels of 0, 10, 50, and 100% were 8.1 × 10⁶, 3.2 × 10⁷, 8.3 × 10⁷, and 1.3 × 10⁸ cells/cm2, respectively. The 0% carbon source bottle had the lowest sessile cell count due to extreme starvation (Dou et al., 2019). The sessile cell counts on the X80 dogbone coupons here are consistent with the SEM biofilm images on the X80 square coupons.
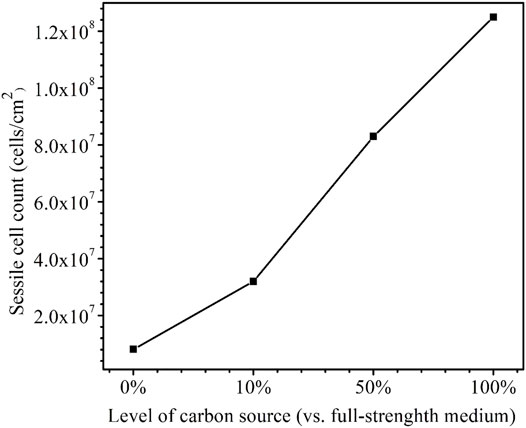
FIGURE 11. Sessile cell counts on dogbone coupons after 14-days starvation incubation in 450-ml anaerobic bottles with varied carbon source levels.
Pit Depths on Dogbone Coupons
Morphologies of MIC pits on the dogbone coupons after the 14-day carbon starvation incubation with biofilms and with corrosion products removed were examined under the IFM before tensile testing (Figure 12). The maximum pit depth was the highest for 50% carbon source (9.1 μm) followed by 100% carbon source (6.4 μm), 10% carbon source (4.9 μm), and 0% carbon source (1.9 μm). The pit depth trend here is consistent with the weight loss trend.
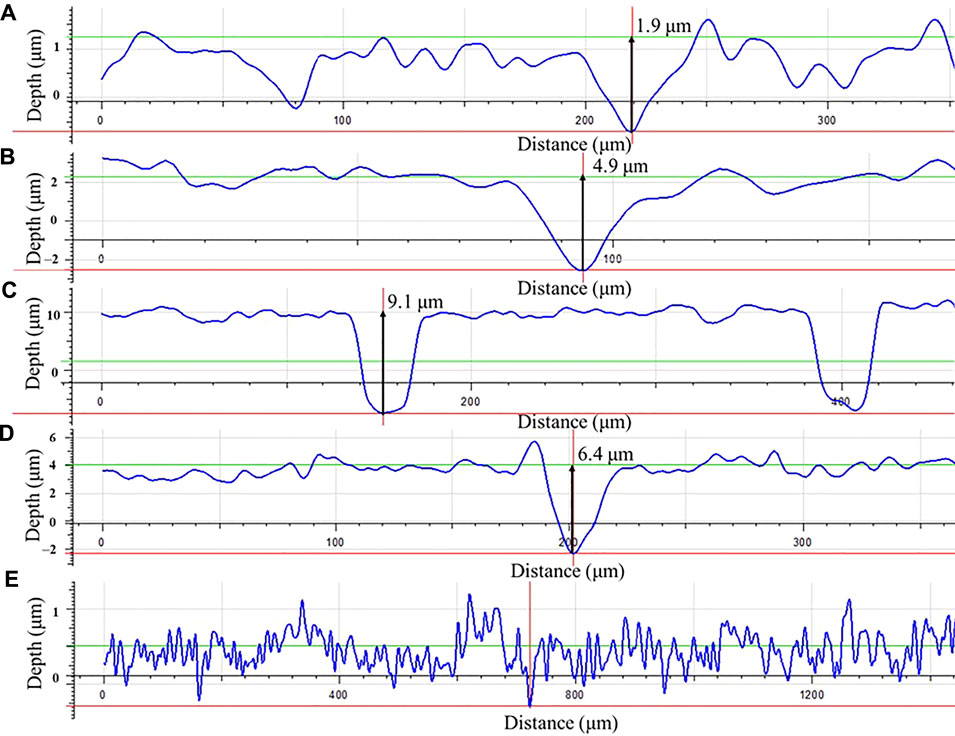
FIGURE 12. Pit depth profiles for dogbone coupons after 14-days starvation incubation with the carbon source level of: (A) 0%, (B) 10%, (C) 50%, (D) 100%, and with (E) fresh dogbone (control).
Tensile Testing Using Dogbone Coupons
Figure 13 shows the stress–strain curves of the dogbone coupons after the 14-day starvation incubation. Compared with the fresh X80 dogbone’s ultimate strength of 879 MPa, all the biotic dogbone coupons had a lower ultimate tensile strength and ultimate tensile strain. Table 6 shows a summary. It indicates that the trend of the degradation of the ultimate tensile strain followed the trend of MIC severity (in terms of weight loss and pit depth) and followed the following sequence (more to less): 50, 100, 10, and 0% carbon source levels. The degradation of the ultimate strength followed the same general trend (but with 10 and 0% having practically the same value). A lower ultimate tensile strain means a more brittle metal. Thus, the tensile strain data indicated that SRB MIC made X80 more brittle in addition to weakening its mechanical strength.
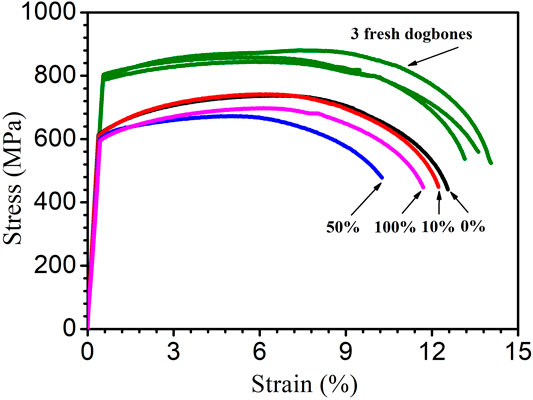
FIGURE 13. Stress–strain curves for three fresh X80 dogbone coupons (three replicates) and dogbone coupons (with corrosion products removed) after 14-day starvation incubation in 450-ml anaerobic bottles with varied carbon source levels.
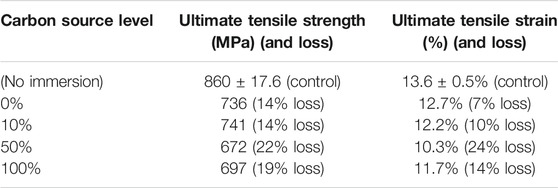
TABLE 6. Ultimate tensile strength and ultimate tensile strain data from Figure 13.
The 50% carbon source led to the highest reductions in both ultimate tensile strength (22% loss) and ultimate tensile strain (24% loss) compared with the fresh dogbone data. In this work, 50% carbon source caused the biggest MIC damages in terms of weight loss and pitting depth. As a result, it led to the most severe degradation of X80 mechanical properties. This trend could not be attributed to H2 or H2S because 50% source did not have the highest H2 or H2S level. In abiotic H2S studies, externally introduced H2S acidifies a liquid, which causes corrosion. But it was not the case in this study with biogenic H2S production, which does not acidify the liquid phase. Thus, it was not surprising that the highest dissolved H2S concentration (100% carbon source) did not result in the highest losses to ultimate strength and ultimate tensile strain.
Conclusions
(1) The weight loss data using square coupons indicated that 50% carbon source levels resulted in the highest weight loss. This was because 50% carbon had the combination of carbon starvation without suffering too much sessile cell loss. The weight loss trend was supported by the pit depth trend.
(2) The electrochemical results, including LPR, EIS, and Tafel scans, all supported the weight loss trend, confirming that the 50% carbon source level caused the most severe MIC.
(3) The SEM biofilm results agreed with the sessile cell count trend.
(4) The H2S, H2, and sessile cell count data for dogbone coupons were consistent in supporting the higher carbon source levels for better growth, exhibiting higher biogenic H2S and H2 concentrations.
(5) The tensile test results for the biotic coupons and the fresh X80 dogbone showed that more severe MIC led to larger degradations of ultimate tensile strain and ultimate tensile strength. The 50% carbon source led to the highest reductions in both ultimate tensile strength (22% loss vs fresh dogbone) and ultimate tensile strain (24% loss).
(6) A higher dissolved H2S concentration at a nonacidic pH in this work did not result in higher losses in ultimate strength and ultimate tensile strain because it did not provide higher weight loss and pit depth.
Data Availability Statement
The datasets generated for this study are available upon request to the corresponding author.
Author Contributions
All authors listed have made a substantial, direct, and intellectual contribution to the work and have approved it for publication.
Funding
This project was funded by the Chinese Society for Corrosion and Protection (CSCP), PTTEP of Thailand and Saudi Aramco.
Conflict of Interest
The authors declare that the research was conducted in the absence of any commercial or financial relationships that could be construed as a potential conflict of interest.
Publisher’s Note
All claims expressed in this article are solely those of the authors and do not necessarily represent those of their affiliated organizations, or those of the publisher, the editors, and the reviewers. Any product that may be evaluated in this article, or claim that may be made by its manufacturer, is not guaranteed or endorsed by the publisher.
Acknowledgments
The tensile testing part received support from Marc Singer, who works in the Institute for Corrosion and Multiphase Technology (ICMT) at Ohio University.
References
Abedi, S. S., Abdolmaleki, A., and Adibi, N. (2007). Failure Analysis of SCC and SRB Induced Cracking of a Transmission Oil Products Pipeline. Eng. Fail. Anal. 14, 250–261. doi:10.1016/j.engfailanal.2005.07.024
Al-Nabulsi, K. M., Al-Abbas, F. M., Rizk, T. Y., and Salameh, A. E. M. (2015). Microbiologically Assisted Stress Corrosion Cracking in the Presence of Nitrate Reducing Bacteria. Eng. Fail. Anal. 58, 165–172. doi:10.1016/j.engfailanal.2015.08.003
AlAbbas, F. M., Williamson, C., Bhola, S. M., Spear, J. R., Olson, D. L., Mishra, B., et al. (2013). Influence of Sulfate Reducing Bacterial Biofilm on Corrosion Behavior of low-alloy, High-Strength Steel (API-5L X80). Int. Biodeterioration Biodegradation 78, 34–42. doi:10.1016/j.ibiod.2012.10.014
ASTM-E8/E8M-13a (2013). Standard Test Methods for Tension Testing of Metallic Materials. West Conshohocken, PA: ASTM International.
Bai, H., Kang, Y., Quan, H., Han, Y., Sun, J., and Feng, Y. (2013). Treatment of Acid Mine Drainage by Sulfate Reducing Bacteria with Iron in Bench Scale Runs. Bioresour. Technology 128, 818–822. doi:10.1016/j.biortech.2012.10.070
Biswas, S., and Bose, P. (2005). Zero-valent Iron-Assisted Autotrophic Denitrification. J. Environ. Eng. 131, 1212–1220. doi:10.1061/(ASCE)0733-937210.1061/(asce)0733-9372(2005)131:8(1212)
Cui, L. Y., Liu, Z. Y., Xu, D. K., Hu, P., Shao, J. M., Du, C. W., et al. (2020). The Study of Microbiologically Influenced Corrosion of 2205 Duplex Stainless Steel Based on High-Resolution Characterization. Corrosion Sci. 174, 108842. doi:10.1016/j.corsci.2020.108842
Dannenberg, S., Kroder, M., Dilling, W., and Cypionka, H. (1992). Oxidation of H2, Organic Compounds and Inorganic Sulfur Compounds Coupled to Reduction of O2 or Nitrate by Sulfate-Reducing Bacteria. Arch. Microbiol. 158, 93–99. doi:10.1007/BF00245211
Dou, W., Liu, J., Cai, W., Wang, D., Jia, R., Chen, S., et al. (2019). Electrochemical Investigation of Increased Carbon Steel Corrosion via Extracellular Electron Transfer by a Sulfate Reducing Bacterium under Carbon Source Starvation. Corrosion Sci. 150, 258–267. doi:10.1016/j.corsci.2019.02.005
Flemming, H.-C., Wingender, J., Szewzyk, U., Steinberg, P., Rice, S. A., and Kjelleberg, S. (2016). Biofilms: an Emergent Form of Bacterial Life. Nat. Rev. Microbiol. 14, 563–575. doi:10.1038/nrmicro.2016.94
Gu, T., Jia, R., Unsal, T., and Xu, D. (2019). Toward a Better Understanding of Microbiologically Influenced Corrosion Caused by Sulfate Reducing Bacteria. J. Mater. Sci. Technology 35, 631–636. doi:10.1016/j.jmst.2018.10.026
Gu, T., and Xu, D. (2013). Why Are Some Microbes Corrosive and Some Not? CORROSION 2013. Paper No. 2336. Orlando, FL: NACE International.
Heidelberg, J. F., Seshadri, R., Haveman, S. A., Hemme, C. L., Paulsen, I. T., Kolonay, J. F., et al. (2004). The Genome Sequence of the Anaerobic, Sulfate-Reducing Bacterium Desulfovibrio Vulgaris Hildenborough. Nat. Biotechnol. 22, 554–559. doi:10.1038/nbt959
Jia, R., Wang, D., Jin, P., Unsal, T., Yang, D., Yang, J., et al. (2019). Effects of Ferrous Ion Concentration on Microbiologically Influenced Corrosion of Carbon Steel by Sulfate Reducing Bacterium Desulfovibrio Vulgaris. Corrosion Sci. 153, 127–137. doi:10.1016/j.corsci.2019.03.038
Jia, R., Yang, D., Al-Mahamedh, H. H., and Gu, T. (2017). Electrochemical Testing of Biocide Enhancement by a Mixture of D-Amino Acids for the Prevention of a Corrosive Biofilm Consortium on Carbon Steel. Ind. Eng. Chem. Res. 56, 7640–7649. doi:10.1021/acs.iecr.7b01534
Jogdeo, P., Chai, R., Shuyang, S., Saballus, M., Constancias, F., Wijesinghe, S. L., et al. (2017). Onset of Microbial Influenced Corrosion (MIC) in Stainless Steel Exposed to Mixed Species Biofilms from Equatorial Seawater. J. Electrochem. Soc. 164, C532–C538. doi:10.1149/2.0521709jes
Li, H., Xu, D., Li, Y., Feng, H., Liu, Z., Li, X., et al. (2015). Extracellular Electron Transfer Is a Bottleneck in the Microbiologically Influenced Corrosion of C1018 Carbon Steel by the Biofilm of Sulfate-Reducing Bacterium Desulfovibrio Vulgaris. PLoS One 10, e0136183. doi:10.1371/journal.pone.0136183
Li, X., Lan, S.-m., Zhu, Z.-p., Zhang, C., Zeng, G.-m., Liu, Y.-g., et al. (2018a). The Bioenergetics Mechanisms and Applications of Sulfate-Reducing Bacteria in Remediation of Pollutants in Drainage: a Review. Ecotoxicology Environ. Saf. 158, 162–170. doi:10.1016/j.ecoenv.2018.04.025
Li, Y., Xu, D., Chen, C., Li, X., Jia, R., Zhang, D., et al. (2018b). Anaerobic Microbiologically Influenced Corrosion Mechanisms Interpreted Using Bioenergetics and Bioelectrochemistry: a Review. J. Mater. Sci. Technology 34, 1713–1718. doi:10.1016/j.jmst.2018.02.023
Little, B. J., and Lee, J. S. (2007). Microbiologically Influenced Corrosion. Hoboken, New Jersey, United States: John Wiley & Sons. doi:10.1002/9783527610426.bard040603
Liu, H., Gu, T., Zhang, G., Liu, H., and Cheng, Y. F. (2018). Corrosion of X80 Pipeline Steel under Sulfate-Reducing Bacterium Biofilms in Simulated CO2-saturated Oilfield Produced Water with Carbon Source Starvation. Corrosion Sci. 136, 47–59. doi:10.1016/j.corsci.2018.02.038
Lv, M., and Du, M. (2018). A Review: Microbiologically Influenced Corrosion and the Effect of Cathodic Polarization on Typical Bacteria. Rev. Environ. Sci. Biotechnol. 17, 431–446. doi:10.1007/s11157-018-9473-2
Ning, J., Zheng, Y., Young, D., Brown, B., and Nešić, S. (2014). Thermodynamic Study of Hydrogen Sulfide Corrosion of Mild Steel. Corrosion 70 (4), 375–389. doi:10.5006/0951
Peck, H. D. (1993). “Bioenergetic Strategies of the Sulfate-Reducing Bacteria,” in The Sulfate-Reducing Bacteria: Contemporary Perspectives. Editors J. M. Odom, and R. Singleton (New York, NY: Springer), 41–76. doi:10.1007/978-1-4613-9263-7_3
Sheng, X., Ting, Y.-P., and Pehkonen, S. O. (2007). The Influence of Sulphate-Reducing Bacteria Biofilm on the Corrosion of Stainless Steel AISI 316. Corrosion Sci. 49, 2159–2176. doi:10.1016/j.corsci.2006.10.040
Służalec, A. (1992). “Stress-Strain Curve,” in Introduction to Nonlinear Thermomechanics: Theory and Finite-Element Solutions. London: Springer London, 45–47. doi:10.1007/978-1-4471-1906-7_5
Wang, D., Liu, J., Jia, R., Dou, W., Kumseranee, S., Punpruk, S., et al. (2020). Distinguishing Two Different Microbiologically Influenced Corrosion (MIC) Mechanisms Using an Electron Mediator and Hydrogen Evolution Detection. Corrosion Sci. 177, 108993. doi:10.1016/j.corsci.2020.108993
Wu, T., Yan, M., Zeng, D., Xu, J., Sun, C., Yu, C., et al. (2015). Stress Corrosion Cracking of X80 Steel in the Presence of Sulfate-Reducing Bacteria. J. Mater. Sci. Technology 31, 413–422. doi:10.1016/j.jmst.2014.08.012
Xu, D., and Gu, T. (2011). Bioenergetics Explains when and Why More Severe MIC Pitting by SRB Can Occur. CORROSION 2011, Paper No. 11426. Houston, TX: NACE International.
Xu, D., and Gu, T. (2014). Carbon Source Starvation Triggered More Aggressive Corrosion against Carbon Steel by the Desulfovibrio Vulgaris Biofilm. Int. Biodeterioration Biodegradation 91, 74–81. doi:10.1016/j.ibiod.204.03.01410.1016/j.ibiod.2014.03.014
Xu, D., Li, Y., and Gu, T. (2016). Mechanistic Modeling of Biocorrosion Caused by Biofilms of Sulfate Reducing Bacteria and Acid Producing Bacteria. Bioelectrochemistry 110, 52–58. doi:10.1016/j.bioelechem.2016.03.003
Keywords: X80 steel, microbiologically influenced corrosion, mechanical property, sulfate-reducing bacteria, tensile test, starvation, biofilm
Citation: Li Z, Yang J, Guo H, Kumseranee S, Punpruk S, Mohamed ME, Saleh MA and Gu T (2021) Carbon Source Starvation of a Sulfate-Reducing Bacterium–Elevated MIC Deterioration of Tensile Strength and Strain of X80 Pipeline Steel. Front. Mater. 8:794051. doi: 10.3389/fmats.2021.794051
Received: 13 October 2021; Accepted: 15 November 2021;
Published: 13 December 2021.
Edited by:
Qixin Zhou, University of Akron, United StatesReviewed by:
Tao Liu, Shanghai Maritime University, ChinaChunguang Yang, Institute of Metals Research (CAS), China
Copyright © 2021 Li, Yang, Guo, Kumseranee, Punpruk, Mohamed, Saleh and Gu. This is an open-access article distributed under the terms of the Creative Commons Attribution License (CC BY). The use, distribution or reproduction in other forums is permitted, provided the original author(s) and the copyright owner(s) are credited and that the original publication in this journal is cited, in accordance with accepted academic practice. No use, distribution or reproduction is permitted which does not comply with these terms.
*Correspondence: Tingyue Gu, Z3VAb2hpby5lZHU=