 Jennifer de Jonge1,2†
 Jan Kodde1
 Edouard I. Severing1†
 Guusje Bonnema3
 Gerco C. Angenent1,2
 Richard G. H. Immink1,2
 Steven P. C. Groot1*
- 1Bioscience, Plant Research International, Wageningen University and Research Center, Wageningen, Netherlands
- 2Laboratory of Molecular Biology, Wageningen University, Wageningen University and Research Center, Wageningen, Netherlands
- 3Wageningen UR Plant Breeding, Wageningen University, Wageningen University and Research Center, Wageningen, Netherlands
Most of the above ground tissues in higher plants originate from stem cells located in the shoot apical meristem (SAM). Several plant species can suffer from spontaneous stem cell arrest resulting in lack of further shoot development. In Brassica oleracea this SAM arrest is known as blindness and occurs in an unpredictable manner leading to considerable economic losses for plant raisers and farmers. Detailed analyses of seedlings showed that stem cell arrest is triggered by low temperatures during germination. To induce this arrest reproducibly and to study the effect of the environment, an assay was developed. The role of genetic variation on the susceptibility to develop blind seedlings was analyzed by a quantitative genetic mapping approach, using seeds from a double haploid population from a cross between broccoli and Chinese kale, produced at three locations. The analysis revealed, besides an effect of the seed production location, a region on linkage group C3 associated with blindness sensitivity. A subsequent dynamic genome-wide transcriptome analysis resulted in the identification of around 3000 differentially expressed genes early after blindness induction. A large number of cell cycle genes were en masse induced early during the development of blindness, whereas shortly after, all were down-regulated. This miss-regulation of core cell cycle genes is accompanied with a strong reduction of cells reaching the DNA replication phase. From the differentially expressed genes, 90 were located in the QTL region C3. Among them are two genes belonging to the MINICHROMOSOMAL MAINTENANCE gene family, known to be involved in DNA replication, a RETINOBLASTOMA-RELATED gene, a key regulator for cell cycle initiation, and several MutS homologs genes, involved in DNA repair. These genes are potential candidates for being involved in the development of blindness in Brassica oleracea sensitive genotypes.
Introduction
Upon germination and during the vegetative stage of development, a small almost constant number of pluripotent stem cells is located in the shoot and root apical meristems (Yanai et al., 2005; van Zanten et al., 2011). The shoot apical meristem (SAM) can be divided into a central zone that is essential for maintenance of the meristem and a peripheral zone, from which lateral organs are initiated (Jürgens, 1995). The centrally localized stem cells are renewed throughout plant development, while a part of the cells in the SAM periphery differentiate to form the aerial parts of a plant (Barton and Poethig, 1993). In the plant model species Arabidopsis thaliana, maintenance of central stem cells is organized by a feedback loop between WUSCHEL, a homeobox transcription factor, and CLAVATA receptor-like kinases and ligand proteins (Laux et al., 1996; Schoof et al., 2000).
When the balance between maintenance of stem cells and cell differentiation is distorted, plants can lose SAM function. Loss of shoot development has been described for several plant species, such as tomato (Solanum lycopersicum; Wetzstein and Vavrina, 2002), baby’s breath (Gypsophila paniculata; Hicklenton et al., 1993), cauliflower and broccoli (both Brassica oleracea; Wiebosch et al., 1950). In general, unfavorable environmental conditions are believed to cause loss of SAM activity in sensitive plants. The plant environment varies regularly, ranging from optimal conditions for plant growth and development toward abiotic or biotic stress conditions (Janská et al., 2010). Plants have the ability to adapt to abiotic stress (e.g., temperature, drought, and salt) via specific signaling pathways involving phytohormones and regulatory proteins, such as receptors, protein modifiers, and transcription factors, ultimately leading to gene expression changes (Koornneef et al., 1991; Davis, 2009).
The species B. oleracea is cultivated with many crop types, including broccoli, cauliflower, cabbages, Chinese kale and kohlrabi. Young plants of these crops may lose the growing shoot, a phenomenon known as “blind” or “blindness” which prevents the production of a marketable product. The occurrence of blind B. oleracea plants has been described already in the 1940s. It is characterized by termination of leaf primordia initiation in the SAM (Forsyth et al., 1999). It has been reported that depending on the moment of exposure to the inductive conditions and the developmental stage of the plant, five to ten leaves can be formed before the SAM ceases (Wiebosch et al., 1950). The last formed leaf may have a normal shape or consists of a petiole only, lacking a leaf blade (Forsyth et al., 1999). In a previous study (Wiebosch et al., 1950), three forms of blindness have been distinguished: empty hearted plants (with a dent in the stem), needle types (forming a pin-like structure at the position of the SAM) and pitcher plants (pitcher-shaped leaf as last structure). For plant growers blind plants are problematic, because recognizing affected plants at an early stage before transplanting them into the field is hardly possible, resulting in high economic losses that can be up to 95% in broccoli (Wurr et al., 1996). During 70 years of research, aiming to identify potential causes, various growth and environmental conditions have been proposed to induce blindness, including low temperature during early stages of development (Salter, 1957), freezing conditions (Mounsey-Wood, 1957), low solar radiation (Wurr et al., 1996), sowing date (Wurr et al., 1996), and molybdenum deficiency (Agarwala, 1952). However, overall the results are inconclusive and no main and common cause of blindness induction has been described. Besides environmental effects, there is likely a genetic component involved because growers experience that some varieties are more susceptible to blindness than others under seemingly the same environmental conditions.
To study and elucidate the basis of SAM arrest in B. oleracea, it is essential to have a reproducible induction system for blindness under controlled conditions. The induction method used by Wurr et al. (1996), with low light intensities is time and space consuming as blind plants develop several leaves prior to the loss of SAM activity. Furthermore, this method has shown to work for broccoli only (B. oleracea convar. botrytis). Therefore, we aimed to establish an early blindness induction system, useful for a spectrum of B. oleracea crop types and to apply this method to study the morphological, physiological and genetic mechanisms underlying SAM arrest in B. oleracea plants.
Materials and Methods
Plant Material
To develop a protocol for blindness induction, we used various B. oleracea seed lots from our laboratory collection of seed samples. These seed lots, left from previous seed research projects, represented several crop types. Seed lot numbers (in our collection), crop type and sensitivity for blindness are given in Supplementary Table S1. The AGDH doubled haploid population (Bohuon et al., 1996), was used to study genetic variation in sensitivity for blindness induction. This population was developed by crossing two double haploid parents, a rapid-cycling Chinese kale line, B. oleracea var. alboglabra (A12DHd), and a Calabrese broccoli line, B. oleracea convar. botrytis var. italica (GDDH33), through microspore culture of the F1. Seeds from about 100 double haploid lines were multiplied by seed companies in The Netherlands at three different locations under protected cultivation with natural light conditions.
Subsequent experiments, to study morphological effects and gene expression, were performed with seeds from the sensitive seed lot 1645 from the green cabbage cultivar Stanton F1 and specific lines from the AGDH population.
Induction of Blindness in B. oleracea
To develop an assay for detecting sensitivity to the induction of blindness, the seeds were imbibed at low temperatures for a period between one and 14 days in darkness. Dry seeds were sown in Petri dishes on a layer of three filter papers moistened with cold demineralized water and incubated at the tested induction temperature in the dark. Temperature was measured with data loggers (EL-USB-2, Lascar Electronics, United Kingdom) next to the Petri dishes. In the first experiments temperatures between 0 and 10.5°C were tested. As the lowest temperatures gave the strongest induction, a temperature between 0 and 1°C was used in most of the subsequent experiments. This was achieved by placing the Petri dishes with seeds in a Styrofoam box filled with melting ice. The box with seeds and ice was placed in an incubator at 4°C. Cold induction for the QTL analysis with a large number of lines required mores space and a cold room at 1.5°C was used. After the cold incubation the seeds were transferred to individual pots of a 240 pot tray (pot size 2.8 cm × 2.8 cm × 4 cm, Modiform, Leusden, The Netherlands) filled with washed coco-peat and placed in a growth chamber at 20°C with 18 h incandescent light (150 μmol). Moisture was provided to the seedlings with tap water during the first 2 weeks and a standard nutrient solution was applied in the 3rd week. Plants were scored by eye for the absence of a growing shoot 3 weeks after sowing, unless stated otherwise. Seedling behavior under non-inducing (control) conditions was studied by imbibing dry seeds directly at 20°C.
Microscopy
For histological analysis the material was fixed in 4% paraformaldehyde for a maximum of 16 h. Afterward, the samples were transferred to 30% ethanol overnight, than dehydrated in steps of 30 min until incubation in 96% of ethanol. Subsequently, the Technovit protocol was followed according to the manufacturer (Heraeus Kulzer GmbH, Wehrheim, Germany). The Technovit blocks were cut with a microtome in sections of 3 μm and toluidine blue was used for staining. Digital pictures were made with the Zeiss Axioskop microscope. Images were taken with a Leica DFC320 digital camera attached to the microscope and processed using Adobe Photoshop for white balance and contrast correction. Electron microscopy pictures were made at the Electron Microscopy Centre using the FEI Magellan FESEM high resolution scanning electron microscope.
For imaging nuclei with DNA replication activity, seeds were taken from the cold induction assay and directly placed on sterile growth medium (Daishin agar, Duchefa Biochemie) with Murashige and Skoog medium, Gamborg B5 Vitamins (Duchefa Biochemie) containing 10 μM EdU (Invitrogen) and germinated in a growth cabinet under 24 h light and at 17°C. After 48 h treatment time, shoot apices were dissected, dehydrated, and stained as described in Schiessl et al. (2012). The sections were imaged with a confocal laser scanning microscope (Leica SPE DM5500 upright microscope) using Leica Application Suite Advanced Fluorescence software (version 1.8.2, Leica Microsystems CMS, Mannheim, Germany).
QTL Mapping
For QTL mapping, double haploid lines of the AGDH population (Bohuon et al., 1996; Sebastian et al., 2000) were studied. For this analysis, seeds from the whole population were reproduced at three locations with up to five plants per line per location. Seeds from the individual plants were kept separate. Lines that turned out to be phenotypically impure were discarded from the analysis. As a result, from the original 117 AGDH lines a subset of 85 lines were analyzed. Due to the large numbers of seeds to be tested, a slightly adjusted induction protocol was used. During the cold induction seeds were sown in the grooves of folded filter paper placed in plastic (15 cm × 21 cm) trays and moistened with ice-cold water. The trays with seeds were incubated in a cold room at 1.5°C for 10 days. After the cold induction the seeds were transferred to pots in the greenhouse as described above. Seedling evaluation was 3 weeks later. The experiment was performed in a randomized block setup with two blocks, and seeds from all individual plants represented in every block, with 12 seeds per mother plant as experimental unit. GenStat (2014) and Payne et al. (2014) was used for a multi-environment QTL analysis. For this analysis the genetic map as published by Broadley et al. (2008) was used. This map is based on the work of (Sebastian et al., 2000). The natural logarithm of the proportion of the blind plants per combination of line and location was used for analysis. Only combinations with at least 25 seedlings were used in the analysis. For testing the significance of a QTL, the method of (Li and Ji, 2005) was employed to calculate the significance threshold assuming a genome-wide significance level of 5%.
Identification of QTL Region
The physical contig corresponding to the C03 QTL region was identified by first determining the genomic region (on chromosomes C03) that could be amplified with the SSR primers flanking the QTL region using in silico PCR1. Then finally, the QTL was chosen as the smallest genomic region encapsulated by SSR amplicons which included all markers with LOD score ≥ 2.5. The QTL on chromosome C03 was determined to start at position 18434598 and end at 34773929 as defined by the amplified regions corresponding to the SSR markers: BoSF2985 and boa011. A total of 1354 genes are predicted to be encoded in this QTL-region.
Transcriptome Analysis by RNA-seq
Total RNA was isolated at different time points, in triplicate after the induction treatment, from meristem enriched plant material (ten plants for each sample; lines AG 1020 and AG 5010) using the Spin Plant RNA Mini Kit from Invitrap® (Stratec Molecular, Berlin, Germany). RNA samples were treated with DNAse I. Sequencing libraries were prepared with the TruSeq RNA Sample Preparation kit (Illumina, San Diego, CA, USA) following the manufacturer manual. Paired-end sequencing was done on an Illiumina Hi-Seq 2000 machine with 100 bp read length.
RNA-seq reads were mapped against the genome of B. oleracea2 using TopHat version 2.0.12 (Kim et al., 2013) with the following settings: -N 5 –read-edit-dist 5 –read-gap-length 3. HTSeq-count (Anders et al., 2014) was used for counting the number of reads mapping to annotated gene. Differential gene expression analyses were performed using DESeq2 (Love et al., 2014).
We assigned Gene ontology (GO) terms to B. oleracea genes by performing similarity searches against the predicted proteome of A. thaliana version TAIR103 using BlastP (Altschul et al., 1990). The GO terms were inherited from the best blast hit (e-value < = 1e-5). The GO term annotation was formatted such that it could be used for enrichment analysis using BINGO (Maere et al., 2005). The background gene set for each enrichment analysis consisted of all genes expressed (read count > 0) in at least one of the samples being compared.
RNA-Seq Data Accession Numbers
The raw RNA-seq sequence reads were deposited at the NCBI Sequence Read Archive (SRA) under the BioProject number: PRJNA319618.
Gene Expression Analysis by qRT-PCR
Homologs of A. thaliana genes active in the SAM were identified in B. oleracea by Blast (blastp) searches. Alignments of the best hits from the blast search were made using ClustalW (Thompson et al., 1994). Subsequently, primers were designed for the B. oleracea genes with highest overall sequence homology to the Arabidopsis genes. For a selection of genes identified to be differentially expressed based on the RNA-seq analyses, primers were designed using the corresponding predicted coding sequences. Primer sequences and homology percentages can be found in Supplementary Table S2. Finally the uniqueness of the generated primers was tested using in silico PCR. RNA for the qRT-PCR experiments was isolated from meristem enriched tissue of ten plants per biological replicate that were dissected under a microscope at the desired time-point in triplicate. Total RNA was isolated from this material as described above for the RNA-seq. Afterward, cDNA was synthesized from 1 μg of total RNA using the TaqMan reverse transcriptase kit (Roche). Gene expression was measured by quantitative RT-PCR (qRT-PCR) with four biological replicates, using SYBR green mix from Bio-Rad, and making use of the primer combinations indicated in Supplementary Table S2. The single copy BoYLS8 gene was used as reference gene for normalization and data were analyzed using the ΔΔCT method (Livak and Schmittgen, 2001; Schmittgen and Livak, 2008).
Results
Imbibition at Low Non-freezing Temperature Can Induce Blindness in Susceptible Seed Lots
We investigated the role and effect of low (non-freezing) temperatures on B. oleracea SAM loss during seedling development. To induce blindness, seeds were imbibed in darkness at temperatures ranging from 0.7 to 10.5°C for one to 14 days (Figure 1). After 10 days of exposing seeds to cold incubation below 11°C, none had reached the phase of radicle protrusion, which occurred for most seeds within 24 h after transfer of the seeds from the cold to 20°C. After 14 days of cold incubation at 10.5°C some seeds showed radicle protrusion. The blind seedlings obtained from these cold treated seed batches exhibited a gradual variation in the severity of blindness, with either no leaves at all or a few aberrant leaves (Supplementary Figure S1). A clear relation between severity of blindness and length of the treatment was observed: the lower temperature and longer treatment durations induced higher frequencies of blind seedlings. Incubation around 0–1°C proved to be the best induction temperature for an assay to analyze sensitivity, since it resulted in the most severe induction without affecting germination capacity. Extending this induction period at the lowest temperatures to 15 or 20 days strongly decreased the number of emerging seedlings.
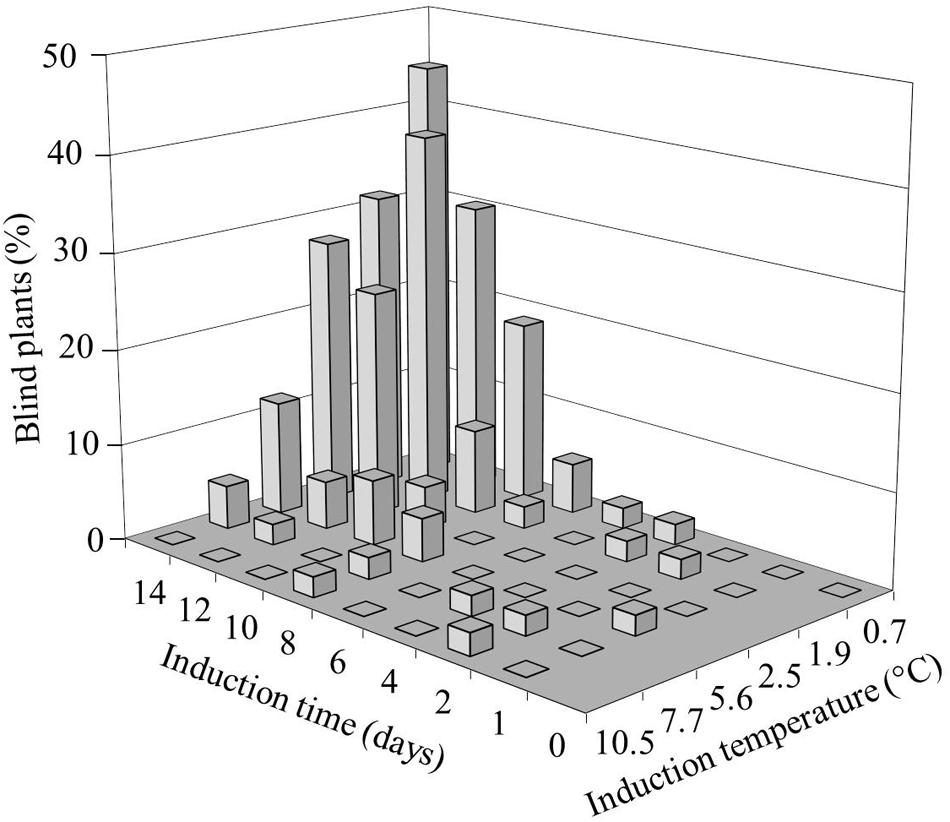
FIGURE 1. Effect of temperature and induction time on the frequency of Brassica oleracea plants with arrested shoot apical meristem (SAM; blind plants). Seeds of the cultivar Stanton (white cabbage) were imbibed for different durations at various induction temperatures, followed by transfer to 20°C. The seedling phenotype was scored 3 weeks after transfer.
To test whether there is a general mechanism involved and to understand if the assay developed here can be used to screen a wide range of B. oleracea varieties, we tested four different genotypes (Table 1). The assay conditions resulted in general in a reduction of 10–20% in seed germination, but with a clear induction of blind plants in all four seed lots tested, showing that our induction method is applicable for several B. oleracea crop types (green cabbage, kohlrabi, and broccoli). Subsequently, this result was confirmed with a larger number of seeds lots (Supplementary Table S1).
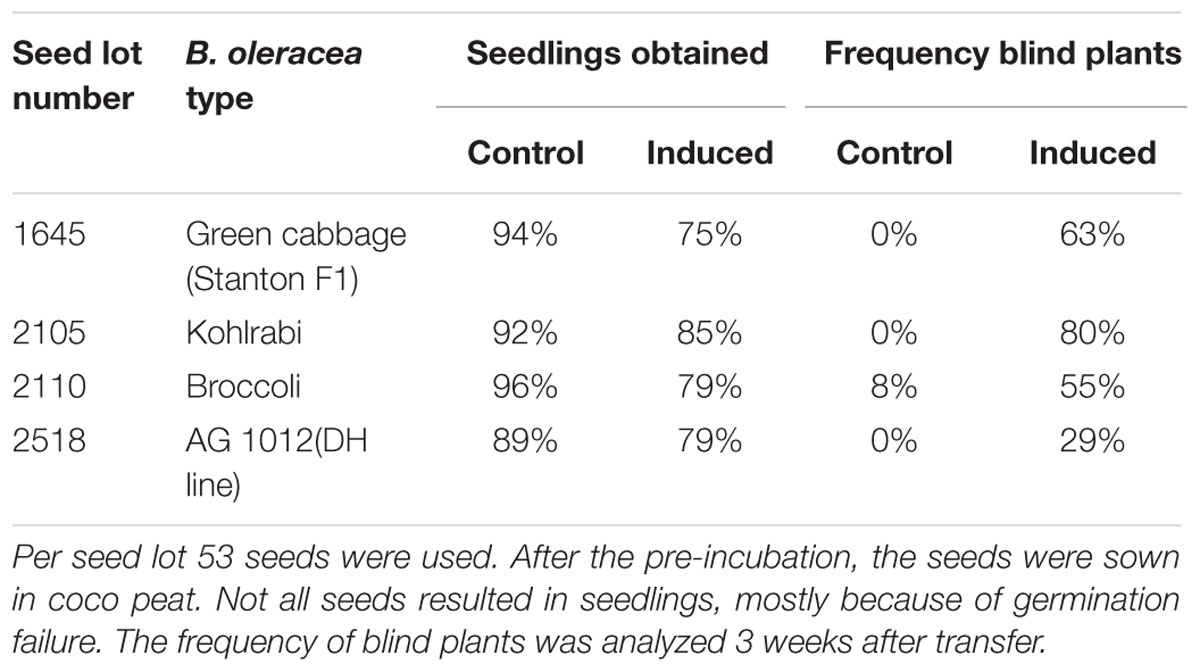
TABLE 1. Response of three seed lots from Brassica oleracea cultivars and one double haploid line from the AGDH population, to standard growth conditions (control) or after induction by treating the seeds with low temperature for 10 days on moist filter paper at 0–1°C.
Leaf Number and Architecture Is Aberrant in Blind B. oleracea Seedlings
In general stem cells in the B. oleracea SAM give rise to leaf primordia, one every few days. These primordia grow out to show a normal seedling with leaves along the stem in different stages of development. With blind seedlings this normal situation is disrupted and less leaves are formed, or aberrations in leaf architecture are observed. We analyzed the phenotype of 4 weeks old seedlings macroscopically and an example of a non-blind (normal) and blind plant is depicted in Figure 2. The non-blind plant showed three expanded leaves, besides two small developing leaves emerging from the apex (Figures 2A,B). In contrast, the blind plant had developed three expanded leaves only and stopped the production of subsequent leaves (Figures 2C,D). Often the morphology of the non-blind and blind plants was very similar at this particular stage, but further leaf development was arrested in blind plants. At the position where new leaves usually emerge the arrested plant showed a dent and exhibited absence of a growing tip and further leaf initiation (Figure 2D). We observed that the stage of development at which the arrest of the meristem occurs is variable since blind plants differed in their appearance from no leaves to plants with a few leaves, although these leaves can often be aberrantly shaped (Supplementary Figure S1). We also noticed that some arrested seedlings had the ability to generate new meristems from the axils of their cotyledons (Supplementary Figure S1C) and these axillary meristems could develop into proper shoots that continued growth and development.
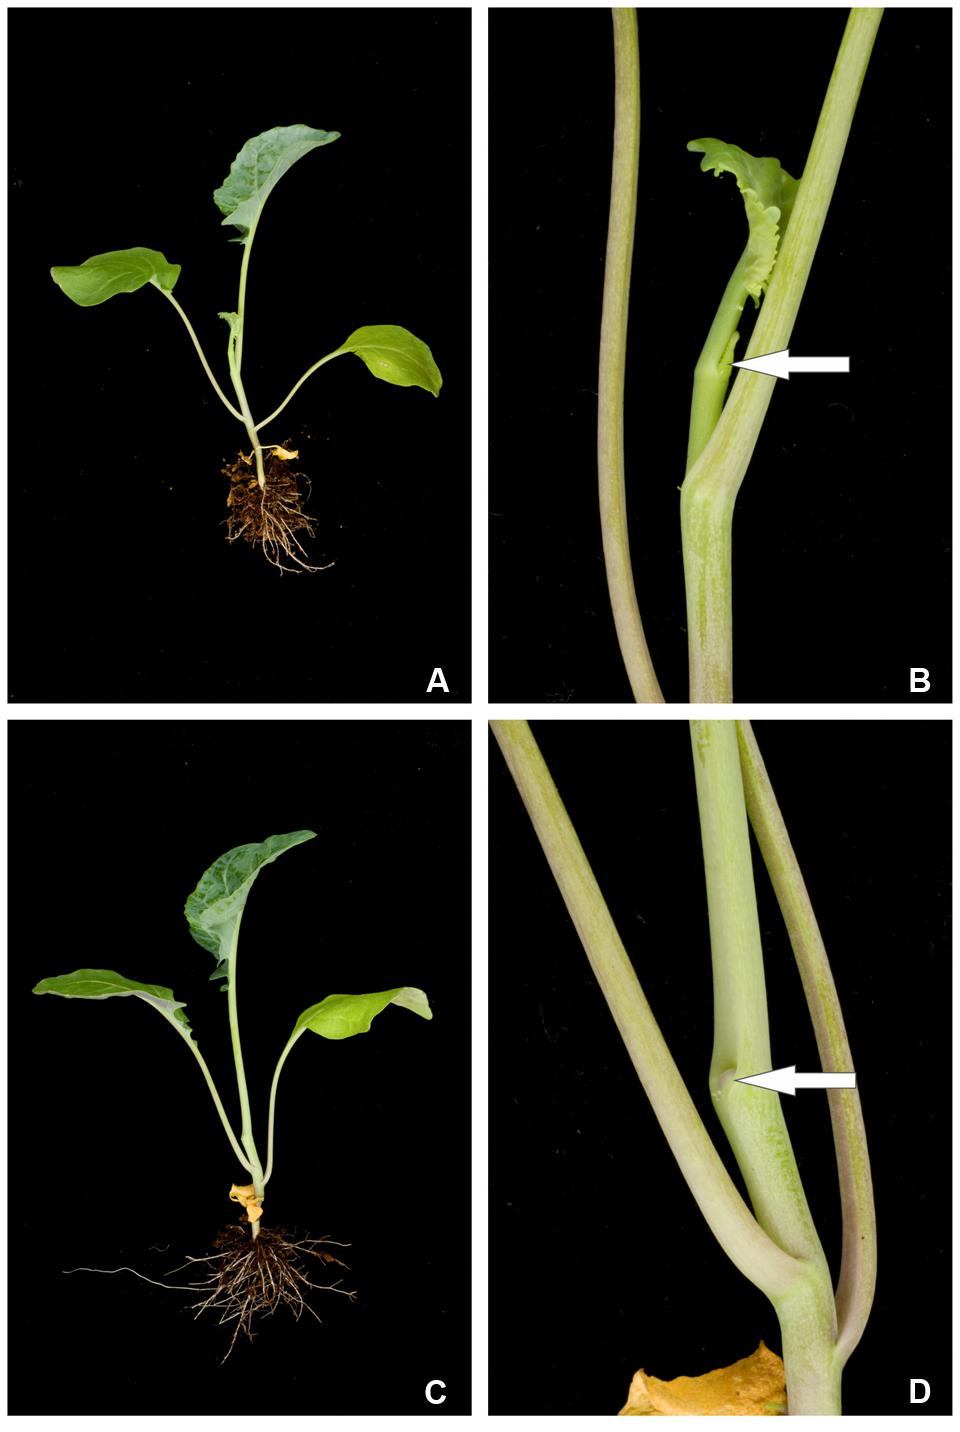
FIGURE 2. Phenotype of a 4 weeks old normal (non-blind) B. oleracea plant (A) and (B) compared to a blind plant of the same seed lot with an arrested SAM (C) and (D). The arrows shown in the enlargements (B) and (D) point to the position of the SAM or where it used to be.
While comparing the germination behavior of blind seedlings to non-blind ones, we observed that some of the blind seedlings showed reduced root growth or lost their root meristematic activity (Supplementary Figure S2). As there were also blind seedlings with a normal growing root, it seems that reduced activity of the root apical meristem is not fully linked to a lack of shoot development (Supplementary Figure S2C).
Blind Plants Have Disorganized Shoot Apical Meristems
To examine more closely the SAM area of blind plants, we performed histological analysis of normal and blind seedlings without visible leaves. Sections of 6-day old non-blind seedlings showed all three zones of a typical SAM: the central zone, the periphery zone and the rib zone (Figure 3A). The central zone displayed a group of small cells comprising the stem cells. The rib-zone showed the typical parallel file structure of cells (Jürgens, 1995). In the center of the cotyledons and in the main stem vasculature was observed. Vasculature was also visible in the sections of the blind seedlings, indicating that the sections were made approximately at the same position in the seedlings. In comparison to the non-blind seedling, the blind seedlings lacked a clear structure of the central and rib zone (Figure 3B). In general, the cell pattern of the blind seedlings was less organized and the small meristematic cells were replaced by less and large parenchyma-like cells. No clear organized L1 layer was visible in the blind seedlings at the position of the SAM in non-blind seedlings.
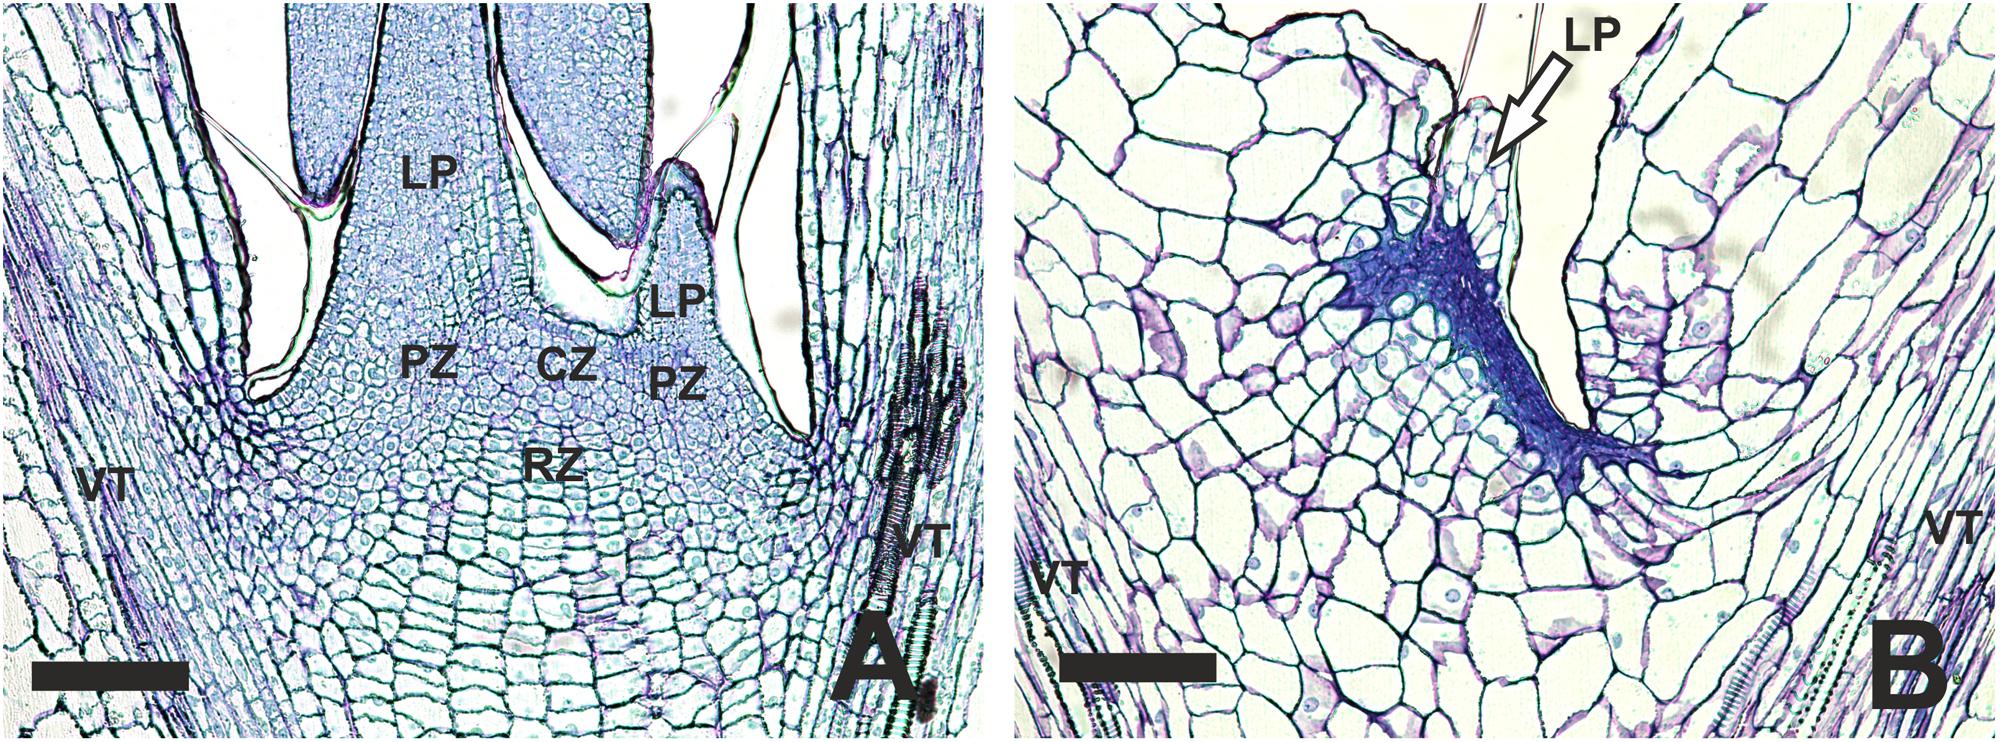
FIGURE 3. Histological differences observed in the SAM area of B. oleracea (Line AG5010) seedlings at 6 days after the induction treatment. (A) Seedling with a non-blind phenotype. (B) Seedling with a blind phenotype. CZ, Central zone; LP, Leaf primordium; PZ, Peripheral zone; RZ, Rib zone; VT, Vascular tissue reaching into the cotyledons. In (B) the arrow points to what may be the remnants of a leaf primordium initiated during seed development. The scale bars represent 100 μm.
To analyze the phenotype at an earlier stage, scanning electron microscopy pictures were taken (Figure 4). We observed a dome shaped meristem in non-blind seedlings with emerging leaf primordia at the flanks of the dome (Figures 4A,B), while blind seedlings showed a flattened area at the position of the SAM with one leaf primordium in this case (Figures 4C,D).
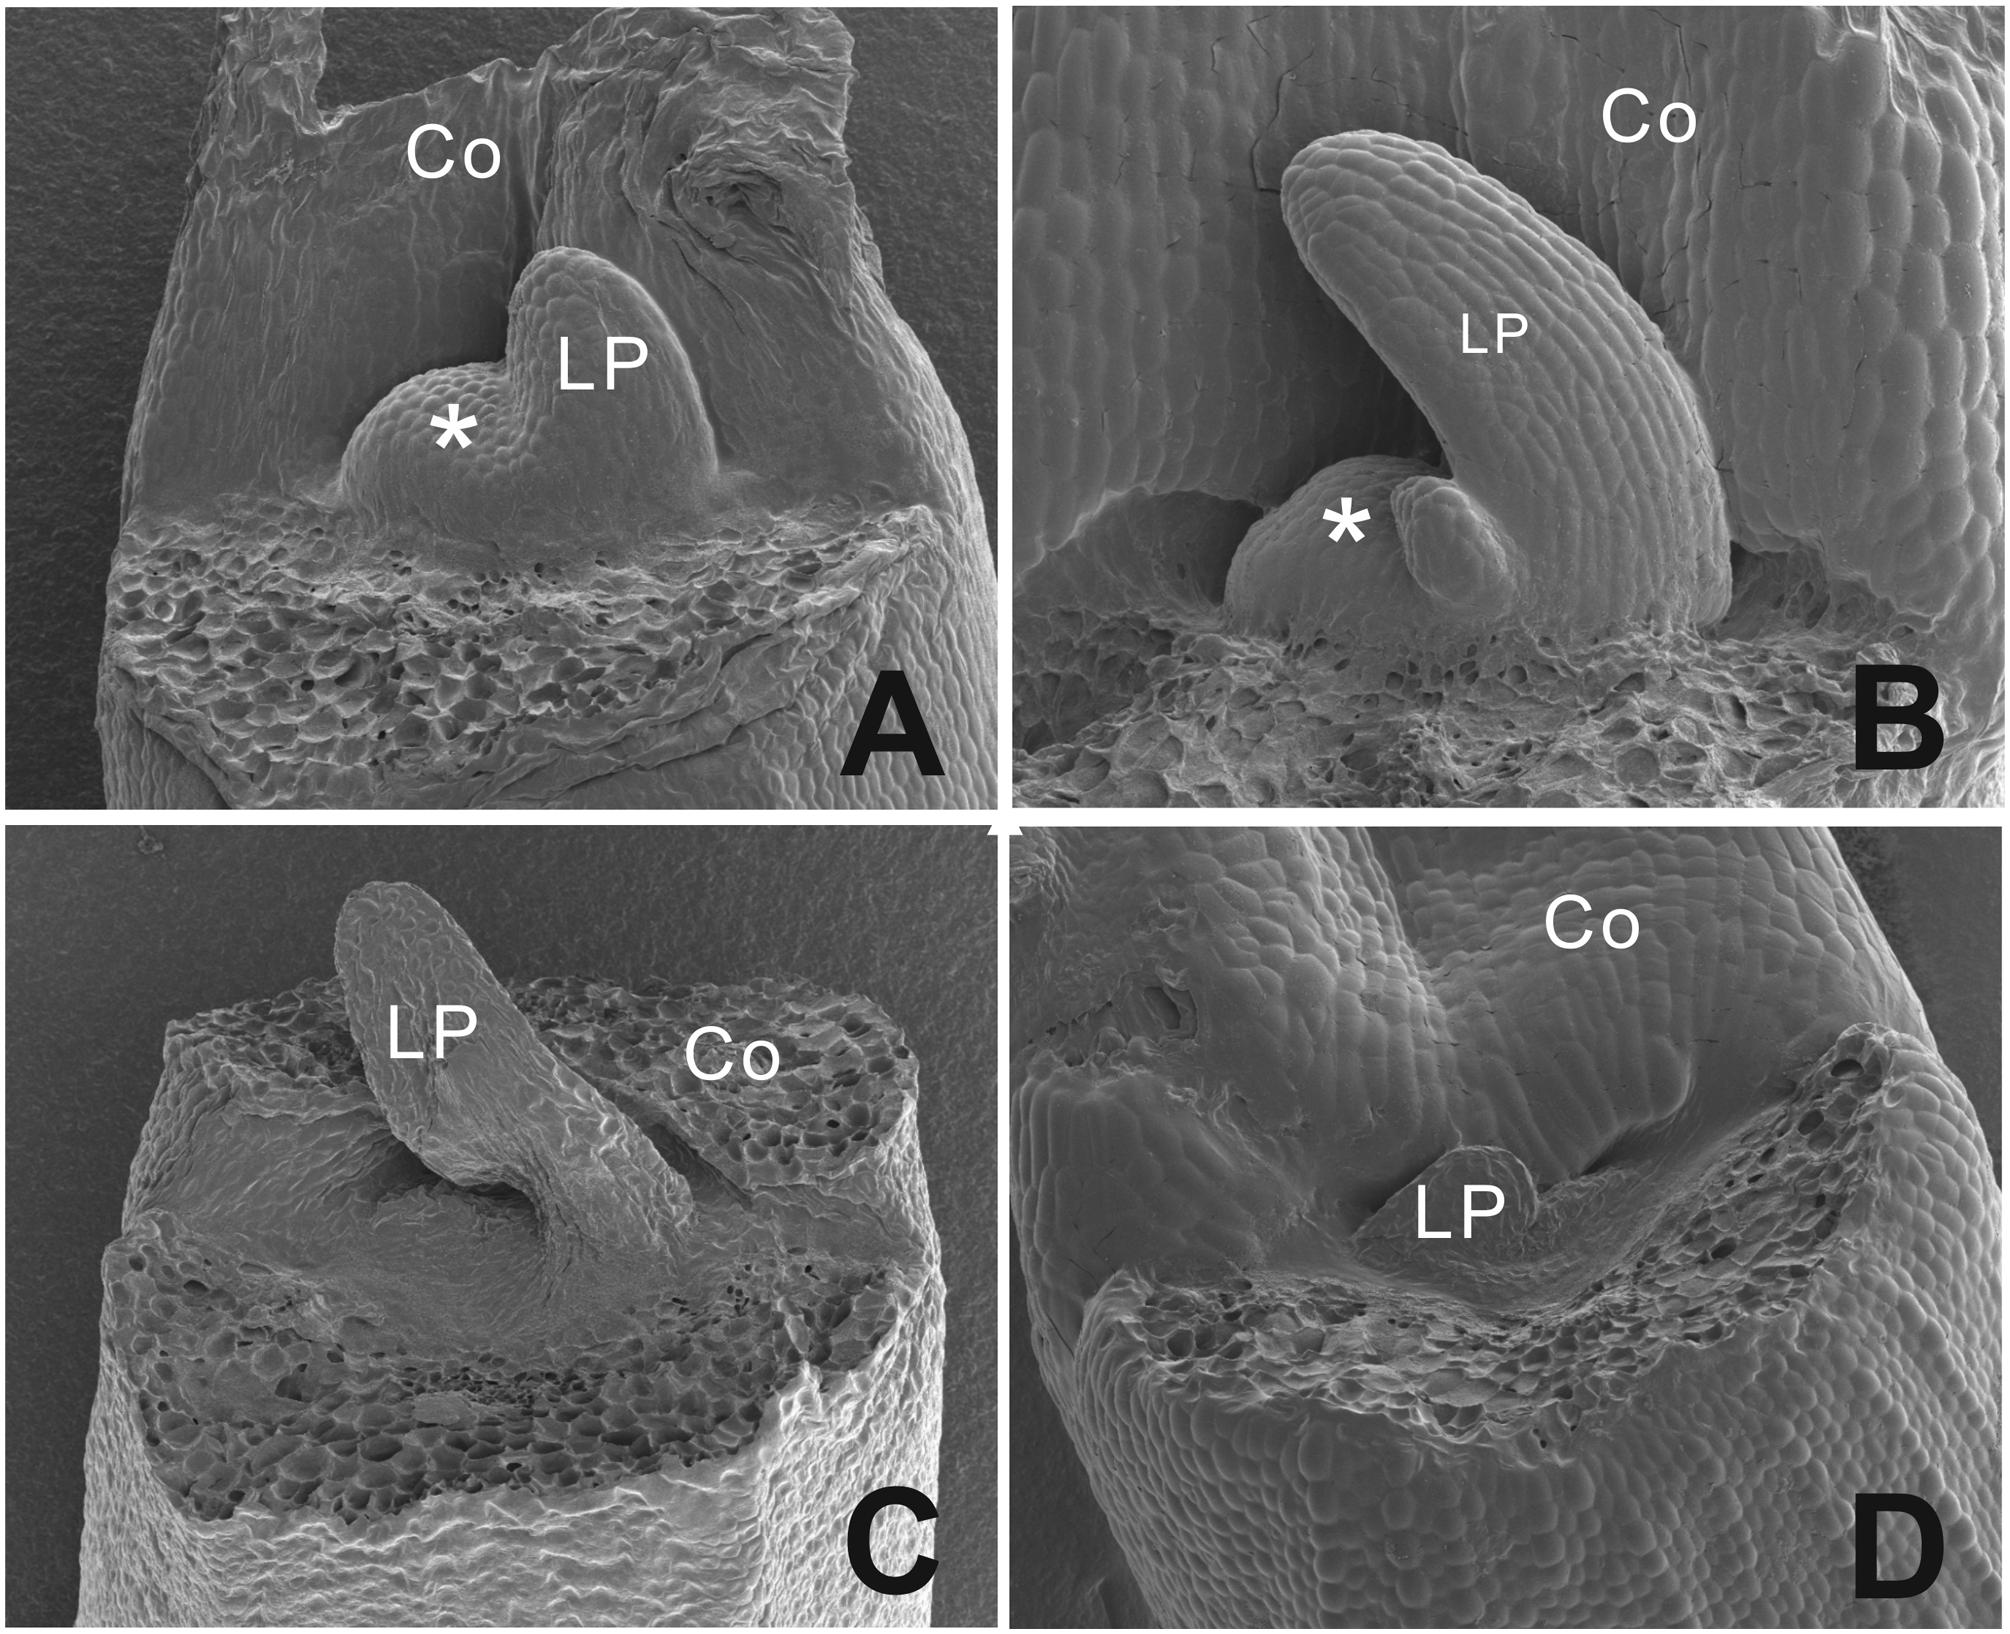
FIGURE 4. Scanning electron microscopy picture of the phenotypic difference between a functional normal and arrested SAM in B. oleracea seedlings from cultivar Stanton F1. (A) Three days old seedlings with a functional normal SAM and one leaf developing. (B) Four days old seedling with one leaf emerging and functional normal SAM. (C) Three days old seedling with an aberrant SAM area and one leaf-like structure. (D) Four days old seedling with an aberrant SAM area. Asterisks indicate the SAM, Co, cotyledons; LP, leaf primordium.
A QTL for Seedling Blindness Is Identified on Linkage Group C3
Using the blindness assay described above, we determined the sensitivity for blindness in the AGDH B. oleracea mapping population. A large variation was observed between lines in sensitivity to blindness induction (Figure 5). The sensitivity of some of the offspring DH lines in the AGDH population appeared to be even higher than that of the parents, indicating transgressive segregation for blindness under inducing conditions. In the ANOVA analysis no block effect was observed (P = 0.65), but an effect of genetic variation (P < 0.001, 25% of the variance explained) and an effect of seed production location (P < 0.001, 11% variance explained) were observed (Table 2). The latter indicates a significant effect of seed production on the sensitivity of the seeds. One QTL was identified on linkage group C03 (Figure 6). The QTL analysis further showed that the allele responsible for increased sensitivity to blindness induction is from the rapid-cycling Chinese kale parental line (A12DHd).
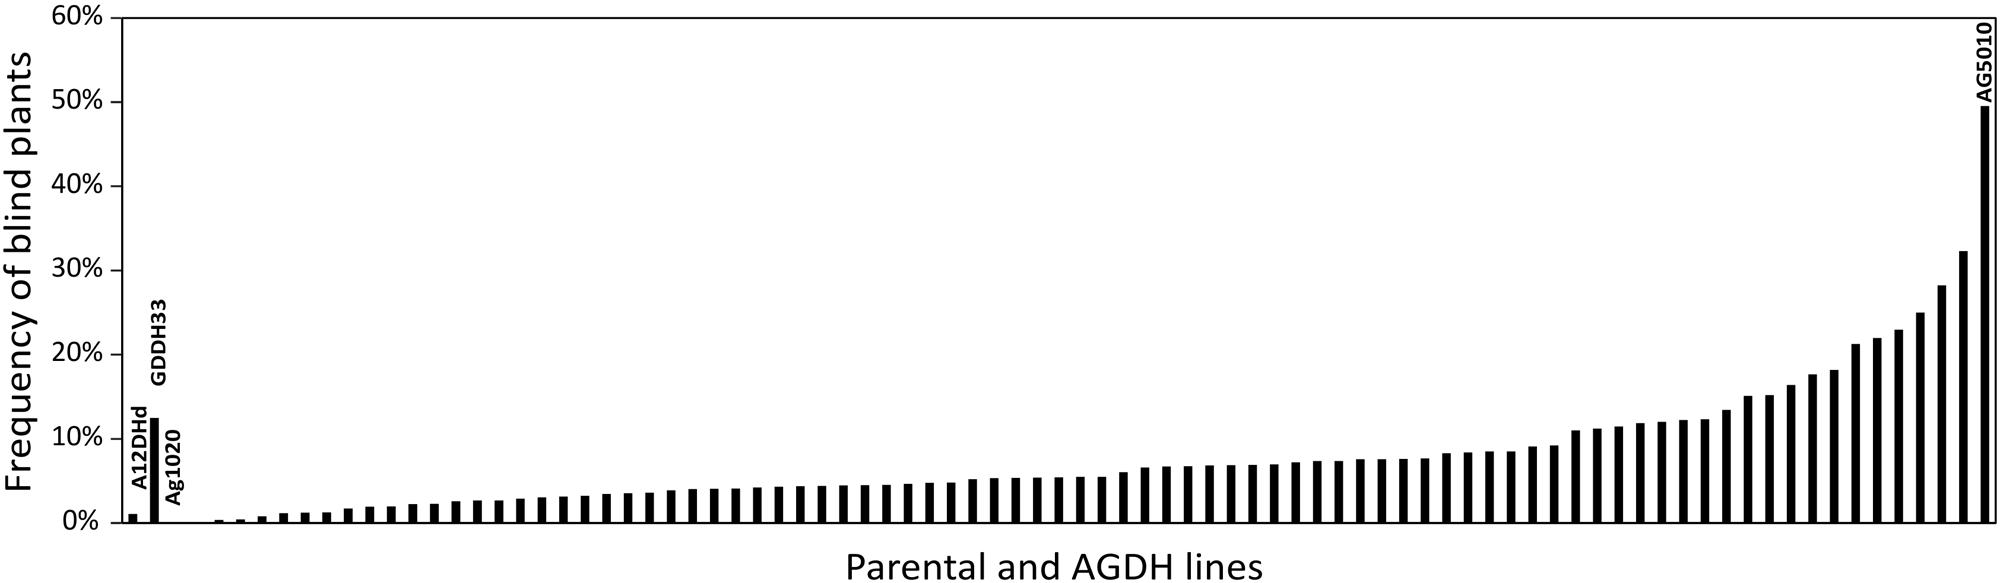
FIGURE 5. Genetic variance in sensitivity to blindness after cold induction. Percentage of blind seedlings per line from the AGDH population after exposed to blindness inducing conditions for 10 days. The parental lines of the population A12DHd and GDDH33 are indicated, as well as the lines AG1020and AG5010 that were used in further analyses. Results represent the mean percentage of blind plants from three repetitive analyses with on average 87 seeds per line per analysis. Due to limited availability of parental line seeds these were only analyzed twice, with on average 54 (for A12DHd) and 33 (GDDH33) seeds. Approximately 80% of the seeds resulted in seedlings that could be evaluated.
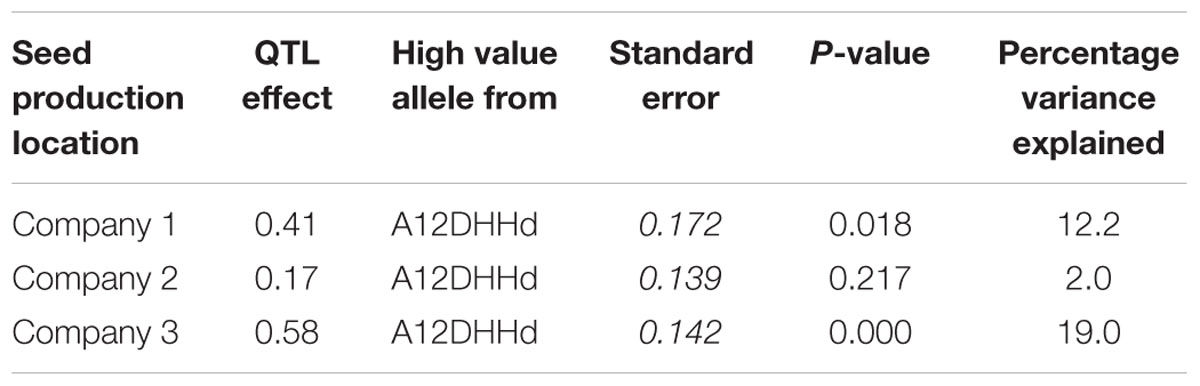
TABLE 2. QTL effects for the three seed production locations for the sensitivity to induction of blind plants as observed in the AGDH lines obtained from the cross GDDH33 × A12DHHd.
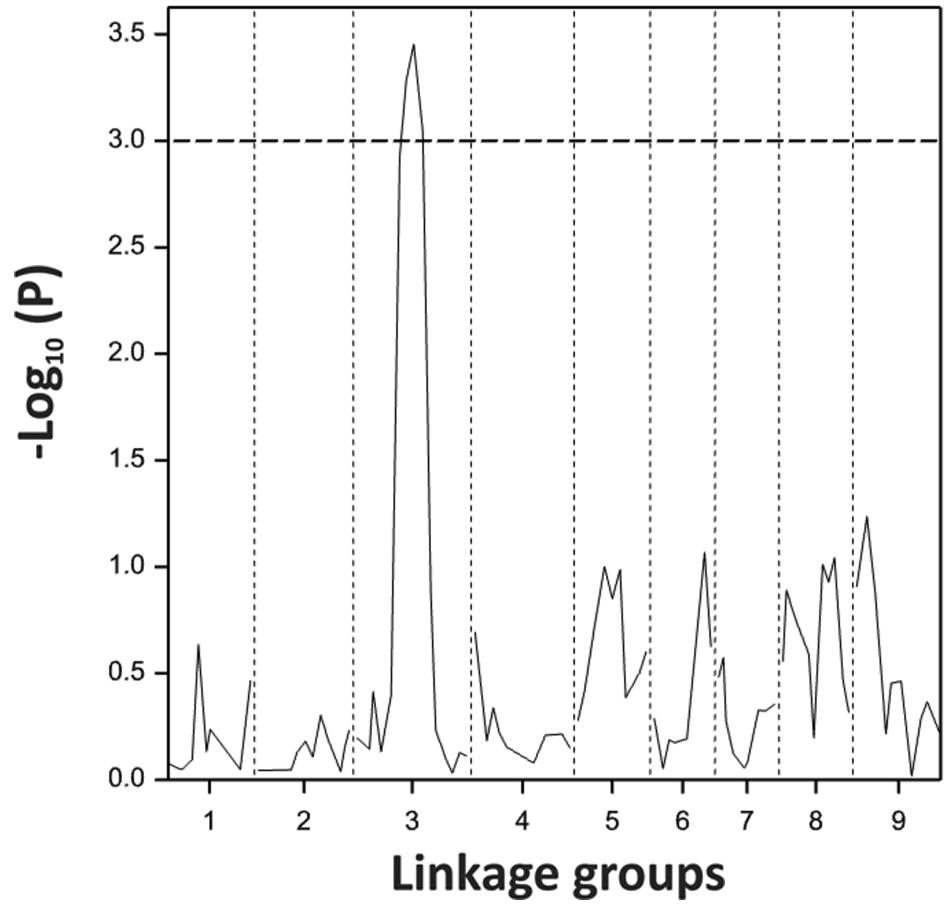
FIGURE 6. Probability score for sensitivity to blindness induction for the B. oleracea linkage group C3 analyzed with 92 lines of the AGDH population. Dotted line represents the threshold given by the permutation testing.
Transcriptional Differences in Blind and Non-blind B. oleracea Plants
Two lines of the AGDH population were selected for analysis of gene expression. Line AG1020, showing a low amount of blindness after cold treatment and therefore, was considered as tolerant. Line AG5010, showing a high frequency of blind seedlings after cold induction and was therefore considered as sensitive (Figure 5). Seedlings from those lines were used to identify genome-wide differentially expressed genes associated to blindness. To get an indication at what time-point after the cold induction the SAM loses its meristematic cells, we first performed expression measurements of the gene SHOOT MERISTEMLESS (STM), because it encodes a class-I KNOTTED-like homeobox transcription factor that is expressed throughout the SAM (Long et al., 1996; Rupp et al., 1999; Scofield et al., 2007) and is supposed to have a role in preventing stem cell differentiation (Lenhard et al., 2002; Williams and Fletcher, 2005). Quantitative RT-PCR, showed that at day 5 after the cold induction the expression of BoSTM is significantly decreased in blind seedlings compared to non-blind seedlings from the sensitive line AG5010, as well as compared to the seedlings from the resistant line AG1020 (Figure 7A). Additionally, we measured the expression of BoSTM in 10 days old seedlings after the cold induction (Figure 7B). Based on these results we selected day 2 after the cold induction as first time point for RNA-seq analysis. Unfortunately, plants are too small at this time point to determine their phenotype and hence, RNA samples are a mix of ‘to become’ non-blind and ‘to become’ blind seedlings (approximately 50%). In order to have also pure samples of blind and non-blind seedlings, we collected also material at day 7 after the cold induction, which is the earliest moment to distinguish flawlessly between blind and non-blind plants. RNA-seq was done on this material and differential gene expression was determined (adjusted p-value ≤ 0.01 and at least a twofold change). To eliminate genes that are solely cold-responsive at day 2, we eliminated those genes that were significantly up- or down-regulated in both the sensitive and resistant genotypes upon the cold treatment. For time point 7 days after induction the comparison was made between sensitive induced blind seedlings and non-blind seedlings. These filter criteria resulted in the identification of 2962 and 5929 statistically significant differentially expressed genes at day 2 (Supplementary Table S3) and day 7 (Supplementary Table S4), respectively. The quality of the RNA-seq data set was assessed by qRT-PCR for a selected number of identified differentially expressed genes (Supplementary Figure S3). Subsequently, we performed an analysis to identify GO terms over-represented (p-value < 0.05 after Benjamini Hochberg correction) in these selected gene sets at 2 and 7 days after the cold induction. This analysis revealed that at day 2, especially genes related to photosynthesis and cell proliferation were differentially expressed (Supplementary Table S5), whereas at day 7 genes involved in nuclear and chromosomal organization and cell proliferation were overrepresented among the differentially expressed genes in blind seedlings (Supplementary Table S6).
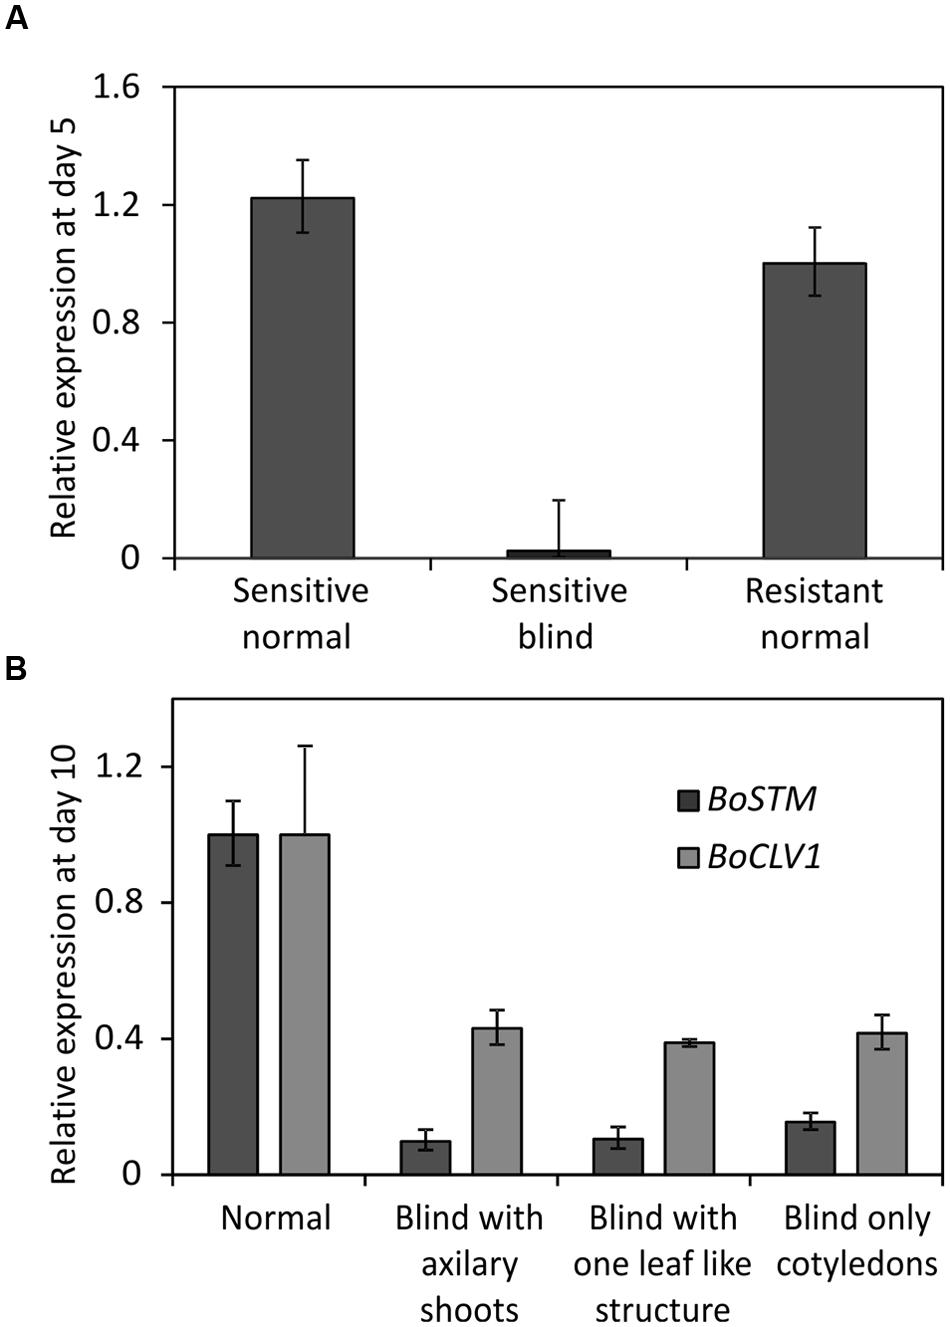
FIGURE 7. (A) Relative expression of BoSTM (orthologous to STM in Arabidopsis thaliana) at day 5 after finishing the cold treatment to induce blindness. Expression levels measured by Q-PCR using meristem enriched tissue from non-blind looking seedlings (Sensitive non-blind) and blind looking seedlings (Sensitive blind) from the sensitive genotype (line AG5010) and from non-blind seedlings (Resistant non-blind) from a resistant genotype (line AG1020). Error bars represent the standard error of four biological replicates. (B) Expression of BoSTM in seedlings of different phenotype at day 10 after the cold induction of seeds from line AG5010 (a sensitive genotype). ‘Normal’ represents the expression of plants with a meristem. ‘Blind with axillary shoots’ represents plants that lost their SAM but develop side shoots in the axils of the cotyledons. ‘Blind with leaf like structure’ represent the expression of plants that produced one leaf-like structure before arresting the meristem. ‘Blind only cotyledons,’ represents plants that only developed cotyledons and no side-shoots. Expression is provided in comparison to the resistant non-blind seedlings. Error bars represent the standard error of four biological replicates.
To get a further indication of genome-wide differentially expressed genes that might be related to meristem development and hence, the occurrence of blindness, we made use of a published Arabidopsis gene expression dataset for the various SAM regions (Yadav et al., 2009). In this study, genes were identified that are expressed in cells specifically marked by CLAVATA3 (CLV3) and WUSCHEL (WUS) expression, which represent meristematic cells, and cells marked by FILAMENTOUS FLOWER (FIL), representing differentiating cells at the flanks of the SAM. Potential functional homologs of these genes were identified in our RNA-seq dataset and their behavior was analyzed. As can be seen in Supplementary Table S7 cold affected a higher number of genes potentially expressed in the central zone of the SAM (meristematic class genes) of a blindness-sensitive line than of a resistant line, 2 days after the treatment. As expected, this concerns more down-regulation then up-regulation in comparison to the resistant plants. A similar trend can be seen at day 7, a correlation between what is happening at the morphological and the molecular level (gene expression) during the development of blindness.
In total, 90 and 160 of the genes within the C03 QTL were differentially expressed at days 2 and 7, respectively. Most homologs of the genes present in the top 20 most significantly differentially expressed genes in the CO3 QTL region (Tables 3 and 4) are expressed in the Arabidopsis vegetative meristem and/or in the seed (during imbibition) according to previously published micro-array data (Winter et al., 2007). Only for one gene, gBol042544, no Arabidopsis homolog could be identified. Homologs of genes coding for the Minichromosome maintenance family proteins 4 and 5 (MCM4, MCM5), Minichromosome maintenance family protein PROLIFERA (PRL), A. THALIANA MutS HOMOLOG 2 and 6 (MSH2, MSH6) and a HOMOLOG OF NUCLEOLAR PROTEIN 56 (NOP56) are differentially expressed when comparing samples from sensitive blind and sensitive non-blind seedlings at both time points.
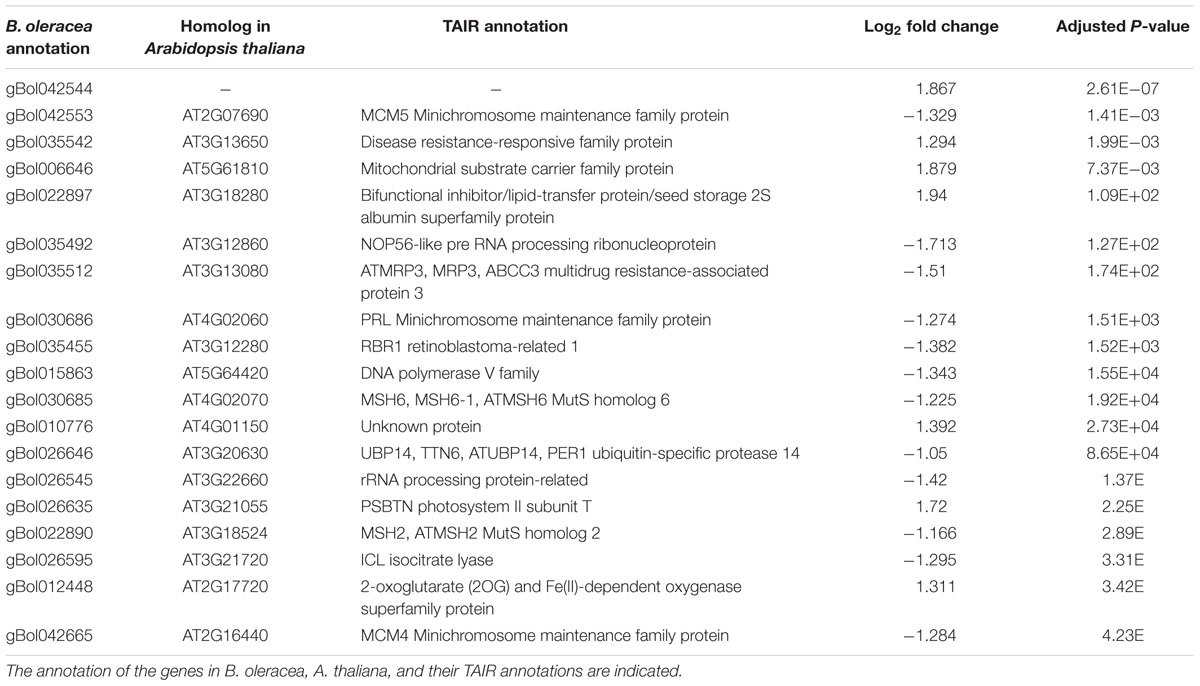
TABLE 3. Top 20 genes located in the QTL region with the most significant difference between the induced sensitive sample relative to the un-induced sensitive sample 2 days after the cold induction.
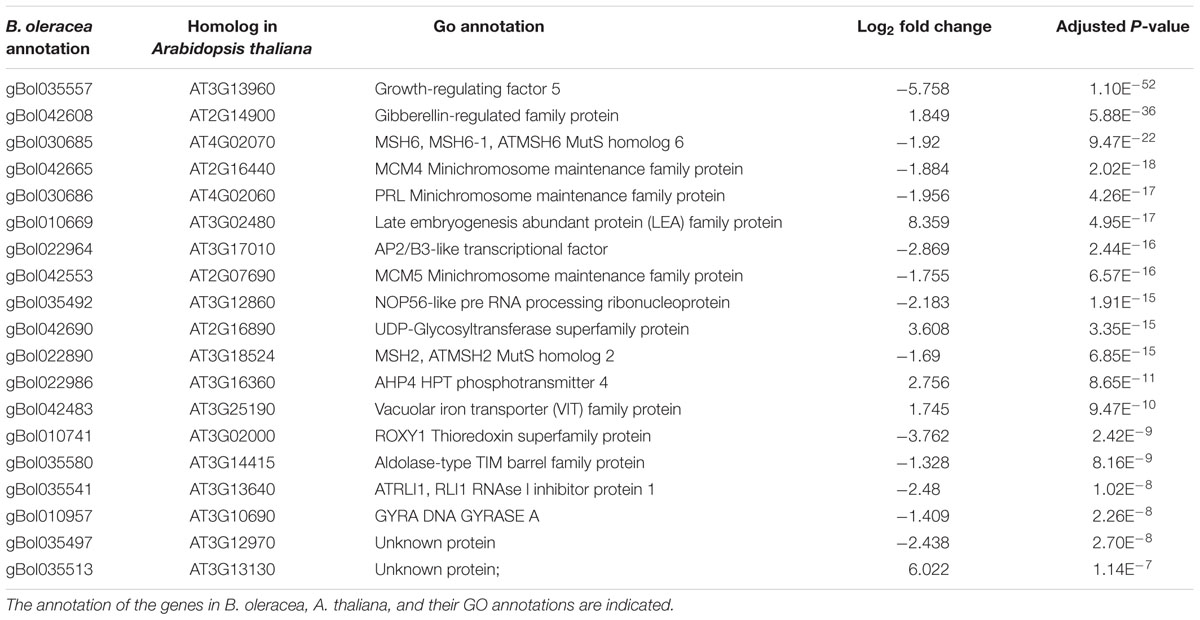
TABLE 4. Top 20 genes located in the QTL region with the most significant difference between the induced sensitive sample relative to the un-induced sensitive sample seven after the cold induction.
In Blind B. oleracea Plants the Cell Cycle and DNA Replication is Disturbed
Since we identified GO-terms related to cell proliferation as being over-represented both at days 2 and 7 after cold treatment in seedlings from a blindness-sensitive line (AG5010; Supplementary Tables S5 and S6), we further focused on cell cycle related genes in the genome-wide transcriptome data set. For cell division or mitosis, DNA needs to be duplicated in the S-Phase of the cell cycle. Cyclins represent key genes in this process (Inzé and De Veylder, 2006) and surprisingly, a number of them were up-regulated 2 days after the cold induction in the sensitive genotype compared to the resistant one (Figure 8). However, the same set of genes showed down-regulation in the sensitive line 7 days after cold induction, except for three P-Type cyclins, which remained their higher expression levels also at day 7 (Figure 8).
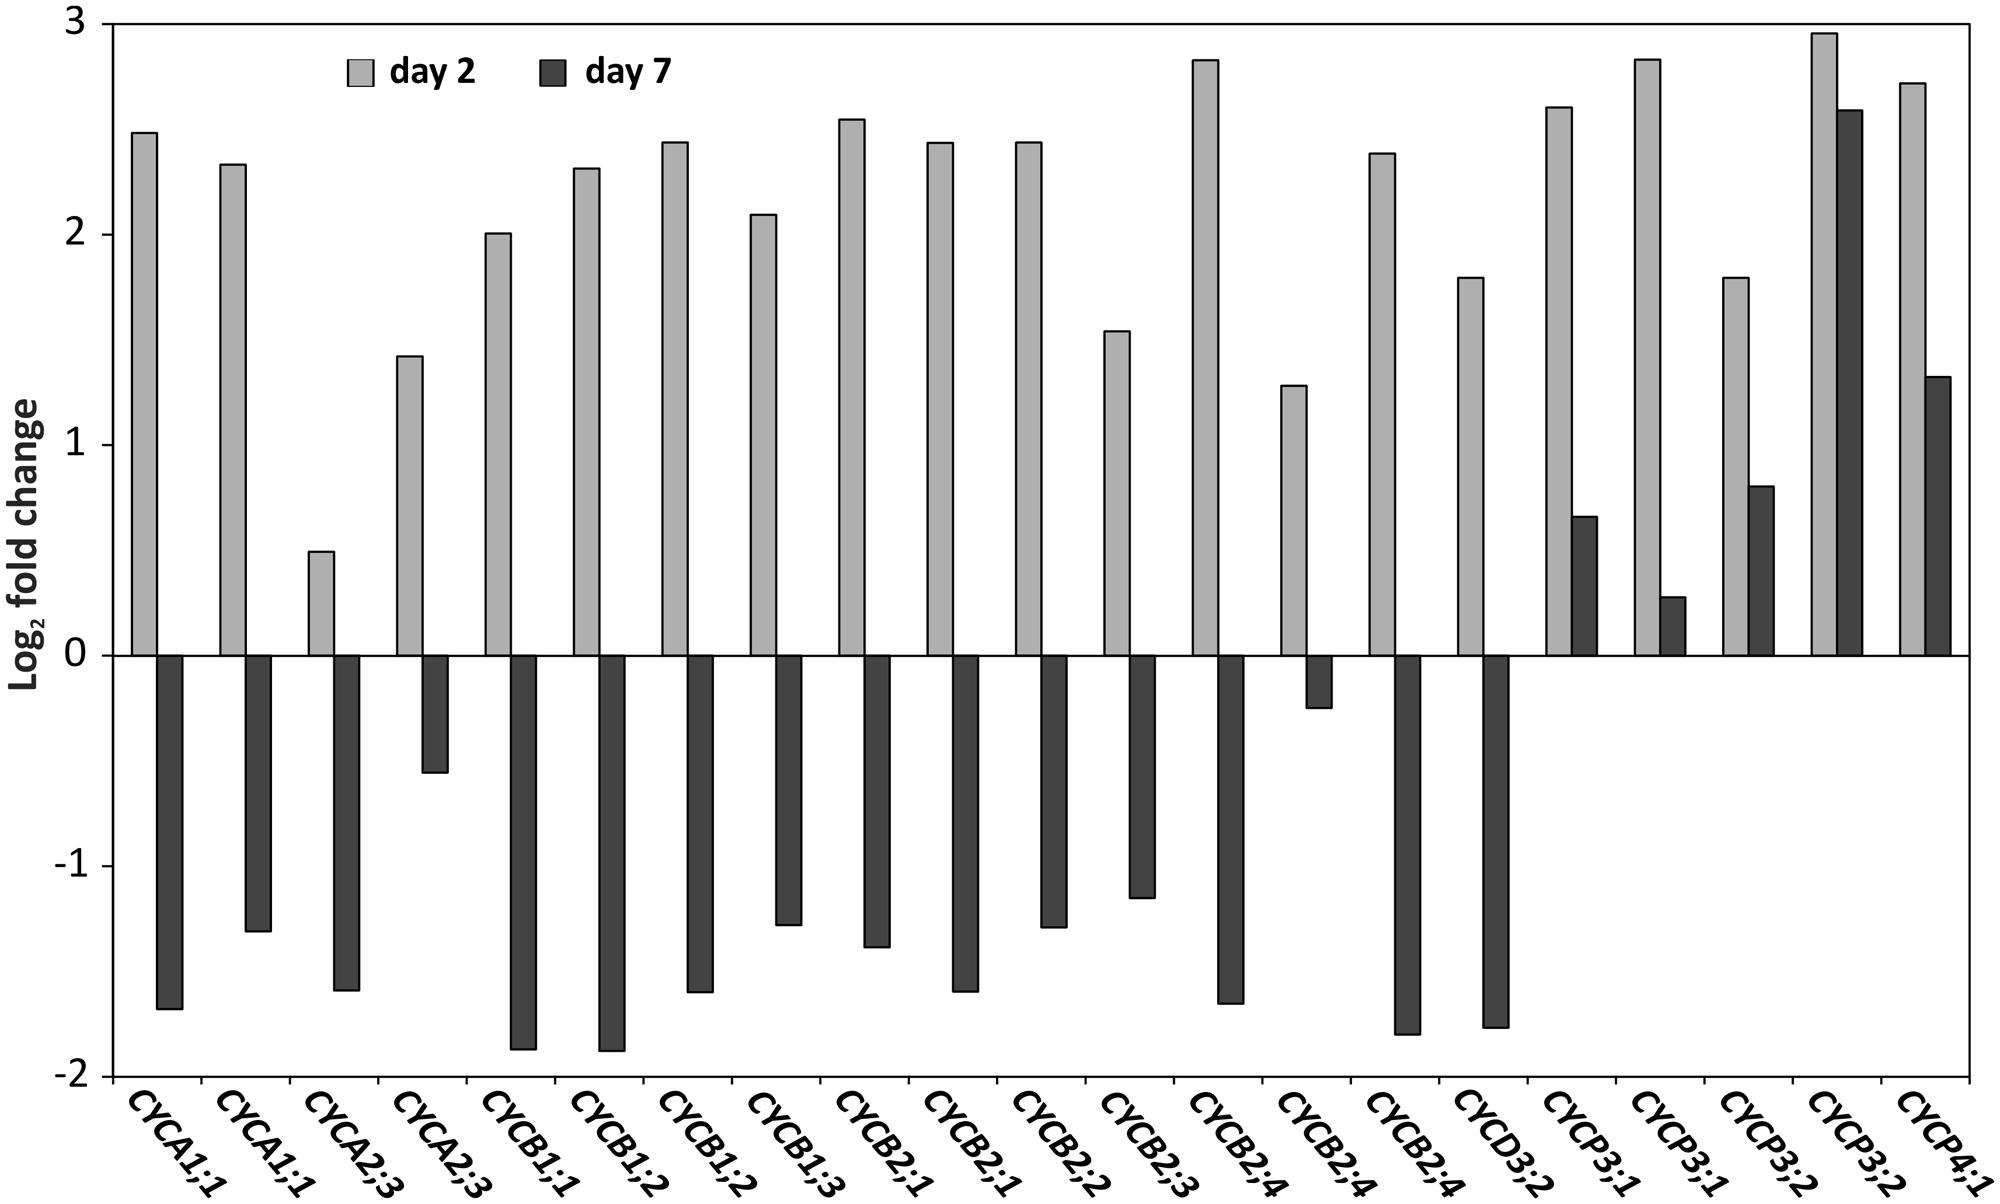
FIGURE 8. Cyclins are inversely differentially expressed at days 2 and 7. Log2 expression fold change of cyclin genes: CYCA1;1 (gBol021328, gBol043233/AT1G44110.1),CYCA2;3 (gBol038155, gBol009873/AT1G15570.1),CYCB1;1 (gBol028907/AT4G37490.1),CYCB1;2 (gBol024500,gBol015440/AT5G06150.1),CYCB1;3 (gBol023203/AT3G11520.1),CYCB2;1 (gBol012439, gBol007505/AT2G17620.1),CYCB2;2 (gBol018699/AT4G35620.1) CYCB2;3 (gBol006997/AT1G20610.1), CYCB2;3 (gBol006997/AT1G20610.1), CYCB2;4 (gBol039865, gBol015175, gBol027646/AT1G76310.1), CYCD3;2 (gBol027246/AT5G67260.1), CYCP3;1 (gBol029526,gBol030150/AT2G45080.1), CYCP3;2 (gBol045616,gBol001087/AT3G60550.1) and CYCP4;1 (gBol029520/AT2G44740.1). Day 2 (gray) is the comparison between the samples of the induced sensitive (AG5010) compared to the induced resistant seedlings (AG1020). Day 7 (black) is the comparison between samples of the induced sensitive (AG5010) blind and induced sensitive non-blindnormal (AG5010) seedlings.
To analyze the cell division activity in situ we placed seeds from the resistant line AG1020 and the sensitive line AG5010 after the cold induction, on growth medium containing EdU, a chemical that is incorporated in DNA during replication. Two days after the cold induction EdU incorporation was visible as green fluorescence in nuclei from the resistant line (Figures 9A,B) and in all visible tissues: the SAM, hypocotyl and cotyledons. In the seedling from the sensitive line, DNA replication was observed in the hypocotyl and cotyledon tissues, but the nuclei in the SAM area did not incorporate EdU, demonstrating that blindness is related to an absence of DNA replication (Figures 9C,D). DNA replication was also abolished in the leaf primordium of the sensitive line compared to the resistant one (compare Figures 9C,B).
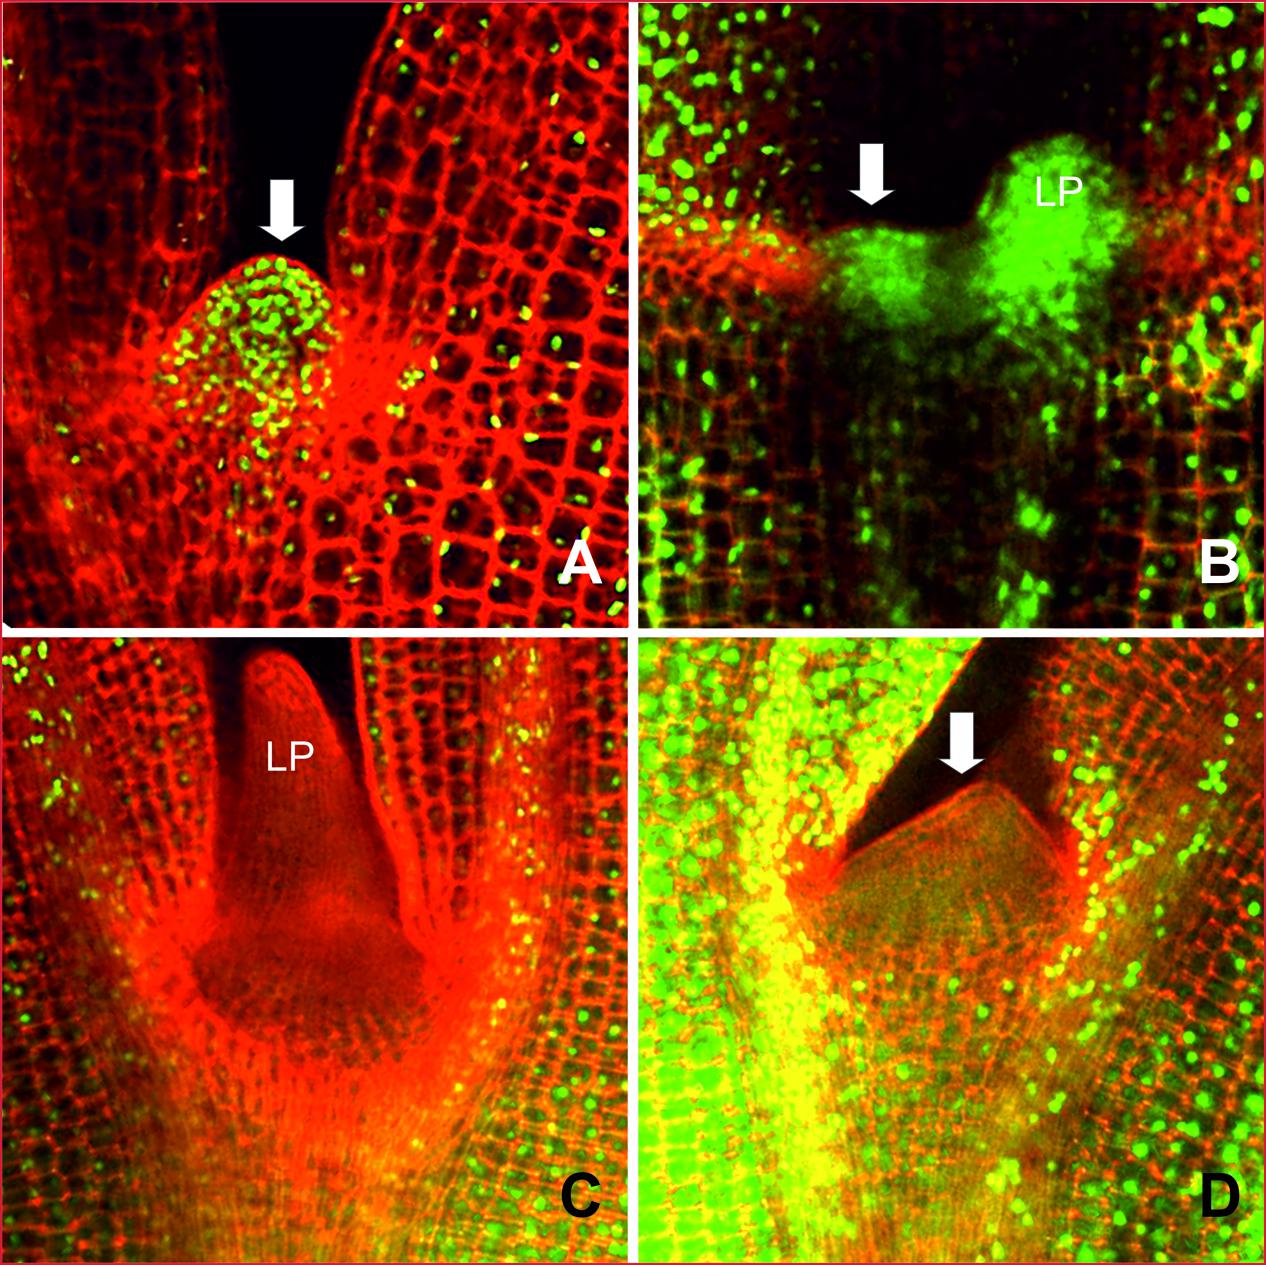
FIGURE 9. DNA replication activity in the meristematic region of B. oleracea seedlings from line AG5010 and AG1020 2 days after the cold treatment. The plant material was stained with EdU to visualize nuclei with DNA replication activity, indicated by green fluorescence. (A) and (B) Represent seedlings from the blindness induction treatment resistant line (AG1020). (C) and (D) Representative seedlings from the blindness induction sensitive line (AG5010) that develops SAM arrest after the cold induction. LP, Leaf primordium; LS, Leaf-like structure, arrows point at the apical dome, missing in (C).
In contrast to the set of cyclin genes (Figure 8), which are not located in the C03 QTL region and are most likely indirectly affected by the blindness phenomenon, a number of other cell cycle related genes are located in the QTL region. RETINOBLASTOMA RELATED (RBR) gBol035455, a plant homolog of the tumor suppressor gene identified in animals (Friend et al., 1986), is lower expressed at both analyzed time points in the sensitive background in comparison to the resistant one and is located in the C03 QTL region (Supplementary Table S3 and S4).
Other genes present in the C03 QTL region (Tables 3 and 4) and related to the cell cycle are members of the Mini Chromosome Maintenance (MCM) 2-3-5 gene family. Genes of this family play important roles in both the initiation and the elongation phase of eukaryotic DNA replication (Tye, 1994). Furthermore, BoMSH2 and BoMSH6 are also located in the CO3 QTL region and significantly differentially expressed. Interestingly, an interaction between the MSH genes and cell cycle control has been suggested (Lario et al., 2011).
Discussion
Cold Imbibition Leads to Stem Cell Differentiation
Under field conditions the frequency of blind plants varies and can be induced at different stages of plant development. Blindness has been reported to occur after plants have developed several leaves (Wiebosch et al., 1950; Forsyth et al., 1999). We focused in this study on the early occurrence of blindness during germination and seedling establishment. We found that low temperature stress is a major trigger for SAM arrest in sensitive B. oleracea seedlings, since a high frequency of blind plants could be induced by about 10 days of incubation of fully imbibed seeds at 0–1°C. Also Forsyth et al. (1999) found in their study that a period of cold and low light intensities followed by a warmer period with higher light intensities can lead to blindness in broccoli. In contrast to their method, our induction system is faster and induces blindness in young seedlings compared to 8 weeks old plants in the broccoli protocol. Additionally, our induction system proved to be applicable for seed lots from several B. oleracea crop types, while the previously published protocol was tested with one broccoli cultivar only.
As is also observed in practice, not all seeds from a particular genotype or seed lot exposed to the inducing conditions developed blindness. Furthermore, the degree of meristematic arrest varies between seedlings. The reason for this variation in blindness within a seed lot could lie in differences between seeds for the perception or processing of the signal in the meristem. Alternatively, the cold treatment might gradually damage the meristematic cells in the SAM in an accumulating manner. An indication for this latter hypothesis is that a longer cold incubation reduces the germination capacity of the seeds and increases the frequency of blindness.
The histological analysis showed that the SAM region of blind seedlings comprised more differentiated cells than meristematic cells when compared to a non-blind seedling and the normal tunica-corpus structure of the SAM (Steeves and Sussex, 1989; Meyerowitz, 1997) is missing in the arrested seedlings. A similar observation has been made in sections from much older blind broccoli shoots that also lack small sized meristematic cells (Forsyth et al., 1999).
The development of blind plants is associated with lack or reduction in DNA replication in the SAM area and loss of its meristematic activity. Genetic variation for sensitivity to SAM arrest was demonstrated and a QTL was identified in a segregating population. We also showed that seed production conditions influenced the sensitivity of the seed lots. Based on a genome-wide expression analysis, we found a number of potential candidate genes in the QTL region with significantly altered expression levels.
A Genetic Factor Affects Blindness Sensitivity
The QTL analysis in a B. oleracea DH population from a cross between broccoli and Chinese kale showed that blindness has a genetic component and that the genetic variation for blindness sensitivity can be partly explained by alleles located on linkage group C03. This finding opens possibilities to breed for blindness insensitive genotypes. Subsequently, we started to unravel the molecular mechanism underlying the development of blindness by combining the information of the QTL region on C03 and genome-wide differential expression analysis. Our molecular analyses revealed that in blind B. oleracea seedlings – which resemble the phenotype of stm knock-out mutants in Arabidopsis (Long et al., 1996) – expression of the B. oleracea STM homolog BoSTM was down regulated. This observation suggests that the cells of the SAM in the arrested seedlings are differentiating and gradually losing their meristematic capacity. Additionally, BoSTM was also lower expressed in blind seedlings that developed only one leaf or in blind seedlings forming side-shoots, showing that the molecular network of stem cell maintenance is affected in the various blind phenotypes. The axillary shoots observed in some blind plants developed further and remained indeterminate, taking over the function of the SAM. These axillary ‘escape’ shoots are also observed in Arabidopsis wus mutants (Laux et al., 1996) and this phenotype suggests that the molecular mechanism underlying the cold treatment is specific for the cells in the SAM, while the axillary buds are released from growth repression after loss of the SAM. This is in line with the fact that axillary bud outgrowth is inhibited by the presence of the main shoot (‘apical dominance’) and that in the absence of the SAM, lateral meristem outgrowth is triggered (Cline, 1994).
In our genome-wide transcriptome analysis cell cycle genes were up-regulated 2 days after the cold induction in sensitive genotypes compared to the resistant genotypes. However, at day 7 after the cold induction the same genes showed strongly reduced expression levels in the sensitive genotype compared to the resistant one. This strong reduction in expression at the later time point indicates that the cell cycle is arrested in the sensitive seedlings and no new cells are formed in the SAM region. The arrest of the cell cycle was also confirmed by EdU staining that marks nuclei in the S-Phase, when the dye is incorporated in DNA during DNA replication (Schiessl et al., 2012). Specifically, the nuclei in the SAM showed lower staining in the sensitive genotypes compared to the resistant ones 2 days after cold treatment. Based on this result we can conclude that the up-regulation of cyclin genes at day 2 in the sensitive genotype does not lead to increased DNA synthesis and cell division activity, on the contrary, the meristematic cells do not enter the S-Phase in the blind seedlings. During normal cell-cycle progression different types of cyclins show maximum expression at specific time-points of the phases of the cell cycle (G0/G1-S-G2-M; Bloom and Cross, 2007). While CYCD3 peaks at the G2/M phase, e.g., CYCA3 reaches its highest expression levels at the S-phase of the cell-cycle. Therefore, the massive up-regulation at day 2 of different types of cyclins in the sensitive genotype could be related to the blind phenotype. It is possible that the tightly controlled expression of the cell cycle genes in normal dividing cells is lost and as a result many CYC genes are miss-expressed in the sensitive genotype. Whether the expression changes of the above discussed cell-cycle-related genes are a secondary effect or the primary cause of the blindness phenotype is difficult to determine. It is more likely that that they are indirectly affected in the blind seedlings, because CYC genes are absent in the list of differentially expressed genes located in the QTL region.
Another major regulator of the cell cycle is RBR, which shows lower expression levels in the sensitive genotype at days 2 and 7 after the cold induction and more interestingly, the gene is located in the QTL region. It has been shown that decreased RBR expression causes arrest of plant development and acts especially on stem cell maintenance in the SAM (Borghi et al., 2010). A lack of RBR expression alters the meristem activity by disruption of the CLAVATA-WUSCHEL feedback loop. In a similar way the miss-expression of RBR in the sensitive genotypes, observed here, could lead to the arrest of the CLAVATA-WUSCHEL feedback loop, resulting in cell differentiation and cell-cycle arrest reminiscent with the phenotype of the wus mutants.
Desiccation tolerant seeds enter a quiescent stage at the end of seed-maturation. After water uptake the embryo has to re-establish its active state and commences cell division and growth. These processes are well organized in time, for instance, DNA repair precedes DNA replication (van Pijlen et al., 1996) to repair eventual damage caused by desiccation or rehydration. DNA damage keeps the cyclin-dependent kinase (CDKA)-cyclin (CYCD) complex in a phosphorylated and therefore inactive state; in that state it fails to phosphorylate RBR and the cell is prohibited in entering the S-Phase of the cell cycle (Nasmyth, 1995; Novak et al., 1998). Un-phosphorylated RBR is bound by E2F transcription factors, which in its turn cannot activate the MSH genes involved in DNA mismatch repair (Nakagami et al., 1999, 2002; Uemukai et al., 2005; Yadav et al., 2009). Several MSH genes show differential expression at both time points and are located in the QTL region. Other interesting candidate genes that are differentially expressed and present in the QTL region are members of the MCM gene family. The proteins encoded by these genes, first discovered in yeast, but present in all eukaryotic genomes, form a helicase complex that has a role in both the initiation and the elongation phases of eukaryotic DNA replication (Tye, 1994). Consistent with a role in DNA replication, PROLIFERA (PRL) a member of the MCM genes from Arabidopsis (Springer et al., 2000) is preferentially expressed in young tissues that contain a high number of replicating cells, like embryos, young organs and meristems. A knock-out mutant of the PRL gene is embryo-lethal demonstrating its essential role in cell division and tissue growth. A gene encoding for PRL Minichromosome maintenance family protein is located on the QTL and differentially expressed in blind and non-blind seedlings. It is conceivable to hypothesize that the down-regulation of the MCM and RBR homologs in sensitive B. oleracea plants underlies the arrest of cell division and hence loss of meristematic activity in the SAM.
Conclusion
Our study revealed that blindness in B. oleracea seedlings is related to arrest of cells in the SAM or part of them. An important trigger for the induction of blindness in sensitive seed lots turned out to be low temperatures during germination. We observed that seed production conditions can influence the sensitivity of seed lots. The sensitivity to the occurrence of blind seedlings has also a genetic basis and we discovered a QTL on linkage group C03. Through a genome-wide transcriptome analysis we narrowed the amount of possible candidate genes to 90 and found that especially genes involved in the cell cycle were miss-regulated. Therefore, we think that two genes belonging to the MCM gene family, a RBR gene, a key and several MutS homologs (MSH), all located in QTL region, are the most likely candidates for being involved in the development of blindness in sensitive genotypes.
Author Contributions
JJ, JK, RI, and SG contributed to the design of the research; performance of the research; data analysis, collection, or interpretation; and writing the manuscript. ES contributed to the bioinformatics analysis. GB and GA contributed to the design of the experiments, data interpretation and writing the manuscript. All authors have read and approved the manuscript.
Funding
The project was funded by the Technological Top Institute-Green Genetics (project 2CFD 021 RP), The Netherlands Ministry of Economic Affairs (KB04-004-071) and the Dutch seed companies Bejo Seeds, ENZA Seeds, Incotec, Nickerson-Zwaan, Nunhems, Monsanto Holland, Syngenta Seeds, Rijk Zwaan and the association of Dutch plant raisers organized in Plantum NL.
Conflict of Interest Statement
The authors declare that the research was conducted in the absence of any commercial or financial relationships that could be construed as a potential conflict of interest.
The authors declare that the research was 50% financed by the Dutch government and a cash (25%) and in-kind (25%) contribution by a consortium of companies (Bejo Seeds, ENZA Seeds, Incotec, Nickerson-Zwaan, Nunhems, Monsanto Holland, Syngenta Seeds, Rijk Zwaan and the association of Dutch plant raisers organized in Plantum NL).
Acknowledgments
We thank Adriaan van Aelst from the Wageningen Electron Microscopy Centre for making the scanning electron microscopy pictures, Theo Born from Wageningen University, Plant Breeding, for help with linking the scaffolds to the B. oleracea genome, Hans Jansen for his help with the QTL analysis, Prof. Dr. Robert Sablowski from the John Innes Centre in Norwich, UK, for sharing the EdU protocol and the seed companies Bejo Seeds, ENZA Seeds, Incotec, Nickerson-Zwaan, Nunhems, Monsanto Holland, Syngenta Seeds, Rijk Zwaan for their practical support with seed production, facilities and sharing their knowledge. Furthermore, we acknowledge the sponsors of the project.
Supplementary Material
The Supplementary Material for this article can be found online at: http://journal.frontiersin.org/article/10.3389/fpls.2016.00800
Footnotes
- ^ http://hgwdev.cse.ucsc.edu/~kent/exe/linux/
- ^ http://www.ocri-genomics.org/bolbase/
- ^ http://www.arabidopsis.org
References
Agarwala, S. C. (1952). Relation of nitrogen supply to the molybdenum requirement of cauliflower grown in sand culture. Nature 169, 1099–1099. doi: 10.1038/1691099a0
Altschul, S. F., Gish, W., Miller, W., Myers, E. W., and Lipman, D. J. (1990). Basic local alignment search tool. J. Mol. Biol. 215, 403–410. doi: 10.1016/s0022-2836(05)80360-2
Anders, S., Pyl, P. T., and Huber, W. (2014). HTSeq–a python framework to work with high-throughput sequencing data. Bioinformatics 31, 166–169. doi: 10.1093/bioinformatics/btu638
Barton, M. K., and Poethig, R. S. (1993). Formation of the shoot apical meristem in Arabidopsis thaliana: an analysis of development in the wild type and in the shoot meristemless mutant. Development 119, 823–831.
Bloom, J., and Cross, F. R. (2007). Multiple levels of cyclin specificity in cell-cycle control. Nat. Rev. Mol. Cell Biol. 8, 149–160. doi: 10.1038/nrm2105
Bohuon, E. J. R., Keith, D. J., Parkin, I. A. P., Sharpe, A. G., and Lydiate, D. J. (1996). Alignment of the conserved C genomes of Brassica oleracea and Brassica napus. Theor. Appl. Genet. 93, 833–839. doi: 10.1007/bf00224083
Borghi, L., Gutzat, R., Fütterer, J., Laizet, Y., Hennig, L., and Gruissem, W. (2010). Arabidopsis RETINOBLASTOMA-RELATED is required for stem cell maintenance, cell differentiation, and lateral organ production. Plant Cell 22, 1792–1811. doi: 10.1105/tpc.110.074591
Broadley, M. R., Hammond, J. P., King, G. J., Astley, D., Bowen, H. C., Meacham, M. C., et al. (2008). Shoot calcium and magnesium concentrations differ between subtaxa, are highly heritable, and associate with potentially pleiotropic loci in Brassica oleracea. Plant Physiol. 146, 1707–1720. doi: 10.1104/pp.107.114645
Cline, M. G. (1994). The role of hormones in apical dominance. New approaches to an old problem in plant development. Physiol. Plant. 90, 230–237.
Davis, S. J. (2009). Integrating hormones into the floral-transition pathway of Arabidopsis thaliana. Plant Cell Environ. 32, 1201–1210. doi: 10.1111/j.1365-3040.2009.01968.x
Forsyth, J. L., Pearson, S., Hadley, P., and Barnett, J. R. (1999). Apical abortion in calabrese is induced by periods of low temperature and results in premature differentiation of apical meristem cells. J. Exp. Bot. 50, 861–868. doi: 10.1093/jxb/50.335.861
Friend, S. H., Bernards, R., Rogelj, S., Weinberg, R. A., Rapaport, J. M., Albert, D. M., et al. (1986). A human DNA segment with properties of the gene that predisposes to retinoblastoma and osteosarcoma. Nature 323, 643–646. doi: 10.1038/323643a0
Hicklenton, P. R., Newman, S. M., and Davies, L. J. (1993). Growth and flowering of Gypsophila paniculata L. ‘Bristol Fairy’ and ‘Bridal Veil’ in relation to temperature and photosynthetic photon flux. Sci. Hortic. 53, 319–331. doi: 10.1016/0304-4238(93)90052-R
Inzé, D., and De Veylder, L. (2006). Cell cycle regulation in plant development 1. Annu. Rev. Genet. 40, 77–105. doi: 10.1146/annurev.genet.40.110405.090431
Janská, A., Maršík, P., Zelenková, S., and Ovesná, J. (2010). Cold stress and acclimation - what is important for metabolic adjustment? Plant Biol. 12, 395–405. doi: 10.1111/j.1438-8677.2009.00299.x
Jürgens, G. (1995). Axis formation in plant embryogenesis: cues and clues. Cell 81, 467–470. doi: 10.1016/0092-8674(95)90065-9
Kim, D., Pertea, G., Trapnell, C., Pimentel, H., Kelley, R., and Salzberg, S. L. (2013). TopHat2: accurate alignment of transcriptomes in the presence of insertions, deletions and gene fusions. Genome Biol. 14:R36. doi: 10.1186/gb-2013-14-4-r36
Koornneef, M., Hanhart, C. J., and van der Veen, J. H. (1991). A genetic and physiological analysis of late flowering mutants in Arabidopsis thaliana. Mol. Gen. Genet. 229, 57–66. doi: 10.1007/BF00264213
Lario, L. D., Ramirez-Parra, E., Gutierrez, C., Casati, P., and Spampinato, C. P. (2011). Regulation of plant MSH2 and MSH6 genes in the UV-B-induced DNA damage response. J. Exp. Bot. 62, 2925–2937. doi: 10.1093/jxb/err001
Laux, T., Mayer, K. F. X., Berger, J., and Jürgens, G. (1996). The WUSCHEL gene is required for shoot and floral meristem integrity in Arabidopsis. Development 122, 87–96.
Lenhard, M., Jürgens, G., and Laux, T. (2002). The WUSCHEL and SHOOTMERISTEMLESS genes fulfil complementary roles in Arabidopsis shoot meristem regulation. Development 129, 3195–3206.
Li, J., and Ji, L. (2005). Adjusting multiple testing in multilocus analyses using the eigenvalues of a correlation matrix. Heredity (Edinb) 95, 221–227. doi: 10.1038/sj.hdy.6800717
Livak, K. J., and Schmittgen, T. D. (2001). Analysis of relative gene expression data using real-time quantitative PCR and the 2-ΔΔCT method. Methods 25, 402–408. doi: 10.1006/meth.2001.1262
Long, J. A., Moan, E. I., Medford, J. I., and Barton, M. K. (1996). A member of the KNOTTED class of homeodomain proteins encoded by the STM gene of Arabidopsis. Nature 379, 66–69. doi: 10.1038/379066a0
Love, M. I., Huber, W., and Anders, S. (2014). Moderated estimation of fold change and dispersion for RNA-Seq data with DESeq2. Genome Biol. 15:550.
Maere, S., Heymans, K., and Kuiper, M. (2005). BiNGO: a Cytoscape plugin to assess overrepresentation of gene ontology categories in biological networks. Bioinformatics 21, 3448–3449. doi: 10.1093/bioinformatics/bti551
Meyerowitz, E. M. (1997). Genetic control of cell division patterns in developing plants. Cell 88, 299–308. doi: 10.1016/S0092-8674(00)81868-1
Mounsey-Wood, B. (1957). Some factors affecting blindness in early summer cauliflower. J. Hortic. Sci. 32, 65–73. doi: 10.1080/00221589.1957.11513889
Nakagami, H., Kawamura, K., Sugisaka, K., Sekine, M., and Shinmyo, A. (2002). Phosphorylation of retinoblastoma-related protein by the cyclin D/cyclin-dependent kinase complex is activated at the G1/S-phase transition in tobacco. Plant Cell 14, 1847–1857. doi: 10.1105/tpc.002550
Nakagami, H., Sekine, M., Murakami, H., and Shinmyo, A. (1999). Tobacco retinoblastoma-related protein phosphorylated by a distinct cyclin-dependent kinase complex with Cdc2/cyclin D in vitro. Plant J. 18, 243–252. doi: 10.1046/j.1365-313X.1999.00449.x
Nasmyth, K. (1995). Evolution of the cell cycle. Philos. Trans. R. Soc. Lond. B Biol. Sci. 349, 271–281. doi: 10.1098/rstb.1995.0113
Novak, B., Csikasz-Nagy, A., Gyorffy, B., Nasmyth, K., and Tyson, J. J. (1998). Model scenarios for evolution of the eukaryotic cell cycle. Philos. Trans. R. Soc. B Biol. Sci. 353, 2063–2076. doi: 10.1098/rstb.1998.0352
Payne, R., Murray, D., Harding, S., Baird, D., and Soutar, D. (2014). Introduction to GenStat®for WindowsTM, 17th Edn. Hemel Hempstead: VSN International.
Rupp, H. M., Frank, M., Werner, T., Strnad, M., and Schmülling, T. (1999). Increased steady state mRNA levels of the STM and KNAT1 homeobox genes in cytokinin overproducing Arabidopsis thaliana indicate a role for cytokinins in the shoot apical meristem. Plant J. 18, 557–563. doi: 10.1046/j.1365-313X.1999.00472.x
Salter, P. J. (1957). Blindness in early summer cauliflower [20]. Nature 180:1056. doi: 10.1038/1801056a0
Schiessl, K., Kausika, S., Southam, P., Bush, M., and Sablowski, R. (2012). JAGGED controls growth anisotropy and coordination between cell size and cell cycle during plant organogenesis. Curr. Biol. 22, 1739–1746. doi: 10.1016/j.cub.2012.07.020
Schmittgen, T. D., and Livak, K. J. (2008). Analyzing real-time PCR data by the comparative CT method. Nature Protoc. 3, 1101–1108. doi: 10.1038/nprot.2008.73
Schoof, H., Lenhard, M., Haecker, A., Mayer, K. F. X., Jürgens, G., and Laux, T. (2000). The stem cell population of Arabidopsis shoot meristems is maintained by a regulatory loop between the CLAVATA and WUSCHEL genes. Cell 100, 635–644. doi: 10.1016/S0092-8674(00)80700-X
Scofield, S., Dewitte, W., and Murray, J. A. H. (2007). The KNOX gene SHOOT MERISTEMLESS is required for the development of reproductive meristematic tissues in Arabidopsis. Plant J. 50, 767–781. doi: 10.1111/j.1365-313X.2007.03095.x
Sebastian, R. L., Howell, E. C., King, G. J., Marshall, D. F., and Kearsey, M. J. (2000). An integrated AFLP and RFLP Brassica oleracea linkage map from two morphologically distinct doubled-haploid mapping populations. Theor. Appl. Genet. 100, 75–81. doi: 10.1007/s001220050011
Springer, P. S., Holding, D. R., Groover, A., Yordan, C., and Martienssen, R. A. (2000). The essential Mcm7 protein PROLIFERA is localized to the nucleus of dividing cells during the G(1) phase and is required maternally for early Arabidopsis development. Development 127, 1815–1822.
Steeves, T. A., and Sussex, I. M. (1989). Patterns in Plant Development. Cambridge: Cambridge University Press.
Thompson, J. D., Higgins, D. G., and Gibson, T. J. (1994). CLUSTAL W: improving the sensitivity of progressive multiple sequence alignment through sequence weighting, position-specific gap penalties and weight matrix choice. Nucleic Acids Res. 22, 4673–4680. doi: 10.1093/nar/22.22.4673
Tye, B. K. (1994). The MCM2-3-5 proteins: are they replication licensing factors? Trends Cell Biol. 4, 160–166. doi: 10.1016/0962-8924(94)90200-3
Uemukai, K., Iwakawa, H., Kosugi, S., de Uemukai, S., Kato, K., Kondorosi, E., et al. (2005). Transcriptional activation of tobacco E2F is repressed by co-transfection with the retinoblastoma-related protein: cyclin D expression overcomes this repressor activity. Plant Mol. Biol. 57, 83–100. doi: 10.1007/s11103-004-6601-x
van Pijlen, J. G., Groot, S. P. C., Kraak, H. L., Bergervoet, J. H. W., and Bino, R. J. (1996). Effects of pre-storage hydration treatments on germination performance, moisture content, DNA synthesis and controlled deterioration tolerance of tomato (Lycopersicon esculentum Mill.) seeds. Seed Sci. Res. 6, 57–64.
van Zanten, M., Koini, M. A., Geyer, R., Liu, Y., Brambilla, V., Bartels, D., et al. (2011). Seed maturation in Arabidopsis thaliana is characterized by nuclear size reduction and increased chromatin condensation. Proc. Natl. Acad. Sci. U.S.A. 108, 20219–20224. doi: 10.1073/pnas.1117726108
Wetzstein, H. Y., and Vavrina, C. S. (2002). Morphological evaluation of apical meristem decline in greenhouse-grown tomato transplants and the effect of mineral nutrition on its occurrence. J. Am. Soc. Hortic. Sci. 127, 635–638.
Wiebosch, W. A., van Koot, I., and van’t Sant, L. E. (1950). Hartloosheid en klemhart bij bloemkool. Verslagen van landbouwkundige onderzoekingen 56, 1–53.
Williams, L., and Fletcher, J. C. (2005). Stem cell regulation in the Arabidopsis shoot apical meristem. Curr. Opin. Plant Biol. 8, 582–586. doi: 10.1016/j.pbi.2005.09.010
Winter, D., Vinegar, B., Nahal, H., Ammar, R., Wilson, G. V., and Provart, N. J. (2007). An “Electronic Fluorescent Pictograph” browser for exploring and analyzing large-scale biological data sets. PLoS ONE 2:e718. doi: 10.1371/journal.pone.0000718
Wurr, D. C. E., Hambidge, A. J., and Smith, G. P. (1996). Studies of the cause of blindness in brassicas. J. Hortic. Sci. Biotechnol. 71, 415–426. doi: 10.1080/14620316.1996.11515422
Yadav, R. K., Girke, T., Pasala, S., Xie, M., and Reddy, G. V. (2009). Gene expression map of the Arabidopsis shoot apical meristem stem cell niche. Proc. Natl. Acad. Sci. U.S.A. 106, 4941–4946. doi: 10.1073/pnas.0900843106
Keywords: blind plants, Brassica oleracea, cell cycle activity, germination, seedlings, shoot apical meristem, stem cells
Citation: de Jonge J, Kodde J, Severing EI, Bonnema G, Angenent GC, Immink RGH and Groot SPC (2016) Low Temperature Affects Stem Cell Maintenance in Brassica oleracea Seedlings. Front. Plant Sci. 7:800. doi: 10.3389/fpls.2016.00800
Received: 19 February 2016; Accepted: 22 May 2016;
Published: 08 June 2016.
Edited by:
Susana M. P. Carvalho, University of Porto, PortugalReviewed by:
Michael James Considine, University of Western Australia, AustraliaHao Peng, Washington State University, USA
Copyright © 2016 de Jonge, Kodde, Severing, Bonnema, Angenent, Immink and Groot. This is an open-access article distributed under the terms of the Creative Commons Attribution License (CC BY). The use, distribution or reproduction in other forums is permitted, provided the original author(s) or licensor are credited and that the original publication in this journal is cited, in accordance with accepted academic practice. No use, distribution or reproduction is permitted which does not comply with these terms.
*Correspondence: Steven P. C. Groot, steven.groot@wur.nl
†Present address: Jennifer de Jonge, Department of Plant Biology, Uppsala BioCenter, Swedish University of Agricultural Sciences, PO-Box 7080, SE-75007 Uppsala, Sweden; Edouard I. Severing, Max Planck Institute for Plant Breeding Research, Carl-von-Linné-Weg 10, 50829, Köln, Germany