 Malathi Surapaneni†
 Divya Balakrishnan†
 Sukumar Mesapogu
 Krishnam Raju Addanki
 Venkateswara Rao Yadavalli
 Tripura Venkata V. G. N.
 Sarla Neelamraju*
- ICAR-National Professor Project, Indian Institute of Rice Research, Hyderabad, India
Backcross inbred lines (BILs) derived from elite x wild crosses are very useful for basic studies and breeding. The aim of this study was to map quantitative trait loci (QTLs) associated with yield and related traits and to identify chromosomal segment substitution lines (CSSLs) from unselected BC2F8 BILs of Swarna/Oryza nivara IRGC81848. In all, 94 BILs were field evaluated in 2 years (wet seasons, 2014 and 2015) for nine traits; days to 50% flowering, days to maturity (DM), plant height (PH), number of tillers, number of productive tillers, panicle weight, yield per plant, bulk yield, and biomass. BILs were genotyped using 111 polymorphic simple sequence repeats distributed across the genome. Fifteen QTLs including 10 novel QTLs were identified using composite interval mapping, Inclusive composite interval mapping and multiple interval mapping (MIM). O. nivara alleles were trait-enhancing in 26% of QTLs. Only 3 of 15 QTLs were also reported previously in BC2F2 of the same cross. These three included the two major effect QTLs for DM and PH detected in both years with 13 and 20% phenotypic variance. Further, a set of 74 CSSLs was identified using CSSL Finder and 22 of these showed significantly higher values than Swarna for five yield traits. CSSLs, 220S for panicle weight and 10-2S with consistent high yield in both years are worthy of large scale field evaluation. The major QTLs and 22 significantly different CSSLs are a useful resource for rice improvement and dissecting yield related traits.
Introduction
Rice (Oryza sativa L.) is the most important cereal food crop cultivated worldwide. The rapid growth in the world’s population, which is expected to reach 9.1 billion by 2050 demands global rice production to be doubled (Ray et al., 2013). Over the years, intensive breeding to develop high yielding varieties quickly using few elite parents has resulted in loss of genetic variability in the cultivars. On the other hand, land races and wild species of rice are sources of abundant genetic variation that can be tapped to increase rice yield sustainably. The wild species of Oryza are an important source of genetic variability for tolerance to biotic and abiotic stresses and for improvement of yield as well (Brar and Khush, 1997; Brar and Singh, 2011; Singh K. et al., 2016).
Tanksley and Nelson (1996) proposed advanced backcross quantitative trait loci (AB-QTL) strategy to simultaneously identify and transfer valuable alleles from unadapted germplasm into the elite cultivars and it has been followed in several crops. The annual wild species, O. nivara adapted to seasonally dry habitats is the closest progenitor of O. sativa (Sharma and Shastry, 1965). It is also a potential source of favorable alleles for agriculturally important traits. One O. nivara accession IRGC101508 from Uttar Pradesh, India was identified as the only accession resistant to grassy stunt virus after screening 5000 accessions and 1000 breeding lines (Khush, 1977). O. nivara also contributed resistance to bacterial blight (Cheema et al., 2008) and blast (Eizenga et al., 2013). Li et al. (2006) mapped QTLs for domestication traits in F2 population derived from CL16/O. nivara IRGC80470. QTLs for seedling vigor, yield and quality traits were reported from an advanced backcross population derived from M-202/O. nivara IRGC100195 (Eizenga et al., 2015). More recently, a set of 131 ILs were developed from a cross between 93-11 and O. nivara W2014 and 65 QTLs were identified for 13 agronomic traits using whole genome resequencing (Ma et al., 2016).
At Indian Institute of Rice Research, two accessions of O. nivara IRGC81832 and IRGC81848 which were genetically distinct from 22 other accessions were extensively used for QTL mapping of yield in BC2F2 and quality traits in BC2F3 seed (Sarla et al., 2003). Kaladhar et al. (2008) identified 17 major effect QTLs for different yield traits in BC2F2 population derived from Swarna/O. nivara IRGC81832 including yldp8.1 with LOD score of 8.76 which increased yield by 5.8 g per plant and grain number by 426 grains per plant. Significant yield enhancing QTLs qyldp2.1, qyldp3.1, qyldp8.1, qyldp9.1, qyldp11.1 were reported from the other BC2F2 population derived from Swarna/O. nivara IRGC81848 (Swamy, 2009; Swamy et al., 2014). QTLs for stem diameter qSD7.2, qSD8.1, qSD9.1, rachis diameter qRD9.1 and number of secondary branches qNSB1.1 were identified as good targets for use in MAS (Swamy et al., 2011). QTLs qmp1.2, qkw3.1, qkw6.1, qklac12.1 for grain quality traits such as milling percentage, kernel width and kernel length after cooking were also identified in these two populations (Swamy et al., 2012). One IL IET21542 (RPBio4918-248) derived from Swarna/O. nivara IRGC81848 gave mean yield of 5.5 t/ha for three consecutive years across several locations and a maximum yield of 10.6 t/ha in Coimbatore in wet season 2011 (Annual Progress Report, 2012–2013). It was released as DRR Dhan 40 for three important rice growing states of India – West Bengal, Maharashtra and Tamil Nadu in 2013 (Sarla, 2014). This variety has two QTLs yld9.1 for yield and nfg9.1 for number of filled grains from O. nivara. Also, six ILs 212S, 215S, 221S, 224S, 228S, and 230S from the same cross were BPH resistant (Lakshmi et al., 2010) and 228S in particular was resistant to multiple pests when evaluated in 10 green house conditions and 46 field tests against 11 pests in multiple resistance screening trials (MRST) (Annual Progress Report, 2012–2013). Two ILs 166S and 75S were tolerant to drought and salinity (Rai et al., 2010). Selected ILs from these two populations were analyzed for G × E interaction and two stable ILs 166S and 14S were identified (Divya et al., 2016). The usefulness of O. nivara in improving varieties for yield and other traits is thus quite evident.
Chromosome segment substitution lines (CSSLs), which carry a single or few chromosome segments from the donor in the genetic background of the recurrent parent with the whole donor genome, are ideal for QTL mapping/cloning and also as a genetic resource for pyramiding target segments and breeding (Ali et al., 2010). Several CSSLs have been developed in rice and characterized for yield related traits (Ando et al., 2008; Ookawa et al., 2016). Most of the CSSLs used in these reports were derived from crosses within O. sativa. The other cultivated species of rice O. glaberrima can also be used to improve O. sativa (Sarla and Swamy, 2005). A set of 34 CSSLs were developed from O. glaberrima and 105 QTLs for 10 yield traits related to grain yield, plant stature and maturity were identified (Shim et al., 2010).
Chromosomal segment substitution lines have also been developed using wild rice species. CSSLs using O. rufipogon helped identify QTLs for yield and related traits (Qiao et al., 2016). A total of 40 CSSLs were developed from O. longistaminata in the background of Taichung 65 and evaluated for yield traits (Ramos et al., 2016). Twenty six CSSLs harboring O. nivara genomic segments in the genetic background of Koshihikari were developed and evaluated for agriculturally important traits (Furuta et al., 2016). A set of 131 ILs carrying, a total of 767 chromosomal segments from O. nivara (W2014) in the genetic background of 93-11 were recently reported (Ma et al., 2016). The O. nivara allele conferred positive effects at 37% of yield associated QTLs. A new gene-specific InDel marker LQ30 for a gene LOC_Os03g14850 for improved stigma length was developed using a single segment substitution line SSSL14 (Liu et al., 2015). Thus CSSLs can be easily used for gene discovery. We also wanted to know if the major QTLs detected in BC2F2 remain major effect when the BC2F2 are advanced to BC2F8 or do new QTLs become major QTLs with the change in background from BC2F2 to BC2F8 of the same cross. Keeping in view, the importance of ILs as a prebreeding material harboring loci for yield enhancing QTLs/genes and CSSLs as a genetic resource for crop improvement, the present study was aimed to (i) detect major QTLs for yield traits in BC2F8 population derived from Swarna/Oryza nivara (ii) compare them with those identified in BC2F2 from the same cross and (iii) identify a set of complete chromosomal segment substitution lines from BC2F8 BILs.
Materials and Methods
Plant Material
A set of BC2F5 BILs, derived from a cross between an elite rainfed lowland cultivar Swarna (O. sativa) also known as MTU 7029 as a recurrent parent and a wild accession O. nivara IRGC81848 as a donor parent was developed by Swamy (2009) and these BILs were self-pollinated in consecutive generations to obtain BC2F8 families by single panicle selection (Supplementary Table 1).
Phenotypic Evaluation
Ninety four BC2F8 lines along with recurrent parent Swarna were grown in wet seasons (Kharif) of 2014 and 2015 at Indian Institute of Rice Research (IIRR), Hyderabad. Experiments were conducted using Randomized Complete Block Design (RCBD) with five replications each. The following traits were evaluated. DFF – number of days from sowing to the time that 50% of the plants showed flowering; DM – duration in days from sowing to the time when more than 80% of the grains on the panicles were fully ripened; PH - length in centimeters from the soil surface to the tip of the highest panicle at the time of harvest; Number of tillers per plant (NT) – number of tillers at the time of harvest; Number of productive tillers per plant (NPT) – number of panicle-bearing tillers at the time of harvest; PW – weight of five panicles per plant; YLDP-weight of the harvested seeds per plant; BY weight of dried and cleaned seeds from 30 plants and Biomass (BM) per plant- weight of well-dried mature harvested plants without panicles. LS means were calculated on data pooled by years using PB tools (Version 1.41) and were used in further statistical analysis and QTL mapping.
Trait Association
Correlation was calculated based on two sample t-test with equal variances. CORREL function of the analysis tool pack was used and then imported in excel to find the correlation coefficient between two variables. Correlation among traits was computed at P < 0.05 and P < 0.01, respectively.
Genotyping
Total genomic DNA was isolated from fresh leaf samples of 94 BC2F8 plants and the parents following CTAB method (Doyle and Doyle, 1987). In all, 324 markers were tested for parental polymorphism. One hundred and twenty four SSRs were polymorphic of which 111 gave clear bands and also segregated in BC2F8 (Supplementary Table 2). PCR was carried out in thermal cycler (G-STORM, United States) with a final reaction volume of 10 μl containing 15 ng of genomic DNA, 1X assay buffer, 200 μM of dNTPs, 1.5 mM MgCl2, 10 pmol of forward and reverse primer and 1 unit of Taq DNA polymerase (Thermo Scientific). PCR cycles were programmed as follows: initial denaturation at 94°C for 5 min followed by 35 cycles of 94°C for 30 s, 55°C for 30 s, 72°C for 1 min and a final extension of 10 min at 72°C. Amplified products were resolved in 3% agarose gel prepared in 0.5 × TBE buffer and electrophoresed at 120 V for 2 h. Gels were stained with ethidium bromide and documented using gel documentation system (Alpha Imager, United States).
Linkage Mapping and QTL Analysis
Linkage map was constructed based on genotypic data of 94 BILs using 111 polymorphic SSR markers on all chromosomes using MAP function (BC2RIL) of QTL IciMapping v4.12 using the Kosambi mapping function (Kosambi, 1944). QTL detection was carried out by Composite Interval Mapping, Inclusive Composite Interval Mapping (ICIM) and Single trait Multiple Interval Mapping (SMIM) method in QGene 4.4.0 software (Joehanes and Nelson, 2008). Analysis was undertaken using automatic parameter setting and controlling marker forward stepwise. The threshold of LOD for declaring the presence of significant QTL for each trait was determined using 1000 permutations and α = 0.05 in QGene 4.4.0 software. At α = 0.05, the LOD threshold values ranged from 2.8 to 8.8.
Identification of CSSL Set
Chromosomal segment substitution lines were identified using genotypic data of 111 polymorphic loci in 94 BILs in the background of the recurrent parent Swarna using the software CSSL Finder3. Statistical analysis was carried out using PB tools (Version 1.44) for the test of significance.
Results
Phenotypic Evaluation
The mean values of parents and BILs in each year for nine traits and number of BILs showing significant trait increase over recurrent parent Swarna is given in Table 1. The highest range of variation was observed for PH, NT, YLDP, and BY in 2014 and for PH, PW, BY, and BM in 2015. Positive transgressive segregation was observed for seven traits in both years compared with Swarna. In 2 years an average of 34% of BILs exhibited 15% to 70% increase over Swarna for PH, PW, YLDP, BY, and BM. Significant pair-wise comparison (at P = 0.05) of replicated phenotypic data of the BILs with Swarna as control revealed that BILs 166-9S, 235S, 10-2S, 10-3-4S and 84S had significantly higher yield with mean of 14.43 to 26.40 g per plant but only in 1 year. Likewise, three BILs for DFF and PH, 9 BILs for BM and 30 BILs for PW were significantly different from Swarna but only in 1 year. The highest number of lines (11 lines) with significant improvement over Swarna was observed for the trait PW. One BIL, 220S showed significantly higher PW over Swarna in both years. Two BILs 14-3S and 166-32S had significantly lower PW compared to Swarna in 2014 (data not shown). All traits followed a normal distribution except NT in 2014 and PW in 2015 as shown in Supplementary Figures 1, 2.
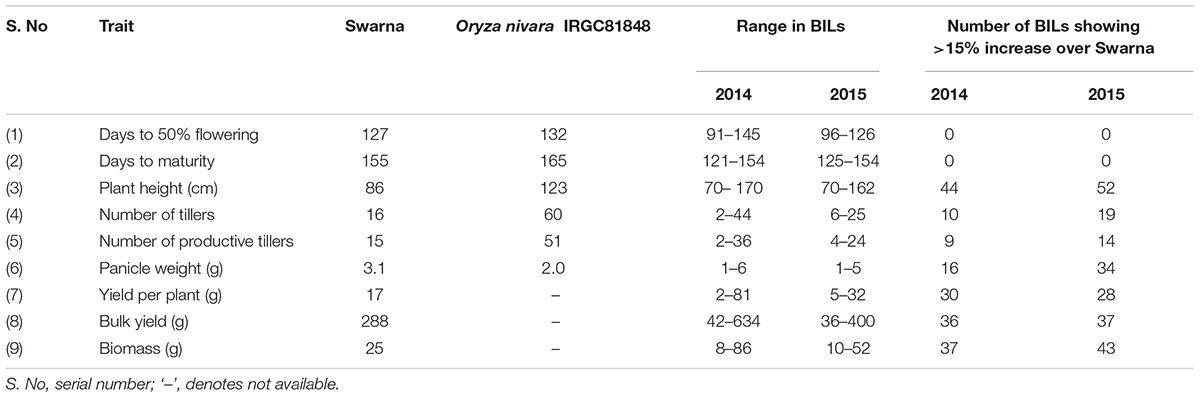
TABLE 1. Details of phenotypic traits of parents and mean range in 94 BILs in 2014 and 2015.
Trait Correlations
Significant correlations were observed among the traits in both the years at P < 0.05 and P < 0.01 (Supplementary Table 3). In both years, significant positive correlation was observed between DFF and DM; PH with PW, YLDP and BM; NT and NPT; PW and YLDP; YLDP with BY and BM; and BM and BY. Significant negative correlation was observed between PH and NPT in both years. In 2014, DFF was positively correlated with NT and YLDP, but negatively with BY in 2015. NT and NPT showed significant positive correlation with YLDP, BY, and BM only in 2014. In 2015, positive significant correlation was observed between PH and BY; PW and BY, but were negatively correlated in 2014. Negative correlation was observed for DM with PW and BY; PH with NT in both years, but significant only in 2015.
Correlation analysis of both years mean data showed that YLDP has significant positive correlation with PH, NT, NPT, PW, BM, and BY. Significantly correlated traits DFF and DM were negatively correlation with both PW and BY. PH had significant positive correlation with PW, YLDP, and BM but negative correlation with NT and NPT. BM also showed significant positive correlation with PH, NT, NPT, and PW.
Molecular Characterization of BILs
Considering all the 111 loci and 94 BILs, a total of 7488 alleles were detected covering all chromosomes. Swarna homozygous alleles accounted for 84%, O. nivara homozygous alleles 11% and heterozygous alleles 4%. The highest number of O. nivara alleles were detected on chromosome 1 (128 alleles), chromosome 2 (120 alleles) and chromosome 8 (108 alleles) and lowest number of O. nivara alleles were detected on chromosome 10 (10 alleles). The O. nivara introgressions among BILs ranged from 1.15 to 27.0%, with a mean of 10.1%. Number of heterozygotes at any locus ranged from 0 to 40 (42%). RM125 on chromosome 7 followed by RM519 on chromosome 12 showed the highest number of heterozygotes. BIL 138S had was highest number of 24 heterozygotic loci (21% of all loci).
Construction of Linkage Map and QTL Mapping
Linkage map was constructed based on genotypic data of 94 BILs using 111 polymorphic SSR markers on all chromosomes. In all, 15 QTLs were identified for all traits except for BM, considering data of both years using CIM, ICIM, and MIM (Figure 1). Five QTLs were identified in 2014 and 10 QTLs in 2015 (Tables 2, 3). Two QTLs were common in both years for DM and PH considering CIM, ICIM and MIM. PV explained by these 15 QTLs ranged from 12 to 56%. O. nivara alleles were trait enhancing in 26% of QTLs for 3 traits.
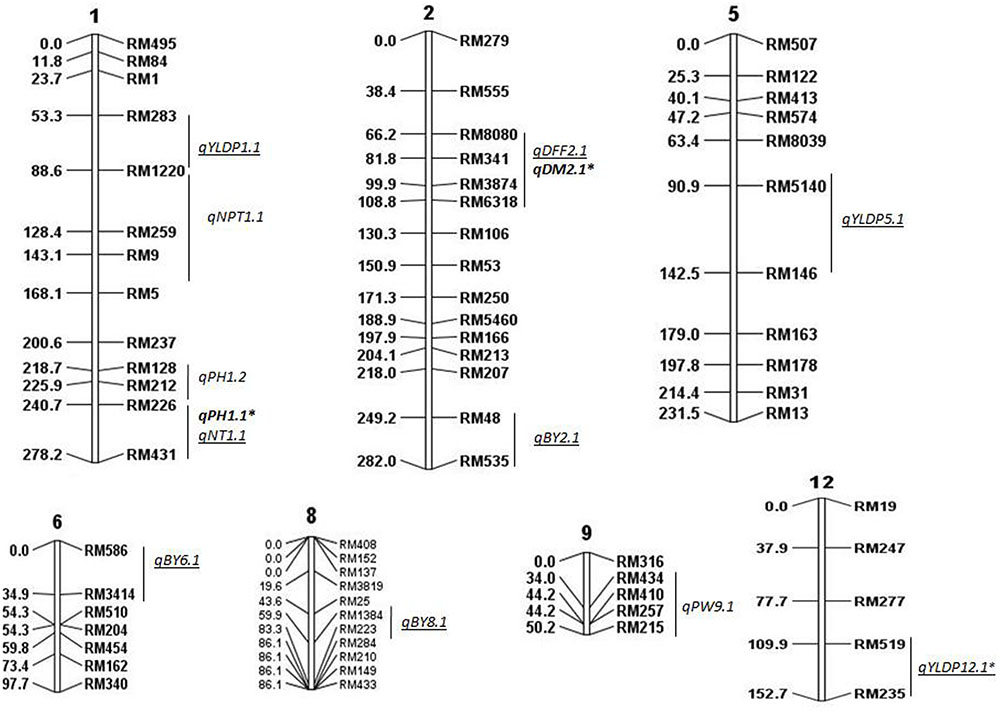
FIGURE 1. Molecular linkage map of 111 SSRs with position of QTLs for agronomic traits using QGene. Linkage map constructed using ICIM was 1178cM long. DEF, days to 50% flowering; DM, days to maturity; PH, plant height; NT, number of tillers; NPT, number of productive tillers; PW, panicle weight; YLDP, yield per plant; BY, bulk yield; BM, biomass. ‘∗’ denotes common QTLs detected in BC2F2 and BC2F8. QTLs identified in both years are shown in bold, QTLs identified only in 2015 are underlined.
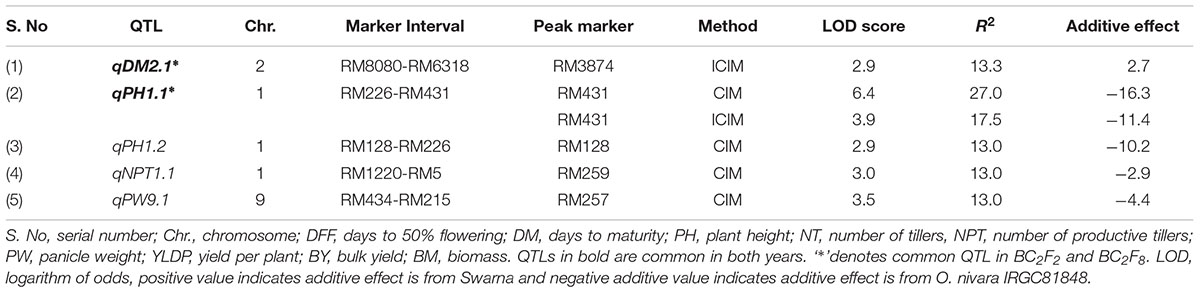
TABLE 2. Trait wise QTLs for agronomic traits detected using 111 SSRs in the BC2F8 population of Swarna/O. nivara in 2014.
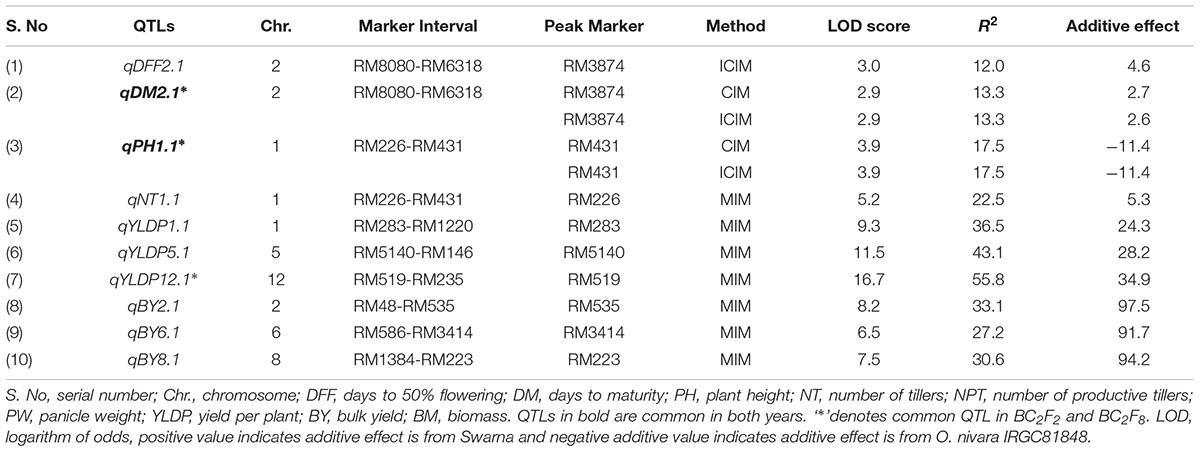
TABLE 3. Trait wise QTLs for agronomic traits detected using 111 SSRs in the BC2F8 population of Swarna/O. nivara in 2015.
Common QTLs Identified in 2014 and 2015
In all, 15 QTLs were identified, of which only 2 QTLs were common in both years and their PV ranged from 13 to 27%. These were qDM2.1 and qPH1.1. The common QTL qDM2.1 was identified at chromosomal region RM8080-RM6318 and explained PV of 13% with LOD score 2.9. A major QTL qPH1.1 at marker interval RM226-RM431 was identified in both years with average LOD of 4.5 explaining PV of 20%. O. nivara allele was trait-enhancing in qPH1.1 and Swarna allele at qDM2.1 in both years.
QTLs Identified in 2014
A total of 5 QTLs were identified, of which 2 were also identified in 2015. One QTL qPH1.2 was identified at RM128-RM226 region with PV of 13%. One QTL each for NPT (qNPT1.1) and PW (qPW9.1) were identified with PV 13% each and LOD score of 3 and 3.5, respectively. The increasing effect of these three QTLs qPH1.2, qNPT1.1 and qPW9.1 was from O. nivara.
QTLs Identified in 2015
In all, 10 QTLs were identified, of which 2 were also identified in 2014. The PV explained by these 10 QTLs ranged from 12 to 56%. Three QTLs each were identified for YLDP and BY. Three QTLs qYLDP1.1, qYLDP5.1, and qYLDP12.1 showed PV ranging from 36 to 56% and trait enhancing alleles from Swarna. Of these three QTLs, one major effect QTL qYLDP12.1 was identified at chromosomal region RM519-RM235 with highest LOD of 16.7 and 56% PV. Three major QTLs qBY2.1, qBY6.1, and qBY8.1 were identified with PV ranging from 27 to 33%. One QTL each for DFF (qDFF2.1) and NT (qNT1.1) were identified with PV 12 and 22.5%. Two common QTLs qDM2.1 and qPH1.1 were identified in both years.
Identification of CSSLs
Chromosomal segment substitution line Finder output showed that 74 CSSLs had homozygous chromosome segments from O. nivara substituting Swarna segments (Figure 2). These 74 CSSLs together showed 89% coverage of the wild genome based on the 111 SSRs marker data. Small regions on chromosomes 4, 6, 7, 9, 11, and 12 were not represented in the 74 CSSLs. The average number of substituted segments per chromosome in these was 6.5. The number of substituted segments in each CSSL ranged from 2 to 18, with an average of 9.5% (Supplementary Figure 3). Chromosome 1 was represented by 8 CSSLs, chromosome 2 by 13 CSSLs, chromosome 3 by 9 CSSLs and chromosome 10 by 4 CSSLs.
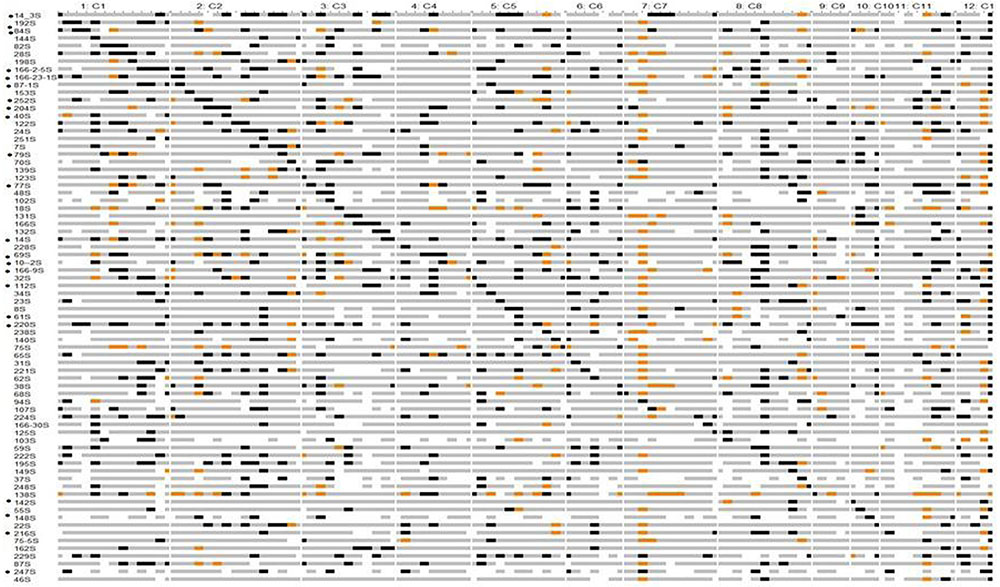
FIGURE 2. Graphical genotypes of Swarna chromosomal segment substitution lines with Oryza nivara segments using 111 SSRs in BC2F8. Gray – Swarna homozygous, black – O. nivara homozygous, orange -heterozygous, white - missing data. ‘∗’ indicates CSSL value significantly more than in Swarna for different traits. Details given in Supplementary Table 4.
Chromosomal segment substitution line 142S had only three substituted segments and they were on chromosome 10 and showed significantly higher BM than Swarna. Two lines 220S and 166-23-1S showed significantly higher PW than Swarna in both the years.
Discussion
In the present study, transgressive segregants were obtained with about 15% improvement over Swarna for many yield related traits which indicates that alleles from O. nivara were favorable in the genetic background of Swarna in BC2F8 generation also. It is significant that 10 new QTLs were identified in BC2F8 which were not detected previously in BC2F2 population (Swamy et al., 2011, 2014). Of 15 QTLs identified in the study, three QTLs for PH, DM, and YLDP on chromosomes 1, 2 and 12, respectively, were identified in BC2F2 also.
Most of the QTL regions identified in our study were associated with two or more traits. For example, chromosomal region RM226-RM431 on chromosome 1 had QTLs for PH and NT. Likewise, the chromosomal region RM1220 on chromosome 1 had QTLs for NPT and YLDP; RM8080-RM6318 on chromosome 2 had QTLs for DFF and DM. Correspondingly, there was also significant correlation between DFF and DM in both years; NPT and YLDP in 2015. This may be due to the pleiotropic effects of same QTL alleles/genes controlling PH, NPT and YLDP or presence of two or more adjacent QTL alleles at same locus each controlling a different trait. These QTLs can be used for marker assisted improvement of different traits simultaneously because of their strong and consistent linkage with yield. However, it may be noted that though QTLs for correlated traits were colocalised but the effect of QTLs depends on the genetic context and the direction of their association (Dufey et al., 2015).
Common QTLs in BC2F2 and BC2F8
Yield enhancing QTLs have been reported previously from O. nivara in BC2F2 families (Kaladhar et al., 2008; Swamy et al., 2011, 2014). A total of 28 QTLs for yield traits were reported in BC2F2 population derived from the same cross of Swarna/O. nivara IRGC81848 and 78% of the loci from O. nivara were trait enhancing (Swamy et al., 2014). Three common QTLs for traits PH (qPH1.1- RM431) on chromosome 1, DM (qDM2.1-RM3874) on chromosome 2, and YLDP (qYLDP12.1- RM519) on chromosome 12 were identified in both BC2F2 (previous study) and BC2F8 (present study) and these three are thus significant major effect QTLs. The first common QTL qPH1.1 is close to the well known semi- dwarf locus sd-1, the green revolution gene and explained PV of 22 and 17.5% in 2014 and 2015, respectively. Thus, it shows the robustness of our study as these major QTLs were identified in BC2F2 and BC2F8 and in both years. The major effect QTL qPH1.1 was identified in both years and in both generations (BC2F8 and BC2F2) indicating that it is also a stable QTL. RM431 the peak marker is within the region of QTL qDTY1.1 reported previously for yield under drought and being transferred into submergence tolerant versions of three high yielding mega rice varieties Swarna-Sub1, Samba Mahsuri-Sub1, and IR 64-Sub1 using MAS (Vikram et al., 2011; Singh R. et al., 2016). In our study, O. nivara allele of qPH1.1 increases PH. The semi dwarfing gene sd-1, has been widely utilized in rice production, however, attention has to be paid to breed taller plants with strong culm to enhance plant yield by increasing biomass (Han et al., 2017). They identified QTLs for PH in a RIL population derived from Zhenshan 97 and Xizang 2. Two QTLs qph1 and qph7.1 detected in 3 years, explained 13% PV with large additive effect of 12 cm from Xizang 2 allele. In our study, O. nivara alleles increased PH by 11 cm in both the years. RM431 flanks PH QTLs reported previously from elite/ wild crosses using accessions of O. nivara, O. rufipogon and from landraces also (Wickneswari et al., 2012; Eizenga et al., 2013; Mohammadi et al., 2013). In addition to height, RM431 was linked with QTLs for grain number/panicle, harvest index (Li et al., 2012). This indicates that alleles at the vicinity of RM431 are associated with different yield related traits in different genetic backgrounds.
The second common QTL qDM2.1 at chromosomal region RM3874 falls within a metaQTL MQTL2.3 reported for PW (Swamy and Sarla, 2011; Swamy et al., 2011). The third common QTL qYLDP12.1 at RM519 region also harbors QTLs qrd12.1 for rachis diameter, qnpt12.1 for number of productive tillers, qnsp12.1 for number of spikelets and qnfg12.1 for number of filled grains (Swamy, 2009; Swamy et al., 2014). There are two previous reports on identification of common QTLs in BC2F2 and later generations. Rangel et al. (2008) identified one common QTL for grain yield on chromosome 1 at RM1 locus from BG90-2/RS-16 (O. glumaepatula) in both BC2F2 and BC2F8. Similarly, Wickneswari and Bhuiyan (2014) identified two common QTLs qSPL-1-1 and qSPL-8 for spikelets per plant in BC2F2 and BC2F5 from MR219/Oryza rufipogon Griff. IRGC105491.
QTL Regions in BC2F8 Which Were Linked with Different Agronomic Traits in BC2F2
Comparing QTLs in BC2F8 with BC2F2 we found there were few other chromosomal regions common in BC2F8 and BC2F2 but linked with different traits. In BC2F8, RM434 was linked with qPW9.1 where as in BC2F2 RM434 was linked with qyldp9.1. Likewise, RM128 was linked with qPH1.2 in BC2F8 and qnpt1.1 in BC2F2; RM223 for qBY8.1 in BC2F8 and qnfg8.1and qyldp8.1 in BC2F2; RM519 for qYLDP12.1 in BC2F8 and qnpt12.1, qnsp12.1 and qnfg12.1 in BC2F2. There could be several reasons for this observation. Earlier, 100 SSRs were used to genotype 227 BC2F2 mapping population whereas in this study 111 different SSRs were used to genotype 94 BC2F8 BILs and only 37 markers were common with the previous study. The detection of novel QTLs in BC2F8 might be due to changes in genetic background from BC2F2 to BC2F8 or differences in the size of mapping population and the distribution of SSR markers used in the two studies. Also environment conditions were different in the two generations and this might have contributed to differences in phenotype and QTLs.
Considering that the available population size was small, the phenotypic variation explained by QTLs is quite likely to be overestimated. However, since many of the major effect QTLs detected in our study were also identified for the same or different trait previously, it indicates the robustness and importance of these QTLs in regulating the phenotype of yield associated traits. The significant QTLs identified in this study can be further evaluated for use in marker assisted transfer to adapted varieties to improve not only yield but several related traits as QTLs for drought and salinity are being transferred into high yielding mega varieties (Singh R. et al., 2016).
Identification of CSSLs
Chromosomal segment substitution line are an important genetic resource in rice to discover novel genes by focusing on small chromosomal regions (Ali et al., 2010; Subudhi et al., 2015; Ramos et al., 2016). A set of 74 CSSLs with substituted chromosomal segments of O. nivara in the genetic background of Swarna were identified. Graphical genotypes of CSSL library revealed 89% coverage of O. nivara genome. A few chromosomal regions were not represented by substituted segments on chromosomes 4, 7, 9, and 11. This could be due to less number of BILs used or the presence of lethal alleles, hybrid sterility and gametophyte lethal genes or even low recombination in these chromosomal locations. Introgression of O. nivara chromosomal segments in the genetic background of 93-11 was reported by Ma et al. (2016). The coverage of the O. nivara genome by the ILs was 94.96%. Several sets of CSSLs have been developed using other wild species such as O. rufipogon (Furuta et al., 2014; Qiao et al., 2016; Ogawa et al., 2016), O. minuta (Guo et al., 2013), O. meridionalis (Arbelaez et al., 2015), O. longistaminata (Ramos et al., 2016). A set of 198 CSSLs was developed from a cross between 93-11 and O. rufipogon, and introgressed segments covered 84.9% of the wild rice genome (Qiao et al., 2016). Subudhi et al. (2015) developed 74 CSSLs covering 99% of the weedy rice donor PSRR-1 genome. In their study, donor segments per line ranged from 1 to 3 with 64% of CSSLs with single homozygous donor segments. In our study number of donor segments per line ranged from 3 to 18 as CSSLs were identified from a set of available BILs at BC2F8 generation without MAS. A few backcrosses can be made along with MAS of target regions to recover more background genome of this set or selected CSSLs.
In our previous studies, two stable lines 166S and 14S were reported to be efficient in compartmentalization of Na+ in leaf tissue and grain yield of 166S was least affected by salt stress (Divya et al., 2016; Pushpalatha et al., 2016). Also, three lines 24S, 70S, 14-3S were identified as heat tolerant lines for spikelet fertility and YLDP in both wet and dry seasons (Prasanth et al., 2016). In present study, these five lines 14S, 24S, 70S, 166S and 14-3S were part of the set of CSSLs and they were found to have 11.5–18.6% chromosomal segments from O. nivara. Thus, several elite BILs such as these can be used in prebreeding programs for identification of candidate genes for different yield related traits. Among the CSSLs, 220S showed significantly higher PW over the parent Swarna in both years. 10-2S showed highest YLDP in both years over Swarna. These two lines, 220S and 10-2S showed significantly higher yield than Swarna, so they can be used to dissect target QTL regions. In addition, another 20 CSSLs showed different yield traits as significantly higher than Swarna and these marker defined CSSLs can be further utilized for fine mapping.
Conclusion
Our results provide evidence that O. nivara has novel, stable, major effect QTL alleles for PH, DM not only in BC2F2 but even in BC2F8. ILs with O. nivara alleles for increasing PH or decreasing DM are potential donors for transfer into other popular lines. The set of 74 CSSLs is being phenotyped for other agronomic traits including disease and pest resistance and is an important genetic resource to discover novel alleles for several traits in rice.
Ethics Statement
The authors declare that the experiments comply with the current laws of the country in which they were performed and in compliance with ethical standards.
Author Contributions
SN and DB conceived and planned the work. MS, KA, VY, and SM performed phenotypic and genotypic screening. MS, DB, and TV analyzed the data. MS, DB, and SN drafted the manuscript.
Funding
This research was carried out as part of ICAR- National Professor Project (F.No: Edn/27/4/NP/2012-HRD) funded by Indian Council of Agricultural Research, New Delhi, India to SN. The BILs were initially developed in Department of Biotechnology, Government of India funded project, (BT/AB/FG-2 (Ph-II) 2009).
Conflict of Interest Statement
The authors declare that the research was conducted in the absence of any commercial or financial relationships that could be construed as a potential conflict of interest.
The reviewer MR and handling Editor declared their shared affiliation, and the handling Editor states that the process met the standards of a fair and objective review.
Acknowledgment
We thank Director, IIRR for support.
Supplementary Material
The Supplementary Material for this article can be found online at: http://journal.frontiersin.org/article/10.3389/fpls.2017.01027/full#supplementary-material
Abbreviations
BILs, backcross inbred lines; BM, biomass; BY, bulk yield; CSSLs, chromosome segment substitution lines; DFF, days to 50% flowering; DM, days to maturity; IL, introgression line; MAS, marker assisted selection; MIM, multiple interval mapping; NT, number of tillers; NPT, number of productive tillers; PH, plant height; PW, panicle weight; QTLs, quantitative trait loci; SSRs, simple sequence repeats; YLDP, yield per plant.
Footnotes
- ^http://bbi.irri.org/products
- ^www.isbreeding.net
- ^http://mapdisto.free.fr/CSSLFinder/
- ^http://bbi.irri.org/products
References
Ali, M. L., Sanchez, P. L., Yu, S., Lorieux, M., and Eizenga, G. C. (2010). Chromosome segment substitution lines: a powerful tool for the introgression of valuable genes from Oryza wild species into cultivated rice (O. sativa L.). Rice. 3, 218–234. doi: 10.1007/s12284-010-9058-3
Ando, T., Yamamoto, T., Shimizu, T., Ma, X., Shomura, A., Takeuchi, Y., et al. (2008). Genetic dissection and pyramiding of quantitative traits for panicle architecture by using chromosomal segment substitution lines in rice. Theor. Appl. Genet. 116, 881–890. doi: 10.1007/s00122-008-0722-6
Annual Progress Report (2012–2013). All India Coordinated Rice Improvement Project (AICRIP). Hyderabad: Directorate of Rice Research.
Arbelaez, J. D., Moreno, L. T., Singh, N., Tung, C. W., Maron, L. G., Ospina, Y., et al. (2015). Development and GBS-genotyping of introgression lines (ILs) using two wild species of rice, O. meridionalis and O. rufipogon in a common recurrent parent, O. sativa cv. Curinga. Mol. Breed. 35, 81. doi: 10.1007/s11032-015-0276-7
Brar, D. S., and Khush, G. S. (1997). Alien introgression in rice. Plant Mol. Biol. 35, 35–47. doi: 10.1023/A:1005825519998
Brar, D. S., and Singh, K. (2011). “Oryza,” in Book: Wild Crop Relatives: Genomic and Breeding Resources: Cereals, Vol. 1, ed. C. Kole (Berlin: Springer Science and Business Media), 321–365.
Cheema, K. K., Grewal, N. K., Vikal, Y., Sharma, R., Lore, J. S., Das, A., et al. (2008). A novel bacterial blight resistance gene from Oryza nivara mapped to 38 kb region on chromosome 4L and transferred to Oryza sativa L. Genet. Res. 90, 397–407. doi: 10.1017/S0016672308009786
Divya, B., Subrahmanyam, D., Badri, J., Raju, A. K., Rao, V. Y., Kavitha, B., et al. (2016). Genotype × environment interactions of yield traits in backcross introgression lines derived from Oryza sativa cv. Swarna /Oryza nivara. Front. Plant Sci. 7:1530. doi: 10.3389/fpls.2016.01530
Doyle, J. J., and Doyle, J. L. (1987). A rapid DNA isolation procedure for small quantities of fresh leaf tissue. Phytochem. Bull. 19, 11–15.
Dufey, I., Draye, X., Lutts, S., Lorieux, M., Martinez, C., and Bertin, P. (2015). Novel QTLs in an interspecific backcross Oryza sativa x Oryza glaberrima for resistance to iron toxicity in rice. Euphytica 204, 609–625. doi: 10.1007/s10681-014-1342-7
Eizenga, G. C., Neves, P. C. F., Bryant, R. J., Agrama, H. A., and Mackill, D. J. (2015). Evaluation of a M-202 x Oryza nivara advanced backcross mapping population for seedling vigor, yield components and quality. Euphytica 208, 157–171. doi: 10.1007/s10681-015-1613-y
Eizenga, G. C., Prasad, B., Jackson, A. K., and Jia, M. H. (2013). Identification of rice sheath blight and blast quantitative trait loci in two different O. sativa x O. nivara advanced backcross populations. Mol. Breed. 31, 889–907. doi: 10.1007/s11032-013-9843-y
Furuta, T., Uehara, K., Angeles-Shim, R. B., Shim, J., Ashikari, M., and Takashi, T. (2014). Development and evaluation of chromosome segment substitution lines (CSSLs) carrying chromosome segments derived from Oryza rufipogon in the genetic background of Oryza sativa L. Breed. Sci. 63, 468–475. doi: 10.1270/jsbbs.63.468
Furuta, T., Uehara, K., Angeles-Shim, R. B., Shim, J., Nagai, K., Ashikari, M., et al. (2016). Development of chromosome segment substitution lines (CSSLs) harbouring Oryza nivara genomic segments in Koshihikari and evaluation of yield related traits. Breed. Sci. 66, 845–850. doi: 10.1270/jsbbs.16131
Guo, S., Wei, Y., Li, X., Liu, K., Huang, F., Chen, C., et al. (2013). Development and identification of introgression lines from cross of Oryza sativa and Oryza minuta. Rice Sci. 20, 95–102. doi: 10.1016/S1672-6308(13)60111-0
Han, Z., Hu, W., tan, C., and Xing, Y. (2017). QTLs for heading date and plant height under multiple environments in rice. Genetica 145, 67–77. doi: 10.1007/s10709-016-9946-6
Joehanes, R., and Nelson, J. C. (2008). QGene 4.0, an extensible Java QTL-analysis platform. Bioinformatics 23, 2788–2789. doi: 10.1093/bioinformatics/btn523
Kaladhar, K., Swamy, B. P. M., Babu, A. P., Reddy, C. S., and Sarla, N. (2008). Mapping quantitative trait loci for yield traits in BC2F2 population derived from Swarna x O. nivara cross. Rice Genet. Newsl. 24, 34–36. doi: 10.1093/jhered/esr145
Khush, G. S. (1977). Disease and insect resistance in rice. Adv. Agron. 29, 265–341. doi: 10.1016/S0065-2113(08)60221-7
Kosambi, D. D. (1944). The estimation of map distance from recombination values. Ann. Eugen. 12, 172–175. doi: 10.1111/j.1469-1809.1943.tb02321.x
Lakshmi, J. V., Swamy, B. P. M., Kaladhar, K., and Sarla, N. (2010). BPH resistance in introgression lines of Swarna / O. nivara and KMR3 / O. rufipogon. DRR News Lett. 8, 4.
Li, C., Zhou, A., and Sang, T. (2006). Genetic analysis of rice domestication syndrome with the wild annual species, Oryza nivara. New Phytol. 170, 185–194. doi: 10.1111/j.1469-8137.2005.01647.x
Li, X., Yan, W., Agrama, H., Jia, L., Jackson, A., Moldenhauer, K., et al. (2012). Unraveling the complex trait of harvest index with association mapping in rice (Oryza sativa L.). PLoS ONE 7:e29350. doi: 10.1371/journal.pone.0029350
Liu, Q., Qin, J., Li, T., Liu, E., Fan, D., Edzesi, W. M., et al. (2015). Fine mapping and candidate gene analysis of qSTL3, a stigma length-conditioning locus in rice (Oryza sativa L.). PLoS ONE 10:e0127938. doi: 10.1371/journal.pone.0127938
Ma, X., Fu, Y., Zhao, X., Jiang, L., Zhu, Z., Gu, P., et al. (2016). Genomic structure analysis of a set of Oryza nivara introgression lines and identification of yield associated QTLs using whole genome resequencing. Sci. Rep. 6:27425. doi: 10.1038/srep27425
Mohammadi, R., Mendioro, M. S., Diaz, G. Q., Gregorio, G. B., and Singh, R. K. (2013). Mapping quantitative trait loci associated with yield and yield components under reproductive stage salinity stress in rice (Oryza sativa L.). J. Gen. 92, 433–443. doi: 10.1007/s12041-013-0285-4
Ogawa, S., Valencia, M. O., Lorieux, M., Arbelaez, J. D., McCouch, S., Ishitani, M., et al. (2016). Identification of QTLs associated with agronomic performance under nitrogen-deficient conditions using chromosome segment substitution lines of a wild rice relative, Oryza rufipogon. Acta Physiol. Plant. 38, 103. doi: 10.1007/s11738-016-2119-5
Ookawa, T., Aoba, R., Yamamoto, T., Ueda, T., Takai, T., Fukuoka, S., et al. (2016). Precise estimation of genomic regions controlling lodging resistance using a set of reciprocal chromosome segment substitution lines in rice. Sci. Rep. 28:30572. doi: 10.1038/srep30572
Prasanth, V. V., Basava, K. R., Babu, M. S., Venkata, T. V. G. N., Rama Devi, S. J. S., Mangrauthia, S. K., et al. (2016). Field level evaluation of rice introgression lines for heat tolerance and validation of markers linked to spikelet fertility. Physiol. Mol. Biol. Plants 22, 179. doi: 10.1007/s12298-016-0350-6
Pushpalatha, G., Ajay, J., Parmar, B., Rao, A. R., Sreenu, K., Mishra, P., et al. (2016). Identification of salt tolerant rice lines among interspecific BILs developed by crossing Oryza sativa /O. rufipogon and O. sativa /O. nivara. Aust. J. Crop. Sci. 10, 220–228.
Qiao, W., Qi, L., Cheng, Z., Su, L., Li, J., Sun, Y., et al. (2016). Development and characterization of chromosome segment substitution lines derived from Oryza rufipogon in the genetic background of O. sativa spp. indica cultivar 93-11. BMC Genomics 17:580. doi: 10.1186/s12864-016-2987-5
Rai, V., Sreenu, K., Puspalatha, B., Prasad Babu, A., Brajendra, P., Sandhya, G., et al. (2010). Swarna / O. nivara and KMR3 / O. rufipogon introgression lines tolerant to drought and salinity. DRR NewsLetter 8, 4.
Ramos, J. M., Furuta, T., Uehara, K., Chihiro, N., Angeles-Shim, R. B., Shim, J., et al. (2016). Development of chromosome segment substitution lines (CSSLs) of O. longistaminata A. Chev. & Rohr in the background of the elite japonica rice cultivar, Taichung 65 and their evaluation for yield traits. Euphytica 210, 151–163. doi: 10.1007/s10681-016-1685-3
Rangel, P. N., Brondani, R. P. V., Rangel, P. H. N., and Brondani, C. (2008). Agronomic and molecular characterization of introgression lines from the interspecific cross Oryza sativa (BG90-2) x Oryza glumaepatula (RS-16). Genet. Mol. Res. 7, 184–195. doi: 10.4238/vol7-1gmr406
Ray, D. K., Mueller, N. D., West, P. C., and Foley, J. A. (2013). Yield trends are insufficient to double global crop production by 2050. PLoS ONE 8:e66428. doi: 10.1371/journal.pone.0066428
Sarla, N., Bobba, S., and Siddiq, E. A. (2003). ISSR and SSR markers based on AG and GA repeats delineate geographically diverse Oryza nivara accessions and reveal rare alleles. Curr. Sci. 84, 683–690.
Sarla, N., and Swamy, B. P. M. (2005). Oryza glaberrima: a source for the improvement of Oryza sativa. Curr. Sci. 89, 955–963.
Sharma, S. D., and Shastry, S. V. S. (1965). Taxonomic studies in genus Oryza L. III. O. rufipogon Griff. sensu stricto and O. nivara Sharma et Shastry nom. nov. Ind. J. Genet. Plant Breed. 25, 157–167.
Shim, R. A., Angeles, E. R., Ashikari, M., and Takashi, T. (2010). Development and evaluation of Oryza glaberrima Steud. chromosome segment substitution lines (CSSLs) in the background of O. sativa L.Cv. Koshihikari. Breed. Sci. 60, 613–619. doi: 10.1270/jsbbs.60.613
Singh, K., Neelam, K., Kaur, A., and Kaur, K. (2016). “Rice,” in Broadening the Genetic Base of Grain Cereals, eds M. Sing and S. Kumar (New Delhi: Springer India), 27–65. doi: 10.1007/978-81-322-3613-9_3
Singh, R., Singh, Y., Xalaxo, S., Verulkar, S., Yadav, N., Singh, S., et al. (2016). From QTL to variety-harnessing the benefits of QTLs for drought, flood and salt tolerance in mega rice varieties of India through a multi-institutional network. Plant Sci. 242, 278–287. doi: 10.1016/j.plantsci.2015.08.008
Subudhi, P. K., De Leon, T., Singh, P. K., Parco, A., Cohn, M. A., and Sasaki, T. (2015). A chromosome segment substitution library of weedy rice for genetic dissection of complex agronomic and domestication traits. PLoS ONE 10:e0130650. doi: 10.1371/journal.pone.0130650
Swamy, B. P. M. (2009). Genome wide Mapping of Quantitative Trait Loci (QTLs) for Yield and Grain Quality Traits in O. sativa cv Swarna x O. nivara Backcross Population. Ph.D Thesis, Osmania University, Hyderabad, India.
Swamy, B. P. M., Kaladhar, K., Ramesha, M. S., Viraktamath, B. C., and Sarla, N. (2011). Molecular mapping of QTLs for yield and related traits in Oryza sativa cv Swarna x O. nivara (IRGC81848) backcross population. Rice Sci. 18, 178–186. doi: 10.1016/S1672-6308(11)60025-5
Swamy, B. P. M., Kaladhar, K., Reddy, A. G., Viraktamath, B. C., and Sarla, N. (2014). Mapping and introgression of QTL for yield and related traits in two backcross populations derived from Oryza sativa cv. Swarna and two accessions of O. nivara. J. Genet. 93, 643–653. doi: 10.1007/s12041-014-0420-x
Swamy, B. P. M., Kaladhar, K., Shobha Rani, N., Prasad, G. S. V., Viraktamath, B. C., Reddy, A. G., et al. (2012). QTL analysis for grain quality traits in two BC2F2 populations derived from crosses between Oryza sativa cv. Swarna and two accessions of O. nivara. J. Hered. 103, 442–452. doi: 10.1093/jhered/esr145
Swamy, B. P. M., and Sarla, N. (2011). Meta-analysis of yield QTLs derived from inter-specific crosses of rice reveals consensus regions and candidate genes. Plant Mol. Biol. Rep. 29, 663–680.
Tanksley, S. D., and Nelson, J. C. (1996). Advanced backcross QTL analysis; a method for simultaneous discovery and transfer of valuable QTL from unadapted germplasm into elite breeding lines. Theor. Appl. Genet. 92, 191–203. doi: 10.1007/BF00223376
Vikram, P., Swamy, B. P. M., Dixit, S., Ahmed, H. U., Sta Cruz, M. T., Singh, A. K., et al. (2011). qDTY1.1, a major QTL for rice grain yield under reproductive-stage drought stress with a consistent effect in multiple elite genetic backgrounds. BMC Genet. 12:89. doi: 10.1186/1471-2156-12-89
Wickneswari, R., and Bhuiyan, M. A. R. (2014). Exploiting wild accessions for development of high yielding new rice genotypes. Malays. Appl. Biol. 43, 89–95.
Wickneswari, R., Bhuiyan, M. A. R., Kalluvettankuzhy, K. S., Lim, L. S., Thomson, M. J., Narimah, M. K., et al. (2012). Identification and validation of quantitative trait loci for agronomic traits in advanced backcross breeding lines derived from Oryza rufipogon x Oryza sativa cultivar MR219. Plant Mol. Biol. Rep. 30, 929–939. doi: 10.1007/s11105-011-0404-4
Keywords: BILs, CSSLs, O. nivara, QTL mapping, SSRs, wild species, yield
Citation: Surapaneni M, Balakrishnan D, Mesapogu S, Addanki KR, Yadavalli VR, Tripura Venkata VGN and Neelamraju S (2017) Identification of Major Effect QTLs for Agronomic Traits and CSSLs in Rice from Swarna/Oryza nivara Derived Backcross Inbred Lines. Front. Plant Sci. 8:1027. doi: 10.3389/fpls.2017.01027
Received: 22 November 2016; Accepted: 29 May 2017;
Published: 22 June 2017.
Edited by:
Prashant Vikram, International Maize and Wheat Improvement Center, MexicoReviewed by:
Georgia C. Eizenga, United States Department Agriculture, Agricultural Research Service, United StatesMandeep Randhawa, International Maize and Wheat Improvement Center, Mexico
Copyright © 2017 Surapaneni, Balakrishnan, Mesapogu, Addanki, Yadavalli, Tripura Venkata and Neelamraju. This is an open-access article distributed under the terms of the Creative Commons Attribution License (CC BY). The use, distribution or reproduction in other forums is permitted, provided the original author(s) or licensor are credited and that the original publication in this journal is cited, in accordance with accepted academic practice. No use, distribution or reproduction is permitted which does not comply with these terms.
*Correspondence: Sarla Neelamraju, sarla_neelamraju@yahoo.com
†These authors have contributed equally to this work.