 Claudio A. Casal
 M. Teresa Anguera
 Rubén Maneiro
 José L. Losada
- 1Department of Science of Physical Activity and Sport, Catholic University of Valencia San Vicente Mártir, Valencia, Spain
- 2Department of Social Psychology and Quantitative Psychology, Institute of Neurosciences, University of Barcelona, Barcelona, Spain
- 3Department of Science of Physical Activity and Sport, Pontifical University of Salamanca, Salamanca, Spain
- 4Department of Social Psychology and Quantitative Psychology, University of Barcelona, Barcelona, Spain
The aim of the present study was to identify and differentiate the factors that determine the possession times of successful and unsuccessful elite football teams, with the purpose of identifying a more effective possession model. For this, match corresponding to the round of eighth-finals, quarter-finals, semi-finals and final of the 2016 UEFA Euro France in which 2,636 offensive sequences occurred, were analyzed. Video recordings of matches were analyzed and coded post-event using systematic observation. The performance indicators recorded and analyzed were: phase; match period; type of start-up; interaction context; intention; field zone; possession time, passes, attack outcome; match status and final outcome. An ANOVA was performed to analyze data in order to study the influence of a set of variables. A Box–Cox transformation was applied on the variable explained to achieve normal conditions. A study of the main effects and significant interactions was also carried out, complemented with a set of predictions with the variables that were more significant. It is hypothesized that possession analysis from a mixed methods perspective will identify a more effective offensive playstyle. Results show how, in successful teams, possession time is influenced by: Type of start-up, intention and field zone. On the other hand, in unsuccessful teams, possession time is determined fundamentally by intention and match status. In terms of the results of the predictive models, in the case of successful teams, they will have longer possessions in the offensive zone with the score in favor and, in the defensive zone with a draw score, in both situations, initiated with the intention of progressing by means of a transition. For unsuccessful teams, possessions will be of longer duration in the defensive zone with a draw score, regardless of the type of start-up and, in the offensive zone, losing and initiating the play by means of a set ball action and winning by means of a transition. Results obtained in this work identify key factors that determine possession time in teams and allow to differentiate the possessions of successful and unsuccessful teams, identifying a more effective ball possession model. This information can be used to design a possession model with greater probabilities of success and increase the offensive performance of teams.
Introduction
Ball possession, in recent years, has acquired transcendental importance in the offensive game model of many football teams. This circumstance was mainly caused by the success of teams such as the FC Barcelona, Manchester City, FC Bayer München or the Spanish and German national teams. All these teams are characterized by an offensive game model, based on the initiative of the game, through ball possession. Numerous previous works have confirmed that it is a performance indicator that makes it possible to differentiate high-level teams. Grant et al. (1999b) analyzed the 1998 World Cup, concluding that greater ball possession is linked to the team success. The work of Hook and Hughes (2001) showed how successful teams in the UEFA Champions League, World Champions and Europa Cup maintained longer possessions than unsuccessful teams. Bloomfield et al. (2005) reported that the three best teams of the English Premier League in the 2003–2004 season (Chelsea FC, Manchester United FC and Arsenal FC), maintained longer possession time than their opponents. Jones et al. (2004) found significant differences in possession time between successful and unsuccessful teams in the English Premier League. Carling et al. (2005) analyzed the same competition but in the 1996–1997 season, obtained the same results. Casal et al. (2015) analyzed Euro 2008, concluding that a longer duration of the offensive phase predicts a greater success of it. The analysis of possession in the 2016 UEFA Euro France made in the work of Casal et al. (2017), also corroborate the close relationship between longer possession time and team success.
In previous works quantitative analysis of possession are carried out, arriving in some cases to identify the zone in which it takes place (Casal et al., 2017), but in none of them the factors that modulate team possession time are identified, nor are they compared to acknowledge if these are the same in successful and unsuccessful teams. Therefore, a study that allows to create relationships between the quantitative and qualitative aspects of possession is justified, and that is not limited to describing and quantitatively comparing team possessions, but that tries to identify which are the performance indicators related to possession time and, describe an offensive playstyle that allows to guarantee greater longer possessions. Unlike most of the previously mentioned works, we intend to perform a novel analysis, from a mixed methods perspective. In this work, in addition to a quantitative analysis, we intend to carry out a qualitative analysis to study the quality of team possessions. The study of possession quality must be undertaken from a qualitative perspective, and the ideal option is systematic observation (Anguera et al., 2000, 2017), which guarantees a perfect balance between flexibility and rigor, and which must be integrated with conventional quantitative information in the study of possessions. Thus, this study is considered from the mixed methods perspective, which implies a novel treatment of possessions, which were usually studied only from a quantitative perspective, taking into account parameters obtained in many cases through computer programs oriented exclusively to a description of the competitions from element frequency (serves, shots on goal, penalties, etc.) of different nature along the game sets. We start from the mixed methods perspective because it represents a third emerging paradigm of research (Johnson et al., 2007) that offers an alternative to purely qualitative or quantitative studies which has expanded rapidly over the last two decades (Tashakkori and Teddie, 1998, 2003, 2010).
Through the application of this methodology we will try to achieve the following objectives: determining possession times of successful and unsuccessful teams, identifying performance indicators that influence possession times in both groups of teams, describing differences between possession patterns of successful and unsuccessful teams and, finally, find more effective possession models. Our hypothesis is that possession analysis from the mixed methods perspective will make possible to identify a playstyle that guarantees a more effective possession of the ball. If the hypothesis is confirmed, obtained results can be used by technicians and players to model training and competitions, allowing to increase the offensive performance of teams.
Materials and Methods
Observational Design
The specific design corresponding to this systematic observation, according to Anguera et al. (2011), is a combination of a nomothetic/puntual/multidimensional (N/P/M) and nomothetic/follow up/multidimensional (N/F/M) design. The reason is that some teams (nomothetic) are recorded in several matches with different opposite team (puntual), but also that these teams participate in the rounds until the final match (follow up); in all matches we have considered several performance indicators and time measures (multidimensional). Moreover, the recording used an intrasessional follow-up (frame-by-frame analysis of different matches), and was captured using the ad hoc observation instrument in different matches. Data analyzed is of type IV (Bakeman, 1978).
Participants
To control some of the situational variables that can potentially affect tactical and strategic team behavior, such as quality or level of opposing teams and the match location (Kormelink and Seeverens, 1999; Carling et al., 2005), 14 teams and 12 matches corresponding to the round of eighth-finals, quarter-finals, semi-finals and final of the 2016 UEFA Euro France have been selected in which 2,636 offensive sequences occurred. Belgium, Croatia, Eire, England, France, Germany, Hungary, Iceland, Italy, Northern Ireland, Portugal, Slovakia, Spain, and Wales were the teams analyzed.
Three games Switzerland vs. Poland; Poland vs. Portugal and Germany vs. Italy have been excluded from the analysis since the match outcome was a draw having in account regular time and extensions, which makes impossible to label the teams as successful or unsuccessful.
This sample ensures that all matches are played on neutral ground, the teams have a similar level and, by eliminating the games of the group phase, we also make sure that the teams look for the victory in their matches, since defeat will mean elimination. In the group phase matches, it may happen that some team is more interested in drawing or losing any of their matches, to avoid a particular opponent in the following phases, this would lead to incorrect results in the study.
Observational Instrument
Four national coaches and experts in football research designed an ad hoc observation instrument combining a field format and category systems (Anguera et al., 2018a,b) was created (Table 1). Indicators that represent the qualitative side of this study have been selected based on previous studies (Casal et al., 2015, 2016, 2017), which have demonstrated their relationship with team performance.
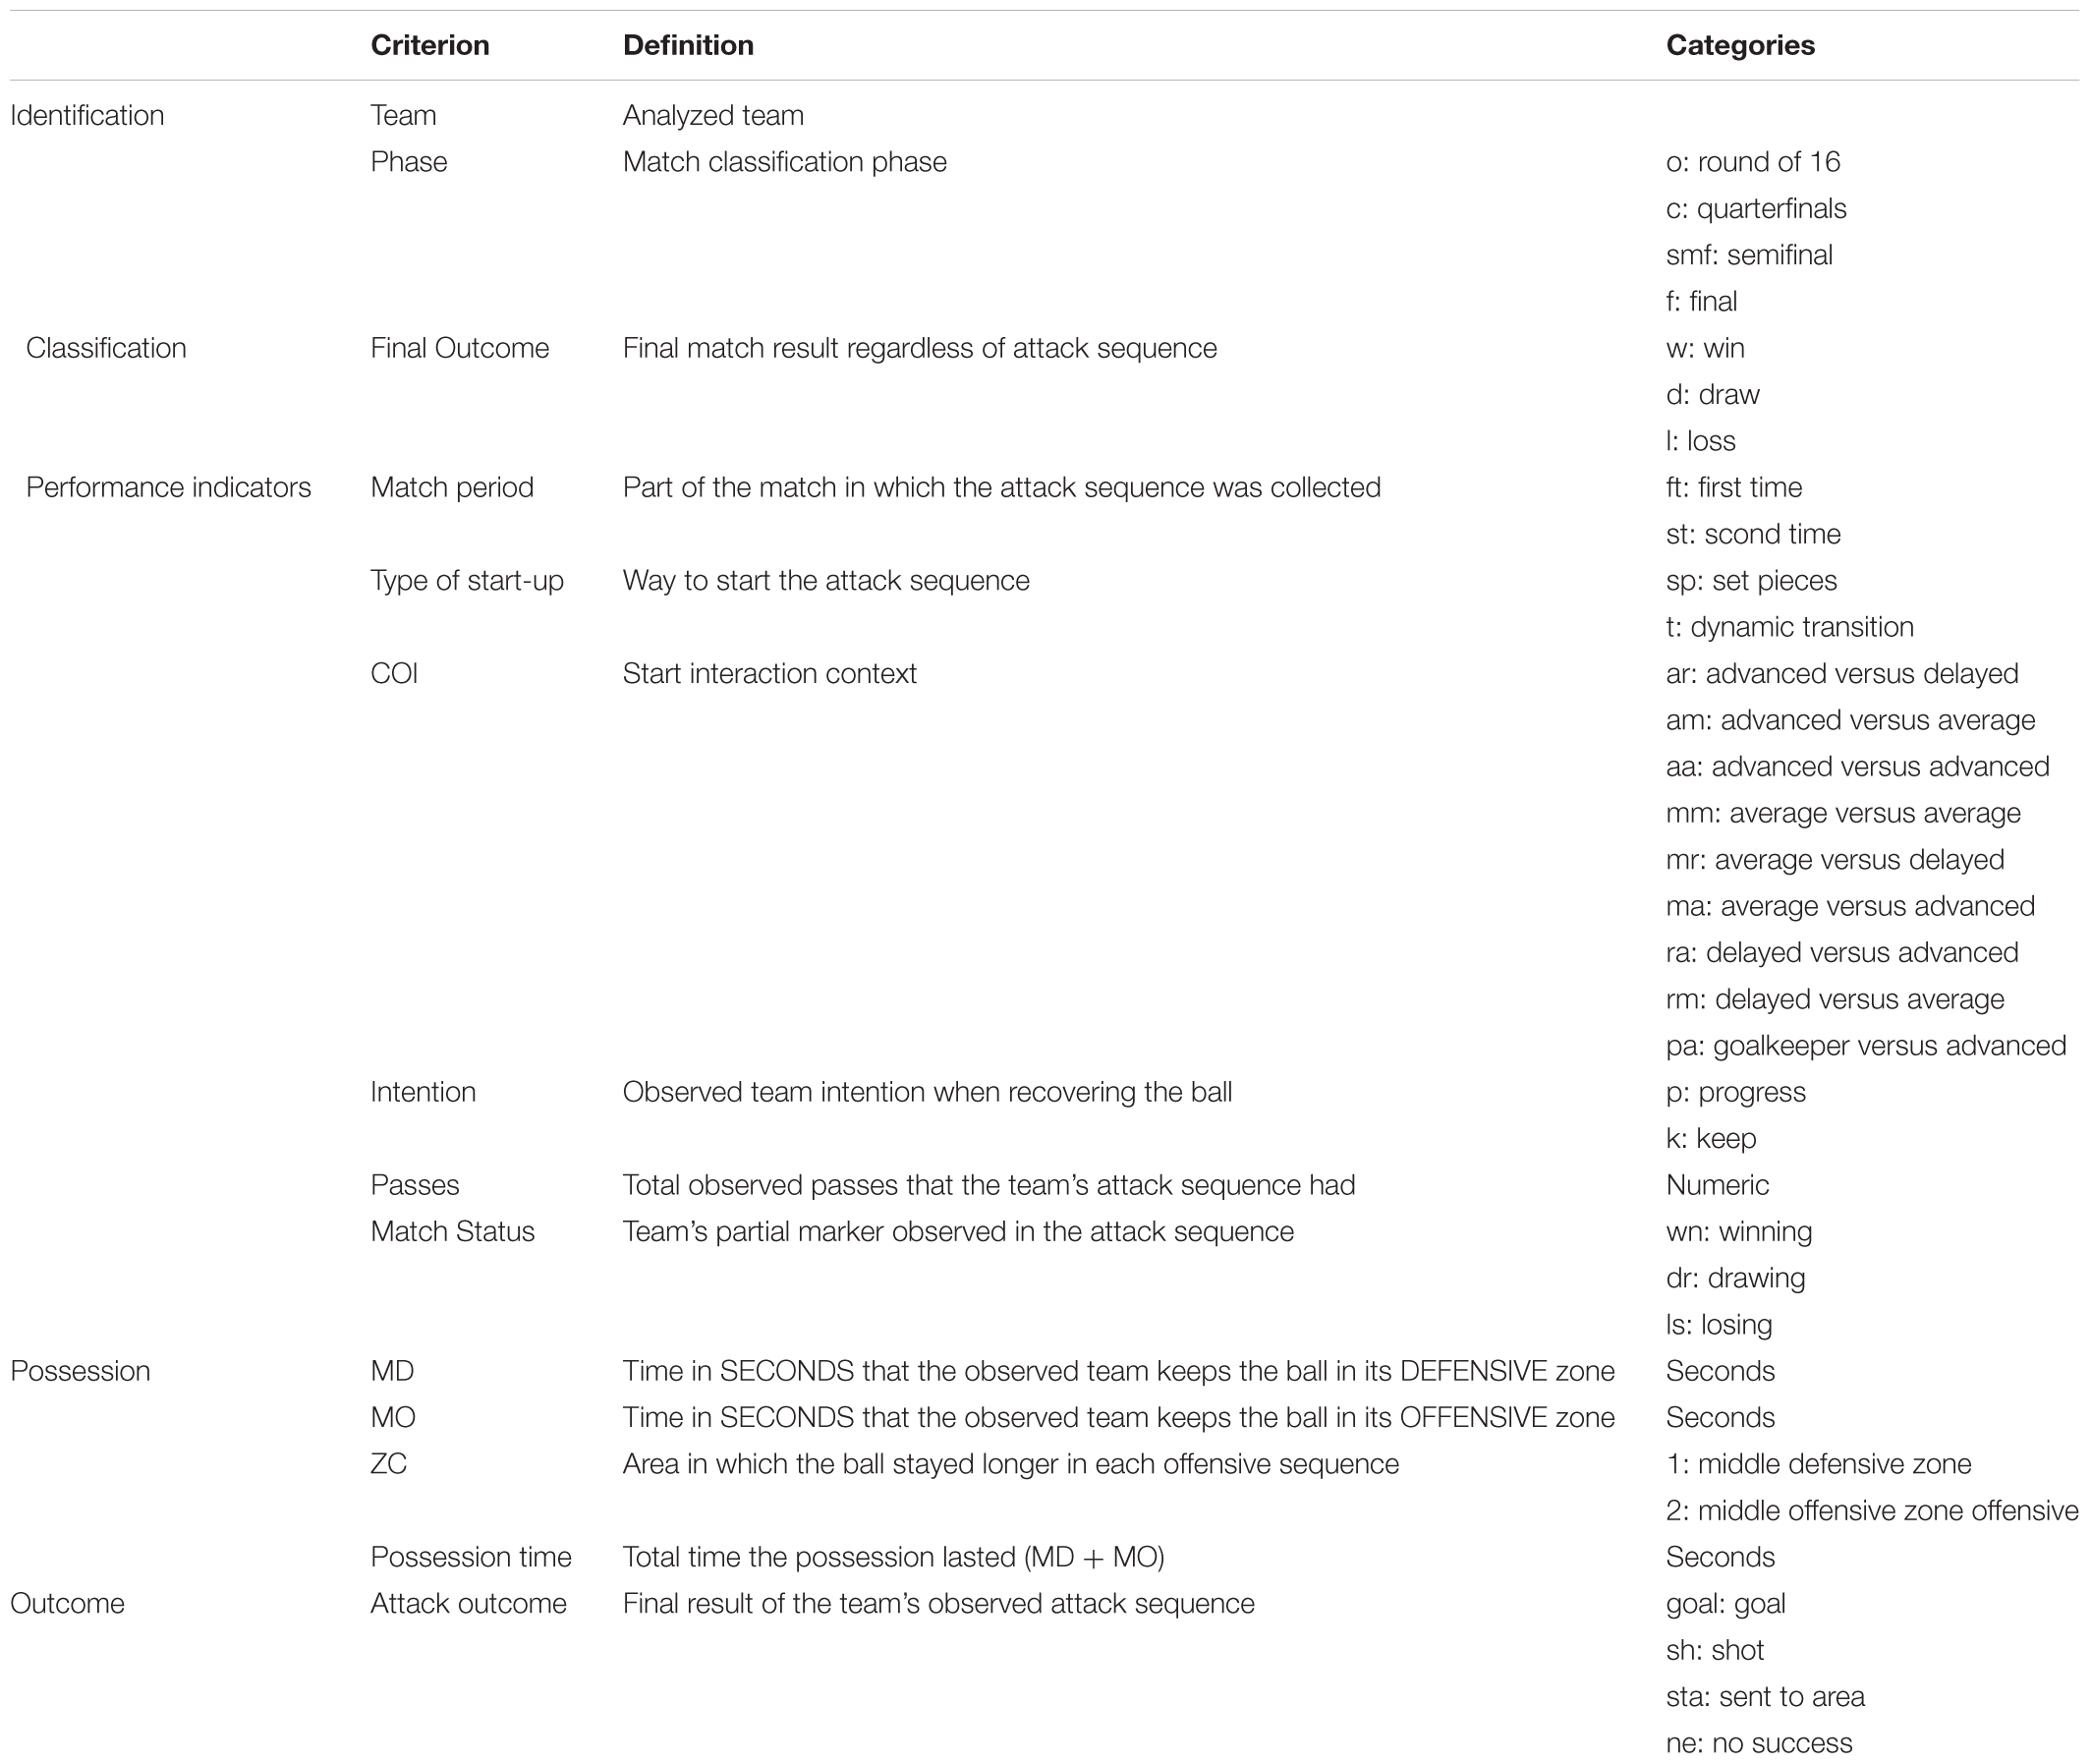
Table 1. Observational instrument (field format combined with category systems).
Data were recorded and coded in the LINCE software program (Gabin et al., 2012), and the MASS packages have been used (Venables and Ripley, 2002), and CAR (Fox and Weisberg, 2011) from the R software (v. 3.4.1).
Procedure
Matches were recorded from TV emitted images and were registered and analyzed post-event. Because the video recordings were public, confidentiality was not an issue and authorization was not required from the players observed or their representatives. Furthermore, the information cannot be considered either personal or intimate, as the research consisted solely of naturalistic observations in public places, and it was not anticipated that the recordings would be used in a manner that could cause personal harm (The American Psychological Association’s [APA’s], 2010). No experimental analysis involving human studies is performed in the study. Also, according to The Belmont Report (1978) the use of public images for research purpose does not required informed consent or the approval of an ethical committee. An ethics approval was therefore not required as per applicable institutional and national guidelines. Criteria used for the division of the teams into two groups, successful and unsuccessful, has been the outcome of the match (Lago-Peñas et al., 2010), excluding penalties. This way, all the teams that won their matches during reglementary time or extensions were classified as successful and teams who lost their matches as unsuccessful.
Data Quality Control
To try to ensure data reliability, all matches were registered and analyzed by four observers, all of them national soccer coaches with more than 10 years of experience in the field of training, teaching and research in football through observational methodology. In addition, the following training process was carried out: First, eight observing sessions were conducted on teaching the observers following the Losada and Manolov (2015) criteria and applying the criterion of consensual agreement (Anguera, 1990) among observers, so that recording was only done when agreement was produced. To ensure inter-reliability consistency of the data (Berk, 1979; Mitchell, 1979) the Kappa coefficient was calculated for each criterion, it revealed a strong agreement between observers, which means high reliability (0.92), taking Fleiss (1981) as a reference, who establishes a classification for the Kappa values where it characterizes as regular values found between 0.40 and 0.60, good between 0.60 to 0.75 and excellent above 0.75. Moreover, the procedure was repeated after 2 weeks (to exclude any learning effects) to check intraobserver reliability (Mitchell, 1979).
Statistical Analysis
A complete factorial design was applied to verify which were the factors that most influenced “Possession time” in successful and unsuccessful teams. The analysis of the variables and their interactions was carried out using the ANOVA technique. The residuals conditions were verified to check that normality conditions are met. In the case of non-compliance, a transformation of the response variable, “Total possession time” was performed, using a Box–Cox transformation where the parameter λ was estimated, by maximum likelihood.
After adapting the regression model and checking the adjustment to normality by calculating the Shapiro–Wilk statistic, the main effects and interaction relationships between the model’s significant variables were calculated. Finally, a set of predictions was calculated between the interactions that were significant, accompanied by their graphic representation, to compare successful and unsuccessful teams.
Results
Analysis started with data selection and filtering, using the variables: Type of start-up, Intention, Zc (field zone), Pt (possession time) and Match Status.
The model proposed for successful teams:
Results obtained from the variance analysis in successful teams are presented in Table 2.
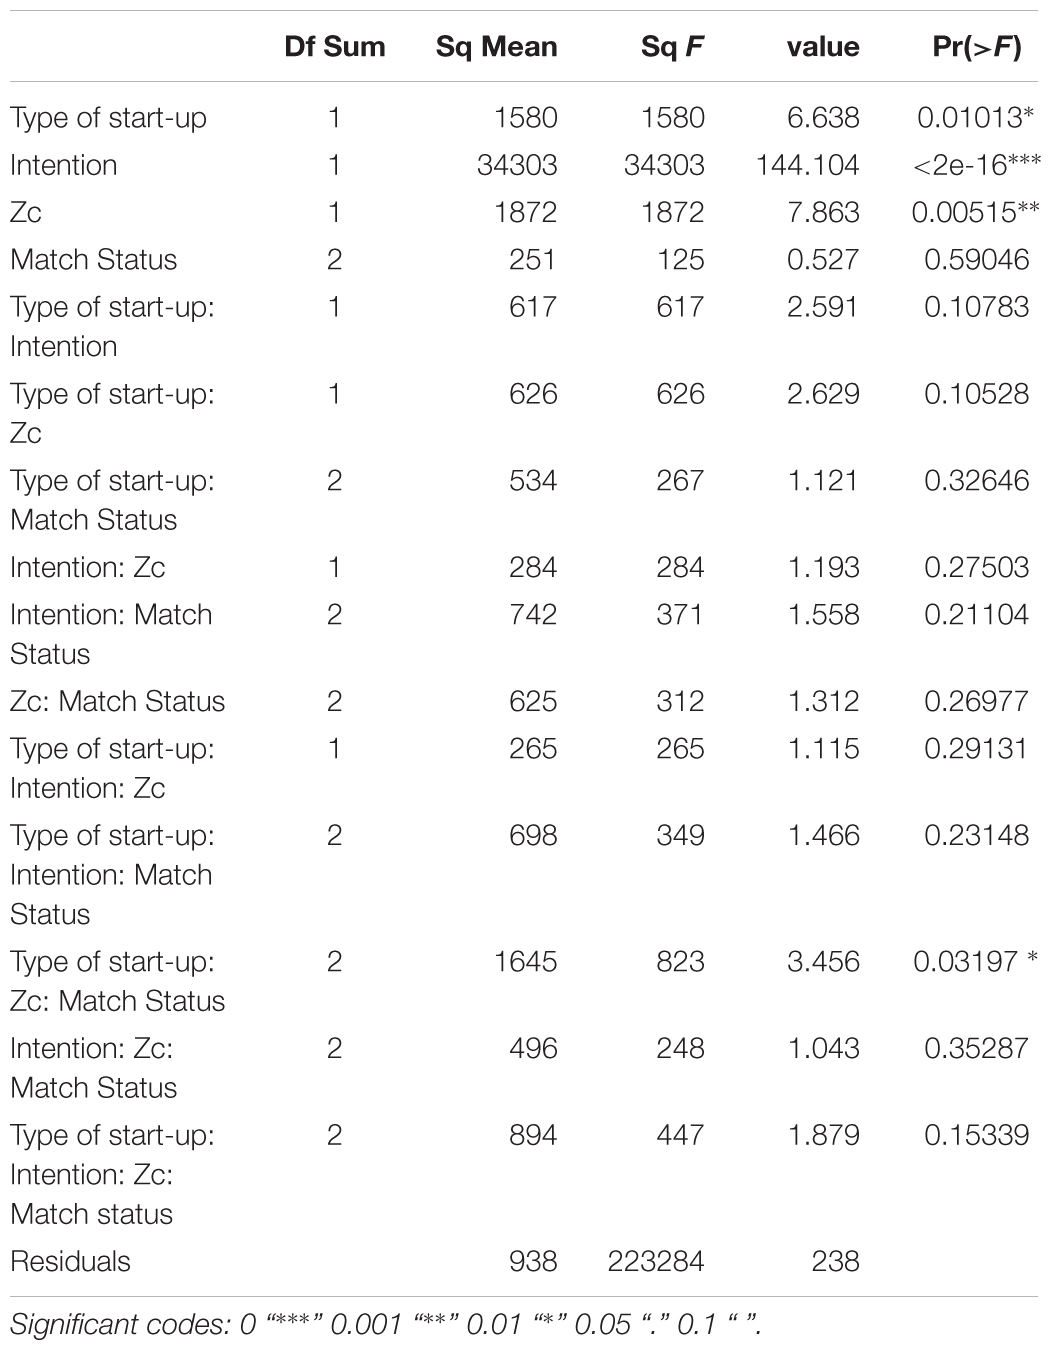
Table 2. ANOVA results for successful teams.
Significant effects in this analysis were: the simple effects, Type of start-up, Intention, Zc. No significant second-order effects, and only a significant third-order effect Type of star-up-Zc-Match Status.
The transformation of the response variable made with the Box–Cox method, offers the best maximization of the likelihood profile, estimating the λ value that in this case is around 0.02020202.
This transformation allows to obtain a Shapiro–Wilk test of normality of W = 0.99669 with a p-value = 0.2821, verifying the normality test of the residuals in the model.
The ANOVA was again calculated with the transformation, and the following results were obtained (Table 3):
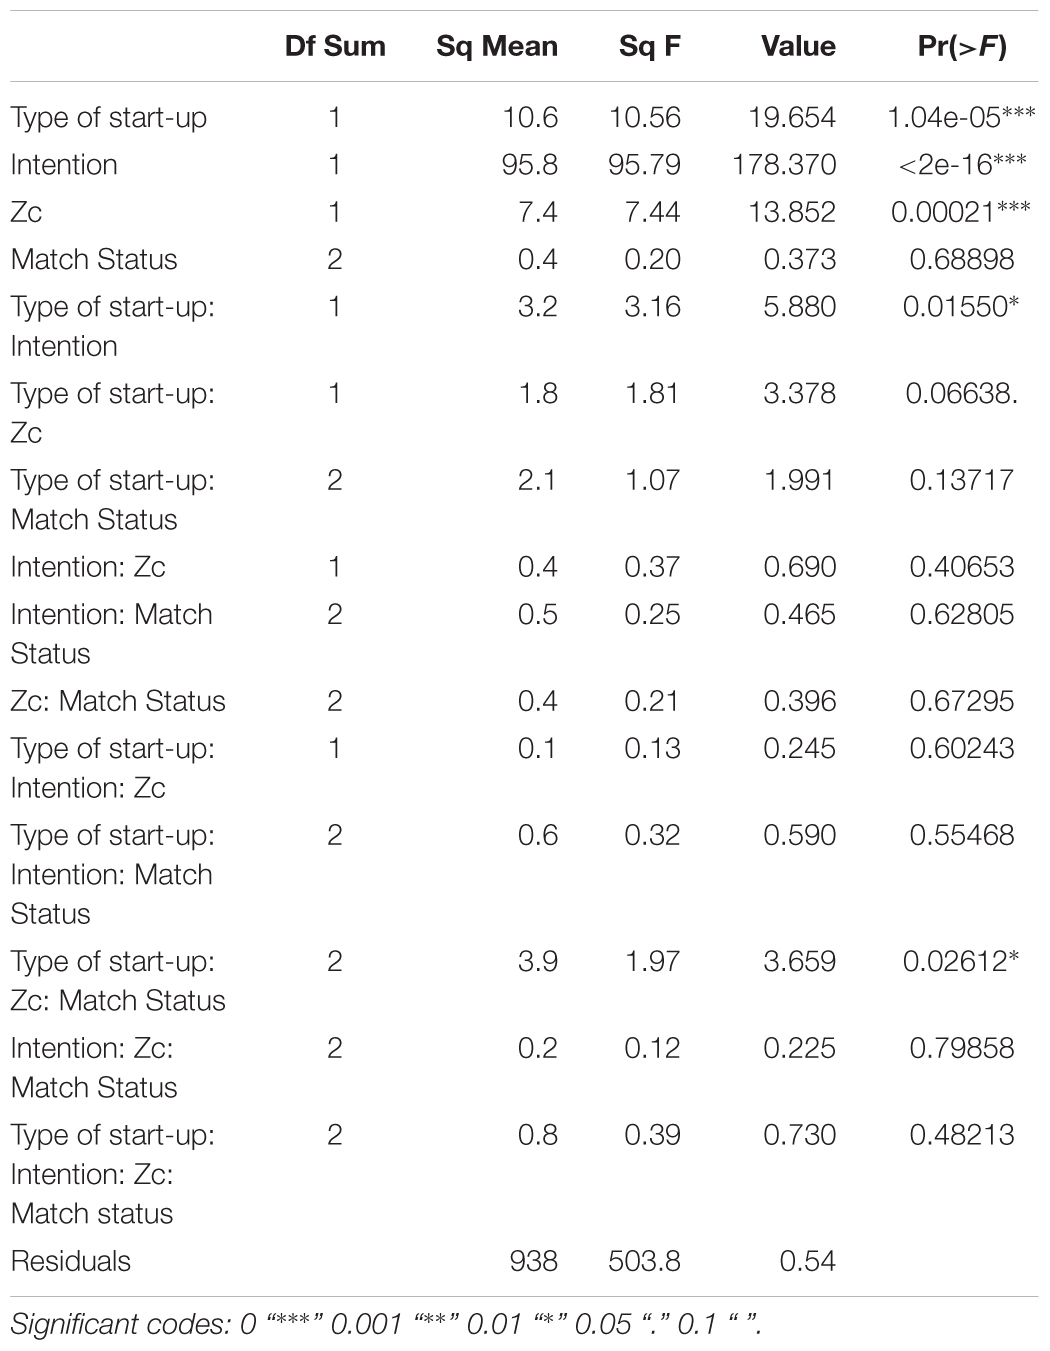
Table 3. ANOVA with transformation.
The significant effects in this analysis with the transformation applied were: simple effects, Type of start-up, Intention, Zc. Significant second-order effects, Type of start-up-Intention; Type of start-up-Zc. Finally, a third-order interaction Type of start-up-Zc-Match Status was significant.
Main Effects in Successful Teams
The main effects of the three significant simple factors were represented, with their values related to possession time (Figure 1). In this way, possession time with respect to Type of start-up was obtained, and was slightly greater when the start is given in a set piece than in transition. With respect to the Zc a greater possession of the ball was observed in the offensive zone. Regarding the factor Intention of the observed team, when it recovers the ball, it was observed that the greatest possession time was given in an intention to progress with the ball (p: progress), and somewhat less when the intention was to preserve the ball (k: keep). The combination of the three factors with the maximum time of possession would be: in offensive zone, starting from a set pieces and with the intention of progressing the ball.
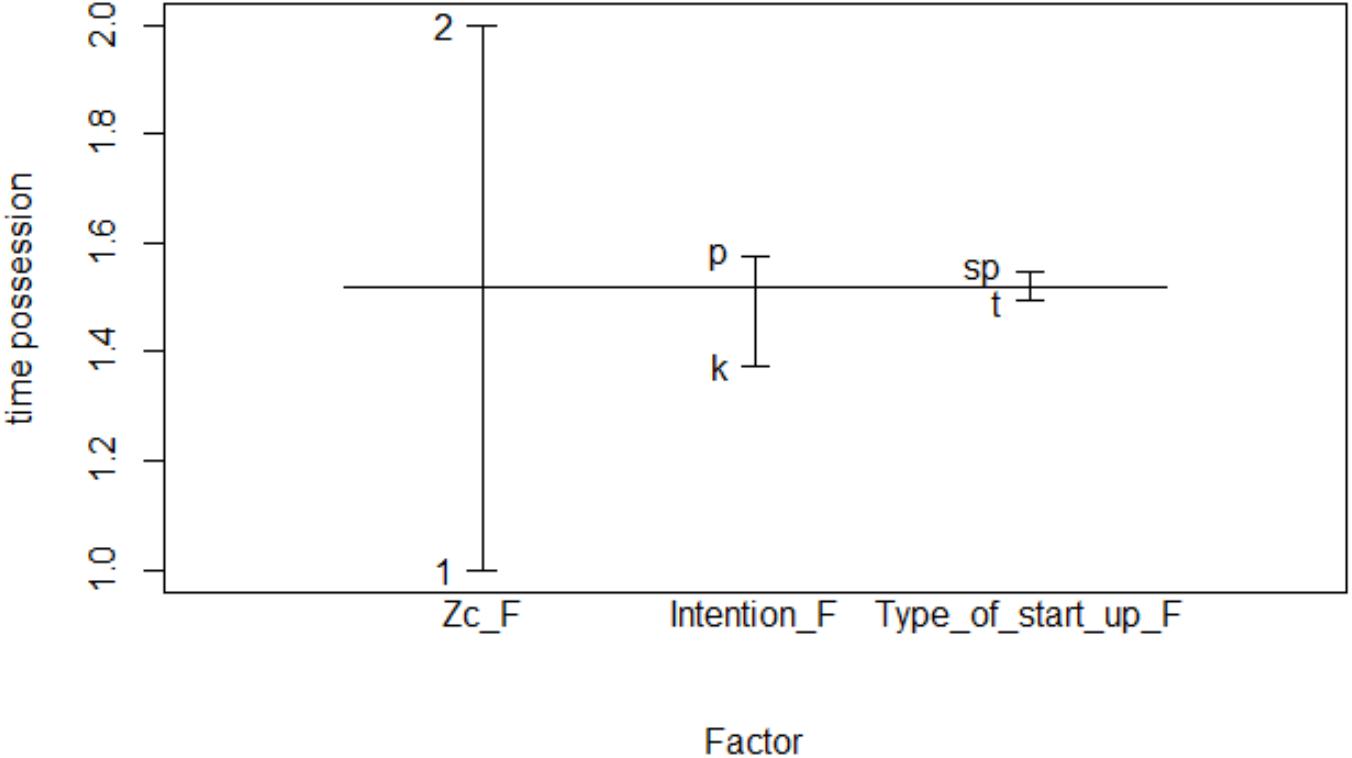
Figure 1. Main effects in successful teams.
Interactions in Successful Teams
The significant interactions of the model (Type of start-up-Intention; Type of start-up-Zc) were shown (Figure 2). In the case of the Type of start-up-Intention interaction, it could be seen how, both in the plays that started at set pieces and in transition, the greatest possession time occurred when the team intended to keep the ball.
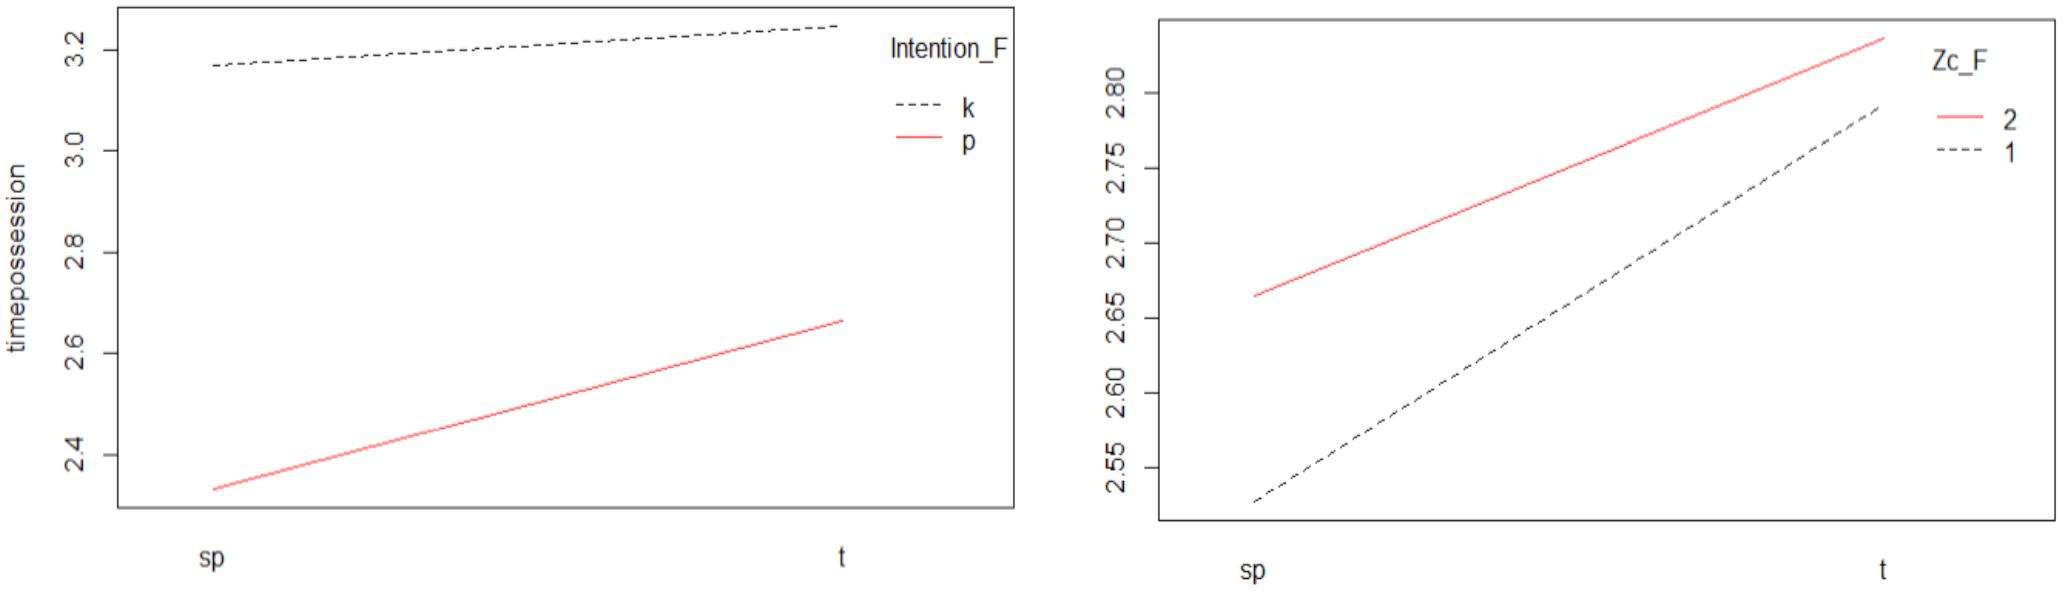
Figure 2. Interaction Type of start-up-Intention and Type of start-up-Zc.
In the Type of start-up-Zc interaction, a greater possession time was observed, both in the offensive zone, and the defensive zone, when the offensive phase was initiated by means of a transition.
Successful Teams Predictions
Predictions of the significant interactions in the model were established, based on possession time, obtaining the prediction’s most adjusted values, accompanied by their confidence intervals (Table 3).
A first prediction was formed by the Type of start-up-Intention factors. The values of the categories of the beginning of the sequence were presented in relation to team intention. In Table 4 it can be observed, how a greater possession of the ball will be produced when the play begins by means of a transition.
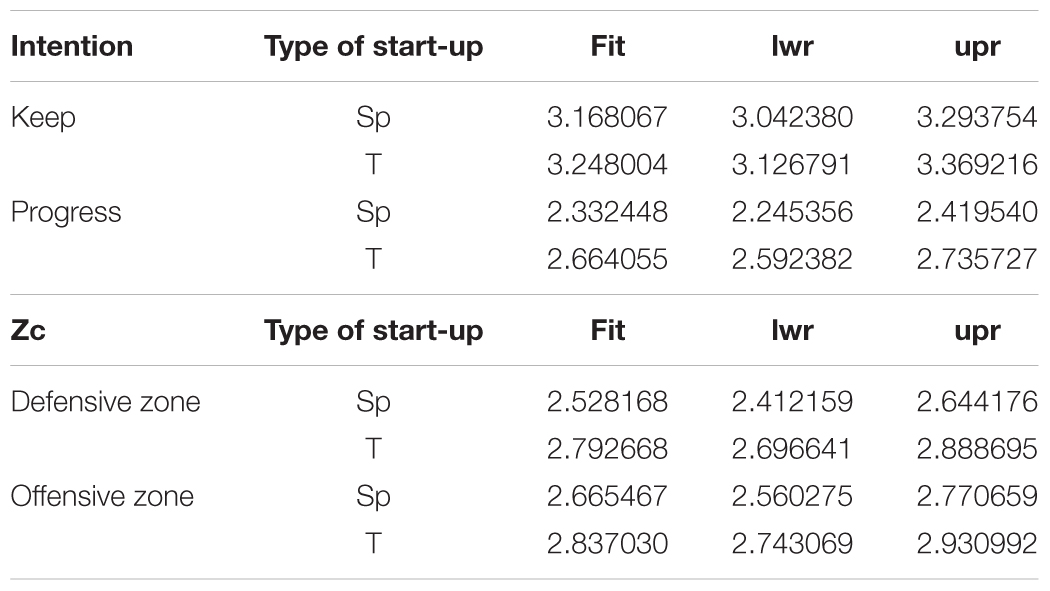
Table 4. Predictions based on possession time.
A second prediction configured by the factors Type of start-up-Zc, indicates that there will always be greater possession of the ball, both in the defensive and offensive zones, if initiated by means of a transition.
For the prediction of three factors Type of start-up-Zc-Match Status the following situations were collected (Table 5):
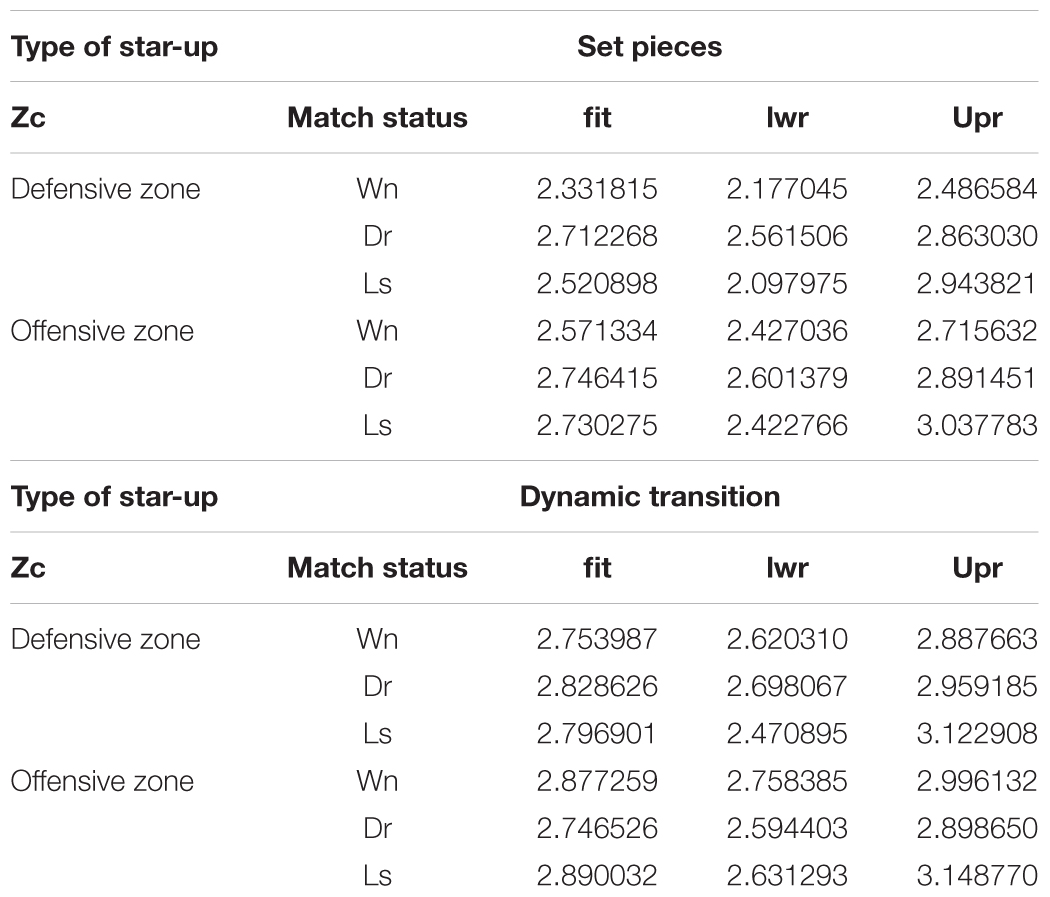
Table 5. Three factor prediction.
If the play is started at set pieces actions, there will be a longer possession time with a tied score, both in the defensive and offensive zones.
In the case of a start with transition. There will be a longer possession time in the defensive zone with the score tied and in the offensive zone with the marker losing.
The model proposed for unsuccessful teams was the same as for successful ones:
Once the lack of normality adjustment to residuals was verified and the transformation of the explained variable was carried out applying the Box–Cox transformation, with a value λ = 0.1414141, which allows obtaining a Shapiro–Wilk coefficient. W = 0.9974, and a p-value = 0.1798, justifying the adjustment of the residuals of the model.
Table 6 shows the results obtained in the variance analysis, with the new adjustment.
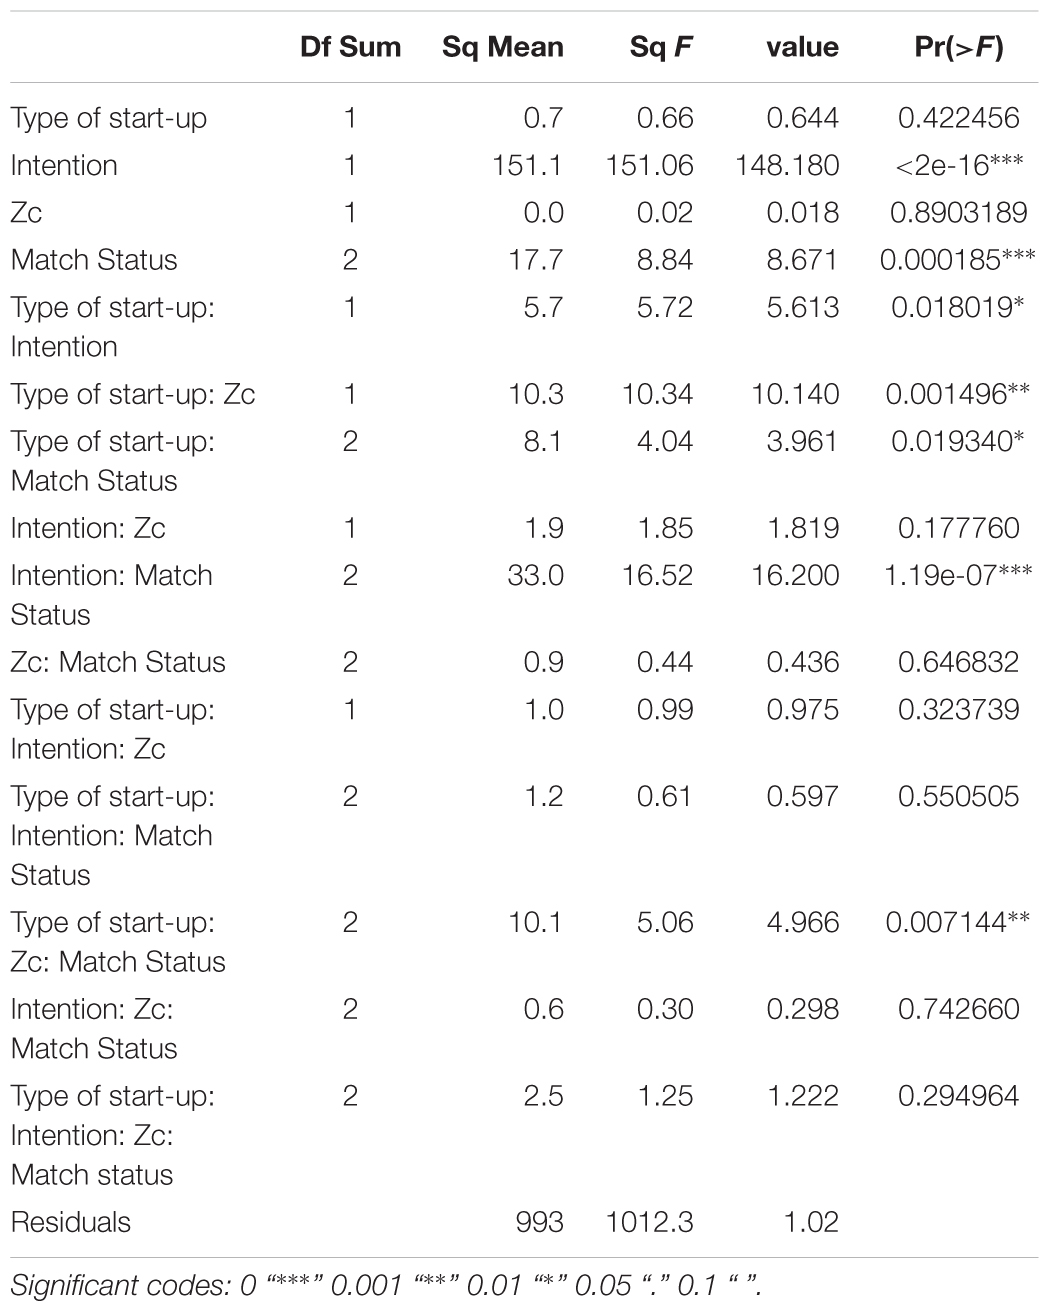
Table 6. ANOVA results with transformed dependent variable, for non-successful teams.
The following significant values were observed: simple effects: Intention (p < 0.001) y Match Status (p < 0.001). Second order effects: Type of start-up- Intention (p < 0.05); Type of start-up-Zc (p < 0.01); Type of start-up-Match Status (p < 0.05); Intention-Match Status (p < 0.001). Third order significant effect: Type of start-up-Zc-Match Status (p < 0.01)
Main Effects for Unsuccessful Teams
The main effects were represented, of the two significant simple factors and their values related to the time of possession (Figure 3). In this way, it was observed that the greatest possession time with respect to the Intention factor occurs when there was an intention to keep the ball (k: keep), and much less when the intention was to progress (p: progress). In the factor score (Match Status), the greatest possession time was given when the team was losing, while the shortest possession time was given when the team was winning. The combination of the two factors indicate that the maximum possession time is achieved, based on an intention to keep the ball, when the team is losing.
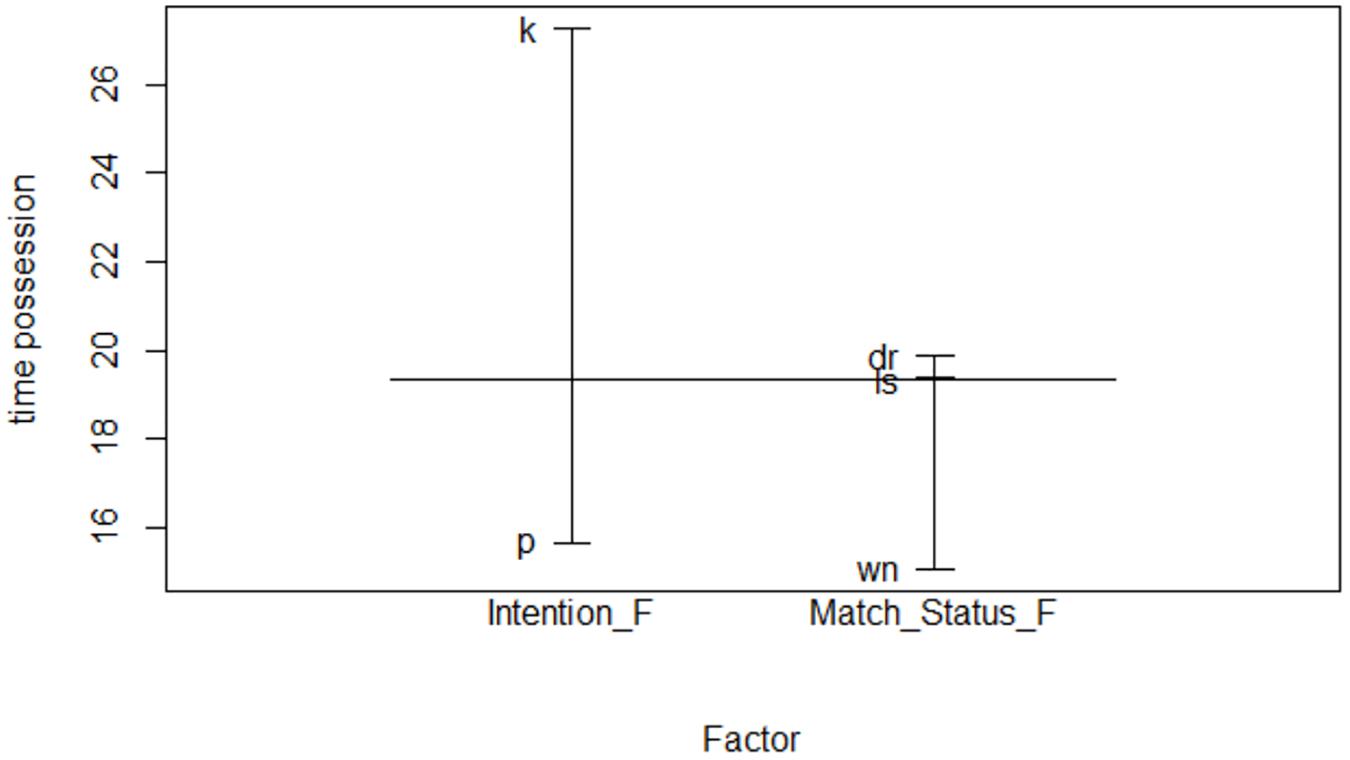
Figure 3. Main effects for unsuccessful teams.
Unsuccessful Teams Interactions
Figure 4 shows the significant interactions of the model, according to the type of start-up. In the case of the Type of start-up-Intention interaction, it could be observed that, in both types of starts of the play, the longest possession time occurred when the intention was to keep the ball.
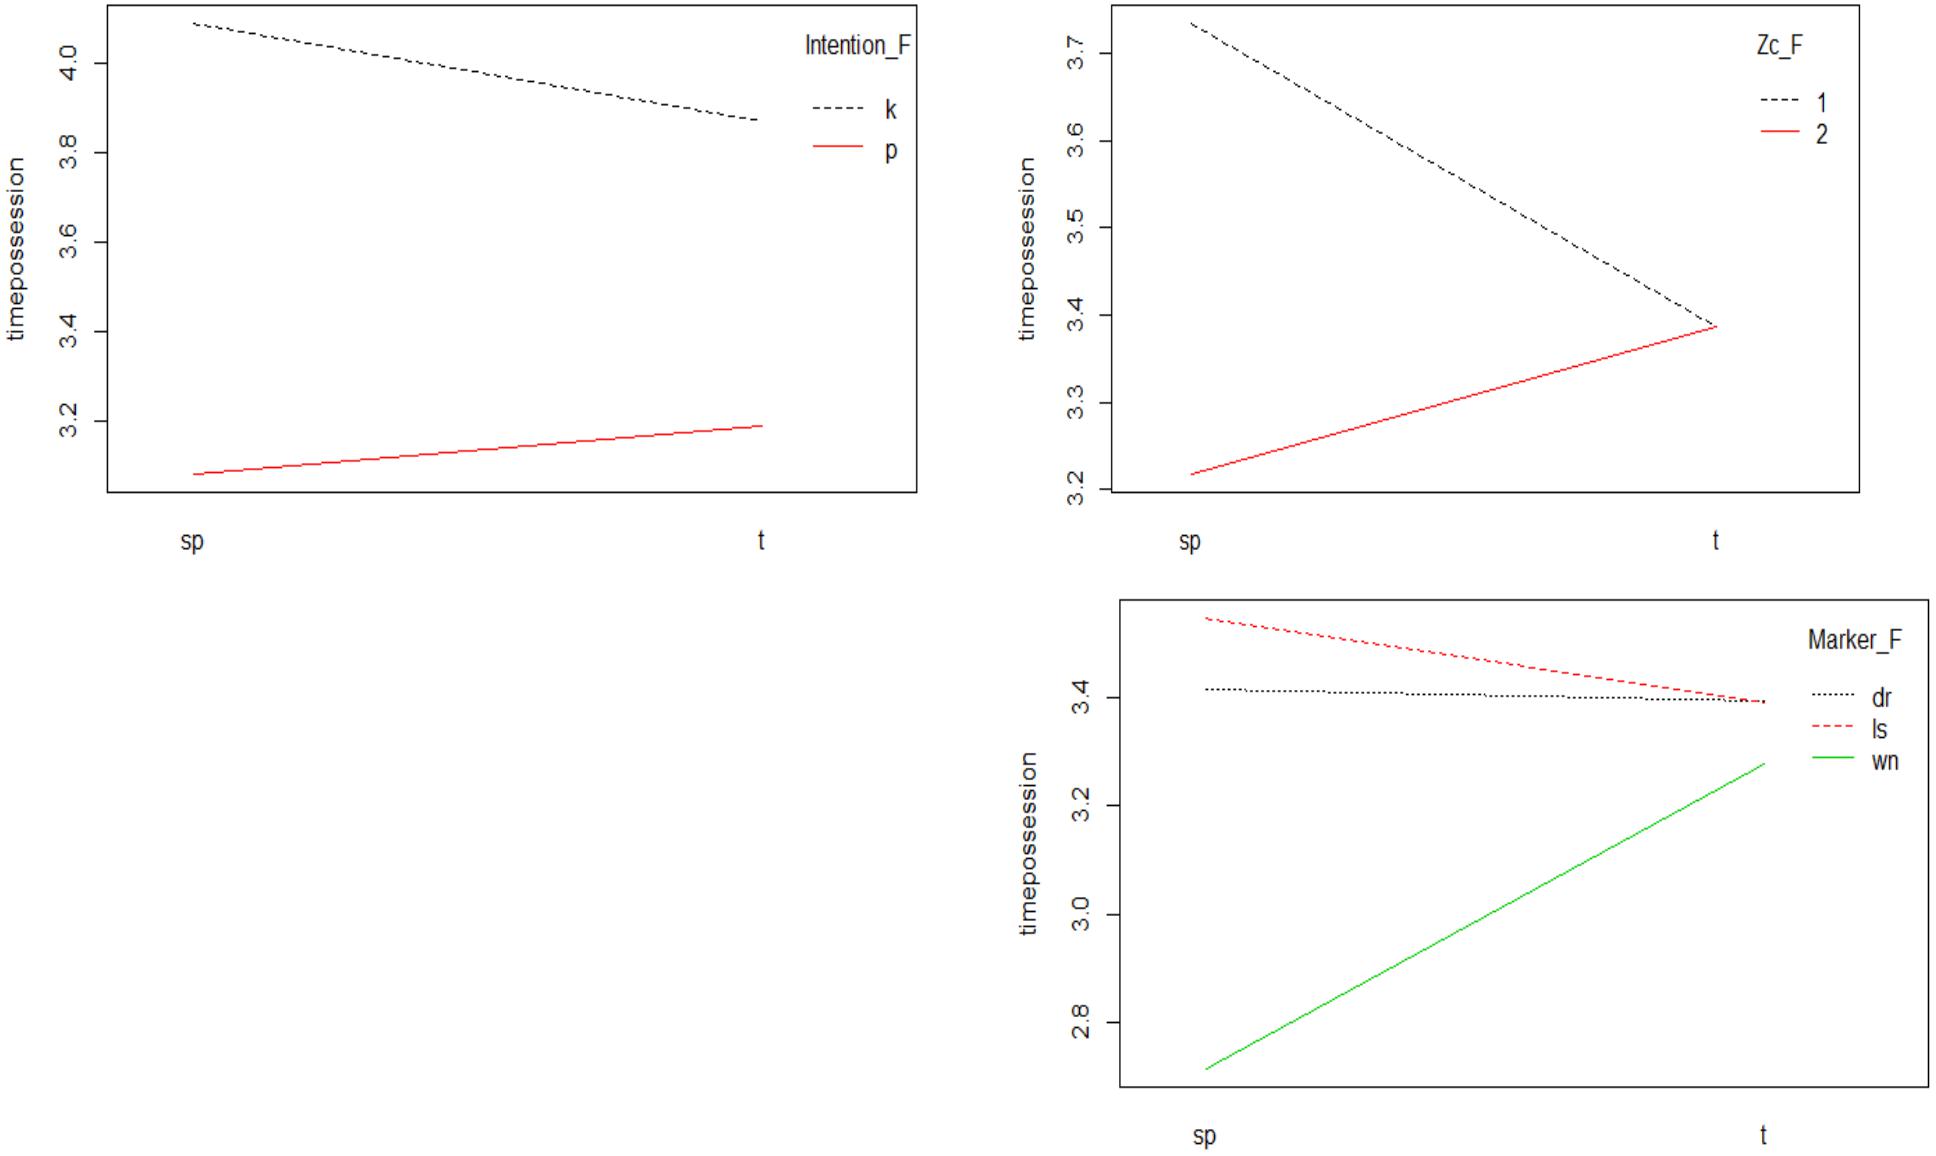
Figure 4. Interaction Type of start-up-Intention; Type of start-up-Zc and Interaction Type of star-up-Match Status.
In the Type of start-up-Zc interaction, the longest possession time was given in the case of starting with a set piece in the defensive zone. In the case of start with transition, possession time was the same in both zones.
In the Type of start-up-Match Status interaction, it was observed how the greatest possession time occurred when the team started the play on set pieces and was losing. The shortest time of possession occurred, both in the start of set actions and transition, with the score in favor. With the score drawing there were hardly any differences in possession time regardless of the form of start of the play.
If we analyze the Intention-Match Status interaction, we can observe how two intersections occurred (Figure 5). The draw marker interacted with the winning and losing markers. This is because possession time with a draw score was much greater when the intention was to keep the ball, whereas when the intention was to progress it decreased considerably. When the score was favorable (winning) shorter possession times occurred, regardless of the team’s intention. With the score losing, the longest possession time occurred with the intention of keeping the ball with a descent when the intention was to progress.
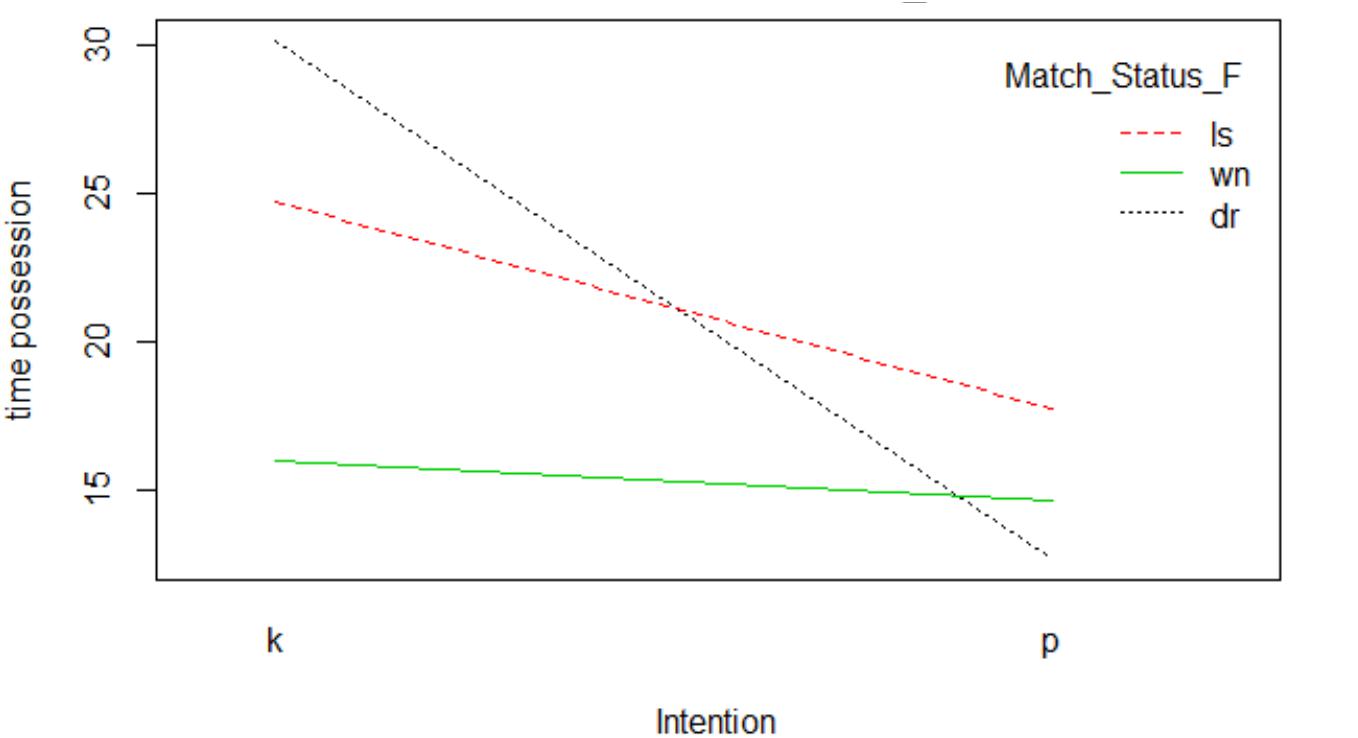
Figure 5. Interaction Intention-Match Status.
Unsuccessful Teams Prediction
Table 7 shows the results corresponding to the significant interactions with the Type of start-up. We can observe how a longer possession time will be produced when the play is initiated by means of a transition, whether it is intended to keep or progress.
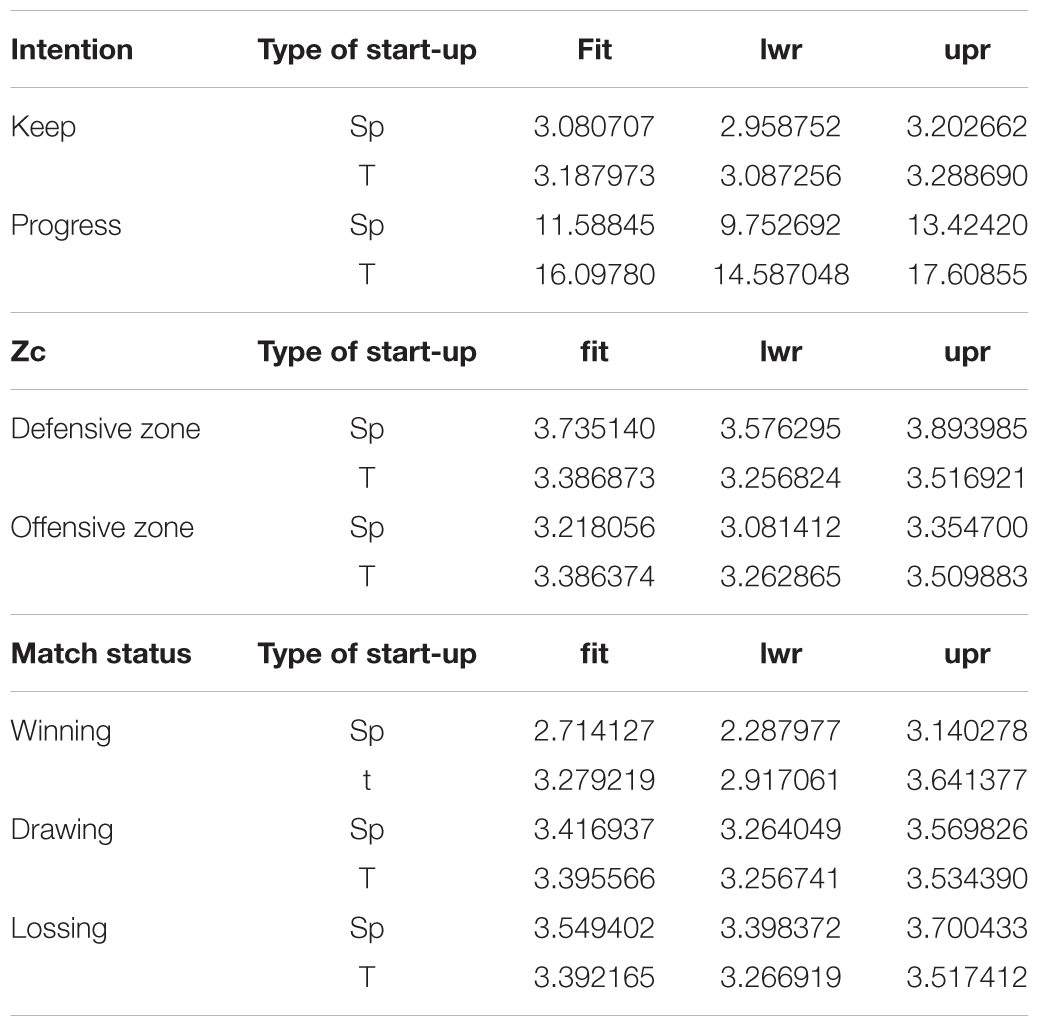
Table 7. Predictions in function to Type of start-up.
We can also observe how, in the defensive zone, greater possession will occur if it is started by means of a set pieces and, in the offensive zone, if it is initiated by means of a transition.
Finally, A greater possession time with the score winning will occur when the play is initiated by means of a transition. Both with the score losing and drawing, there will be a longer possession time when set pieces actions start.
In Table 8, we present the significant predictions based on Match status. If we analyze the predictions based on team intention and partial result we can see how, with the score drawing, there will be a longer possession time if you try to keep the ball and, with the result of losing, there will be a greater possession if you try to progress.
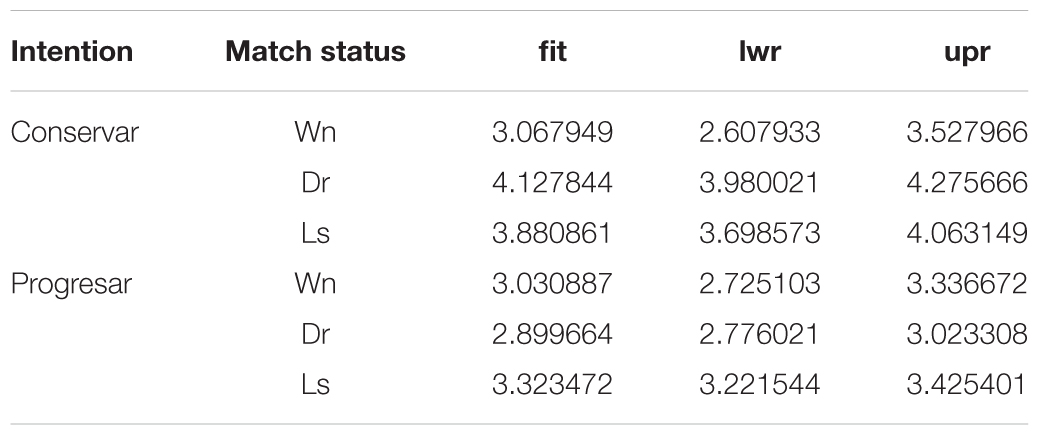
Table 8. Prediction according to tactical intention – marker.
For the prediction of three factors (Type of start-up-ZC and Match Status), the following situations may be possible (Table 9):
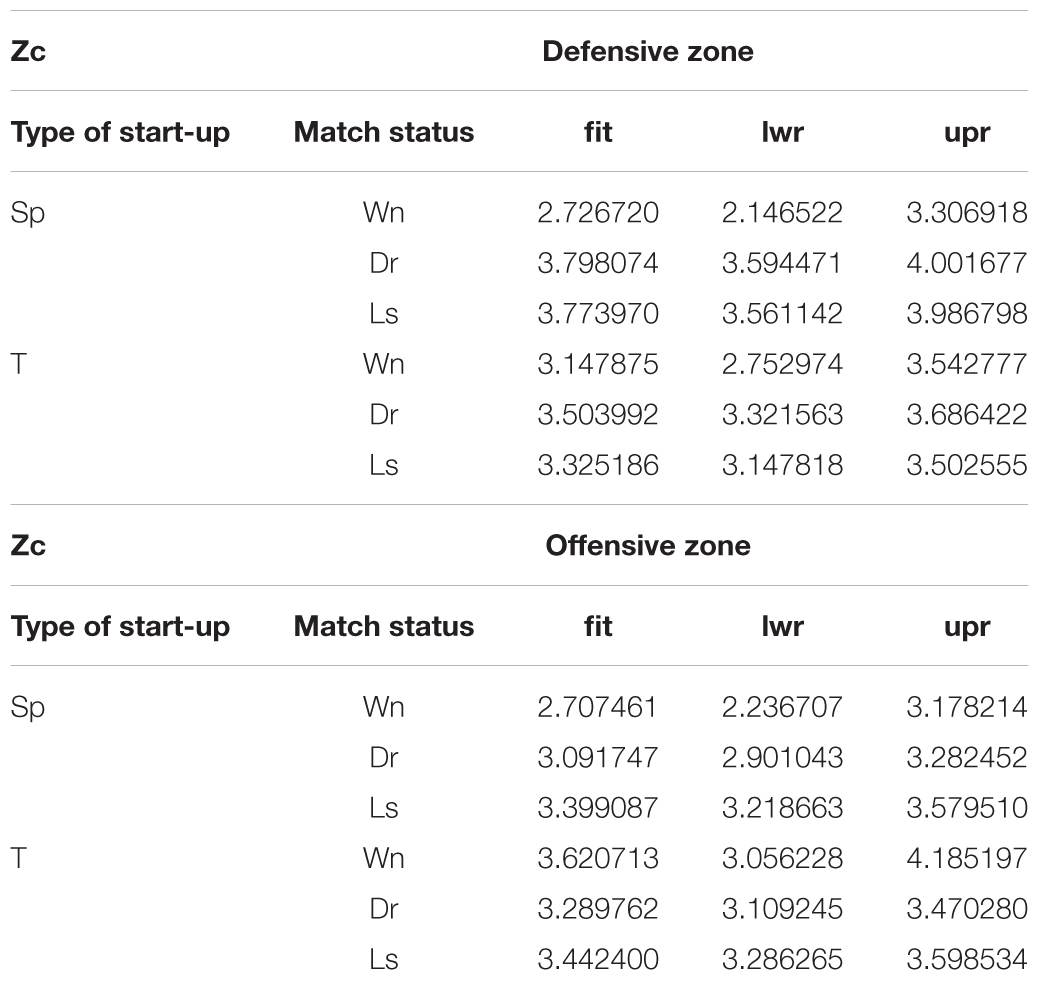
Table 9. Prediction field zone-type of start-up-marker.
In the defensive zone will be greater possession when the score is drawing, whether the play is initiated by means of a transition or set pieces.
There will be greater possession of the ball in offensive zone when the set piece starts with the score losing, and, if it starts with a transition, with the score winning.
Discussion
Ball possession has been identified as a differentiating performance indicator between successful and unsuccessful teams (Grant et al., 1999a,b; Hook and Hughes, 2001; Jones et al., 2004; Bloomfield et al., 2005; Carling et al., 2005; Hughes and Franks, 2005; Casal et al., 2015, 2017). This work was proposed with the intention of discriminating possession time qualitative and quantitatively in successful and unsuccessful teams from a mixed methods perspective, to try to identify an effective ball possession model. The results have allowed us to identify significant differences between ball possession models of both groups of teams.
Specifically, based on the results of the simple effects, we have detected that in successful teams possession time is influenced by, the form of start of the offensive phase, the intention of the team once possession is recovered and possession zone. Successful teams are characterized by having longer possessions in the offensive zone when they start at set pieces actions and with the intention of progressing. On the other hand, in unsuccessful teams possession time of the offensive phase is influenced by team intention, once the possession of the ball has been recovered, and by the match status. In the latter case, our results corroborate those obtained in previous studies (Sasaki et al., 1999; James et al., 2004; Jones et al., 2004; Bloomfield et al., 2005; Lago-Peñas and Martín, 2007; Taylor et al., 2008; Lago-Peñas, 2009). These teams will have longer possessions when they are losing, results in line with some previous works (Sasaki et al., 1999; Jones et al., 2004; Bloomfield et al., 2005; Lago-Peñas and Martín, 2007; Lago-Peñas, 2009) and with the intention of keeping the ball. Of these results, perhaps the most significant is to indicate how the partial result, in successful teams, does not influence possession time. Indicating, in this case, that these teams do not vary their game model based on match status, while unsuccessful ones do, coinciding with the results of Bloomfield et al. (2005). These data differ from some of the previously mentioned works since, their results show the same pattern of ball possession, for both groups of teams, depending on the evolution of the match status. This circumstance may indicate an evolution of the game of successful teams toward more stable possession models, and less influenced by the evolution of the match status.
If we analyze the results obtained when studying the interaction of the different variables selected with possession time, we can observe how in the second order interactions there are also significant differences between both groups of teams. While successful teams are characterized by having longer possessions in the offensive zone, when they start possession through a transition, unsuccessful teams have longer possessions in the defensive zone, initiating the attack through set pieces ball actions and, above all, when they are losing. We cannot compare these results with previous works, since we have not found any study that performs a multivariate analysis with the indicators selected here. Some previous works (Casal et al., 2017) have also found that successful teams are characterized by possessions of longer duration in the offensive zone and unsuccessful ones, on the contrary, in the defensive zone. This can be explained because successful teams are supposed to have a higher technical-tactical level, and are able to overcome the greater defensive pressure and accumulation of players near the opposing goal and, on the contrary, unsuccessful teams will only be able of maintaining possession in those areas of lower defensive pressure that, in general, are close to your goal.
Finally, observing the data obtained in third-order interactions, which will allow us to make predictions about how possession time of the team will be, according to the relationships between the selected variables. In this case, we can check how the main differences between both teams occur in the following cases:
Successful teams will always have greater possession time, both in defensive and offensive zone in the event that the play is initiated by means of a transition. These data are in line with what was previously stated when finding that successful teams have longer possession times than unsuccessful ones, indicating that higher-level teams try to control the game, and take the initiative, through ball possession, helped by the high individual performances of their players. In the case of unsuccessful teams, if the offensive phase starts on set pieces actions, the greatest possession will occur in the defensive zone and, if the play is initiated by means of a transition, in the offensive zone. This can be explained because, in a set pieces action, the opposing team has enough time to organize defensively and, therefore, lower level teams will have greater difficulties to advance toward areas closer to the opponent’s goal. On the contrary, if they start the offensive phase after a recovery of the ball, it may be easier for them to progress to more advanced zones, due to the defensive disorganization of the opposing team, since this is in an open disposition, with greater inter and intra-line space.
If we take into account the type of start-up and the match status, successful teams will produce their greatest possession with a score draw and starting the play by means of a set pieces ball action. This data shows, once again, the control of the game performed by higher level teams, maintaining possession of the ball. In the case of unsuccessful teams, if they are winning, they will have greater possession initiating the play through a transition. As we discussed earlier, in this circumstance of the game, the opposing team will perform a defensive pressure, because of their need to score as much, and the lower level of unsuccessful teams will not allow them to maintain possession for a long time unless they initiate the attack through a dynamic transition, without leaving time for the rival team to organize defensively. If they find themselves losing or drawing, the possession will be longer if the play starts at set pieces actions. In this case, the rival team does not have the need to press defensively, which will facilitate the team possession.
If we consider the type of start-up, the match status and field zone. In this case, we see how successful teams will always have longer possessions initiating the offensive plays by means of a transition and this possession will be more extensive in the defensive zone if they are drawing and in the offensive zone if they are winning. In the first case, it can be considered a normal behavior, since not having the need to score so much, can give up on counterattacks and its main objective can be focused on keeping the ball, as a defensive method. The second behavior is somewhat contradictory, since, if they are winning, it is normal for the opposing team to perform defensive pressure and this pressure will be greater near their goal, so maintaining possession in this zone will be more difficult that to do it near the own goal, where the pressure of the adversary team is smaller. This behavior could be explained by the need to keep the ball as far as possible from the own goal, to avoid a possible chance of an opponent’s goal, in the case of losing the ball to the opponent. On the other hand, unsuccessful teams, in the case of being drawing, will always have more extensive possessions in the defensive zone, regardless of the type of start of the play. In addition, in spite of being able to have the will to progress toward the rival goal, it lacks the technical-tactical mechanisms necessary for it, hence that it passes great moments of the game in the initial gestation phase of the offensive game. Adversary teams, in this situation, do not have the need to quickly recover the possession of the ball, and may allow it to be in the power of the opposing team, but away from their own goal. For these teams possessions will be of greater duration in the offensive zone, losing, and initiating the play by means of a set pieces action and winning, by means of a transition. In the first case, the need to score as much, will provoke a more advanced defensive pressure and possession of the ball closer to the area of the opposing team’s goal. The second situation has already been explained previously, in this case the defensive pressure of the rival team will only allow to have the ball a minimum of time in control, until they are able to make a counterattack.
Based on the results obtained, we can prove how our hypothesis regarding possession analysis from the mixed methods perspective was confirmed, which would allow us to differentiate the possessions of successful and unsuccessful teams and describe a more effective possession style. The application of the results of this study in the field of intervention will affect the tactical-strategic aspects of the team’s game. This knowledge will allow the elaboration of intervention strategies to optimize team possession. However, the results of this work cannot be generalized to all matches and competitions, because only national teams have been analyzed and in a specific competition. As some previous works indicate (James et al., 2004; Bloomfield et al., 2005; Tucker et al., 2005; Lago-Peñas and Martín, 2007; Lago-Peñas, 2009; Collet, 2013), the type of competitions influences team possession, therefore, it will be necessary to continue investigating with different samples that cover different competitions to try to generalize the results and try to identify which are the key elements that differentiate or characterize the offensive possessions of successful teams, with the objective of trying to identify a more effective possession model.
Conclusion
This work has been carried out with the intention of identifying which are the performance indicators that influence possession time in elite soccer teams, check if these indicators differ between successful and unsuccessful teams and finally, identify a more effective possession model.
It has been possible to verify the existence of differences between the performance indicators that influence possession time between successful and unsuccessful teams. Specifically, in successful teams possession time is influenced by: Type of start-up, intention and field zone. On the other hand, possession time of unsuccessful teams is determined fundamentally by intention and match status. We have also noted how the phase of the tournament in which the match is played, the match period, the interaction context and the number of passes do not influence team possession time. Finally, the models to execute the offensive phase that guarantee a greater possession of the ball have also been different for both groups of teams.
Data Availability
The datasets generated for this study are available on request to the corresponding author.
Author Contributions
CC developed the project, review the literature, and wrote the manuscript. JL was responsible for performed analysis and the method section. MA wrote part of the manuscript and revised the content critically and RM revised the content and supervised the drafting of the manuscript.
Funding
This work was supported by Spanish government project: La actividad física y el deporte como potenciadores del estilo de vida saludable: Evaluación del comportamiento deportivo desde metodologías no intrusivas (Secretaría de Estado de Investigación, Desarrollo e Innovación del Ministerio de Economía y Competitividad) during the period 2016-2018 (Grant DEP2015-66069-P; MINECO/FEDER, UE), Generalitat Valenciana project: Análisis observacional de la acción de juego en el fútbol de élite (Consellería d’Educació, Investigació, Cultura I Sport) during the period: 2017-2019 (Grant GV2017-004), and also Universidad Católica de Valencia “San Vicente Mártir” project: Estudios en el deporte de élite desde los Mixed Methods: técnicas de análisis de estudios comparativos, during the period 2018 (Grant UCV2017/230-002). Lastly, second, third and fourth authors also acknowledge the support of University of Barcelona (Vice-Chancellorship of Doctorate and Research Promotion).
Conflict of Interest Statement
The authors declare that the research was conducted in the absence of any commercial or financial relationships that could be construed as a potential conflict of interest.
References
Anguera, M. T. (1990). “Metodología observacional,” in Metodología de la investigación en Ciencias del Comportamiento, eds J. Arnau, M. T. Anguera, and J. Gómez (Murcia: Secretariado de Publicaciones de la Universidad de Murcia), 125–236.
Anguera, M. T., Blanco-Villaseñor, A., Hernández-Mendo, A., and Losada, J. (2011). Diseños observacionales: ajuste y aplicación en psicología del deporte [Observational designs: their suitability and application in sports psychology]. Cuadernos Psicol. Deporte 11, 63–76.
Anguera, M. T., Blanco-Villaseñor, A., Losada, J. L., and Portell, M. (2018a). Pautas para elaborar trabajos que utilizan la metodología observacional. Anuario Psicol. 48, 9–17. doi: 10.1016/j.anpsic.2018.02.001
Anguera, M. T., Blanco-Villaseñor, A., Losada, J. L., Sánchez-Algarra, P., and Onwuegbuzie, A. J. (2018b). Revisiting the difference between mixed methods and multimethods: is it all in the name? Qual. Quant. 52, 2757–2770. doi: 10.1007/s11135-018-0700-2
Anguera, M. T., Blanco-Villaseñor, Á, Losada, J. L., and Hernández Mendo, A. (2000). La metodología Observacional en el Deporte: Conceptos Básicos. Lecturas: Educación Física y Deportes.
Anguera, M. T., Camerino, O., Castañer, M., Sánchez-Algarra, P., and Onwuegbuzie, A. J. (2017). The specificity of observational studies in physical activity and sports sciences: moving forward in mixed methods research and proposals for achieving quantitative and qualitative symmetry. Front. Psychol. 8:2196. doi: 10.3389/fpsyg.2017.02196
Bakeman, R. (1978). “Untangling streams of behavior: sequential analysis of observation data,” in Observing Behavior: Data Collection and Analysis Methods, Vol. 2, ed. G. P. Sackett (Baltimore: University of Park Press),63–78.
Berk, R. (1979). Generalizability of behavioral observations: a clarification of interobserver agreement and interobserver reliability. Am. J. Ment. Defic. 83, 412–460.
Bloomfield, J. R., Polman, R. C. J., and O’Donoghue, P. G. (2005). Effects of score-line on team strategies in FA Premier League Soccer. J. Sports Sci. 23, 192–193.
Carling, C., Williams, A. M., and Reilly, T. (2005). Handbook of Soccer Match Analysis: A Systematic Approach to Improving Performance. Abingdon: Routledge.
Casal, C. A., Andújar, M. A., Losada, J. L., Ardá, T., and Maneiro, R. (2016). Identification of defensive performance factors in the 2010 FIFA World Cup South Africa. Sports 4:54. doi: 10.3390/sports4040054
Casal, C. A., Losada, J. L., and Ardá, T. (2015). Análisis de los factores de rendimiento de las transiciones ofensivas en el fútbol de alto nivel. Rev. Psicol. Deporte 24, 103–110.
Casal, C. A., Maneiro, R., Ardá, T., Marí, F. J., and Losada, J. L. (2017). Possession zone as a performance indicator in football. the game of the best teams. Front. Psychol. 8:1176. doi: 10.3389/fpsyg.2017.01176
Collet, C. (2013). The possession game? A comparative analysis of ball retention and team success in European and international football, 2007–2010. J. Sports Sci. 31, 123–136. doi: 10.1080/02640414.2012.7272455
Fox, J., and Weisberg, S. (2011). An {R} Companion to Applied Regression, 2nd Edn. Thousand Oaks, CA: Sage.
Gabin, B., Camerino, O., Anguera, M. T., and Castañer, M. (2012). Lince: multiplatform sport analysis software. Proc. Soc. Behav. Sci. 46, 4692–4694. doi: 10.1016/j.sbspro.2012.06.320
Grant, A. G., Williams, A. M., and Hocking, M. (1999a). Analysis of successful and unsuccessful teams in the 1999 Women’s World Cup. Insight 3, 10–12.
Grant, A. G., Williams, A. M., and Reilly, T. (1999b). An analysis of the successful and unsuccessful teams in the 1998 World Cup. J. Sports Sci. 17:827.
Hughes, M., and Franks, I. (2005). Analysis of passing sequences, shots and goals in soccer. J. Sports Sci. 23, 509–514. doi: 10.1080/02640410410001716779
James, N., Jones, P. D., and Mellalieu, S. (2004). Possession as a performance indicator in soccer. Int. J. Perform. Anal. Sport 4, 98–102. doi: 10.1080/24748668.2004.11868295
Johnson, R. B., Onwuegbuzie, A. J., and Turner, L. A. (2007). Toward a definition of mixed methods research. J. Mixed Methods Res. 1, 112–133. doi: 10.1177/1558689806298224
Jones, P. D., James, N., and Mellalieu, S. (2004). Possession as a performance indicator in soccer. Int. J. Perform. Anal. Sport 4, 98–102. doi: 10.1080/24748668.2004.11868295
Kormelink, H., and Seeverens, T. (1999). Match Analysis and Game Preparation. Spring City, PA: Reedswain.
Lago-Peñas, C. (2009). The influence of match location, quality of opposition, and match status on possession strategies in professional association football. J. Sports Sci. 27, 1463–1469. doi: 10.1080/02640410903131681
Lago-Peñas, C., Lago-Ballesteros, J., Dellal, A., and Gómez, M. (2010). Game-related statistics that discriminated winning, drawing and losing teams from the Spanish soccer league. J. Syst. Sci. Med. 9, 288–293.
Lago-Peñas, C., and Martín, R. (2007). Determinants of possession of the ball in soccer. J. Sports Sci. 25, 969–974. doi: 10.1080/02640410600944626
Losada, J. L., and Manolov, R. (2015). The process of basic training, applied training, maintaining the performance of an observer. Qual. Quant. 49, 339–347. doi: 10.1007/s11135-014-9989-7
Mitchell, S. (1979). Interobserver agreement, reliability and generalizability of data collected in observational studies. Psychol. Butlet. 86, 376–390. doi: 10.1037/0033-2909.86.2.376
Sasaki, Y., Nevill, A., and Reilly, T. (1999). Home advantage: a case study of Ipswich Town football club during the 1996–97 season. J. Sports Sci. 17:831.
Tashakkori, A., and Teddie, C. (eds). (2010). The Sage Handbook of Mixed Methods in Social & Behavioral Research, 2nd Edn. Thousand Oaks, CA: Sage. doi: 10.4135/9781506335193
Tashakkori, A., and Teddie, C. (1998). Mixed Methodology: Combining Qualitative and Quantitative Approaches. Thousand Oaks, CA: Sage.
Tashakkori, A., and Teddie, C. (2003). Handbook of Mixed Methods in the Behavioral and Social Sciences. Thousand Oaks, CA: Sage.
Taylor, J. B., Mellalieu, S., James, N., and Shearer, D. A. (2008). The influence of match location, quality of opposition, and match status on technical performance in professional association football. J. Sports Sci. 26, 885–895. doi: 10.1080/02640410701836887
The Belmont Report (1978). Ethical Principles and Guidelines for the Protection of Human Subjects of Research. Washintton: The National Commission for the Protection of Human Subjects of Biomedical and Behavioral Research.
Tucker, W., Mellalieu, S., James, N., and Taylor, J. B. (2005). Game location effects in professional soccer: a case study. Int. J. Perform. Anal. Sport 5, 23–35. doi: 10.1080/24748668.2005.11868325
Keywords: performance analysis, football, possession, UEFA Euro France, observational methodology, mixed methods
Citation: Casal CA, Anguera MT, Maneiro R and Losada JL (2019) Possession in Football: More Than a Quantitative Aspect – A Mixed Method Study. Front. Psychol. 10:501. doi: 10.3389/fpsyg.2019.00501
Received: 12 October 2018; Accepted: 20 February 2019;
Published: 18 March 2019.
Edited by:
Alessandro Giuliani, Istituto Superiore di Sanità (ISS), ItalyReviewed by:
Juan Jose Fernandez Muñoz, Universidad Rey Juan Carlos, SpainGibson Moreira Praça, Federal University of Minas Gerais, Brazil
Copyright © 2019 Casal, Anguera, Maneiro and Losada. This is an open-access article distributed under the terms of the Creative Commons Attribution License (CC BY). The use, distribution or reproduction in other forums is permitted, provided the original author(s) and the copyright owner(s) are credited and that the original publication in this journal is cited, in accordance with accepted academic practice. No use, distribution or reproduction is permitted which does not comply with these terms.
*Correspondence: Claudio A. Casal, Y2EuY2FzYWxAdWN2LmVz