 Aleix Bassolas
 Sergio Gómez
 Alex Arenas
- Departament d’Enginyeria Informàtica i Matemàtiques, Universitat Rovira i Virgili, Tarragona, Spain
Urban systems are characterized by populations with heterogeneous characteristics, and whose spatial distribution is crucial to understand inequalities in life expectancy or education level. Traditional studies on spatial segregation indicators focus often on first-neighbour correlations but fail to capture complex multi-scale patterns. In this work, we aim at characterizing the spatial distribution heterogeneity of socioeconomic features through diffusion and synchronization dynamics. In particular, we use the time needed to reach the synchronization as a proxy for the spatial heterogeneity of a socioeconomic feature, as for example, the income. Our analysis for 16 income categories in cities from the United States reveals that the spatial distribution of the most deprived and affluent citizens leads to higher diffusion and synchronization times. By measuring the time needed for a neighborhood to reach the global phase we are able to detect those that suffer from a steeper segregation. Overall, the present manuscript exemplifies how diffusion and synchronization dynamics can be used to assess the heterogeneity in the presence of node information.
1 Introduction
The expansion of urbanization and progressive increase of the population in cities has intensified the concern over the many dimensions of segregation—i.e., school, economic or ethnics—that have a tangible impact in the health, education and equal opportunities of citizens [1–8]. In fact, quantifying the extent of segregation and the identification of economically and socially isolated neighborhoods has been a topic of wide interest that first led to the development of global metrics, and which were later extended to spatial metrics [9–14]. Most of the initial spatial measures were limited to first neighbour indices, which facilitated the development of multi-scalar indices that provide a more nuanced picture of segregation [15–21], yet understanding the role played by each of the scales and their interplay still remains a challenge.
Dynamical processes in general, and in particular diffusion [22–30] and synchronization [31–35] dynamics, have been widely studied in complex networks on account of their relation with the spread of diseases and information [36, 37] and real-world phenomena in social or economic systems [38–40]. Interestingly, they provide insights on the topological scales and structure of networks and reveal the existence of functional meso-scale structures [27, 30, 32, 34, 41].
Here we use previous knowledge on diffusion and synchronization dynamics to assess the multi-scale patterns of residential segregation. By moving the focus from the network topology and organization to the node states, we are able to measure how well distributed a population with a certain characteristic is using the time needed to reach the absorbing state. Our framework requires thus the implementation of a population dynamic to drive the system towards the homogeneous state, in our case diffusion and synchronization dynamics. None of them constitute here an attempt to model or predict the changes in the spatial distribution of a population characteristic but are highly stylized simplifications of their evolution that allow us to measure the time needed to attain the homogeneous state, which we consider to be the non-segregated scenario. Dynamical approaches are thus introduced here not because they provide a realistic approximation to the evolution of population dynamics but because they offer a significant advantage to measure multi-scale correlations as they do not require to take distance explicitly into account. Moreover, the assumption that cities converge towards uniformity is rather unrealistic without a heavy external driver, and is only a means to construct our measures.
As case studies we provide an analysis on the distribution of citizens of a certain income category in cities from the United States, and the distribution of a set of socioeconomic indicators in the city of Paris throughout an average day (see Supplementary Material Section 2 and Supplementary Figures S8–S10). The analysis on the spatial organization of income categories reveals that the most deprived and affluent sectors display higher diffusion and synchronization times linked to a higher heterogeneity, and allow us to split the cities in two groups depending on the difference on the level of segregation. Finally, we evaluate the level of synchronization at the neighborhood level which allow us to spot the more sensitive places in a city.
2 Results
2.1 Diffusion Dynamics and Income Segregation
Citizens exhibit a huge diversity of characteristics usually captured by socioeconomic indicators such as education level, income or ethnicity, and they are often heterogeneously distributed in space: those individuals with similar characteristics tend to live close between them. To assess the heterogeneity of a population with a characteristic k ∈ K, we consider a graph G(V, E) with adjacency matrix A = {aij} in which the spatial units are represented as a set of nodes V connected by a set of edges E. The adjacency matrix A we have considered takes aij = 1 when spatial units i and j are adjacent and aij = 0 otherwise, which is the traditional connectivity matrix used to capture residential segregation. Still, other types of (weighted) matrices could be considered to assess, for example, the impact of mobility in segregation. The state of a node
where
is fulfilled for all nodes i.
To measure the multi-scalar patterns of segregation, our assumption is that cities suffering from stronger residential segregation are further from the stationary state where the citizens of category k are homogeneously distributed in space. Although cities are in continuous change and most likely far from equilibrium, similar approaches such as the long-standing Schelling and the Alonso-Muth-Mills models have been able to draw relevant conclusions from the equilibrium state [42, 43].
By adopting diffusion dynamics we do not refuse the high complexity of population dynamics influenced by a wide variety of demographic, economic, political, and behavioral factors [44–47] but avoid introducing further parameters and factors that could hinder our aim of characterizing the segregation of a particular population category. Bear in mind that our final goal is by no means to assess real-world migration processes but to construct a multi-scalar measure of segregation that does not explicitly include the distance and the use of more complex and realistic approaches that would complicate the interpretation of the results. Diffusion constitutes one of the most basic approximations to how information, or any other characteristic, is transmitted through a system. Although far from the real behavior, it provides one of the simplest scenarios where the flow of population follows a gradient.
In fact, we focus on one of the best-case scenarios where the values of
We focus on the economic segregation in the metropolitan areas of the United States with more than 1 million inhabitants and analyze a dataset containing the number of households within an income interval k residing in each census tract (see Table 1).
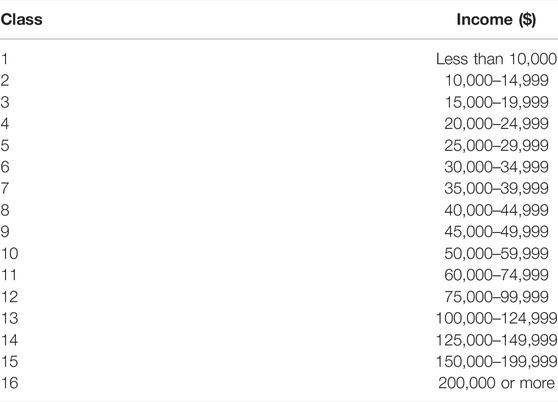
TABLE 1. Income range (in US dollars) corresponding to each category (or class).
Once we have the set of initial node states
where
is the degree of node i. For simplification purposes, we have opted to use a normalized diffusion dynamic, with diffusion strength equal to 1. Note that we have independent diffusion processes for each category k.
The diffusion dynamic lasts until the stationary state,
A relative diffusion time equal to one means that it is compatible with the null model, i.e., there are no remarkable spatial dependencies, while a greater value suggests that spatial heterogeneities delay the arrival to the stationary state.
We analyze the normalized diffusion times
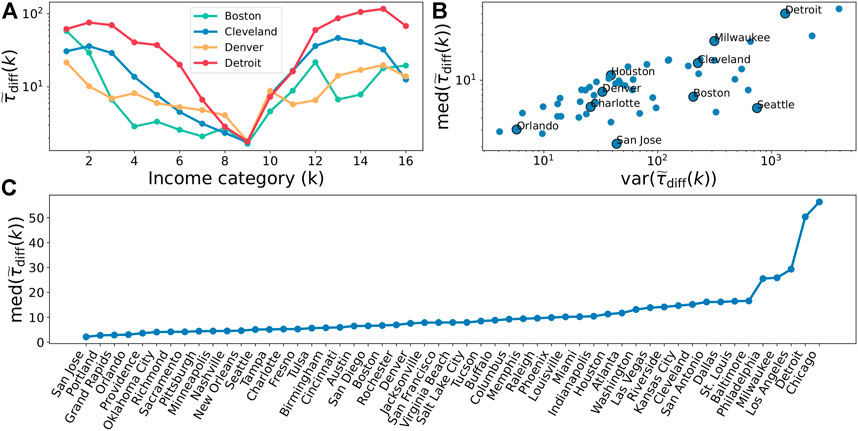
FIGURE 1. Diffusion dynamics as a measure for income segregation. (A) Synchronization time for each of the 16 income categories in Boston, Cleveland, Denver and Detroit. (B) Median value of
Since
By applying diffusion dynamics we implicitly assume that xk evolves homogeneously towards consensus, which more than a realistic scenario, it is a means to calculate the time needed to reach consensus and obtain a measure of segregation. To further inspect the actual change of
and then cluster, for each category k, the temporal profiles of all the nodes. For the clustering, we have made use of the k-means algorithm [52, 53], grouping together those units with a similar temporal evolution, and setting the number of clusters to 3. The resulting time-series of the corresponding centroids for the highest and lowest income categories are depicted in Figure 2, where a non-monotonic behavior is observed in most of the cases, with oscillatory behaviors through time of varying amplitude.
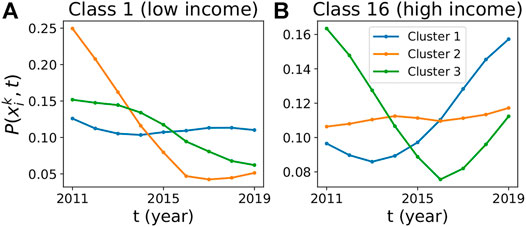
FIGURE 2. Average temporal evolution of the abundance of households within the lowest and highest income. Temporal evolution of centroids after performing a k-means clustering on the normalized abundance of households with category k,
2.2 Synchronization Dynamics and Income Segregation
According to the oscillations in the temporal evolution of
The interaction between spatial units is given by the Kuramoto model
where we have modified the traditional interaction term between oscillators by dividing the angle difference by two, allowing for the interaction between regions displaying extreme values of
We use the standard order parameter |zk| to assess the global level of synchronization for a category k in a city, where
and N is the total number of spatial units or Kuramoto oscillators [35]. We consider that a city has reached the synchronized state when |zk| > 0.999. As in the case of diffusion, we assess how the distribution of initial phases determines the synchronization of the system, a city in our case, by measuring the time τsync(k) required to reach the synchronized state. The more heterogeneously distributed the initial phases are, the higher the time the system requires to synchronize. To distinguish between the effect produced by the spatial distribution
Like for diffusion, a synchronization time close to one means that the spatial distribution of phases is compatible with the null model, and a larger value indicates that spatial heterogeneities delay the appearance of a synchronized state.
In Figure 3A we inspect the normalized synchronization time in Boston, Cleveland, Detroit and Denver when spatial units interact through Kuramoto-like dynamics. All four of them share similar features, with central classes displaying smaller synchronization times compared to the most disadvantaged and wealthier ones. An expected result since those individuals in the extremes of the income distribution tend to be more isolated and clustered together compared to middle-income citizens. Despite sharing qualitative features, the cities shown display sharp quantitative differences. Almost all categories appear to be significantly more isolated in Detroit and Cleveland compared to Denver and Boston, where
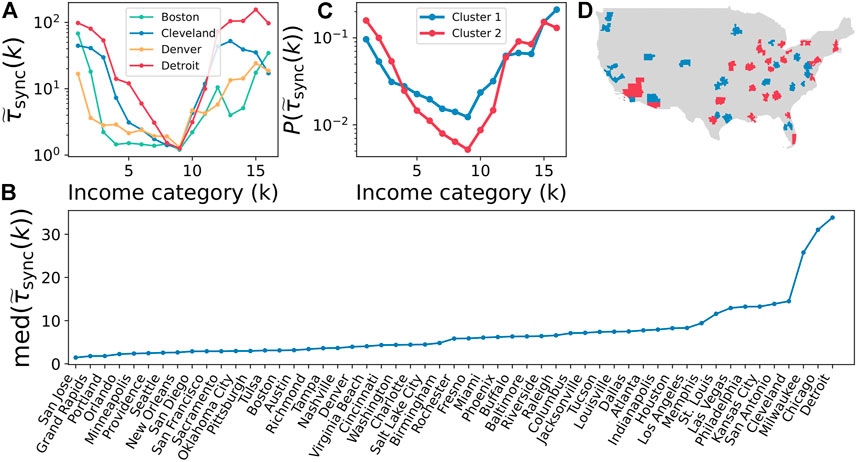
FIGURE 3. Synchronization time as a measure for income segregation. (A) Synchronization time for each of the 16 income categories in Boston, Cleveland, Denver and Detroit. (B) Ranking for the median value of
Likewise with diffusion, we calculate the median and variance of
Our index is given by the median value of the normalized synchronization times, yet depending on the dimension of segregation we aim to capture, we can also construct an index based on a population-weighted average. Whereas the median gives equal weight to each economic category focusing on the segregation suffered by residents of category k, the weighted average provides an overall picture of segregation taking the population of each category into account. We show the ranking obtained for the weighted average index and its relation with
Although
Beyond the global quantification of segregation, we can also evaluate the local level of segregation of a concrete census tract i at a given time step t by computing
where
Figure 4 displays the normalized synchronization times for each of the census tracts in Denver and Detroit, focusing on three very distinct income categories: low income, Figures 4A,E; middle income, Figures 4B,F; and high income, Figures 4C,G. To ease the comparison between income categories, the range of values is common for all the maps, evincing the strong differences between Detroit and Denver, especially for the low and high-income categories. Figures 4D,H also report the income per census tract. The shape of the segregation in Detroit can be outlined by the lower-income downtown and the richer suburbs, being the most segregated parts, and a less-segregated region in-between. In the case of Denver, we only slightly see high values for the low-income category in the North of the city and the high-income category in the South.
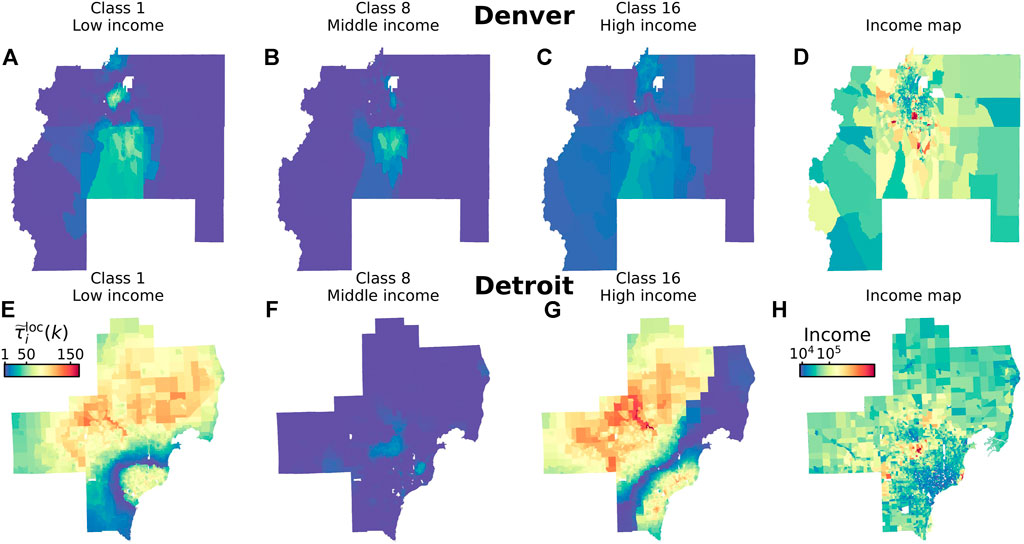
FIGURE 4. Local synchronization time as a measure for income segregation. Normalized synchronization time for each census tract in Denver (A–C) and Detroit (E–G) for three different income categories: (A,E) class 1 (low income); (B,F) class 8 (middle income); (C,G) class 16 (high income). We provide as a reference the median income of each census tract in (D) Denver and (H) Detroit.
As we detail in Supplementary Figure S5, the spatial patterns of segregation product of the synchronization dynamics are significantly different to those obtained from first-neighbor quantities such as the Moran’s I. Instead of focusing on those regions whose proportion of citizens is high (or low) compared to its neighbors, our methodology highlights those with a ratio of population within a category k distinct than the average, either because it is high or low, and spatially isolated from those regions with average values. In other words, a region with a high proportion of residents of category k might not show a large local spatial correlation if their neighbors have similar values but could, instead, produce high values of
Finally, we inspect if the synchronization time of a region displays any type of connection with its actual income. To do so, we plot in Figure 5 the normalized local synchronization time as a function of the median income averaged over all the census tracts within bins of $5,000 in four US cities. Again we see that segregation is much stronger in Detroit followed by Cleveland and Boston. High-income regions are more segregated in Boston compared to Cleveland. In general terms, the census tracts with a median income between $50,000 and $80,000 seem to be the less segregated ones as they synchronize faster for both low and high-income categories. These results are in agreement with the cluster assignment of the previous cities, with Detroit, Cleveland and Boston in the red cluster where low and high-income categories need more time to synchronize, and Denver in the blue cluster where only the high-income categories need more time to synchronize.
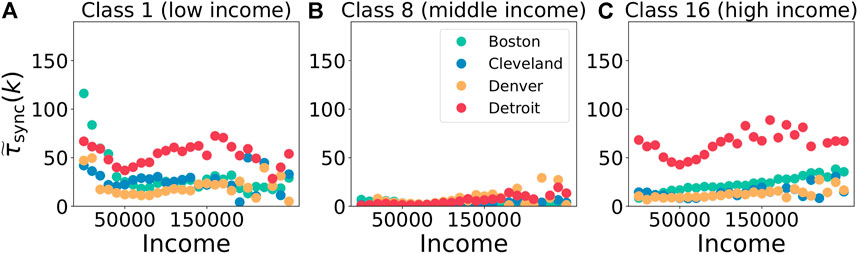
FIGURE 5. Synchronization time and median income. Normalized synchronization time as a function of the median income averaged over bins of $5,000 for class 1 (A), class 8 (B) and class 16 (C).
3 Discussion
Traditional spatial segregation indicators that focus on local scale of segregation fail in most cases to capture the presence of long-range correlations, thus highlighting the need of multi-scale indices [15–21]. Our framework does not consider any specific scale, but uses a dynamical approach that captures the patterns of segregation across the multiple scales. We have revealed how categories in the extreme of the income distribution are more heterogeneously distributed in space compared to middle classes, displaying larger diffusion and synchronization times. This approach has also allowed us to group together those cities that display common features of segregation. In this context, it is important to note that our work does not attempt to model the evolution of income segregation nor can be used as a forecasting tool, but takes modeling assumptions to assess the level of segregation that a distribution of population exhibits.
Despite the main manuscript focuses on the economic segregation, our methodology can be used to assess the heterogeneity in the spatial distribution of any characteristic. Moreover, it can go beyond the spatial component of segregation by including in the analysis other types of graphs, e.g., the daily mobility network of citizens. In this way, we could assess how citizens of diverse socioeconomic environments interact through mobility [56–59].
Summarizing, we show how diffusion and synchronization dynamics can be used in some systems to assess the heterogeneity in the distribution of node features. While the present work focuses on the initial phases of oscillators and their synchronization time, node metadata could also be understood as an internal frequency and provide further insights on feature correlation across topological scales.
Data Availability Statement
Publicly available datasets were analyzed in this study. This data can be found here: https://www.census.gov/programs-surveys/acs.
Author Contributions
AB performed the research. AB, SG, and AA designed the research and wrote the manuscript.
Funding
AB acknowledges financial support from the Ministerio de Ciencia e Innovación under the Juan de la Cierva program (FJC2019-038958-I). We acknowledge support by Ministerio de Economía y Competitividad (PGC2018-094754-BC21, FIS2017-90782-REDT and RED2018-102518-T), Generalitat de Catalunya (2017SGR-896 and 2020PANDE00098), and Universitat Rovira i Virgili (2019PFR-URV-B2-41). AA acknowledges also ICREA Academia and the James S. McDonnell Foundation (220020325).
Conflict of Interest
The authors declare that the research was conducted in the absence of any commercial or financial relationships that could be construed as a potential conflict of interest.
Publisher’s Note
All claims expressed in this article are solely those of the authors and do not necessarily represent those of their affiliated organizations, or those of the publisher, the editors and the reviewers. Any product that may be evaluated in this article, or claim that may be made by its manufacturer, is not guaranteed or endorsed by the publisher.
Supplementary Material
The Supplementary Material for this article can be found online at: https://www.frontiersin.org/articles/10.3389/fphy.2022.833426/full#supplementary-material
References
1. Kennedy BP, Kawachi I, Glass R, Prothrow-Stith D. Income Distribution, Socioeconomic Status, and Self Rated Health in the united states: Multilevel Analysis. BMJ (1998) 317:917–21. doi:10.1136/bmj.317.7163.917
2. Elliott JR. Social Isolation and Labor Market Insulation: Network and Neighborhood Effects on Less-Educated Urban Workers. Sociological Q (1999) 40:199–216. doi:10.1111/j.1533-8525.1999.tb00545.x
3. Collins WJ, Margo RA. Residential Segregation and Socioeconomic Outcomes. Econ Lett (2000) 69:239–43. doi:10.1016/s0165-1765(00)00300-1
4. Ross NA, Nobrega K, Dunn J. Income Segregation, Income Inequality and Mortality in north American Metropolitan Areas. GeoJournal (2001) 53:117–24. doi:10.1023/a:1015720518936
5. Mayer SE. How Economic Segregation Affects Children's Educational Attainment. Social Forces (2002) 81:153–76. doi:10.1353/sof.2002.0053
6. Acevedo-Garcia D, Lochner KA. Residential Segregation and Health. Neighborhoods and Health (2003). p. 265–87. doi:10.1093/acprof:oso/9780195138382.003.0012Residential Segregation and Health
7. Wheeler CH. Urban Decentralization and Income Inequality: Is Sprawl Associated with Rising Income Segregation across Neighborhoods? FRB of St. Louis (2006). Working Paper No. 2006–037A.
8. Owens A. Income Segregation between School Districts and Inequality in Students' Achievement. Sociol Educ (2018) 91:1–27. doi:10.1177/0038040717741180
10. Dawkins CJ. Measuring the Spatial Pattern of Residential Segregation. Urban Stud (2004) 41:833–51. doi:10.1080/0042098042000194133
11. Brown LA, Chung S-Y. Spatial Segregation, Segregation Indices and the Geographical Perspective. Popul Space Place (2006) 12:125–43. doi:10.1002/psp.403
12. Dawkins C. The Spatial Pattern of Black-white Segregation in Us Metropolitan Areas: an Exploratory Analysis. Urban Stud (2006) 43:1943–69. doi:10.1080/00420980600897792
13. Wong DWS, Shaw S-L. Measuring Segregation: An Activity Space Approach. J Geogr Syst (2011) 13:127–45. doi:10.1007/s10109-010-0112-x
14. Rey SJ, Smith RJ. A Spatial Decomposition of the Gini Coefficient. Lett Spat Resour Sci (2013) 6:55–70. doi:10.1007/s12076-012-0086-z
15. Farber S, Páez A, Morency C. Activity Spaces and the Measurement of Clustering and Exposure: A Case Study of Linguistic Groups in Montreal. Environ Plan A (2012) 44:315–32. doi:10.1068/a44203
16. Louf R, Barthelemy M. Patterns of Residential Segregation. PLOS ONE (2016) 11:e0157476. doi:10.1371/journal.pone.0157476
17. Chodrow PS. Structure and Information in Spatial Segregation. Proc Natl Acad Sci U.S.A (2017) 114:11591–6. doi:10.1073/pnas.1708201114
18. Olteanu M, Randon-Furling J, Clark WAV. Segregation through the Multiscalar Lens. Proc Natl Acad Sci U.S.A (2019) 116:12250–4. doi:10.1073/pnas.1900192116
19. Sousa S, Nicosia V. Quantifying Ethnic Segregation in Cities through Random Walks (2020). arXiv (2020) arXiv:2010.10462.
20. Bassolas A, Nicosia V. First-passage Times to Quantify and Compare Structural Correlations and Heterogeneity in Complex Systems. Commun Phys (2021) 4:1–14. doi:10.1038/s42005-021-00580-w
21. Bassolas A, Sousa S, Nicosia V. Diffusion Segregation and the Disproportionate Incidence of Covid-19 in African American Communities. J R Soc Interf (2021) 18:20200961. doi:10.1098/rsif.2020.0961
22. Gómez S, Díaz-Guilera A, Gómez-Gardeñes J, Pérez-Vicente CJ, Moreno Y, Arenas A. Diffusion Dynamics on Multiplex Networks. Phys Rev Lett (2013) 110:028701. doi:10.1103/PhysRevLett.110.028701
23. Solé-Ribalta A, De Domenico M, Kouvaris NE, Díaz-Guilera A, Gómez S, Arenas A. Spectral Properties of the Laplacian of Multiplex Networks. Phys Rev E Stat Nonlin Soft Matter Phys (2013) 88:032807. doi:10.1103/PhysRevE.88.032807
24. De Domenico M, Solé-Ribalta A, Cozzo E, Kivelä M, Moreno Y, Porter MA, et al. Mathematical Formulation of Multilayer Networks. Phys Rev X (2013) 3:041022. doi:10.1103/physrevx.3.041022
25. Li Y, Chen W, Wang Y, Zhang ZL. Influence Diffusion Dynamics and Influence Maximization in Social Networks with Friend and Foe Relationships. Proc sixth ACM Int Conf Web search Data mining (2013) 657–66. doi:10.1145/2433396.2433478
26. Delvenne JC, Lambiotte R, Rocha LE. Diffusion on Networked Systems Is a Question of Time or Structure. Nat Commun (2015) 6:7366–10. doi:10.1038/ncomms8366
27. De Domenico M. Diffusion Geometry Unravels the Emergence of Functional Clusters in Collective Phenomena. Phys Rev Lett (2017) 118:168301. doi:10.1103/physrevlett.118.168301
28. Masuda N, Porter MA, Lambiotte R. Random Walks and Diffusion on Networks. Phys Rep (2017) 716-717:1–58. doi:10.1016/j.physrep.2017.07.007
29. Cencetti G, Battiston F. Diffusive Behavior of Multiplex Networks. New J Phys (2019) 21:035006. doi:10.1088/1367-2630/ab060c
30. Bertagnolli G, De Domenico M. Diffusion Geometry of Multiplex and Interdependent Systems. Phys Rev E (2021) 103:042301. doi:10.1103/PhysRevE.103.042301
31. Arenas A, Díaz-Guilera A, Pérez-Vicente CJ. Synchronization Processes in Complex Networks. Physica D: Nonlinear Phenomena (2006) 224:27–34. doi:10.1016/j.physd.2006.09.029
32. Arenas A, Díaz-Guilera A, Pérez-Vicente CJ. Synchronization Reveals Topological Scales in Complex Networks. Phys Rev Lett (2006) 96:114102. doi:10.1103/physrevlett.96.114102
33. Gómez-Gardeñes J, Moreno Y, Arenas A. Paths to Synchronization on Complex Networks. Phys Rev Lett (2007) 98:034101. doi:10.1103/PhysRevLett.98.034101
34. Gómez-Gardeñes J, Moreno Y, Arenas A. Synchronizability Determined by Coupling Strengths and Topology on Complex Networks. Phys Rev E Stat Nonlin Soft Matter Phys (2007) 75:066106. doi:10.1103/PhysRevE.75.066106
35. Arenas A, Díaz-Guilera A, Kurths J, Moreno Y, Zhou C. Synchronization in Complex Networks. Phys Rep (2008) 469:93–153. doi:10.1016/j.physrep.2008.09.002
36. Gómez-Gardeñes J, Soriano-Paños D, Arenas A. Critical Regimes Driven by Recurrent Mobility Patterns of Reaction-Diffusion Processes in Networks. Nat Phys (2018) 14:391–5. doi:10.1038/s41567-017-0022-7
37. Zhang Z-K, Liu C, Zhan X-X, Lu X, Zhang C-X, Zhang Y-C. Dynamics of Information Diffusion and its Applications on Complex Networks. Phys Rep (2016) 651:1–34. doi:10.1016/j.physrep.2016.07.002
38. Pluchino A, Latora V, Rapisarda A. Changing Opinions in a Changing World: A New Perspective in Sociophysics. Int J Mod Phys C (2005) 16:515–31. doi:10.1142/s0129183105007261
39. Calderón C, Chong A, Stein E. Trade Intensity and Business Cycle Synchronization: Are Developing Countries Any Different? J Int Econ (2007) 71:2–21. doi:10.1016/j.jinteco.2006.06.001
40. Erola P, Díaz-Guilera A, Gómez S, Arenas A. Modeling International Crisis Synchronization in the World Trade Web, 7. Networks and Heterogeneous Media (2012). 385–97. doi:10.3934/nhm.2012.7.385Modeling International Crisis Synchronization in the World Trade WebNhm
41. Motter AE, Zhou C, Kurths J. Network Synchronization, Diffusion, and the Paradox of Heterogeneity. Phys Rev E Stat Nonlin Soft Matter Phys (2005) 71:016116. doi:10.1103/PhysRevE.71.016116
42. Schelling TC. Dynamic Models of Segregation†. J Math Sociol (1971) 1:143–86. doi:10.1080/0022250x.1971.9989794
44. Zhang J. A Dynamic Model of Residential Segregation. J Math Sociol (2004) 28:147–70. doi:10.1080/00222500490480202
45. Clark WAV. Changing Residential Preferences across Income, Education, and Age. Urban Aff Rev (2009) 44:334–55. doi:10.1177/1078087408321497
46. Zhang J. Tipping and Residential Segregation: a Unified Schelling Model*. J Reg Sci (2011) 51:167–93. doi:10.1111/j.1467-9787.2010.00671.x
47. DeLuca S, Garboden PME, Rosenblatt P. Segregating Shelter. Annals Am Acad Polit Soc Sci (2013) 647:268–99. doi:10.1177/0002716213479310
49. Adelman RM. Neighborhood Opportunities, Race, and Class: The Black Middle Class and Residential Segregation. City & Community (2004) 3:43–63. doi:10.1111/j.1535-6841.2004.00066.x
50. Thomas M, Moye R. Race, Class, and Gender and the Impact of Racial Segregation on Black-white Income Inequality. Sociol Race Ethn (2015) 1:490–502. doi:10.1177/2332649215581665
51. Florida R, Mellander C. Segregated City: The Geography of Economic Segregation in America’s Metros. Martin Prosperity Institute (2015).
52. Hartigan JA, Wong MA. Algorithm as 136: A K-Means Clustering Algorithm. Appl Stat (1979) 28:100–8. doi:10.2307/2346830
53. Likas A, Vlassis N, J. Verbeek J. The Global K-Means Clustering Algorithm. Pattern Recognition (2003) 36:451–61. doi:10.1016/s0031-3203(02)00060-2
54. Moran PAP. The Interpretation of Statistical Maps. J R Stat Soc Ser B (Methodological) (1948) 10:243–51. doi:10.1111/j.2517-6161.1948.tb00012.x
55. Fotheringham AS, Wong DWS. The Modifiable Areal Unit Problem in Multivariate Statistical Analysis. Environ Plan A (1991) 23:1025–44. doi:10.1068/a231025
56. Xu Y, Belyi A, Santi P, Ratti C. Quantifying Segregation in an Integrated Urban Physical-Social Space. J R Soc Interf (2019) 16:20190536. doi:10.1098/rsif.2019.0536
57. Tóth G, Wachs J, Di Clemente R, Á J, Ságvári B, Kertész J, et al. Inequality Is Rising where Social Network Segregation Interacts with Urban Topology. Nat Commun (2021) 12:1–9. doi:10.1038/s41467-021-21465-0
58. Bokányi E, Juhász S, Karsai M, Lengyel B. Universal Patterns of Long-Distance Commuting and Social Assortativity in Cities. Scientific Rep (2021) 11:1–10. doi:10.1038/s41598-021-00416-1
59. Moro E, Calacci D, Dong X, Pentland A. Mobility Patterns Are Associated with Experienced Income Segregation in Large Us Cities. Nat Commun (2021) 12:4633–10. doi:10.1038/s41467-021-24899-8
Keywords: urban segregation, spatial heterogeneity, synchronization, phase-oscillators, diffusion
Citation: Bassolas A, Gómez S and Arenas A (2022) Diffusion and Synchronization Dynamics Reveal the Multi-Scale Patterns of Spatial Segregation. Front. Phys. 10:833426. doi: 10.3389/fphy.2022.833426
Received: 11 December 2021; Accepted: 04 April 2022;
Published: 25 April 2022.
Edited by:
Haroldo V. Ribeiro, State University of Maringá, BrazilReviewed by:
Zoltan Neda, Babeș-Bolyai University, RomaniaMatjaž Perc, University of Maribor, Slovenia
Copyright © 2022 Bassolas, Gómez and Arenas. This is an open-access article distributed under the terms of the Creative Commons Attribution License (CC BY). The use, distribution or reproduction in other forums is permitted, provided the original author(s) and the copyright owner(s) are credited and that the original publication in this journal is cited, in accordance with accepted academic practice. No use, distribution or reproduction is permitted which does not comply with these terms.
*Correspondence: Aleix Bassolas, YWxlaXguYmFzc29sYXNAZ21haWwuY29t