 Yong-Guang Gao1,2,3
 Fen-Li Liu1,2,3
 Suryaji Patil1,2,3
 Di-Jie Li1,2,3
 Abdul Qadir1,2,3
 Xiao Lin1,2,3
 Ye Tian1,2,3
 Yu Li1,2,3
 Ai-Rong Qian1,2,3*
- 1Lab for Bone Metabolism, Key Lab for Space Biosciences and Biotechnology, School of Life Sciences, Northwestern Polytechnical University, Xi'an, China
- 2Research Center for Special Medicine and Health Systems Engineering, School of Life Sciences, Northwestern Polytechnical University, Xi'an, China
- 3NPU-UAB Joint Laboratory for Bone Metabolism, School of Life Sciences, Northwestern Polytechnical University, Xi'an, China
A series of multifunctional compounds (MFCs) 1a–1d based on 1,8-naphthalimide moiety were designed and synthesized. Due to the good fluorescence property and nucleic acid binding ability of 1,8-naphthalimide, these MFCs were applied in Cu2+ ion recognition, lysosome staining as well as RNA delivery. It was found that these MFCs exhibited highly selective fluorescence turn-off for Cu2+ in aqueous solution. The fluorescence emission of 1a−1d was quenched by a factor of 116-, 20-, 12-, and 14-fold in the presence of Cu2+ ions, respectively. Most importantly, 1a-Cu and 1b-Cu could be used as imaging reagents for detection of lysosome in live human cervical cancer cells (HeLa) using fluorescence microscopy. Furthermore, in order to evaluate the RNA delivery ability of 1a−1d, cellular uptake experiments were performed in HeLa, HepG2, U2Os, and MC3T3-E1 cell lines. The results showed that all the materials could deliver Cy5-labled RNA into the targeted cells. Among them, compound 1d modified with long hydrophobic chain exhibited the best RNA delivery efficiency in the four tested cell lines, and the performance was far better than lipofectamine 2000 and 25 kDa PEI, indicating the potential application in non-viral vectors.
Introduction
In recent years, considerable efforts have been paid to develop 1,8-naphthalimide derivatives as fluorescent probes, fluorescent dyes, gene vectors, and anticancer agents (Xu, 2008; Duke et al., 2010; Banerjee et al., 2014; Gao et al., 2018; Xie et al., 2018). 1,8-Naphthalimide-based fluorescence probes have been widely used for sensing cations (Cu2+, Zn2+, Hg2+, Ag+, and Pb2+) (Grabchev et al., 2003; Bojinov et al., 2009; Aderinto and Imhanria, 2018), anions (F−, CN−, AcO−, and ) (Jun Feng et al., 2011; Ren et al., 2011; Hao et al., 2018), and biomolecules (ATP, ADP, amino acid, and protein) (Huo et al., 2018; Seraj et al., 2018; Shahid et al., 2018). Many excellent examples of 1,8-naphthalimide-based probes have been reported, and some of them have been successfully applied in live-cell imaging research (Dai et al., 2018; Zhu et al., 2018). Furthermore, it is well-known that development of safe and efficient gene vectors is important to gene therapy (Behr, 1993; Verma et al., 1997; Niidome and Huang, 2002). Organic functional molecule as a new type of non-viral vector has received more and more attention because of its easy preparation, low immunogenicity, and good biodegradability (Seow and Yang, 2009; Pan et al., 2011; Hao et al., 2014). 1,8-naphthalimide-based functional molecules not only exhibit high transfection efficiency but also can be applied in real-time fluorescence tracking, which makes it possible to study the mechanism of gene delivery (Gao et al., 2015). It is thus no surprise that the 1,8-naphthalimide structure has made rapid development in applications for non-viral vectors, fluorescence probes, and anticancer agents in recent years.
The UV-visible absorption and fluorescence emission spectra of 1,8-naphthalimide are very sensitive to substitution in the aromatic ring. Therefore, good optical and photophysical properties can be easily achieved through structure modification (Duke et al., 2010). For example, if the 4-position of naphthalimide was substituted by the electron donating amine group, it would emit green fluorescence due to a “push-pull”-based internal charge transfer (ICT) caused by the electron donating amine and the electron withdrawing imide. In contrast, if the electron donating group such as Br moiety was exploited at the 4-position, almost no fluorescence emit was found. Therefore, different fluorescence spectra from blue to green can be achieved by altering the 4-position substituent group of naphthalimide (Bojinov et al., 2009), which allowed us easily to design the 1,8-naphthalimide derivatives that we needed. Therefore, there is huge potential to develop 1,8-naphthalimide derivatives as multifunctional compounds.
We have designed serials of 1,8-naphthalimide derivatives in recent years (Gao et al., 2016a,b, 2018). Some were applied in non-viral gene vectors for DNA delivery, and some were applied in fluorescence probes for ion recognition. However, a 1,8-naphthalimide derivative simultaneously serving as a gene vector as well as fluorescence probe has not been investigated so far. Furthermore, as a non-viral gene vector, we mainly focused on DNA delivery. However, RNA delivery mediated by these materials has never been investigated.
Recently, we synthesized long hydrophobic chain modified 1,8-naphthalimide derivatives 1c and 1d (Figure 1), and their DNA delivery ability was investigated (Gao et al., 2016b). In this study, they will be used as fluorescence probes for recognition of Cu2+ and non-viral vectors for RNA delivery. In order to study the effect of the molecular structure on performance, we synthesized two other short hydrophobic chain modified 1,8-naphthalimide derivatives 1a and 1b (Figure 1). The performance of these four multifunctional compounds on recognition of Cu2+ ions and gene delivery was systematically investigated. Furthermore, the complexes of 1a-Cu and 1b-Cu were also investigated as lysosome probes. The results showed that the structure of these materials has significant impact on both probe performance and RNA delivery ability, which may give us clues for further design of high-performance multifunctional compounds.
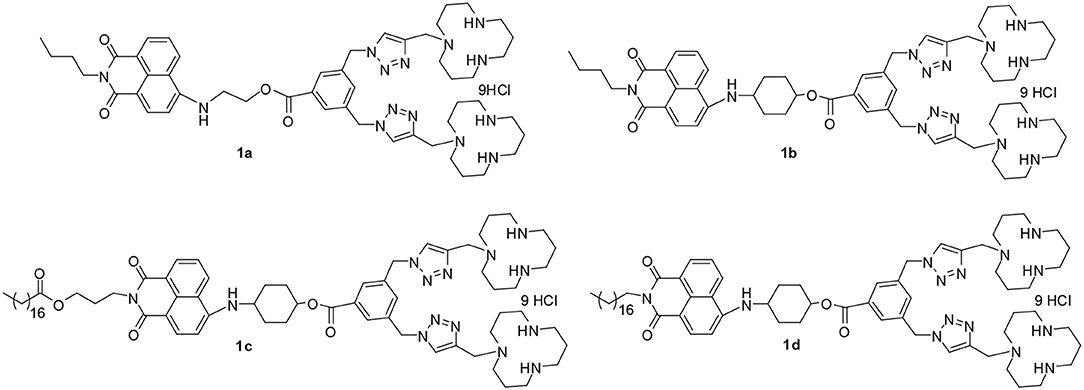
Figure 1. The structure of 1,8-naphthalimide derivatives.
Materials and Methods
Materials and Instruments
The agents used for reaction such as dichloromethane (DCM), triethylamine (TEA), and N, N-dimethylformamide (DMF) were purified by distillation before use. The solvents used for purification such as methanol (MeOH), petroleum ether (PE), and ethyl acetate (EA) were directly used without any purification. 3,5-bis(azidomethyl)benzoic acid, 1-hydroxybenzotriazole hydrate (HOBt), copper sulfate (CuSO4), triethylamine (TEA), 1-ethyl-3-(3-dimethylaminopropyl)carbodiimide hydrochloride (EDCI), and sodium ascorbate (Vc-Na) were purchased from Beijing Ouhe Technology Co. Ltd. (Beijing, China). Different alkyl chains modified 1,8-naphthalimide derivatives 2a–2b, ditert-butyl 9-(prop-2-ynyl)-1,5,9-triazacyclododecane-1,5-dicarboxylate 5, and the final compounds 1c and 1d were prepared according to our previous report (Gao et al., 2016b). Cy5-labeled RNA oligomer 5′-UUCUCCGAACGUGUCACGUTT-3′-(Cy5-RNA) was purchased from Invitrogen. 3-(4,5-dimethylthiazol-2-yl)-2,5-diphenyltetrazolium bromide (MTT) was purchased from Solarbio company (Beijing, China).
1H NMR and 13C NMR spectra were collected using a Bruker Avance spectrometer. Mass spectra were obtained on a Waters Quattro Mocro spectrometer and high-resolution mass spectra were acquired on a Waters LCT Premier XE spectrometer. The infrared spectra were acquired on a Nicolet 380 spectrometer. Fluorescence spectra were measured on a Hitachi F-4500 fluorescence spectrophotometer. Hydrodynamic diameters and zeta potentials were collected using a Nano-ZS 3600 zetaplus particle size and zeta potential analyzer. Cell images were observed by a Leica DMI8 Inverted Fluorescence Microscope (Wetzlar, Germany).
Synthesis of Multifunctional Compounds 1a−1b
Synthesis of Compound 4a/4b
3,5-Bis(azidomethyl)benzoic acid (0.81 mmol) was dissolved in SOCl2 (2 mL). After stirring for 2 h at 70°C, the surplus SOCl2 was evaporated under reduced pressure. The residue was dissolved in dichloromethane (5 mL) and TEA (1.34 mmol). Compound 2a/2b (0.67 mmol) was added and stirred for 24 h at room temperature. Water (5 mL) was added and the mixture was extracted with DCM (2 × 15 mL). The organic phase was dried (Na2SO4), filtered, and the solvent was evaporated under reduced pressure. The crude material was purified by column chromatography on silica gel (PE/EA = 4/1) to give a yellow product.
4a, 81%; 1H NMR (400 MHz, CDCl3) δ 8.59 (d, J = 7.3 Hz, 1H), 8.48 (d, J = 8.3 Hz, 1H), 8.13 (d, J = 8.3 Hz, 1H), 7.99 (s, 2H), 7.66 (t, J = 7.9 Hz, 1H), 7.51 (s, 1H), 6.77 (d, J = 8.4 Hz, 1H), 6.02 (s, 1H), 4.92 – 4.79 (m, 2H), 4.44 (s, 4H), 4.20 – 4.12 (m, 2H), 3.84 (dd, J = 9.9, 4.9 Hz, 2H), 1.70 (t, J = 6.7 Hz, 3H), 1.46 – 1.41 (m, 3H), 0.97 (t, J = 7.3 Hz, 4H); 13C NMR (101 MHz, CDCl3) δ 166.77, 164.59, 164.07, 149.00, 137.03, 134.15, 132.37, 132.23, 131.12, 130.92, 130.60, 129.66, 128.92, 126.10, 125.02, 123.14, 120.38, 111.05, 104.13, 65.57, 63.59, 53.95, 43.63, 39.99, 30.55, 30.30, 20.42, 19.17, 13.88, 13.72; IR (KBr, cm−1): 3360.24, 2956.33, 2872.29, 2107.83, 1720.18, 1682.23, 1638.86, 1576.77, 1576.51, 1381.73, 1207.83, 1115.66, 771.39; ESI-MS: m/z = 527.5 ([M+H]+).
4b, 63%; 1H NMR (400 MHz, CDCl3) δ 8.60 (d, J = 6.8 Hz, 1H), 8.48 (d, J = 8.4 Hz, 1H), 8.08 (d, J = 8.0 Hz, 1H), 7.98 (s, 2H), 7.67 – 7.62 (m, 1H), 7.51 (s, 1H), 6.78 (d, J = 8.6 Hz, 1H), 5.12 – 5.07 (m, 2H), 4.47 (s, 4H), 4.17 (t, J = 7.6 Hz, 2H), 3.75 – 3.72 (m, 1H), 2.39 (d, J = 11.4 Hz, 2H), 2.29 (d, J = 10.7 Hz, 2H), 1.85 – 1.60 (m, 6H), 1.47 – 1.41 (m, 2H), 0.97 (t, J = 7.4 Hz, 3H); 13C NMR (101 MHz, CDCl3) δ 165.14, 164.60, 164.06, 148.21, 136.83, 134.25, 131.96, 131.70, 131.14, 129.95, 128.95, 125.78, 124.74, 123.28, 120.28, 110.50, 104.64, 72.81, 54.10, 50.8, 39.99, 30.32, 30.25, 29.99, 20.43, 13.89; IR (KBr, cm−1): 3409.04, 2959.04, 2096.99, 1682.23, 1644.28, 1581.93, 1386.75, 1365.06, 1221.39, 1107.53, 774.10; ESI-MS: m/z = 580.6 ([M+H]+).
Synthesis of Compound 6a/6b
To a solution of 4a/4b (0.47 mmol) and compound 5 (0.96 mmol) in THF/H2O (10 mL/5 mL), copper sulfate (0.047 mmol), and Vc-Na (0.1 mmol) were added. The mixture was stirred overnight at room temperature. The solvent was removed under reduced pressure. Water (10 mL) was added and the mixture was extracted with DCM (2 × 10 mL). The combined organic layer was washed with saturated brine, dried over Na2SO4, filtered, and the solvent was evaporated under reduced pressure. The crude material was purified by column chromatography on silica gel (CH2Cl2/MeOH = 20/1) to give a yellow product.
6a, 77%; 1H NMR (400 MHz, CDCl3) δ 8.57 (d, J = 7.3 Hz, 1H), 8.45 (d, J = 8.4 Hz, 1H), 8.21 (d, J = 8.4 Hz, 1H), 7.87 (s, 2H), 7.65 (t, J = 7.9 Hz, 1H), 7.39 (s, 3H), 6.76 (d, J = 8.5 Hz, 1H), 6.26 (s, 1H), 5.54 (s, 4H), 4.73 (t, J = 4.9 Hz, 2H), 4.19 – 4.10 (m, 2H), 3.89 – 3.66 (m, 6H), 3.45 – 3.18 (m, 16H), 2.43 (s, 8H), 2.04 – 1.73 (m, 12H), 1.73 – 1.65 (m, 2H), 1.50 – 1.36 (m, 38H), 0.96 (t, J = 7.3 Hz, 3H); 13C NMR (101 MHz, CDCl3) δ 165.75, 164.45, 163.89, 156.22, 149.50, 144.26, 136.69, 134.08, 131.69, 131.22, 130.96, 129.60, 128.97, 126.80, 124.69, 122.78, 120.39, 110.35, 104.05, 79.24, 77.54, 77.23, 76.91, 63.62, 52.96, 49.60, 46.70, 45.32, 43.74, 42.90, 39.82, 30.22, 28.41, 27.20, 25.95, 20.32, 13.83; IR (KBr, cm−1): 3409.40, 2969.88, 1687.65, 1649.70, 1584.64, 1365.06, 1245.78, 1167.17, 1050.60, 779.52; ESI-MS: m/z = 1345.8 ([M+H]+).
6b, 69%; 1H NMR (400 MHz, CDCl3) δ 8.60 (d, J = 6.9 Hz, 1H), 8.48 (d, J = 8.4 Hz, 1H), 8.07 (d, J = 8.2 Hz, 1H), 7.92 (s, 2H), 7.64 (t, J = 7.9 Hz, 1H), 7.38 (d, J = 6.0 Hz, 3H), 6.77 (d, J = 8.6 Hz, 1H), 5.56 (s, 4H), 5.13 – 5.01 (m, 2H), 4.21 – 4.13 (m, 2H), 3.84 – 3.66 (m, 5H), 3.34 – 3.32 (m, 16H), 2.58 – 2.20 (m, 12H), 2.06 – 1.66 (m, 18H), 1.61 – 1.53 (m, 2H), 1.48 – 1.41 (m, 36H), 0.97 (t, J = 7.4 Hz, 3H); 13C NMR (101 MHz, CDCl3) δ 164.54, 163.94, 156.23, 148.45, 144.24, 136.52, 134.25, 132.19, 131.48, 131.00, 129.88, 129.06, 126.25, 124.49, 123.00, 122.55, 120.29, 110.08, 104.52, 79.23, 73.09, 53.15, 50.76, 49.63, 46.67, 45.36, 43.81, 39.86, 30.24, 30.04, 29.93, 28.43, 28.22, 27.18, 26.02, 20.34, 13.83; IR (KBr, cm−1): 3425.30, 2972.59, 2931.93, 1684.94, 1649.99, 1581.93, 1386.75, 1365.06, 1221.39, 1164.46, 774.10; ESI-MS: m/z = 1399.9 ([M+H]+).
Synthesis of Compound 1a/1b
Compound 6a/6b (0.19 mmol) was added to a solution of hydrogen chloride in ethyl acetate (10 mL) and the mixture was stirred for 30 min at room temperature. The resulting suspension was filtrated, and the solid was washed with ethyl acetate and dried in vacuum at 60°C for 24 h.
1a, 77%; 1H NMR (400 MHz, D2O) δ 7.56 (s, 2H), 7.21 – 7.15 (m, 2H), 7.01 (s, 2H), 6.93 (s, 3H), 6.81 (s, 1H), 6.55 (s, 1H), 5.59 (s, 1H), 4.91 (s, 5H), 3.87 (s, 4H), 3.66 (s, 4H), 3.06 (s, 4H), 2.94 – 2.72 (m, 16H), 2.61 (s, 8H), 1.74 (s, 4H), 1.60 (s, 8H), 0.79 (s, 2H), 0.66 (s, 2H), 0.30 (s, 3H); 13C NMR (101 MHz, CDCl3) δ 169.05, 167.01, 166.05, 153.01, 141.05, 138.25, 136.30, 134.91, 133.17, 132.75, 131.42, 130.54, 130.20, 129.07, 126.50, 122.40, 121.29, 109.20, 106.49, 66.98, 59.81, 55.31, 51.22, 49.50, 45.44, 44.14, 43.58, 42.24, 31.97, 22.32, 22.17, 21.41, 19.20, 15.55; IR (KBr, cm−1): 3425.30, 2959.04, 1714.76, 1636.14, 1581.93, 1386.75, 1362.35, 1218.67, 1121.08, 776.81; HR-MS: m/z = 945.5948 ([M+H]+)
1b, 82%; 1H NMR (400 MHz, D2O) δ 8.02 (s, 2H), 7.80 (s, 1H), 7.69 (s, 1H), 7.58 – 7.54 (m, 3H), 7.20 (s, 1H), 7.07 (s, 1H), 6.07 (s, 1H), 5.40 (s, 4H), 4.02 (s, 4H), 3.52 (s, 2H), 3.22 – 2.93 (m, 26H), 2.15 (s, 4H), 1.98 (s, 12H), 1.46 – 1.01 (m, 8H), 0.63 (s, 3H); 13C NMR (101 MHz, D2O) δ 165.60, 164.37, 163.41, 149.30, 137.14, 135.82, 133.96, 132.28, 131.00, 128.91, 128.47, 127.44, 127.44, 123.81, 120.31, 119.07, 106.91, 103.84, 73.86, 52.99, 50.52, 47.87, 42.32, 41.26, 29.64, 29.07, 19.94, 19.83, 18.29, 13.27; IR (KBr, cm−1): 3422.59, 2956.33, 2858.73, 1684.94, 1644.28, 1581.93, 1384.04, 1302.71, 1221.39, 1110.24, 779.52; HR-MS: m/z = 999.6400 ([M+H]+).
Measurement Procedure
UV and Fluorescent Spectral Measurements
The stock solutions of multifunctional organic compounds (MFCs) 1a–1d (1 mM) and metal ions (10 mM) were prepared in tri-distilled water and stored at 4°C for use. The fluorescence emission and ultraviolet absorption experiments were carried out in Tris-HCl buffer (1 mM, pH 7.2). Test solution was prepared by placing MFCs 1a–1e, Tris-HCl buffer solution and an appropriate volume of each analyte into 3 mL of cuvette. After equilibration for 2 min, an ultraviolet absorption and fluorescence emission spectrum was recorded at 25°C.
Cell Culture and Fluorescence Imaging
Cell culture: HeLa cells (a human cervical carcinoma cell line) were cultured with DMEM containing 100 units/mL penicillin sulfate and streptomycin, medium supplemented with 10% fetal bovine serum at 37°C under 5% CO2 for 24 h.
Cell imaging (Cu2+ recognition): cells were seeded in glass bottom cell culture dish (8 × 10⁴ cells), and incubated with 20 μM of MFCs 1a–1d for 0.5 h. After incubation, the cells were washed with PBS 4 times and imaged under a fluorescence microscope. Then, 10 equivalents of Cu(ClO4)2 was added to the cells, and fluorescence images were taken one time per 15 min under a Leica DMI8 Inverted Fluorescence Microscope. Fluorescence images were obtained using a 10 × objective lens. Cell images were processed and analyzed using the Image-Pro Plus software. Three repeats were conducted for each sample.
Lysosome imaging: The cells were seeded in 24-well plates at 8 × 10⁴ cells per well and grew for 24 h. After removing the medium, 1a (1b)-Cu complexes (20 μM) were added and incubated for 30 min in DMEM medium. Then the medium was replaced with fresh medium containing Lyso-Tracker Red (10 μM) and incubated for another 30 min. The samples were then imaged by an Inverted Fluorescence Microscope after washing with cell culture medium. Lyso-Tracker Red images were observed in the red channel and 1a (1b)-Cu images were observed in the green channel with a 20 × objective lens. Cell images were processed and analyzed using the Image-Pro Plus software. Three repeats were conducted for each sample.
Dynamic Light Scattering (DLS)
The complexes of MFCs 1a–1d with RNA were prepared by adding 0.7 μL of siRNA (264 μg/mL, 5′-UUCUCCGAACGUGUCACGUTT-3′) to the appropriate volume of the stock solutions of 1a–1d. Then the complex solution was vortexed for 30 s and then diluted up to 0.5 mL by tri-distilled water. The zeta potentials and the hydrodynamic diameters were measured using a Nano-ZS 3600 zetaplus particle size and zeta potential analyzer.
Cellular Uptake Experiment
The cellular uptake of the complexes of MFCs 1a–1d with Cy5-labeled siRNA was obtained by fluorescence microscope. HeLa, HepG2, and U2Os cells were cultured with DMEM medium, and MC3T3-E1 cells were cultured with α-MEM medium. The cells were seeded in 24-well plates at 8 × 10⁴ cells per well and grew for 24 h. After washing with DMEM, the cells were incubated with freshly prepared complexes of MFCs 1a–1d with Cy5-RNA (9 μg/mL) and the controls (500 μL). After 4 h incubation, the cells were washed 6 times with PBS buffer. Cells were observed by a Leica DMI8 Inverted Fluorescence Microscope, Cy5-labeled RNA images were observed in the red channel, and MFCs images were observed in the green channel with a 10 × objective lens. Cell images were processed and analyzed using the Image-Pro Plus software. Three repeats were conducted for each sample.
Cytotoxicity Experiment
The cytotoxicity of 1a–1d/RNA complexes toward HeLa cell lines was tested by MTT assays. The cells were seeded into 96-well plates at densities of 5 × 10³ cells in 100 μL DMEM medium. After culture for 24 h, the complexes (1a–1d/RNA) were added to cells at various concentrations (10, 15, 20, and 25 μM). After incubation for 4 h, the medium was replaced with 200 μL of fresh medium containing 10% FBS, and cells were cultured for another 48 h. Subsequently, 20 μL of MTT (5 mg/mL) solution in PBS was added to each well for an additional 4 h incubation. The MTT medium was replaced by 200 μL of DMSO. The absorbance was measured using a microplate spectrophotometer at a wavelength of 490 nm. The cells treated without any complexes were used as controls. The relative viability of the cells was calculated based on the data of five parallel tests by comparing to the controls.
Results and Discussion
Synthesis of Multifunctional Compounds 1a−1d
1,8-naphthalimide-based MTCs 1c and 1d were prepared according to our previous report (Gao et al., 2016b), and two other new compounds 1a and 1b were synthesized based on a similar method. As shown in Scheme 1, compound 4 was synthesized through acylation of 2 with 3,5-bis(azidomethyl)benzoyl chloride 3. Further reaction of 4 with propargyl [12]-aneN3 5 catalyzed by CuSO4 and sodium ascorbate (Vc-Na) gave intermediate 6. The final compounds were obtained through de-protection of 6 under acidic condition. All the new compounds were fully characterized by 1H NMR, 13C NMR, IR, and MS.
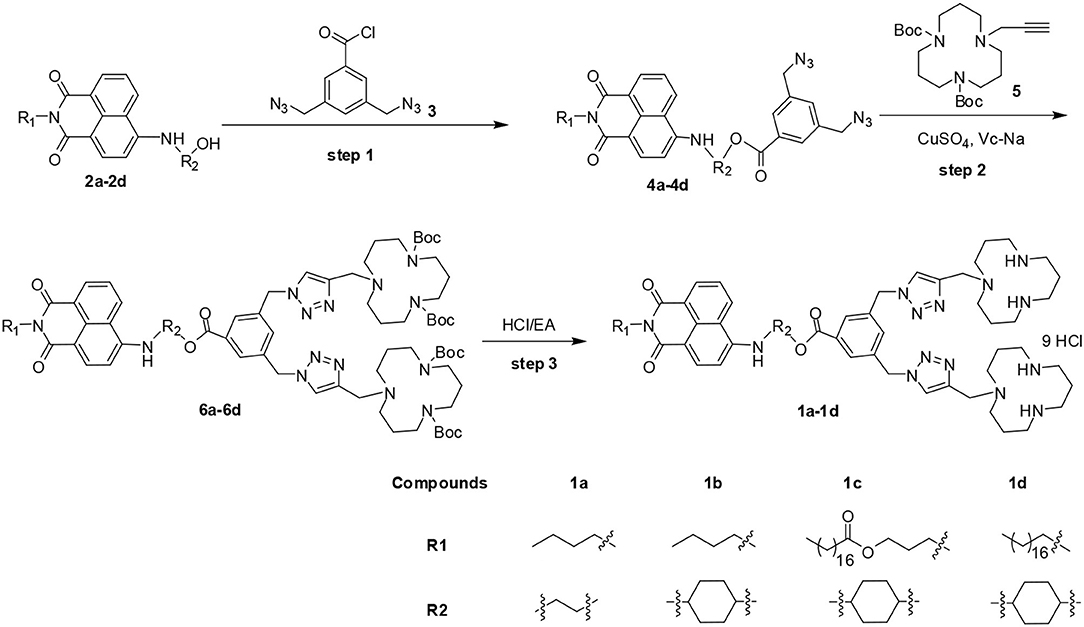
Scheme 1. Synthetic routes of multifunctional compounds 1a–1d.
Spectroscopic Properties of 1a−1d
The absorption and fluorescence spectra of 1a−1d were measured in water-Tris-HCl buffer (1 mM, pH = 7.2). As shown in Figure S1A, all the compounds exhibited three similar absorption peaks in the range of 250–525 nm. The broadest absorption peak ranging from 350 to 525 nm should be produced by 1,8-naphthalimide unit. The fluorescence spectra of 1a−1d showed that there were no obvious changes on the maximum emission wavelength, which appeared at 541, 546, 540, and 536 nm, respectively (Figure S1B). Subsequently, the fluorescence spectra changes of 1a−1d were measured upon addition of 5 equivalents of different metal ions (Ag+, Ca2+, Cd2+, Co2+, Fe3+, Hg2+, K+, Li+, Mg2+, Na+, Ni2+, Pb2+, Zn2+, and Cu2+) in Tris-HCl buffer. As shown in Figure 2, the fluorescence intensities of 1a–1d decreased significantly after addition of Cu2+, and the fluorescence was reduced about 116-, 20-, 12-, and 14-fold, respectively. However, no obvious fluorescence decrease was observed for other metal ions. Interestingly, Fe3+ could produce obvious enhancement of the fluorescence intensity of 1c (~1-fold). However, it had no obvious influence on fluorescence of other probes such as 1a, 1b, and 1d. The fluorescence enhancement phenomenon should be ascribed to the special structure of 1c. Two carbonyl groups existed in 1,8-naphthalimide, and the long hydrophobic chain might be coordinated with Fe3+, which could effectively inhibit photoinduced electron transfer (PET) of 1,8-naphthalimide (Kucheryavy et al., 2011). These results could give us clues to design high selective Cu2+ and Fe3+ probes.
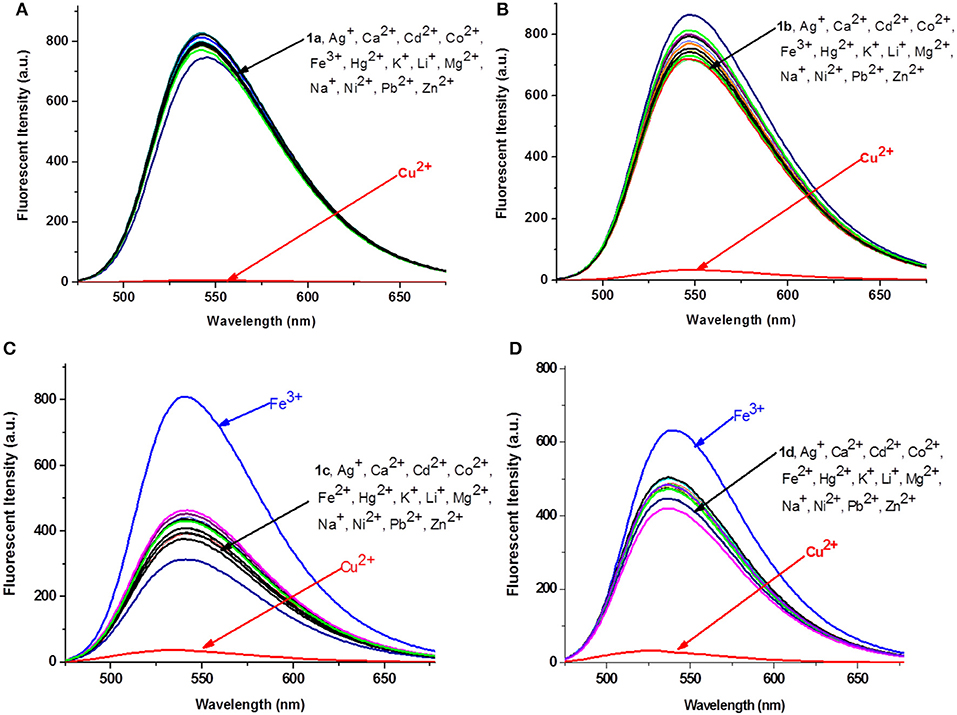
Figure 2. Fluorescence changes (A–D) of 1a−1d (1 × 10⁻⁵ M, Tris-HCl buffer, 1 mM) upon the addition of 5 equivalents of various metal ions.
The fluorescence titrations of 1a–1d with Cu2+ were performed in 1 mM Tris-HCl buffer. As shown in Figure 3, after addition of Cu2+, the fluorescence of 1a–1d was quenched significantly, with the maximum emission at 541, 546, 540, and 536 nm, respectively. Furthermore, we found that a good linear relationship existed between Cu2+ concentration and fluorescent intensities of 1a, 1b, and 1c (0–2.0 equiv. of Cu2+). According the formula (LOD = 3σ/k), the limits of detections of 1a−1c were calculated to be 2.62 × 10⁻⁹, 4.51 × 10⁻⁹, and 1.17 × 10⁻⁸ M, respectively, which are greatly lower than the limit of Cu2+ ions in drinking water (20 μM) determined by the EPA (Zhu et al., 2012). Note that, for probe 1d, this linear relationship was changed less obviously ranging from 0 to 2.0 equivalents of Cu2+, which could be explained by stating that the long alkyl chain was not good for coordination between 1,8-naphthalimide and Cu 2+. To confirm the stoichiometry between 1 and Cu2+, Job's plot analyses were carried out. As shown in Figure S2, a 1:2 binding mode was found between compound 1 and Cu2+, which was in agreement with the fluorescence titration analyses. The binding manner of 1 with Cu2+ was given referring to the above results and our previous report (Gao et al., 2016a). As shown in Figure S3, The quenching effects of 1a–1d should be ascribed to the coordination of the amino group linked with 1,8-naphthalimide and the triazole-[12]aneN3 unit with Cu2+ as well as the paramagnetic effect of Cu2+ ions (Rorabache, 2004; Huang et al., 2014).
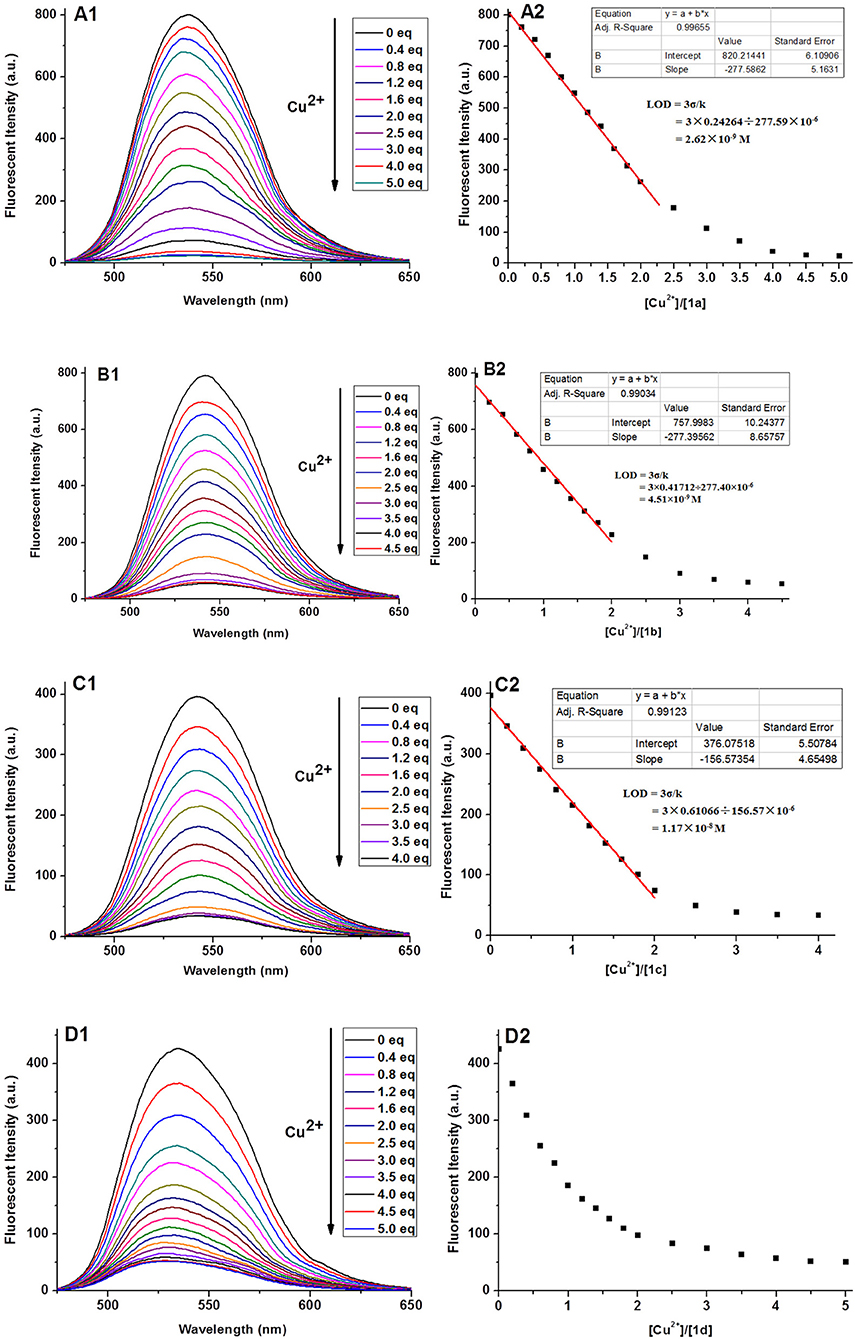
Figure 3. Fluorescence spectra (A1–D1) of 1a–1d (10 μM) upon the addition of Cu2+ and the fluorescence intensity (A2–D2) as a function of the molar ratio ([Cu2+]/[1]) in aqueous solution (1 mM Tris-HCl, pH 7.2).
Solvents Effect on Cu2+ Recognition
As high performance Cu2+ sensors, they should have the ability to resist interference from complex environments. Therefore, fluorescence changes of compounds 1a–1d were measured upon addition of 5 equivalents of Cu2+ in water (H2O), dimethyl sulfoxide (DMSO), acetonitrile (CH3CN), N, N-dimethylformamide (DMF), methanol (MeOH), ethanol (EtOH), and tetrahydrofuran (THF) solvents. As shown in Figure 4, generally speaking, water, acetonitrile, and tetrahydrofuran were good solvents for 1a–1d to recognize Cu2+. Especially for probe 1a (Figure 4A), its fluorescence intensity was decreased more than 80-fold in the presence of Cu2+ in the above three solvents. DMSO and DMF, by contrast, gave weak Cu2+ recognition effect. However, the fluorescence of 1a–1d still reduced more than 5-fold upon addition of Cu2+ in all tested solvents. These results make us believe that compounds 1a–1d can be applied as fluorescence probes for recognition Cu2+ in different solvents, owing to their strong anti-interference capabilities.
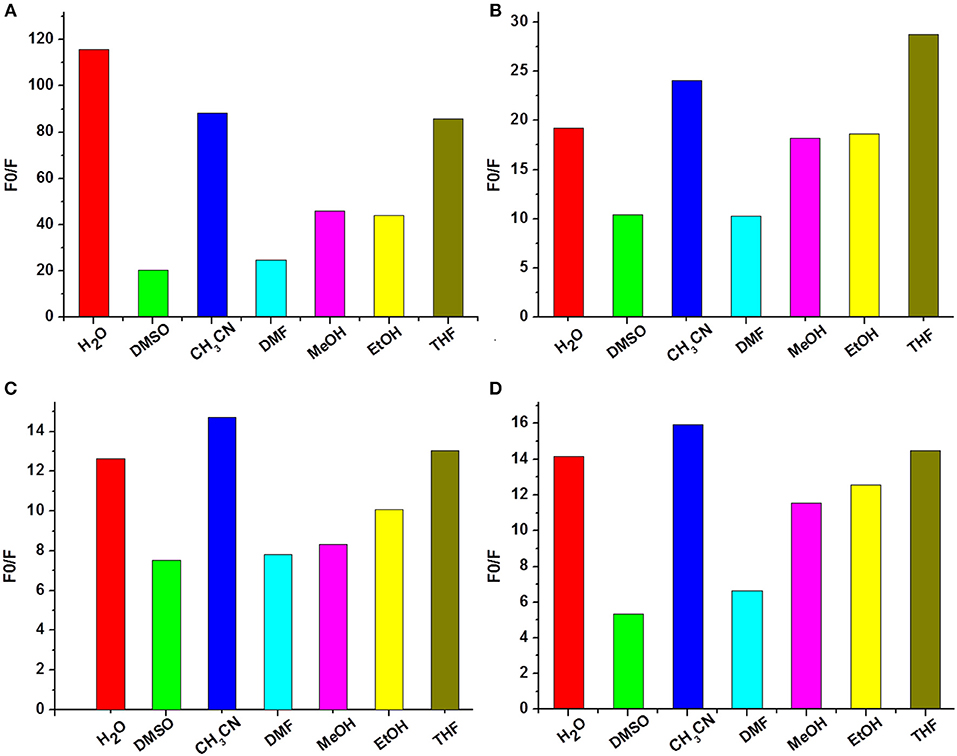
Figure 4. Fluorescence changes (A–D) of 1a–1d (10 μM) upon the addition of Cu2+ in different solvents (1 mM Tris-HCl, pH 7.2).
pH Dependence
The pH responses of 1a−1d were also investigated in the presence of 5 equivalents of Cu2+ in aqueous solution. As shown in Figure 5, the fluorescence of the 1-Cu complex was almost thoroughly quenched at pH > 5.5. Therefore, 1a−1d can probably be employed as useful probes for recognition of Cu2+ under biological conditions. Interestingly, a significant fluorescence change was observed in the pH range from 4.0 to 5.5. It is well-known that the pH value of lysosome lumen ranges from 4.0 to 6.0, while the cytoplasm is about 7.2 (Zhang et al., 2015), which inspires us to use the complexes of 1-Cu to stain lysosome in living cells.
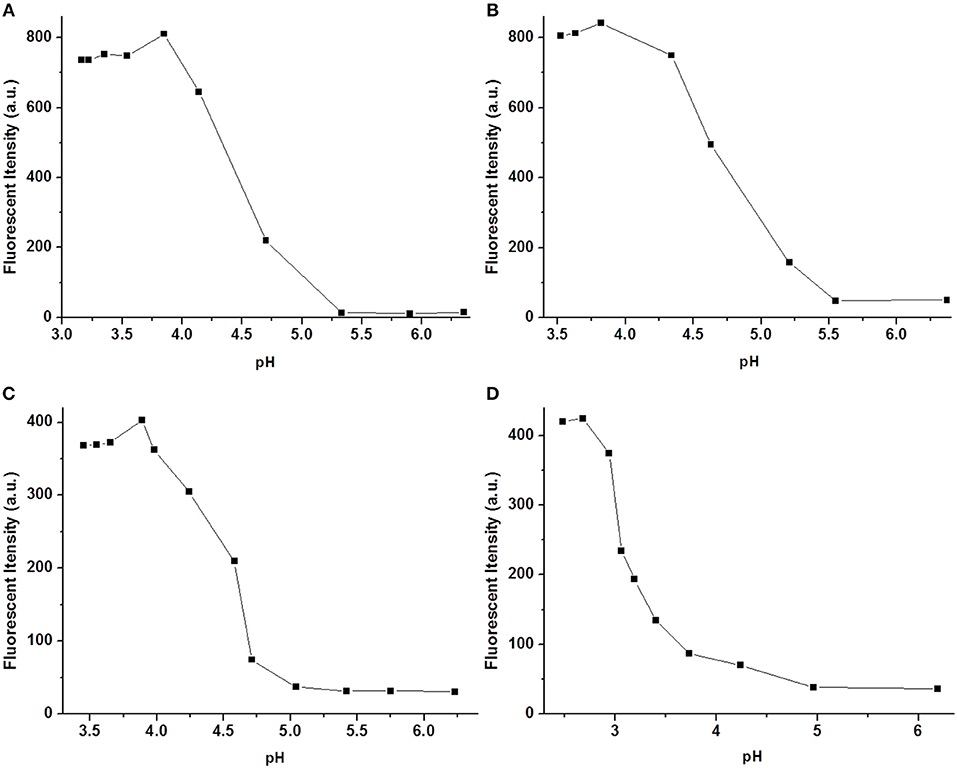
Figure 5. Fluorescence spectra (A–D) of 1a–1d (10 μM) upon the addition of Cu2+ in aqueous solution (1 mM Tris-HCl, pH 7.2).
Cell Imaging
In order to investigate the biological applications of 1a–1d, the fluorescence microscopy experiment was carried out in living cells. As shown in Figures 6A1–D1, the cell retained its normal morphology after being incubated with 1a–1d. All the probes can readily penetrate living HeLa cells and emit bright green fluorescence under a fluorescence microscope (Figures 6A2–D2). When 10 equivalents of Cu2+ were added, the fluorescence intensities of 1a–1d decreased significantly (Figures 6A3–D3). After 60 min, almost no obvious fluorescence change was observed (Figures 6A4–D4). However, the fluorescence was not completely quenched, especially for 1a and 1b, and bright green fluorescence was still observed, which could be caused by the acidic environment of lysosomes (pH 4.0–6.0). It was also found that the cellular morphology was changed obviously after addition of compound 1d and Cu2+, which might be caused by the toxicity of 1d and free copper ions. These results further showed that the 1-Cu complex could be used as a pH probe for lysosome imaging.
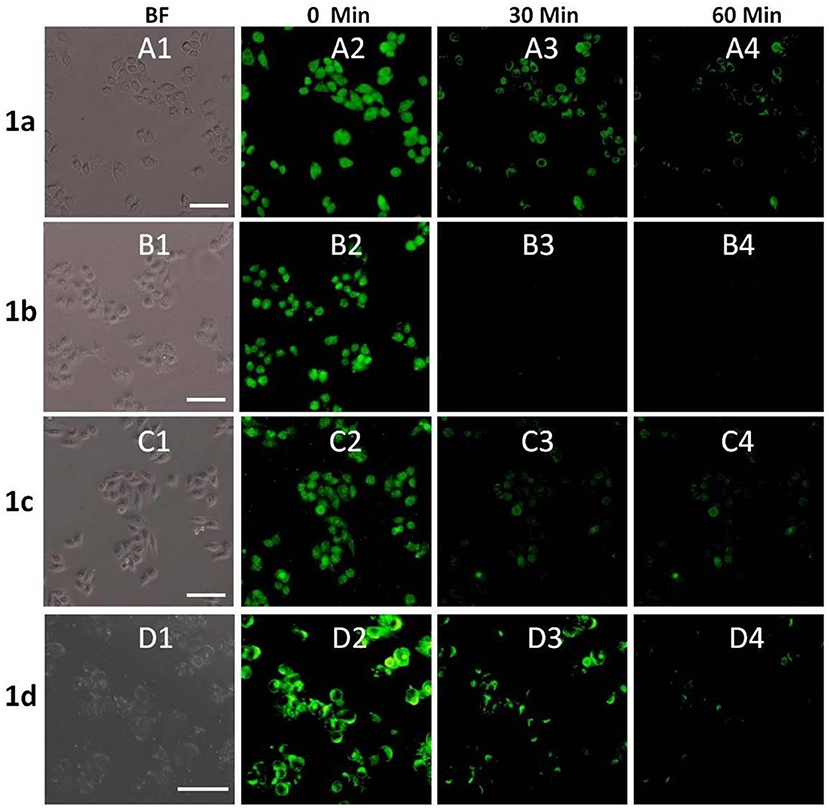
Figure 6. Fluorescence microscope images of HeLa cells incubated with 1a–1d (20 μM) upon addition of Cu2+ (bright field: A1–D1) for 0 min (A2–D2), 30 min (A3–D3) and 60 min (A4–D4). The scale bar in the figure is 30μm.
Lysosome Imaging
It is well-known that lysosomes are one of the important organelles in eukaryotic cells. They play a key role in the degradation of macromolecules and cell components (Wong et al., 2018). The fluorescence microscopy results show that 1a–1d can easily penetrate living HeLa cells, and the fluorescence of 1a/1b cannot be completely quenched by Cu2+. In order to confirm whether the incomplete quenching was caused by the acid environment of lysosomes, co-localization analysis of 1a-Cu (1b-Cu) and Lyso-Tracker Red (a commercial lysosome staining agent) was performed in HeLa cells. Firstly, 20 μM of 1a/1b-Cu complexes was incubated with HeLa cells for 30 min in DMEM medium. Then the medium was replaced with fresh medium containing Lyso-Tracker Red and incubated for another 30 min. As shown in Figure 7, the bright green fluorescence of 1a-Cu and 1b-Cu and the red fluorescence of Lyso-Tracker Red were observed in HeLa cells. The localization of 1a-Cu and 1b-Cu in the cells was almost identical to that of Lyso-Tracker Red. These results suggested that 1a-Cu and 1b-Cu complexes can be used as fluorescence probes to specifically label lysosomes in HeLa cells.
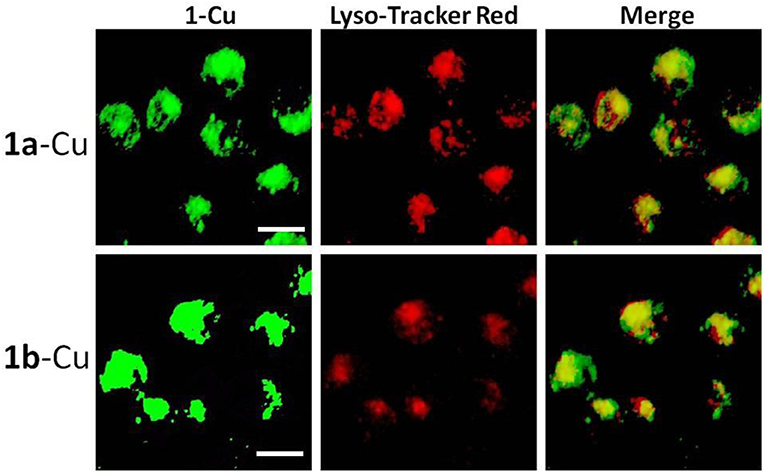
Figure 7. Fluorescence microscope images of HeLa cells incubated with 1a-Cu and 1b-Cu complexes (20 μM) for 0.5 h and Lyso-Tracker Red for 0.5 h. A representative result from three independent experiments. The scale bar in the figure is 10 μm.
Characterization of 1a−1d/RNA Complexes
As a gene carrier, the proper particle size and zeta-potential are of critical importance for efficient gene delivery. Therefore, the size distribution and zeta potential of the 1a–1d/RNA complexes were measured at different concentrations of MFCs 1a–1d via dynamic light scattering (DLS) assay. As shown in Figure 8A, the MFCs 1a–1c could efficiently condense RNA into nanoparticles with diameters ranging from 450 to 600 nm, while the particle derived from 1d/RNA was much smaller than that of 1a−1c/RNA complexes. It is probable that a simple long hydrophobic alkyl chain will lead to a stronger hydrophobic effect and further result in a smaller particle (Zhang et al., 2011). Meanwhile, surface potentials of 1a−1d/RNA complexes were also measured by DLS, and the results are shown in Figure 8B. The zeta potential of the four complexes rose along with the increasing of the concentration from 10 to 60 μM. Compared to other MFCs, compound 1d modified with octadecylamine gave higher zeta potential, indicating that the simple long hydrophobic alkyl chain would gather the positive charge. Meanwhile, the morphology and shape information of 1a/RNA was observed by scanning electron microscopy (SEM) and is shown in Figure 8C. The MTC 1a could compact RNA into spherical nanoparticles with a diameter of 400–600 nm at a concentration of 20 μM, which was consistent with that determined by DLS.
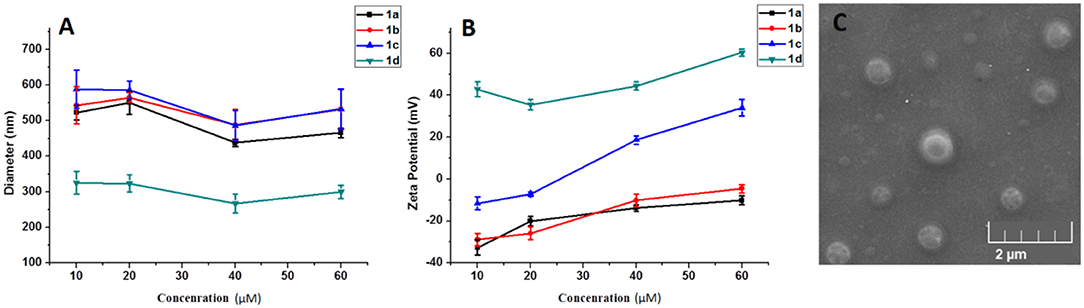
Figure 8. Mean particle size (A) and zeta-potential (B) of the complexes formed from the 1a–1d under various concentrations (10–60 μM). Data are presented as mean ± s.d. (n = 3). A representative result from three independent experiments. SEM image (C) of 1a/RNA complex at a concentration of 20 μM.
Cytotoxicity of 1a−1d
We further evaluated the cytotoxicities of the complexes of MFCs 1a−1d/RNA on HeLa cells and CCC-HPF-1 using a standard MTT assay. As shown in Figure 9, cytotoxicities of 1a–1d/RNA showed better biocompatibility on normal cells (CCC-HPF-1) than on tumor cells (HeLa). The cell viabilities on HeL a cells were still >75% at concentrations ranging from 5 to 30 μM, which are slightly higher than that of lipofectamine 2000. Compared to complexes of 1a–1d/RNA, the MFCs 1a–1d (without RNA) showed higher cytotoxicity and the cell viabilities were only more than 60% in most cases (Figure S4), which should be caused by excess positive charges of triazole and [12]aneN3 units. It was also found that the cytotoxicity increased with the increasing concentrations of these MTCs, but it was still acceptable under the tested concentrations, indicating that it was suitable for further gene delivery.
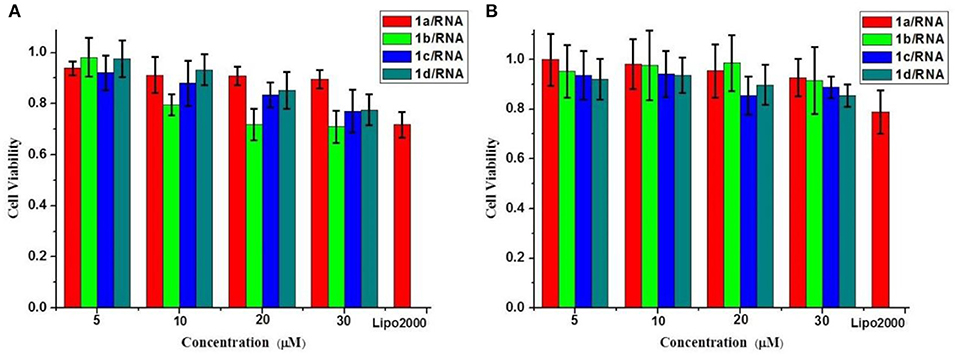
Figure 9. Cytotoxicities of the complexes of MFCs 1a–1d/RNA at different concentrations on HeLa cells (A) and CCC-HPF-1 cells (B). Data are presented as mean ± s.e.m. (n = 5).
Cell Uptake of 1a−1d/RNA Complexes
To investigate the capacity of these MTCs to delivery RNA as non-viral vectors, cellular uptake mediated by 1a–1d was carried out by using fluorescence microscopy. Twenty-five kilodaltons of PEI and lipofectamine 2000 served as positive controls. In order to observe the information of cellular uptake, siRNA was labeled with a red dye Cy5. Before a direct comparison on RNA delivery ability of these materials, cellular uptake mediated by 1c was firstly performed at different concentrations. The w/w ratios of PEI/RNA and lipofectamine 2000/RNA were also screened on the HeLa cells. It was found that the cellular uptake mediated by 1c showed the highest red fluorescence density at the concentration of 20 μM (Figure S5). Meanwhile, the best w/w ratios for PEI/RNA and lipofectamine 2000/RNA were 5/1 and 20/1, respectively (Figures S6, S7). Subsequently, RNA delivery mediated by 1a–1d was carried out at a concentration of 20 μM in HeLa cells. As shown in Figure 10, all the MTCs exhibited good cellular uptake ability, and almost all the cells were full of green fluorescence. Among these MTCs, compound 1d modified with octadecylamine gave the strongest intensity of red fluorescence, indicating the best RNA delivery ability, which is much better than that of lipofectamine 2000 and PEI.
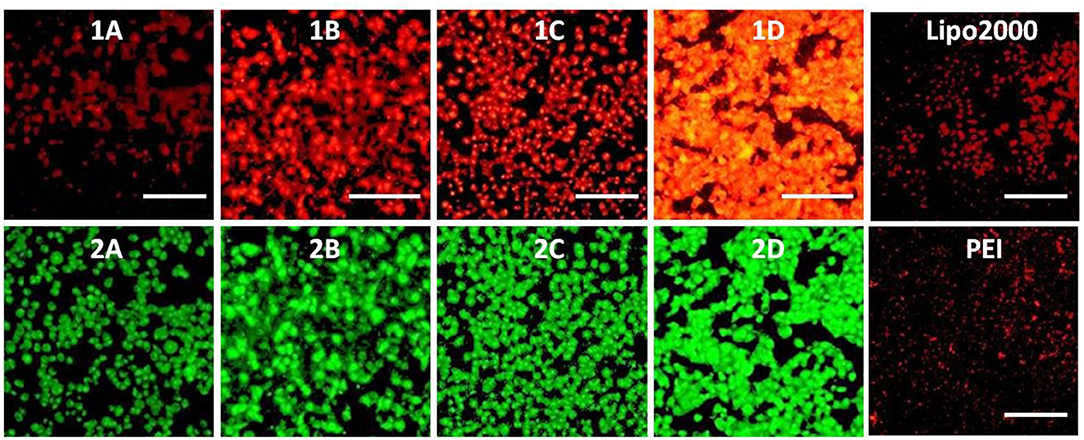
Figure 10. Fluorescence microscope images of HeLa cells transfected with Cy5-labeled RNA (9 μg/mL) by MFCs 1a–1d at a concentration of 20 μM, 25 kD PEI, and lipofectamiine 2000 as positive control. (1A–D): red channels, (2A–D): green channels. A representative result from three independent experiments. The scale bar in the figure is 40 μm.
The RNA delivery ability of 1a–1d was further evaluated in other cell lines. As shown in Figures 11–13, the RNA delivery ability of 1d was superior to those of 1a, 1b, and 1c in HepG2, U2Os, and MC3T3-E1 cells, suggesting that simple long hydrophobic chain-modified MTC could enhance cellar uptake ability. However, when an ester bond was introduced to the long hydrophobic chain (1c), cellar uptake ability would decrease (1c<1d). MTC 1d exhibited excellent RNA delivery ability in the above three cell lines, and its performance was superior to lipofectamine 2000 and PEI, which could be ascribed to the small size of the nanoparticle and high surface potential of 1d/RNA complex, indicating its potential application as a non-viral vector.
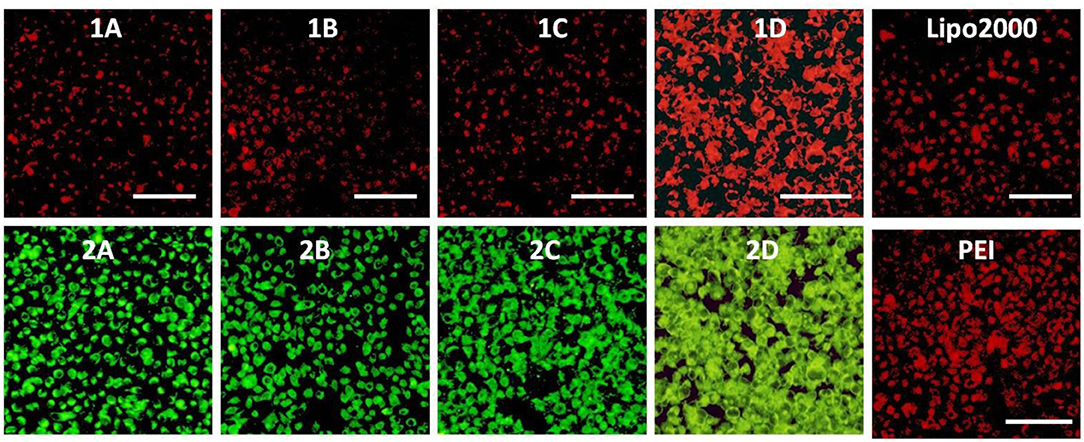
Figure 11. Fluorescence microscope images of HepG2 cells transfected with Cy5-labeled RNA (9 μg/mL) by MFCs 1a–1d at a concentration of 20 μM, 25 kD PEI and lipofectamiine 2000 as positive control. (1A–D): red channels, (2A–D): green channels. A representative result from three independent experiments. The scale bar in the figure is 40 μm.
Figure 12. Fluorescence microscope images of U2O cells transfected with Cy5-labeled RNA (9 μg/mL) by MFCs 1a–1d at a concentration of 20 μM, 25 kD PEI and lipofectamiine 2000 as positive control. (1A–D): red channels, (2A–D): green channels. A representative result from three independent experiments. The scale bar in the figure is 40 μm.
Figure 13. Fluorescence microscope images of MC3T3-E1 cells transfected with Cy5-labeled RNA (9 μg/mL) by MFCs 1a–1d at a concentration of 20 μM, 25 kD PEI and lipofectamiine 2000 as positive control. (1A–D): red channels, (2A–D): green channels. A representative result from three independent experiments. The scale bar in the figure is 50 μm.
Conclusion
A series of 1,8-naphthalimide-modified MFCs 1a–1d were synthesized. They exhibited excellent recognition ability for Cu2+ in aqueous solutions and organic solvents. Due to the good water solubility and high selectivity, MFCs 1a–1d were successfully applied to detect Cu2+ in real-time imaging in living HeLa cells. Furthermore, due to high sensitivity toward pH value ranging from 4.5 to 5.5, 1a-Cu and 1b-Cu were successfully used as fluorescence probes to specifically stain lysosomes in HeLa cells. The RNA delivery ability of MTCs 1a–1d was also evaluated by cellular uptake experiments in HeLa, HepG2, U2Os, and MC3T3-E1 cells. They all exhibited good performance on cellular uptake, especially for MTC 1d, the greatest red fluorescence observed in HeLa cells, which was much better than that of lipofectamine 2000 and PEI. These results will give us further insight to design high-performance multifunctional compounds for fluorescence probes and non-viral vectors.
Data Availability
All datasets generated for this study are included in the manuscript/Supplementary Files.
Author Contributions
Y-GG and F-LL writing-original draft preparation. SP, D-JL, AQ, XL, YT, and YL writing-review and editing. A-RQ funding acquisition.
Conflict of Interest Statement
The authors declare that the research was conducted in the absence of any commercial or financial relationships that could be construed as a potential conflict of interest.
Acknowledgments
The authors gratefully acknowledge the financial assistance provided by Shaanxi Provincial Science and Technology Department (2019JM-230) and the National Natural Science Foundation of China (31570940 and 81700784).
Supplementary Material
The Supplementary Material for this article can be found online at: https://www.frontiersin.org/articles/10.3389/fchem.2019.00616/full#supplementary-material
References
Aderinto, S. O., and Imhanria, S. (2018). Fluorescent and colourimetric 1, 8-naphthalimide-appended chemosensors for the tracking of metal ions: selected examples from the year 2010 to 2017. Chem. Pap. 72, 1823–1851. doi: 10.1007/s11696-018-0411-0
Banerjee, S., Veale, E. B., Phelan, C. M., Murphy, S. A., Tocci, G. M., Gillespie, L. J., et al. (2014). Recent advances in the development of 1,8-naphthalimide based DNA targeting binders, anticancer and fluorescent cellular imaging agents. Chem. Soc. Rev. 44, 1601–1618. doi: 10.1039/c2cs35467e
Behr, J. P. (1993). Synthetic gene transfer vectors. Pure. Appl. Chem. 66, 827–835. doi: 10.1351/pac199466040827
Bojinov, V. B., Georgiev, N. I., and Bosch, P. (2009). Design and synthesis of highly photostable yellow–green emitting 1,8-naphthalimides as fluorescent sensors for metal cations and protons. J. Fluoresc. 19, 127–139. doi: 10.1007/s10895-008-0394-2
Dai, F., Jin, F., Long, Y., Jin, X. L., and Zhou, B. (2018). A 1,8-naphthalimide-based turn-on fluorescent probe for imaging mitochondrial hydrogen peroxide in living cells. Free Radic. Res. 52, 1–151. doi: 10.1080/10715762.2018.1446530
Duke, R. M., Veale, E. B., Pfeffer, F. M., Kruger, P. E., and Gunnlaugsson, T. (2010). Colorimetric and fluorescent anion sensors: an overview of recent developments in the use of 1,8-naphthalimide-based chemosensors. Chem. Soc. Rev. 39, 3936–3953. doi: 10.1039/b910560n
Gao, Y. G., Alam, U., Ding, A. X., Tang, Q., Tan, Z. L., Shi, Y. D., et al. (2018). [12]aneN 3 -based lipid with naphthalimide moiety for enhanced gene transfection efficiency. Bioorg. Chem. 79, 334–340. doi: 10.1016/j.bioorg.2018.04.018
Gao, Y. G., Shi, Y. D., Zhang, Y., Hu, J., Lu, Z. L., and He, L. (2015). A naphthalimide-based [12]aneN3 compound as an effective and real-time fluorescence tracking non-viral gene vector. Chem. Commun. 51, 16695–16698. doi: 10.1039/C5CC06753G
Gao, Y. G., Tang, Q., Shi, Y. D., Zhang, Y., and Lu, Z. L. (2016a). 1,8-Naphthalimide modified [12]aneN 3 compounds as selective and sensitive probes for Cu2+ ions and ATP in aqueous solution and living cells. Talanta 152, 438–446. doi: 10.1016/j.talanta.2016.02.040
Gao, Y. G., Uzair, A., Tang, Q., Shi, Y. D., Zhang, Y., Wang, R., et al. (2016b). Functional lipids based on [12]aneN3 and naphthalimide as efficient non-viral gene vectors. Org. Biomol. Chem. 14, 6346–6354. doi: 10.1039/C6OB00917D
Grabchev, I., Chovelon, J. M., and Qian, X. (2003). A polyamidoamine dendrimer with peripheral 1,8-naphthalimide groups capable of acting as a PET fluorescent sensor for metal cations. New J. Chem. 27, 337–340. doi: 10.1039/b204727f
Hao, Y., Kanasty, R. L., Eltoukhy, A. A., Vegas, A. J. J., Robert, D., and Anderson, D. G. (2014). Non-viral vectors for gene-based therapy. Nat. Rev. Genet. 15, 541–555. doi: 10.1038/nrg3763
Hao, Y., Nguyen, K. H., Zhang, Y., Zhang, G., Fan, S., Li, F., et al. (2018). A highly selective and ratiometric fluorescent probe for cyanide by rationally altering the susceptible H-atom. Talanta 176, 234–241. doi: 10.1016/j.talanta.2017.08.032
Huang, C. B., Li, H. R., Luo, Y., and Xu, L. (2014). A naphthalimide-based bifunctional fluorescent probe for the differential detection of Hg2+ and Cu2+ in aqueous solution. Dalton Trans. 43, 8102–8108. doi: 10.1039/c4dt00014e
Huo, X., Tian, X., Li, Y., Lei, F., Cui, Y., Chao, W., et al. (2018). A highly selective ratiometric fluorescent probe for real-time imaging of β -glucuronidase in living cells and zebrafish. Sens. Actuat. B Chem. 262, 508–515. doi: 10.1016/j.snb.2018.02.047
Jun Feng, Z., Sooyeon, K., Hae, H. J., Seung-Jea, L., Tuhin, P., Yong, C. Q., et al. (2011). Pyrophosphate-selective fluorescent chemosensor based on 1,8-naphthalimide-DPA-Zn(II) complex and its application for cell imaging. Org. Lett. 13, 5294–5297. doi: 10.1021/ol202159x
Kucheryavy, P., Khatmullin, R., Mirzakulova, E., Zhou, D., and Glusac, K. D. (2011). Photoinduced electron transfer in naphthalimide-pyridine systems: effect of proton transfer on charge recombination efficiencies. J. Phys. Chem. A 115, 11606–11614. doi: 10.1021/jp2056909
Niidome, T., and Huang, L. (2002). Gene therapy progress and prospects: nonviral vectors. Gene Ther. 9:1647. doi: 10.1038/sj.gt.3301923
Pan, X., Thompson, R., Meng, X., Wu, D., and Xu, L. (2011). Tumor-targeted RNA-interference: functional non-viral nanovectors. Am. J. Cancer Res. 1, 25–42.
Ren, J., Zhen, W., Ying, Z., Yan, L., and Xu, Z. (2011). Colorimetric fluoride sensor based on 1,8-naphthalimide derivatives. Dyes Pigm. 91, 442–445. doi: 10.1016/j.dyepig.2011.04.012
Rorabache, D. B. (2004). Electron transfer by copper centers. Chem. Rev. 104, 651–679. doi: 10.1021/cr020630e
Seow, W. Y., and Yang, Y. Y. (2009). Functional polycarbonates and their self-assemblies as promising non-viral vectors. J. Control. Release 139, 40–47. doi: 10.1016/j.jconrel.2009.05.028
Seraj, S., Rohani, S., and Faridbod, F. (2018). Fructose recognition using new “off-on” fluorescent chemical probes based on boronate-tagged 1,8-naphthalimide. New J. Chem. 42, 19872–19880. doi: 10.1039/C8NJ05092A
Shahid, M., Chawla, H. M., and Pant, N. (2018). An efficient molecular probe for visual detection of adenosine triphosphate in aqueous medium. J. Lumin. 203, 195–202. doi: 10.1016/j.jlumin.2018.06.006
Verma, I. M., Naldini, L., Kafri, T., Miyoshi, H., Takahashi, M., Blömer, U., et al. (1997). Gene therapy: promises, problems and prospects. Nature 389, 239–242. doi: 10.1038/38410
Wong, Y. C., Ysselstein, D., and Krainc, D. (2018). Mitochondria–lysosome contacts regulate mitochondrial fission via RAB7 GTP hydrolysis. Nature 554, 382–386. doi: 10.1038/nature25486
Xie, Z. D., Fu, M. L., Yin, B., and Zhu, Q. (2018). Research progress in 1,8-naphthalimide-based fluorescent probes for two-photon imaging. Chin. J. Org. Chem. 38, 1364–1376. doi: 10.6023/cjoc201712031
Xu, W. (2008). Progress in 1,8-naphthalimide fluorescent dyes for OLEDs. Chem. Ind. Times 9, 45–49. doi: 10.16597/j.cnki.issn.1002-154x.2008.09.007
Zhang, F. Q., Yang, H. W., Yi, J. W., Zhang, J., Ren, J., Luo, Y. T., et al. (2011). 1,4,7-triazycyclononane-containing cationic lipids with ester bond: preparation and application in gene delivery. Bioorg. Med. Chem. Lett. 21, 7045–7049. doi: 10.1016/j.bmcl.2011.09.098
Zhang, X. F., Zhang, T., Shen, S. L., Miao, J. Y., and Zhao, B. X. (2015). A ratiometric lysosomal pH probe based on the naphthalimide–rhodamine system. J. Mater. Chem. B 3, 3260–3266. doi: 10.1039/C4TB02082K
Zhu, W., Huang, X., Guo, Z., Wu, X., Yu, H., and Tian, H. (2012). A novel NIR fluorescent turn-on sensor for the detection of pyrophosphate anion in complete water system. Chem. Commun. 48, 1784–1786. doi: 10.1039/c2cc16902a,
Keywords: 1,8-naphthalimide, Cu2+, lysosome, non-viral vectors, RNA delivery
Citation: Gao Y-G, Liu F-L, Patil S, Li D-J, Qadir A, Lin X, Tian Y, Li Y and Qian A-R (2019) 1,8-Naphthalimide-Based Multifunctional Compounds as Cu2+ Probes, Lysosome Staining Agents, and Non-viral Vectors. Front. Chem. 7:616. doi: 10.3389/fchem.2019.00616
Received: 06 June 2019; Accepted: 23 August 2019;
Published: 10 September 2019.
Edited by:
Bruno Pagano, University of Naples Federico II, ItalyReviewed by:
Chris Arnatt, Saint Louis University, United StatesKrzysztof Zdzislav Walczak, Silesian University of Technology, Poland
Copyright © 2019 Gao, Liu, Patil, Li, Qadir, Lin, Tian, Li and Qian. This is an open-access article distributed under the terms of the Creative Commons Attribution License (CC BY). The use, distribution or reproduction in other forums is permitted, provided the original author(s) and the copyright owner(s) are credited and that the original publication in this journal is cited, in accordance with accepted academic practice. No use, distribution or reproduction is permitted which does not comply with these terms.
*Correspondence: Ai-Rong Qian, cWlhbmFpckBud3B1LmVkdS5jbg==