 Salim Ok1*
 Bohyun Hwang1
 Tingting Liu1
 Susan Welch1
 Julia M. Sheets1
 David R. Cole1,2
 Kao-Hsiang Liu3
 Chung-Yuan Mou4
- 1School of Earth Sciences, The Ohio State University, Columbus, OH, United States
- 2Department of Chemistry, The Ohio State University, Columbus, OH, United States
- 3Shull Wollan Center-A Joint Institute for Neutron Sciences, Oak Ridge National Laboratory, Oak Ridge, TN, United States
- 4Department of Chemistry, National Taiwan University, Taipei, Taiwan
We investigate dynamics of water (H2O) and methanol (CH3OH and CH3OD) inside mesoporous silica materials with pore diameters of 4.0, 2.5, and 1.5 nm using low-field (LF) nuclear magnetic resonance (NMR) relaxometry. Experiments were conducted to test the effects of pore size, pore volume, type of fluid, fluid/solid ratio, and temperature on fluid dynamics. Longitudinal relaxation times (T1) and transverse relaxation times (T2) were obtained for the above systems. We observe an increasing deviation in confined fluid behavior compared to that of bulk fluid with decreasing fluid-to-solid ratio. Our results show that the surface area-to-volume ratio is a critical parameter compared to pore diameter in the relaxation dynamics of confined water. An increase in temperature for the range between 25 and 50°C studied did not influence T2 times of confined water significantly. However, when the temperature was increased, T1 times of water confined in both silica-2.5 nm and silica-1.5 nm increased, while those of water in silica-4.0 nm did not change. Reductions in both T1 and T2 values as a function of fluid-to-solid ratio were independent of confined fluid species studied here. The parameter T1/T2 indicates that H2O interacts more strongly with the pore walls of silica-4.0 nm than CH3OH and CH3OD.
Introduction
There has been enormous interest in understanding the behavior of nanoconfined fluids due to its relevance in various areas such as biology and geochemistry (Vogel, 2010; Millischuk and Ladanyi, 2014). The behavior of molecules in confined geometries differs significantly from bulk behavior (Vogel, 2010; D'Agostino et al., 2012). This deviation arises from several factors including the relation between fluid and nanoporous matrix, and the effects of the size, shape, and geometry of the solid matrix on fluid behavior (Vogel, 2010; D'Agostino et al., 2012; Millischuk and Ladanyi, 2014). The issues on physical and chemical properties of confined fluids are heavily discussed (D'Agostino et al., 2012; Mallamace et al., 2014) along with the characterization of mesoporous solids with precise pore structure (Webber and Dore, 2004). Fundamental understanding of porous systems and their interaction with confined liquids is essential because mesoporous solids are used as model systems relevant to geological materials in the subsurface and have applications in separations, nanofluids, and catalysis (Millischuk and Ladanyi, 2014).
Mesoporous silica systems are a group of nanoporous materials with distinct cylindrical mesochannels, easily adjustable pore sizes, large surface areas, and even tunable particle sizes and shapes (Asefa and Tao, 2012). These mesoporous materials have generated interest because of their possible uses as supports for practical innovative materials (Al-Othman, 2012). Due to their large surface areas, these engineered proxies are ideal nanoporous systems for exploring confined fluid behavior at pore surfaces. For porous silica glasses, various degree of pore filling as compared to total pore volume of the nanoporous material with distilled water have been investigated with both relaxation and diffusion NMR approaches (Bhattachrja et al., 1989; D'Orazio et al., 1990a,b). Both longitudinal (T1) and transverse (T2) relaxation measurements showed a linear relationship with respect to fluid filling equivalent to monolayer coverage. This arises from the homogeneity of nanopores where the water molecules are evenly distributed. In the current study, we provide detailed characterization on the properties of mesoporous materials and discuss how the properties of these mesoporous materials influence the dynamics of confined fluids.
There are contradictory conclusions on the confined fluid behavior of nanoporous systems. For instance, D'Agostino et al. (2012) observed that diols, such as ethylene glycol and 1,2-propanediol, showed increased diffusivity within the pore space of titania (22 nm average pore size) and silica (13 nm average pore size) compared to alkanes including n-hexane and n-octane. T1 measurements also demonstrated that tumbling rate of polyols was not influenced by the porous medium while there was a significant drop of T1 for the alkanes. Among confined fluids, water has central significance for gaining insight into a wide range of systems including various geological and technological materials. In general, despite large number of literature work on confined water, the behaviors such as diffusion property of water in confined geometry is not fully understood (Ricci and Rovere, 2000; Swenson et al., 2001). The contradictory results are attributed to different factors such as competition between confinement and surface effects, dependence on temperature, and the characteristics of the surface interactions-hydrophilic vs. hydrophobic (Swenson et al., 2001). Experimental studies on water showed decreasing motion with increasing confinement for various surface substrates (Bellisent-Funel et al., 1995; Denisov and Halle, 1996; Zanotti et al., 1999). Contradictory results, such as an extensive hydrogen bonded network of water close to the surface (Steytler and Dore, 1985) vs. a reduction in number of hydrogen bonds per water molecule near cavity walls (Bruni et al., 1998) have been observed. Besides that, the influence of confinement is less pronounced in two-dimensional substrate type confinements than in three-dimensional confinements such as pores (Barut et al., 1998; Bergman and Swenson, 2000). Because of the controversial interpretations of the behaviors of confined fluids and water in particular, there is still a need to probe the molecular-level behavior of fluids as a function of a number of key parameters including, but not limited to, pore size, pore volume, fluid type, fluid-to-solid ratio, and temperature. In addition, conducting research on simple fluids such as water in confined state and developing models on confined behavior of low viscous fluids could be extended and utilized for better experimental design and understanding of complex fluids under confinement. For instance, mesoporous silica type materials are of special interest in crude oil industry, and these materials are ideal engineering proxies to investigate larger organic molecules such as decalin and tetradecane, and their mixtures to mimic a micro-environment resembling a petroleum aromatic fraction (Kapur et al., 2000) under confinement.
The novelty of the current work is studying dynamical behavior of fluids in confined states systematically by varying fluid volume, temperature, and pore diameter of the confining solid to better understand complex heterogeneous subsurface systems. These include fluids such as water and hydrocarbons in rock that have various wetting behaviors in the subsurface. The remarkable aspect of the mesoporous silica materials used in the present study is the utilization of them as catalyst materials in petroleum industry. Therefore, the projection of this work will be to extend the current efforts in terms of investigating more complex mixtures of fluids under confinement. In order to focus on that, first emphasis is showing distinguishability of confined vs. bulk-like fluids.
Our approach to distinguish the signals of fluids between confined and bulk-like states in different pore networks may have applications in rock core analysis using low-field NMR. To this end, in addition to using nanoporous silica powder, nanoporous silica rods (monolith samples) also were used, allowing for the study of confinement of water without excess water. Excess water has been observed in the case of mixtures of white powder nanoporous silica with water upon centrifugation, and it is bulk-like water. However, in the case of silica rods, there is no excess water outside the rod itself. First, the dynamical behaviors of bulk fluids in an NMR were determined by NMR relaxation measurements. Then the same NMR measurements were conducted on nanoporous silica powders having confined fluid (fluid in mesoporous silica and fluid interacting with the pore walls), as well as fluid in the interparticle regions of nanoporous silica powder and outside the pores, and excess fluid (fluid observed upon centrifugation of mixtures of nanoporous silica and fluids and showing bulk-like dynamical behavior). Hence, we aim to achieve the following goals: (i) to characterize the nanoporous silica systems in detail, (ii) to determine the degree of deviation of confined fluid behavior with respect to bulk fluid, (iii) to clarify the influence of pore parameters to the deviation of confined fluid behavior from bulk, and (iv) to show how to differentiate signals of confined fluid in nanopores from excess fluid.
Materials and Methods
Samples
Mesoporous silica with mean nanopore diameter and particle size of 4 and 200 nm, respectively, was purchased from Sigma-Aldrich. The silica porous monolith samples with nominal pore diameter of 5.0 nm, total pore volume of 0.7 cm3, specific density of 1.1 cm3, and BET surface area of 580 m2/g were purchased from Particle Solutions, LLC (Alachua, FL). Silica-1.5 nm was prepared by calcination of micellar template silica matrices made up of micrometer size grains. Pre-formed β-zeolite kernels (composed of tetraethylammonium hydroxide), NaOH, and fumed silica reacted with decylmethylammonium bromide solution in order to synthesize the silica matrix (Liu et al., 2013). The β-zeolite seeds were utilized to make the silica nanopore walls semi-crystalline and resilient to hydrolysis deterioration (Liu et al., 2000). The mixture was first relocated into an autoclave at 120°C for 2 days, then decreased to room temperature while adjusting the pH to 10. Upon sealing in an autoclave at 100°C for 2 days, the probe was accumulated by filtration in solid state, washed by water and ethanol, and dried at 60°C in air overnight. The ultimate mesoporous silica was obtained by calcination at 540°C for 8 h (Liu et al., 2013). Silica-2.5 nm was produced by an analogous procedure. The minor difference was the utilization of different carbon chain length surfactants or hydrothermal curing (Liu et al., 2013). Both silica-2.5 nm and silica-1.5 nm are cured with the second hydrothermal treatment; hence have even stronger structure and better hydrolysis resilience. Liu et al. (2006) provides further description on the synthesis of these two samples of silica-2.5 nm and silica-1.5 nm. It should be emphasized that the determined pore diameters of the samples in the present study are average values.
Characterization
Pore size, pore volume, and surface area measurements were made with a Micromeritics ASAP 2020 gas sorption analyzer. The mesoporous silica samples were degassed at 423 K for 20 h under a vacuum pressure of 10 μm Hg to eliminate the impurities and gases within the pores. Nitrogen was the adsorbate used to acquire the adsorption and desorption isotherms at 77 K (see Table S1 and Figure S1 in Supporting Information). Transmission X-ray diffraction (TXRD) experiments were conducted with a PANalytical X'Pert Pro diffractometer. Transmission geometry permits accurate and precise measurement at the low 2θ angle range required for obtaining the long-range ordered pore structure. A thin layer of specimen was mounted between two films of Kapton foil to reduce beam absorption. TXRD measurements on nanoporous silica-4.0 nm and silica-1.5 nm were acquired using Cu Kα radiation and an X'Celerator detector. Data were acquired from 1 to 43° 2θ, with a step size of 0.02° 2θ and a speed of 20 s/step. Applied voltage and tube current for the measurements were 45 kV and 40 mA. TRXD measurement on silica-2.5 nm was acquired using a scintillation detector. Data were collected from 1 to 15° 25, with a step size of 0.02° 2. and a speed of 12 s/step. Applied voltage and tube current for the measurements were 45 kV and 40 mA (see Figures S2a–c) for TXRD scans of nanoporous silica samples).
Samples for thermogravimetric analysis (TGA) measurements were prepared by blending 150 mg of each silica sample with 1.0 ml distilled water in a 4 ml clear vial. The mixtures were kept at 20°C for a week for complete saturation of the pores with water. After centrifugation of the samples for 20 min at 5,000 rpm on an Eppendorf Centrifuge 5340 V 4.4, supernatant was taken. The samples were left again overnight after stirring with small glass rods. This procedure of centrifugation, removal of supernatant, and overnight keeping were repeated at least 10 days to make it sure that no excess water was left between the grains. Then water saturated porous silica samples were dried under continuous flow of neat air for durations ranging from 5 to 85 min. Successively, 10–20 mg samples were placed into a Pt crucible. Finally, the TGA measurements were run on a Perkin Elmer TGA7 Thermogravimetric Analyzer from 25 to 900°C under the flow of nitrogen gas with a flow rate of 15 ml/min and a heat rate of 20°C/min (see Figures S3a,b showing the TGA results). TG curves of silica samples prepared by different drying times exhibit weight loss behavior. The weight losses correspond to the elimination of water, and hence pore volume comparison of the mesoporous silica materials.
Sample Preparation for Low-Field NMR Measurements
Hundred and fifty milligrams of each mesoporous silica sample were filled with three different amounts of distilled water 0.8, 0.6, and 0.4 ml. The samples were left overnight at least prior to conducting measurements for complete filling of the pores (see Figures S4a–e) in supporting information showing the photos of excess water after centrifugation and homogenization by sonication). For confining CH3OH and CH3OD, silica-4.0 nm was mixed with 0.9, 0.6, and 0.4 ml of each of these fluids. As with water, the samples were left overnight at minimum prior to conducting measurements to ensure complete filling of the pores. The samples were capped to prevent evaporation. Each sample was homogenized by sonication for 15 min immediately prior to the low-field NMR measurements. Controlled measurements were done to distinguish excess fluid signal from confined fluid signal (see Figures S4a–e). As seen in Figure S4, this was achieved by centrifugation of samples for 20 min at 5,000 rpm so that excess water migrated on top of the silica and water mixture (see Table 1 for the summary of the experimental conditions of the samples).
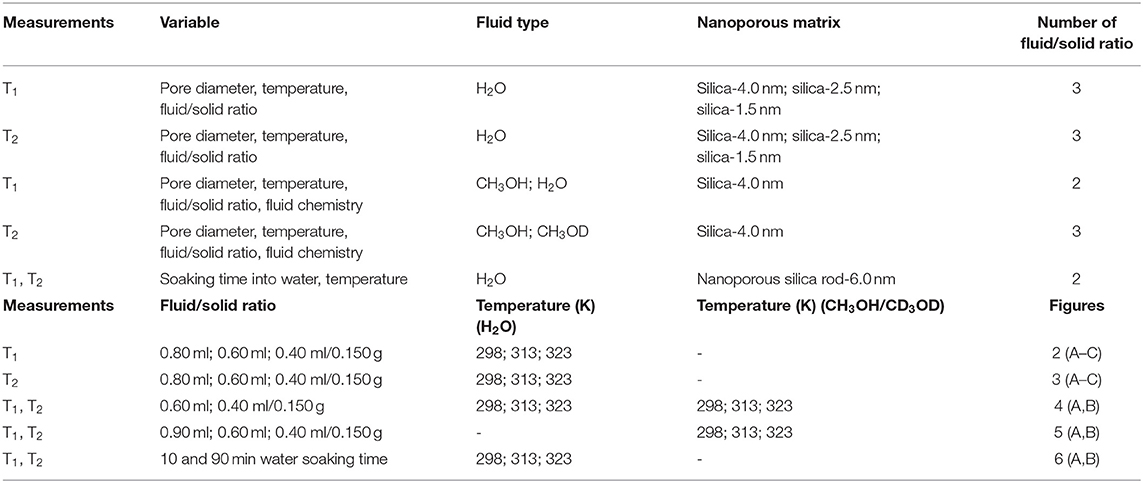
Table 1. Experimental conditions of the low-field NMR measurements.
A second set of samples was prepared as follows: 218.0 mg silica-4.0 nm, 100.0 mg silica-2.5 nm, and 173.0 mg silica-1.5 nm were mixed with 0.4 ml deionized H2O. This adjustment was made to keep the pore volume of each nanoporous silica powder consistent around 120 cm3, for a given amount of surface area (see Table 2 for detailed values). The samples were left for soaking overnight at minimum prior to the measurements to ensure complete pore fillings. The samples were sonicated for 15 min to homogenize throughout the sample right before the measurements. The measurements were conducted at 313 K.
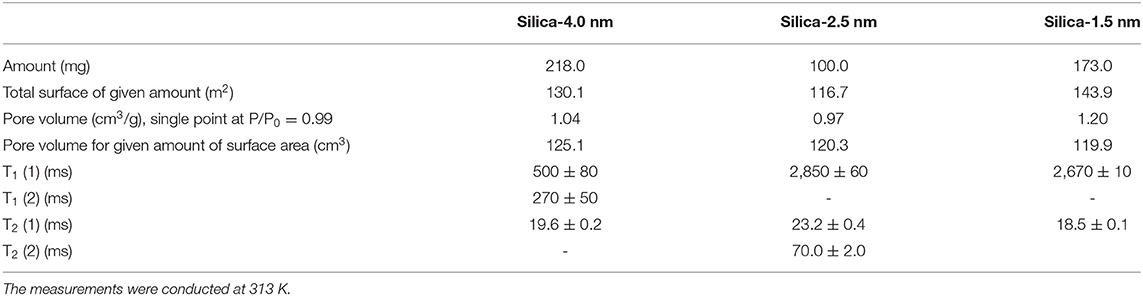
Table 2. T1 and T2 values of confined water obtained by keeping pore volumes approximately constant.
The third set of samples was prepared using porous silica monolith samples that were thermally treated overnight at 400°C to remove moisture and any organics left from the synthesis of the monolith samples. Upon cooling to 25°C, the samples were soaked in water for 10 min, measured and then soaked until 90 min. Visual inspection showed that the sample soaked for 10 min had non-transparent region in the middle of the sample, while such a region was not seen in the sample soaked for 90 min. This non-transparent region is attributed to volume not filled with water.
1H Low-Field NMR Relaxometry Measurements
Low-field NMR T1 and T2 relaxation measurements were performed on a Bruker Minispec mq20 NF Series instrument with a magnetic field strength of 0.47 T equivalent to a proton resonance frequency of 20 MHz (see Table 1 showing the details of experimental conditions), and the data were acquired utilizing Minispec software. The instrument contains a 10 mm temperature-variable probe. Temperature control is achieved using N2 flow and BVT temperature control unit. T1 measurements were completed using the inversion recovery pulse sequence found in the pulse sequence library of Bruker. T2 relaxation measurements were performed utilizing the standard Carr-Pucell-Meiboom-Gill (CPMG) pulse sequence, with τ of 1.0 ms between the 90 and 180° pulses. A continuous distribution of T2 exponential decays and T1 exponential growths correlated to confined and excess fluids were fitted for all T2 and T1 data using the CONTIN algorithm (Provencher, 1982). This analysis results in T2 and T1 distribution data. Bi-exponential decay and growth fittings of T2 and T1 curves, respectively, were completed using Origin 9.1 employing the following equations:
where T21, T22, T11, and T12 are the relaxation constituents, and A21 and A22 are the corresponding scales. The amplitudes A21 and A22 are directly proportional to the amount of fluid either in confined state or as excess. The fraction of T21 or T11 component is calculated as A21/(A21+A22) while portion of T22 or T12 component is determined as A22/(A21+A22).
Results and Discussion
Characterization of the Nanoporous Silica Materials
Figure S1 integrates the N2 adsorption and desorption isotherms for the three samples. Based on the shapes of the isotherms, the 2.5 and 4.0 nm samples can be classified as Type IV (Sing et al., 1985), which possesses mesoporous structure and poses the hysteresis loop caused by capillary condensation in mesopores (Thommes et al., 2015). The silica-2.5 nm material does not show strong hysteresis character because it is near the boundary of mesopore and micropore size ranges. The silica-1.5 nm isotherm is complicated by a Type I isotherm (micropore) below 0.8 P/P0, and a mesoporous hysteresis loop above 0.8 P/P0. The hysteresis is like the H1 type (Tangestaninejad et al., 2009), which is composed of regular pores that have narrow pore distribution. The insets in Figure S1 show the pore size distributions for the three materials, where we can see that the silica-4.0 nm and silica-2.5 nm have uniform pore sizes, as determined by the Barrett-Joyner-Halenda (BJH) desorption and adsorption models, respectively. On the other hand, the silica-1.5 nm shows a bimodal pore distribution, as determined by density functional theory (DFT) model, where the dominant pore sizes are ~1.5 and ~2.5 nm (see Figure S1-inset).
Table S1 lists surface areas, volumes, and sizes of nanopores for the silica materials characterized for use in experiments. It needs to be mentioned that meso, which means “in between” in Greek, describes pore sizes ranging from 2.0 to 50.0 nm (Al-Othman, 2012; Thommes et al., 2015). In the present study, one of the silica samples, silica-1.5 nm, is out of the necessary range to be defined as mesoporous. This 1.5 nm material has higher surface area than the 4.0 nm material, contributed by the existence of micropores. In addition, the 2.5 nm material has relatively low pore volume, but the highest surface area measured, due to its nearly-microporous nature, and the highest surface-to-volume (S/V) ratio of the three porous silica systems. We will use the S/V ratio as a parameter for comparison in the discussion below.
Figure S2 shows TXRD scans for the three samples, with the contribution from kapton foil removed. The three peaks of silica-4.0 nm, shown in Figure S2a, can be indexed as (100), (110), and (200) reflections, respectively (Sarawade et al., 2013). A hexagonal mesostructure with an interplanar distance of 4.5 nm [d(100)] can be determined, and based on the hexagonal geometry, the sum of the pore wall and pore diameter is about 5.2 nm. This long range ordered structure is consistent with the single peak (~4.2 nm) in the pore size distribution plot (Figure S1) determined from gas sorption analysis. In addition, the TEM imaging of this nanoporous silica shows an ordered arrangement of about 4.0 nm pores in parallel (Ok et al., 2017).
Figure S2b shows the five diffraction maxima observed in the TXRD scan of silica-2.5 nm, with d-spacings 3.1, 2.1, 1.9, 1.5, and 1.3 nm, respectively. According to their ratios, they can be indexed as (110), (200), (211), (310), and (222) reflections, and this ordered structure belongs to the cubic Im3m space group. Therefore, the sum of the pore wall and the pore diameter is ~4.2 nm, indicating that the pore wall is relatively thick, considering the pore diameter of 2.8 nm as determined by the BJH adsorption model. Figure S2c shows the silica-1.5 nm TXRD scan with diffraction maxima corresponding to d-spacings 2.2 and 1.5 nm. Although the specific pore structure arrangement is not identified in this case, these measurements, along with the pore distribution plot for silica-1.5 nm (Figure S1), suggest that it may have two dominant pore dimensions.
Pore volume is directly related to the amount of confined fluid. As demonstrated in Figure S3a, all of the porous silica samples where water was confined showed one-step mass loss. However, the samples with shorter drying times had fractions of water that persist till higher temperatures such as 200°C, as shown in Figure S3a, demonstrating representative weight loss in the case of silica-4.0 nm. As the sample-drying time was increased, complete weight-loss temperature shifted toward 95°C. In other words, all the water weight loss only required heating 95°C when the sample was dried for longer period of time. Similar results were observed when water was confined into silica samples with 2.5 and 1.5 nm pore diameters. At temperatures higher than 200°C no weight-loss occurred, and this shows that mesopores may intensely restrict water molecules and offer media for both thermodynamic and kinetic barrier to the elimination of water molecules (Wu and Navrotsky, 2013). These effects may resemble the consequences of confinement in geological environments with widely-ranging pore sizes. As shown in Figure S3b, the weight loss of water was less in silica-2.5 nm than for both silica-4.0 nm and silica-1.5 nm at the end of 12 min of drying time. This clearly showed that silica-2.5 nm has lower pore volume than the other two-engineered proxies of interest. Comparing the mass loss at the end of 20 min drying, we suggest that silica-1.5 nm has higher volume than that of silica-4.0 nm.
Excess Fluid vs. Confined Fluid
For discriminating excess water signal from signal of water confined into nanoporous silica samples, first T1 (inversion recovery) and T2 (CPMG) measurements at 40°C on the low-field NMR instrument were conducted. Figure S4a shows excess water showing bulk-like behavior on top of the mixture of silica-4.0 nm and confined water. As seen in Figure 1 and Table 3A, it is possible to differentiate excess water signal from that of confined water. T1 time values of bulk like water on top of the mixture without sonication are closer to that of water in bulk, while T1 values of confined water signal is lower than that of T1 values of confined water in the case of homogenized sample by sonication. This also exhibits that T1 values measured by homogenizing (sonication) are average values of water with two different environments: in between the grains and in the mesopores. Buntkowsky et al. (2007) mentioned that the sticking together is mainly the consequence of H2O molecules high polarity and their capability to establish hydrogen bond networks among the water molecules. However, dynamics of water become more complicated in confined geometries due to opposition between the surface-liquid and liquid-liquid relations. This opposition forms new structures of water as in the case of partial ordering water molecules in the neighborhood of the restraining surface.
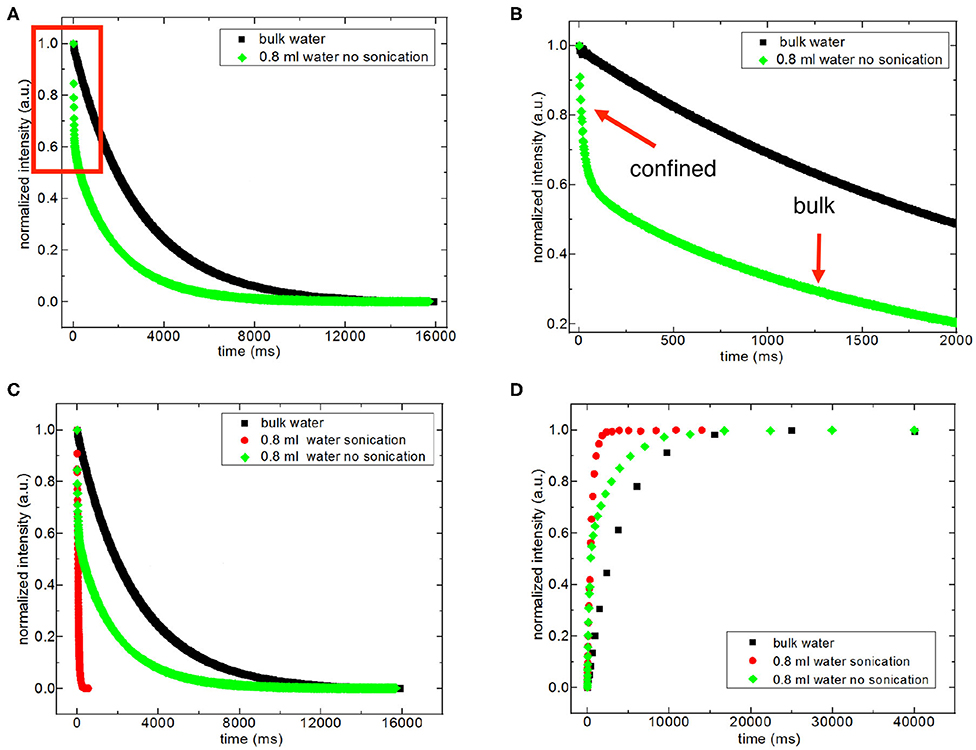
Figure 1. Representative comparison of T2 data of 0.8 ml water in the mixture with 150 mg silica-4.0 nm (S/V = 574) with and without sonication acquired at 40°C (A–C). (B) is the zoom in for the red box in (A). Representative comparison of T1 data of 0.8 ml water in 150 mg silica-4.0 nm with and without sonication acquired at 40°C (D).
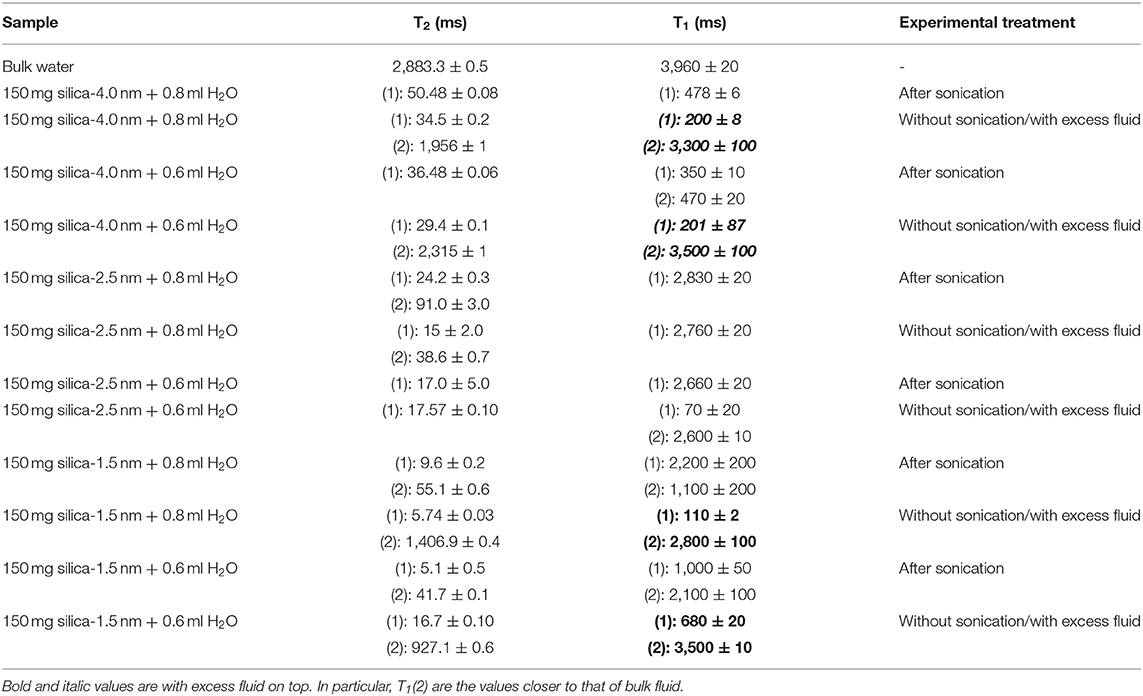
Table 3A. T1 and T2 values of confined water measured on the 20 MHz instrument at 40°C with either excess water on top or after homogenization with sonication.
The other approach of the T2 data analysis belonging to the samples without sonication and with excess water on top (see Figures S4a,d) is determination of the percentages of bulk like water and confined water based on the Equation (1) as suggested in the literature (Aursand et al., 2008). This is a simple and robust technique to evaluate the T2 relaxation data. At first we compare the results of bi-exponential fitting of the data belonging to water mixtures with either silica-4.0 nm or silica-1.5 nm having bulk-like water on top as shown in Figures S4a,d. As seen in Table 3A, longer T2 values are assigned to bulk-like water. The percentage of bulk-like water on top of the mixture is not ~ <60% (Table 3B). Then in this case, nearly 40% of H2O is in between grains and confined establishing a dynamic system. Referring to Table S1, it is possible to calculate the pore volume given that the mass of the nanoporous silica is known. Thus, we can differentiate the volume of confined water from the volume of water in between the grains.
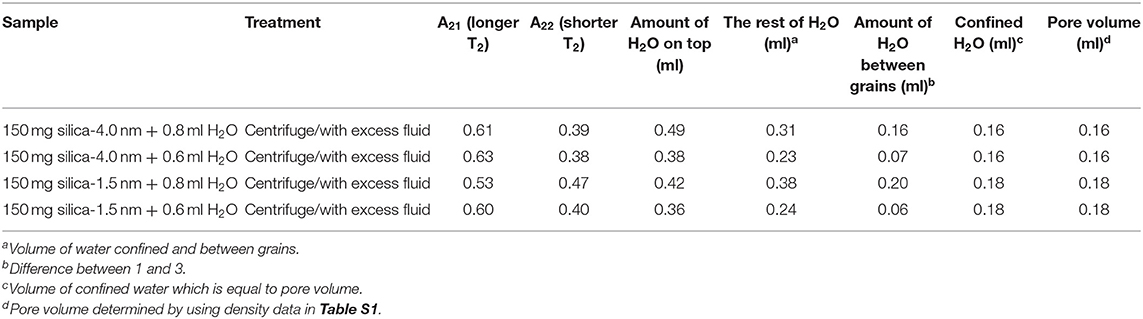
Table 3B. Quantification of confined vs. excess water.
In the case of homogenized samples by sonication, because the nanoporous silica materials of interest in the current study have the same structure of MCM-41, we refer to the proposed filling mechanism of MCM-41 having 4.6 nm of pore-to-pore distance by water (Grünberg et al., 2004). Water was studied as a guest molecule in mesoporous silica, MCM-41 and SBA-15, with two-dimensional hexagonally arranged of cylindrical pores in identical size ranging from 2 to 10 nm. Due to the high density of pores and relatively small pore diameters, these silica materials have bigger inner surfaces with respect to the volume of the single particle. There is a favored axis present in the direction of the pores cylinder axis arising from highly anisotropic geometry of the pores. In MCM-41, following the first wetting of the pore surfaces, a co-presence of filled pores or partially filled pores occurs. Additional filling of the pores happens as an enlargement of the filled pores till whole filling is obtained once more. Therefore, for MCM-41 the water layer grows axially in the direction of the pore axis. In the case of 0.4 ml H2O wetted silica-4.0 nm or silica-1.5 nm there were initially wetted pore surfaces, filled pores and not wetted pore (dry) segments coexisted. In mixtures of nanoporous silica samples mixed with either 0.6 or 0.8 ml H2O, after homogenization by 15 min sonication, the confined water molecules were in rapid “conversation” with the excess water molecules occupying the space in between the grains. The water molecules inside the nanoporous silica did the fast exchange with the excess water molecules by moving axially in the direction of the pores. On the NMR time scale, average T1 or T2 values were obtained. These average relaxation times are shorter than not only these of bulk water but also bulk-like water on top of the silica and water mixtures. There was no apparent bulk-like water in the case of mixtures with 0.4 ml water. For this reason, we did not apply bi-exponential fitting analysis for these samples having the lowest fluid-to-solid ratio.
Dynamics of Confined Fluids
Then we focus on dynamical behaviors of confined fluids by varying temperature, fluid-to-solid ratio, and pore diameter. Table 4A lists T1 values of bulk and confined water. As seen in Figures 2A–C, deviation and change of confined fluid behavior from that of bulk fluid is independent of pore size of the nanoporous matrix systems. At the fluid-to-solid ratios of 0.8, 0.6, and 0.4 ml to 150 mg silica-2.5 nm, T1 times increased as the temperature was increased. However, in the case of fluid-to-solid ratios of 0.8, 0.6, and 0.4 ml to 150 mg silica-4.0 nm, T1 times did not show significant change when temperature was varied. When 0.8 ml water was confined to 150 mg silica-1.5 nm, as the temperature was increased, T1 times also increased. However, with the fluid-to-solid ratios of 0.6 and 0.4 ml water to 150 mg silica-1.5 nm, first there was an increase in T1 time as the temperature was increased, but when the temperature was increased further, T1 time decreased. Sattig et al. (2014) studied temperature-dependent rotational motion of super-cooled H2O in MCM-41 type silica pores of diameters 2.93, 2.76, and 2.14 nm using 2H NMR. There was a first sharp twist observed in the temperature reliance escorted by a solidification of a portion of the confined H2O. This implied an alteration from bulk-like to interface-dominated water dynamics instead of a liquid-liquid phase changeover. In the temperature range above 225 K, there was the confinement effect observed. Above 225 K, the temperature reliance of H2O re-location was weaker in the smaller pores, and in the bigger pores bulk-like water behavior was seen. Near 225 K, longitudinal magnetization relaxation (T1) times for the ice in silica-2.1 nm confinement became very long for a dependable determination within a sensible duration, while T1 times for confined water in liquid state passes a minimum, showing that confined H2O has correlation times τ ≈ 1/ω0 ≈ 1 ns. It was suggested that 2H NMR line-shape analysis evidenced pronounced dynamical heterogeneities for confined H2O. However, in our study we did not conduct line-shape analysis; rather focus on T1 measurements at high temperatures. Temperature range of the study was out of interest of the current contribution. However, Sattig et al. (2014) mentioned that the temperature reliance of water re-location is largely independent of the confinement dimensions. We observe a similar result that deviation of confined water behavior from that of bulk water is independent of pore diameter, while degree of confinement effect on dynamics of confined water is more pronounced in the case of silica-4.0 nm. This is reflected in the T1 values as follows: the longest T1 values were observed when water was confined to silica-2.5 nm, while the shortest T1 values were seen when water was confined to silica-4.0 nm. We explain this situation with surface-to-volume (S/V) ratios of the nanoporous silica materials rather than pore diameter. Timur (1969) claimed that in a three-component NMR model, the pore volumes of a porous medium were classified as three sub-groups, based on their S/V ratio distribution. He explained that the longer T1 times would correspond to the smaller S/V ratios, and the larger pores. In our case, the T1 times do not show systematic change as a function of pore diameter. Rather, T1 times become longer when water molecules are confined into silica-2.5 nm with the highest S/V ratio, while the shortest T1 times are observed upon confining H2O molecules into silica-4.0 nm with the lowest S/V ratio. For this reason, the trend in T1 times of water confined into silica materials is attributed to the S/V ratios rather than pore diameter.
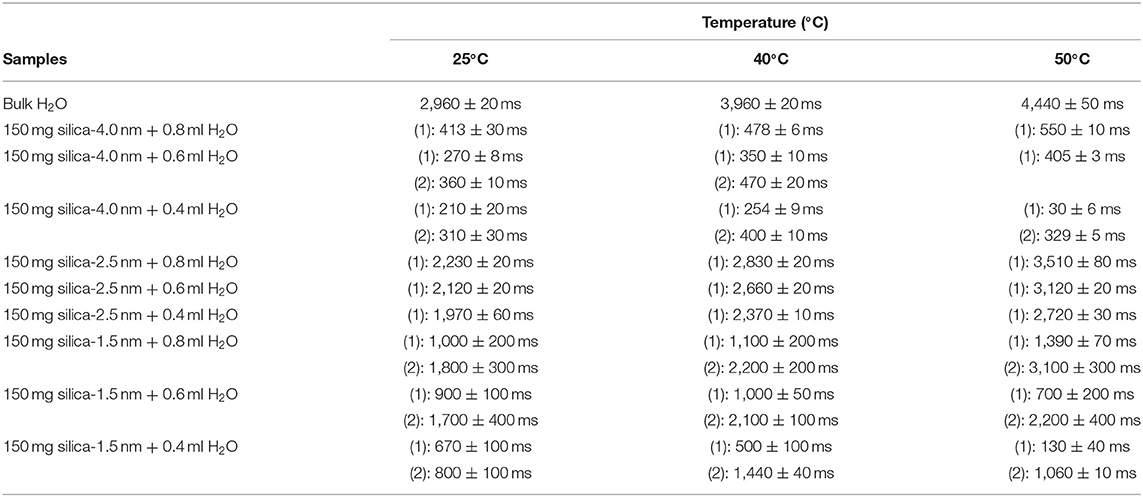
Table 4A. Longitudinal magnetization relaxation times (T1) of confined water obtained after sonication of the mixtures for 15 min.
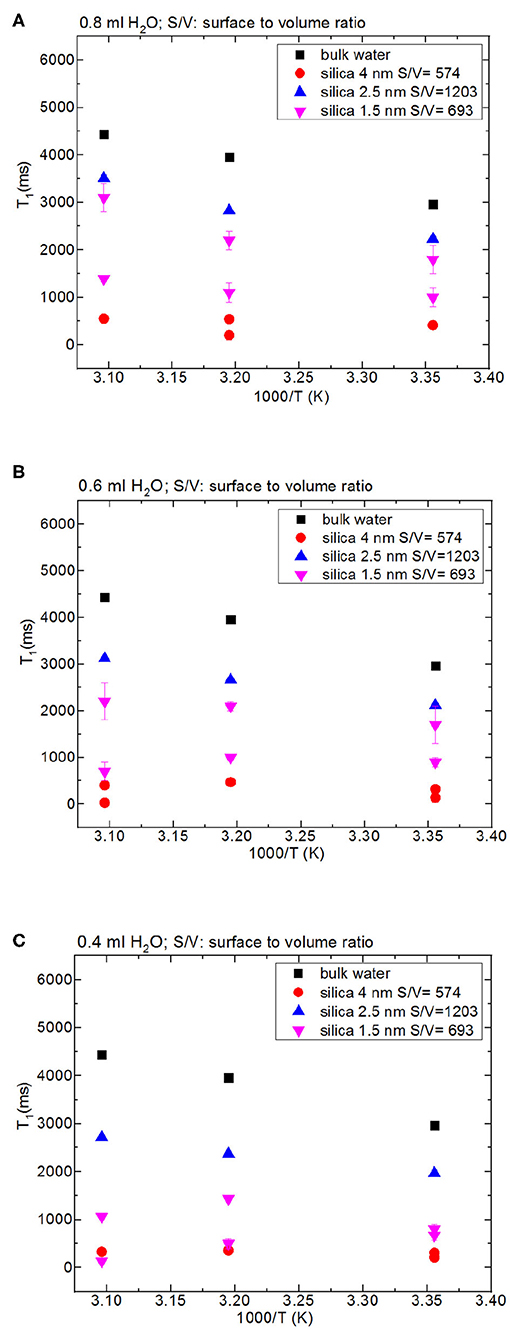
Figure 2. Comparison of T1 values of bulk water and water mixed with nanoporous silica where the variables are pore diameter of nanoporous silica with the amount of 150 mg (silica-4.0 nm, silica-2.5 nm, silica-1.5 nm), temperature (298, 313, 323 K) and volume of water [0.8 ml water (A), 0.6 ml water (B), 0.4 ml water (C)].
Besides analyzing T1 times, T2 times of the confined fluids were also analyzed. Table 4B lists the T2 results. As seen in Figures 3A–C, when the fluid-to-solid ratio is decreased, T2 values also decrease. This is independent of the pore diameter of the nanoporous silica materials. T2 values in the case of the fluid-to-solid ratio of 0.4 ml to 150 mg silica (partial filling of the pores) are longer for silica-4.0 nm than silica-1.5 nm and silica-2.5 nm. In the case of 0.6 ml fluid to 150 mg silica ratio, T2 values of water confined into silica-4.0 nm and silica-1.5 nm are closer to each other, and longer than confined into silica-2.5 nm. With the highest fluid-to-solid ratio, the longest T2 values are observed when water is confined into silica-2.5 nm. Having smaller fluid-to-solid ratio means filling the pores with lower volume easily. Because silica-2.5 nm has lower pore volume as shown by TGA measurements (see Figures S3a,b), in the case of the lowest fluid-to-solid ratio “majority” of the fluid molecules completely fill the pores. This in turn is indicated with shorter T2 values. There is an important trend in T2 values. As the fluid-to-solid ratio is decreased, T2 values also decrease. However, the decrease is more effective in the case of silica-2.5 nm, which has the lowest pore volume.
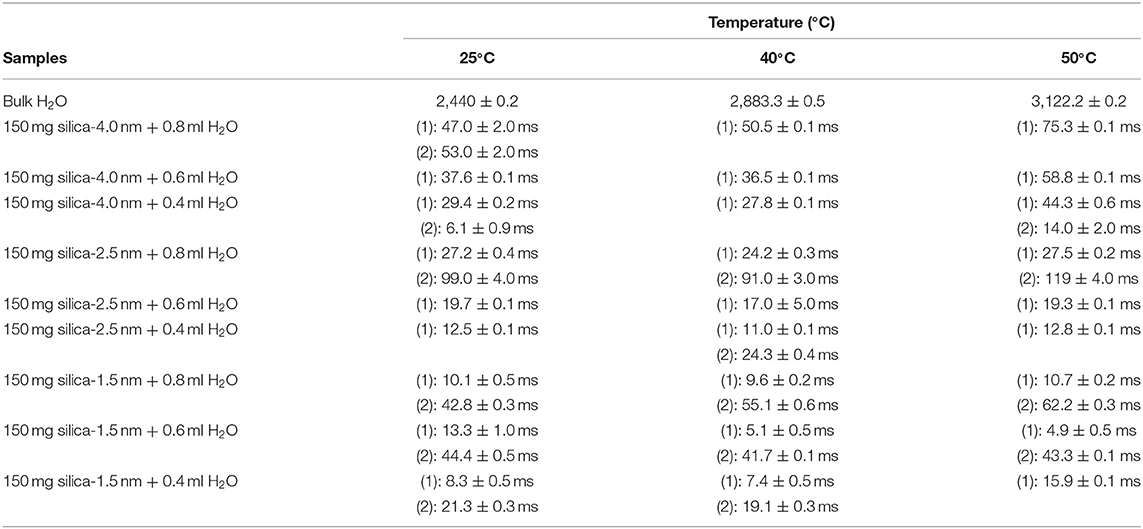
Table 4B. Transverse magnetization relaxation times (T2) of confined water obtained after sonication of the mixtures for 15 min.
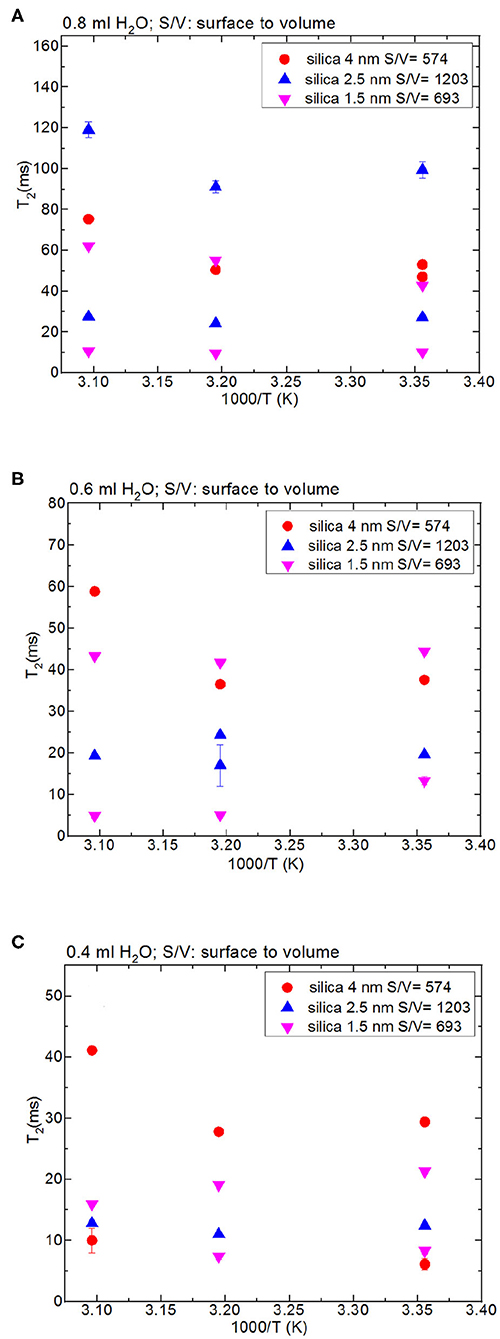
Figure 3. Comparison of T2 values of bulk water and water mixed with nanoporous silica where the variables are pore diameter nanoporous silica materials with the amount 150 mg (silica-4.0 nm, silica-2.5 nm, silica-1.5 nm) and temperature (298, 313, and 323 K); 0.8 ml water (A), 0.6 ml water (B), 0.4 ml water (C).
The other set of measurements was conducted by keeping the pore volume of each nanoporous silica constant around 120 cm3 (see Table 2). Among the three silica samples, silica-2.5 nm has the highest S/V ratio. When the pore volume is kept constant at ~120 cm3, water has the longest T1 value in the mixture with silica-2.5 nm. Similarly, the highest T2 was obtained for the same water and silica-2.5 nm mixture. The T1 value of water in the mixture with silica-1.5 nm is slightly lower than that of water in the mixture with silica-2.5 nm. The results on relaxation of water obtained by keeping pore volumes of porous matrixes constant for the given amounts of the porous materials indicate clearly that pore diameter does not affect the dynamics of confined water significantly. Rather, S/V ratio along with pore diameter reflects information on filling mechanism of nanoporous silica materials with water. In particular, when the pore diameter is big and S/V ratio is small, at first water molecules wet the surface of the pore walls. Additional filling happens easily from the pore wall to the midpoint of the pore. Then complete filling of the pores is achieved (Grünberg et al., 2004). In the case of nanoporous silica with small pore diameter and large S/V ratio, the filling mechanism occurs in a different way: first the center is filled; hence there is a co-presence of filled pore fragments with wetted pores. Further filling of the pores develops axially in the direction of the pore axis. The pore volume is also related to pore length when we assume cyclindrical pores. The nanoporous silica with small pore diameter and long pore axis leads to larger pore volumes. The long pore length (large pore volume) gives enough degree of freedom for confined water molecules. Relatively free confined water molecules prefer motion in axial direction, and this results in weaker interactions with pore walls. This is a possible explanation of larger T1 values for pores with smaller pore diameter and larger pore volume.
In addition to the effect of pore volume and S/V ratios of the porous systems on dynamical behaviors of confined H2O, fluid chemistry is also studied by confining CH3OH and CH3OD into nanoporous silica-4.0 nm. Tables 5A,B list T1 and T2 values of bulk and confined CH3OH and CH3OD. First, T1 and T2 relaxation times of confined methanol deviated from those of bulk methanol. The second remarkable point is the higher T1 and T2 values of CH3OD with respect of those of CH3OH in confined state. Internal rotation of the –CH3 group is faster than the –OD group rotation in turn leading to longer T1 times of CH3OD compared to that of CH3OH. As seen in Figures 4A,B, confined methanol (CH3OH) has slightly higher T1 relaxation values than these of confined H2O. This result is independent of fluid-to-solid ratio. This is also related to the faster internal rotation of –CH3 group. As expected, when the fluid-to-solid ratio is decreased, T1 values of confined methanol also decreased. Methanol has two T1 values in confined state. In the case of higher fluid-to-solid ratio, longer T1 increases as temperature increases, while shorter T1 does not show significant change upon elevating temperature. In the case of lower fluid-to-solid ratio for both longer and shorter T1 values, T1 minimum is observed as a function of temperature.
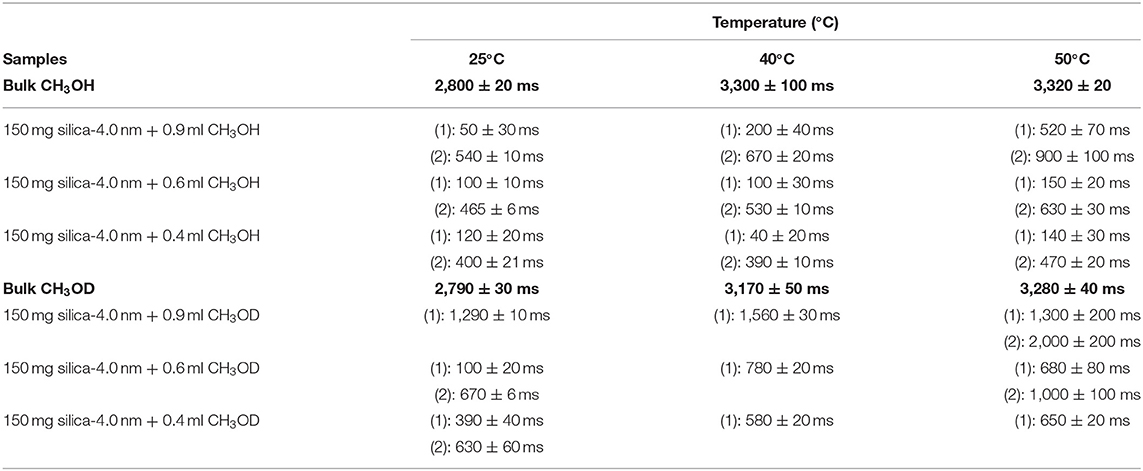
Table 5A. Longitudinal magnetization relaxation times (T1) of confined CH3OH and CH3OD obtained after sonication of the mixtures for 15 min.
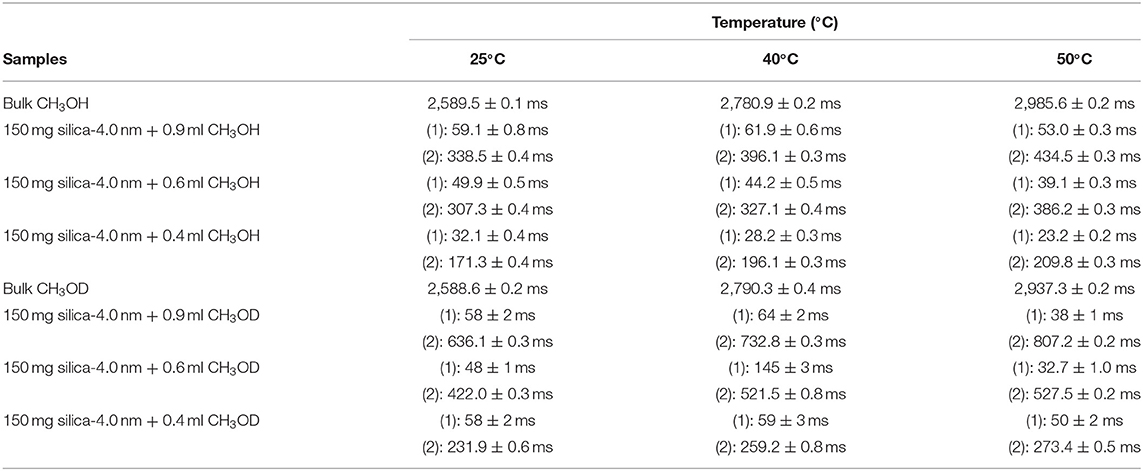
Table 5B. Transverse magnetization relaxation times (T2) of confined CH3OH obtained after sonication of the mixtures for 15 min.
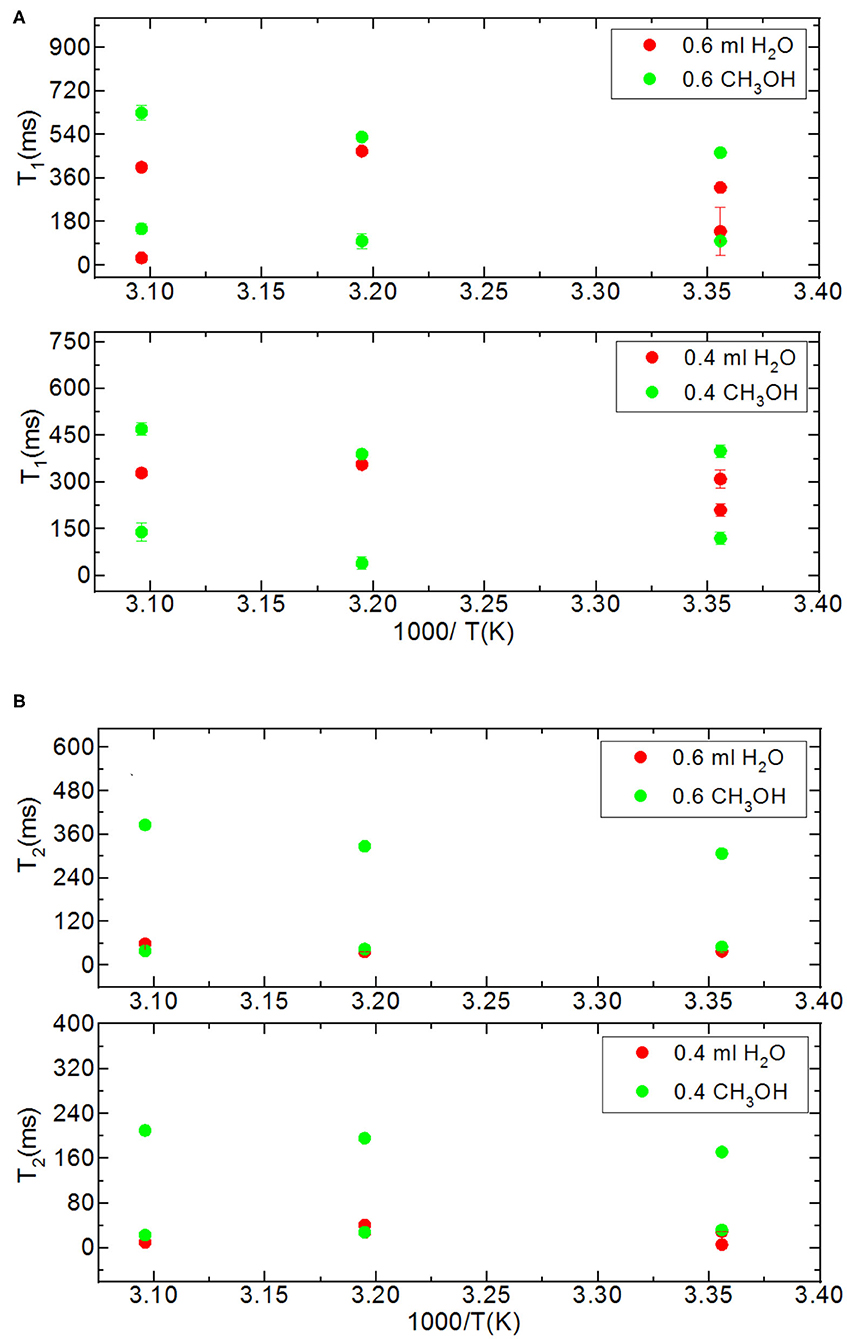
Figure 4. Comparison of relaxation values of H2O and CH3OH confined into silica-4.0 nm with the amount of 150 mg and S/V = 574 where the variables are temperature values (298, 313, and 323 K), and fluid-to-solid ratios (0.60 ml/150 mg, 0.40 ml/150 mg); T1 (A) and T2 (B).
Methanol has also two T2 values in confined state (Figures 5A,B). The longer T2 value is greater than of that H2O. The longer T2 value increases as temperature increases, while the shorter T2 does not indicate significant change when temperature is varied. When the fluid-to-solid ratio was decreased, T2 values also decreased. The short T2 value of CH3OH in the confined state became even shorter as the temperature was elevated. This is independent of the fluid-to-solid ratios. This observation is explained by layering of CH3OH on the pore walls via interacting with –OH groups of the pores, which are proven to exist by solid-state magic angle spinning (MAS) cross-polarization (CP) NMR (Sindorf and Maciel, 1983). In addition, water molecules near the interface had preferred directions due to the interaction with surface –OH groups (Millischuk and Ladanyi, 2011). There are two layers, and as temperature was elevated the molecules of the second layer having weaker interactions with the molecules forming the first layer with –OH of the pore walls gained mobility, and moved to the region of the molecules clustered in the middle of the pores. The number of methanol molecules in the second layer was reduced when the temperature was increased, while methanol molecules of the first layer still interact with the pore walls. Thus, the shorter T2 value attributed to the average motions of the first and second layers of CH3OH interacting with the pore walls became shorter at high temperatures. However, there is weaker hydrogen bonding interaction between CH3OH and –OH of the pore walls that is indicated in relatively longer T1 values of CH3OH with respect to these of H2O. As discussed above, the contribution of faster internal –CH3 rotation to the overall dynamics of CH3OH molecules should not be neglected as well.
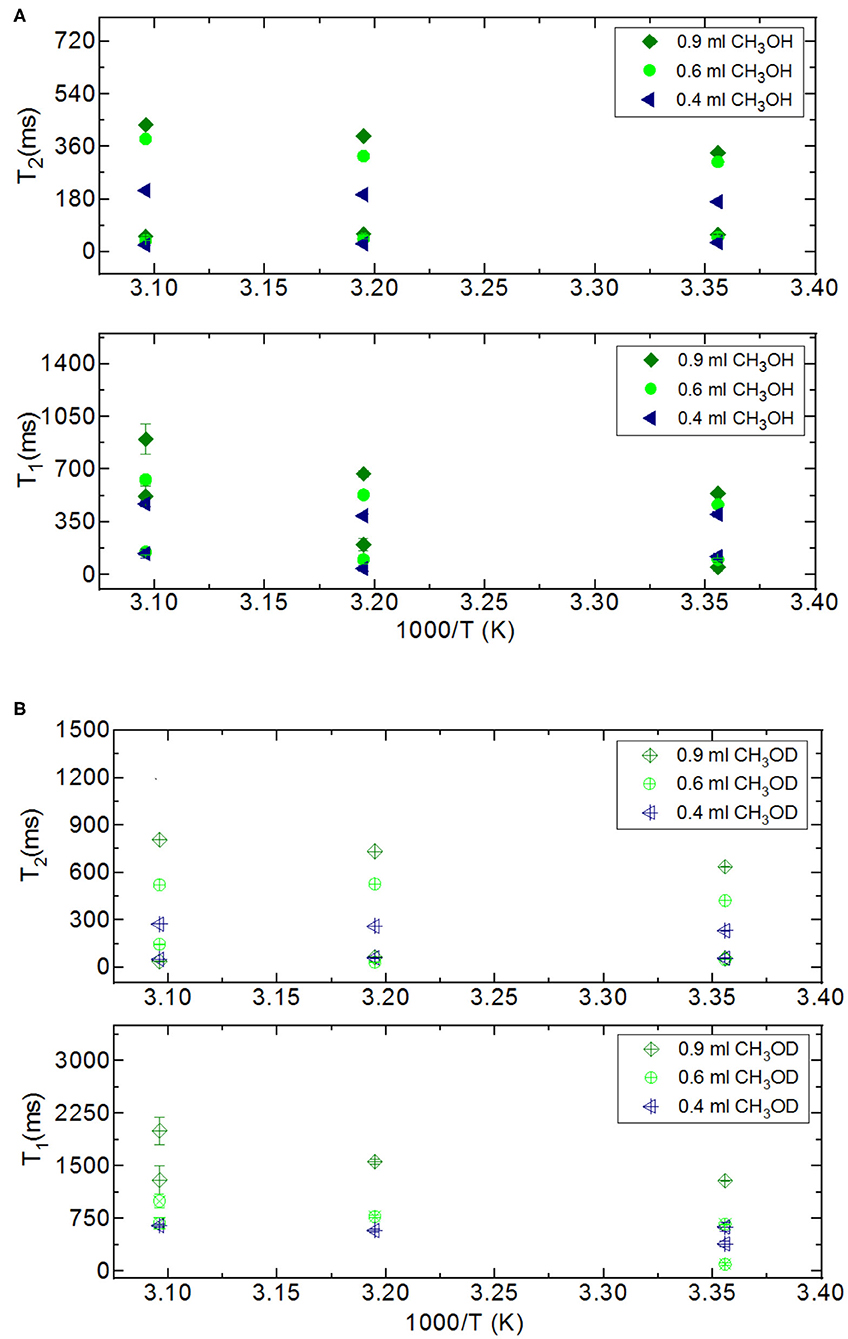
Figure 5. Comparison of relaxation values of CH3OH and CH3OD confined into silica-4.0 nm with the amount of 150 mg and S/V = 574 where the variables are temperature values (298, 313, and 323 K), and fluid-to-solid ratios (0.90 ml/150 mg, 0.60 ml/150 mg, 0.40 ml/150 mg); CH3OH (A), CH3OD (B).
Dynamics of Water Confined in Nanoporous Silica Monoliths Without Excess Fluid
First, it needs to be mentioned that there was no excess fluid in the medium when both of the T1 and T2 measurements were conducted upon soaking the nanoporous silica monoliths into water. The surface area of the nanoporous silica monolith is closer to that of silica-4.0 nm. Table 6 lists T1 and T2 values of water confined in the nanoporous silica monolith by varying soaking duration and temperature (see Figure 6). In this case, 10 min and 90 min of soaking time correspond to partial filling and more complete saturation of water in pores, respectively. Both T1 and T2 times of confined water in the nanoporous silica monoliths show strong deviation from bulk values (see Tables 4A,B) for bulk T1 and T2 relaxation values of water, respectively). The deviation from bulk is independent of the water soaking time. Comparison of the T1 values water molecules inside the nanoporous silica monoliths shows the negligible effect of soaking duration. However, T2 times get shorter approximately twice as the soaking time was increased to 90 min. As expected, when the temperature was increased, both T1 and T2 times of confined water within the nanoporous silica monoliths get longer, and again independent of the soaking time. The shortest T2 value observed is explained by the strong interaction between the confined water molecules and the pore walls of the nanoporous silica monolith surface. We suggest that there is first a monolayer established on top of the pore walls of the monolith. This layer gains mobility when the temperature was increased in the case of short soaking time. However, such a mobility and hence increase in the shorter T2 time component is not observed in the case of 90 min soaking time sample. In other words, partial filling of the pores due to shorter soaking time gives free volume within the nanoporous silica monolith for confined water molecules. The elevation in temperature helps with overcoming energy barrier that water molecules forming the monolayer gain freedom. This gain in mobility is reflected as longer relaxation times. In comparing the relaxation times of confined water in nanoporous silica monoliths with respect to the relaxation values of H2O confined into nanoporous powdered silica samples (silica-4.0 nm, silica-2.5 nm, and silica-1.5 nm), we prefer to consider the samples where only 0.4 ml water was confined into the powdered silica samples. T1 values of water within the nanoporous silica monoliths are significantly shorter than those of water confined into silica-2.5 nm and silica-1.5 nm, while closer but still shorter than that of water confined into silica-4.0 nm. T2 times of water confined into nanoporous silica monolith for 10 min of soaking time are longer than those of T2 times of water confined into powdered nanoporous silica samples, but T2 times of water confined into nanoporous silica monolith for 90 min of soaking time are within the same range with T2 values of water confined into powdered nanoporous silica matrixes. The comparison shows that confinement effect for water is independent of water soaking time. The water molecules remaining between powdered nanoporous silica grains upon sonication, where only 0.4 ml water was confined into the powdered silica samples, contribute to the averaged relaxation times so that relatively longer T1 and T2 times than those of water within the nanoporous silica monoliths were observed. There is an overall decreasing trend in relaxation times of water as going from smaller pore diameters of 1.5 and 2.5 nm to larger diameters of 4.0 and 6.0 nm. As a result, we suggest that taking the pore diameters of both the powdered and monolith samples into account, pore volume is a significant factor reducing the mobility of water.
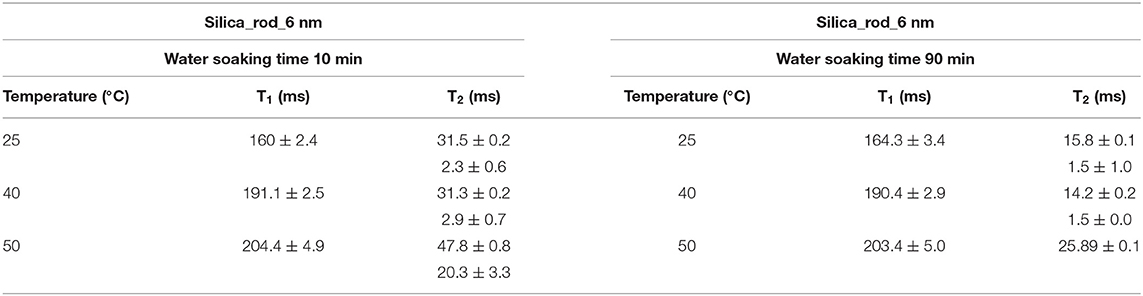
Table 6. T1 and T2 values of water confined into nanoporous silica rod.
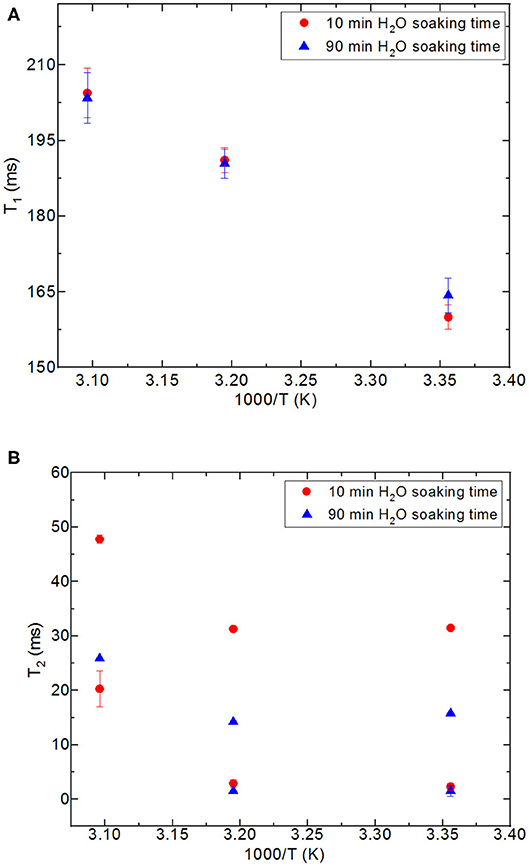
Figure 6. Comparison of relaxation values of H2O confined into 6 nm silica rod at 298, 313, and 323 K, and with 10 and 90 min of water soaking times; T1 (A), T2 (B).
T1/T2 Ratio of Confined Fluid Interaction With the Pore Walls
Regarding NMR relaxation in porous media, T1/T2 ratio indicates how strongly or weakly molecules interact with the uppermost layer of the porous system (Mitchell et al., 2009; Weber et al., 2009). Therefore, T1/T2 ratio is an important parameter showing the degree of wettability of the fluid toward pore walls in confined geometry. The NMR T1 time in liquids arises from time-dependent local magnetic fields persuading changeovers that permit nuclear spins to restore the equilibrium. The major driving force for variations in local magnetic fields at a nucleus is the rotational motion of molecules, regularly defined as molecular tumbling. The correlation time of molecular tumbling is defined as τc. The approximate definition of τc is the duration for a molecule to finish a rotation of 1 rad. The BPP (Bloemberg-Purcell-Pound) relaxation theory describes that for τc → 0, T1 → ∞. As a result, small, and rapid tumbling molecules will show a gradual relaxation rate and thus longer T1 values (Bloembergen et al., 1948; D'Agostino et al., 2012). There is the resulting correlation between T1 and τc:
where ω0 is the precession frequency of the target nucleus. This equation tells that for very fast molecular motion (when 1/τc >> 2ω0), T1 is inversely proportional to τc. That is, as correlation time decreases (fast molecular motion), relaxation time increases (the rate of relaxation decreases). Conversely, for slow molecular motion (when 1/τc << 2ω0), T1 is directly proportional to τc. Therefore, they both increase together. The minimum in T1, and hence the most efficient spin-lattice relaxation, occurs when τc α (ω0)−1 (Slichter, 1990; Macomber, 1998; Nicotera et al., 2012). Viscous molecules or molecules under confinement of geometrical constraints will have shorter T1 values and thus a faster relaxation rate (D'Agostino et al., 2012). In analyzing and explaining the longitudinal relaxation data obtained, we refer to Equation (4) described below. We first think of a cylindrical pore with a radius of R and a length of l, completely filled with water molecules. Due to water-substrate interactions, the water molecules at the surface will experience a restricted motion when compared to the bulk like water in the middle of pore. We assume that the water molecules within a distance a from the surface are affected by the surface and the rest acts as bulk like fluid as mentioned above while discussing layering of methanol on the pore walls via interactions with –OH groups decorating the pore walls. Under these assumptions the observed proton relaxation time constant T1,observed will have a weighted average from water molecules near the surface and bulk like water molecules, where the weights are proportional to the volume (Gallegos et al., 1988; Weber et al., 2009). The number of protons/water molecules at the uppermost layer and in bulk-like state is proportional to the VSurface and VBulk, respectively. Thus, the observed T1,observed relaxation can be written as:
This equation assumes an ideal case where the pores are filled in whole with the liquid of interest. In the current study, there is gradual increase in the amount of fluid mixed with the porous systems. This leads to an increase in the amount of confined fluid. Tables 7A,B lists the T1,surface values, where T1,surface was calculated by the following restrictions: (i) only 0.4 ml fluid added samples are taken into consideration, (ii) for a, 0.25 nm as the silica layer thickness is assumed. As shown in Table 7A, T1,surface values decreased as the temperature was increased only in the case of silica-4.0 nm and silica-1.5 nm. On the contrary, in the case of silica-2.5 nm, T1,surface values increased as the temperature was increased. This shows that water molecules form layers on the pore walls of silica-4.0 nm and silica-1.5 nm, and these layers have strong interaction with the pore walls. The contrary dynamical attitude of water in silica-2.5 nm is a reflection of the effect of surface-to-volume ratio. Table 7B shows that T1,surface values of CH3OH in the nanopores of silica-4.0 nm do not change significantly as a function of temperature. However, there is a systematic increase in T1,surface values of CH3OD in the nanopores of silica-4.0 nm when the temperature was elevated. This is attributed to the fluid chemistry.
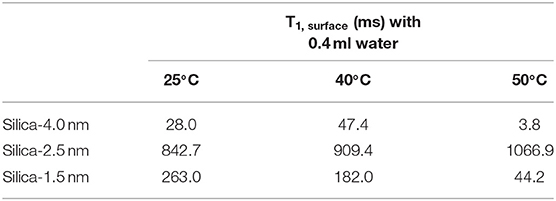
Table 7A. T1,surface values of water in confined state.
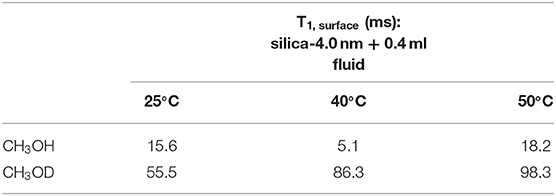
Table 7B. T1,surface values of CH3OH and CH3OD in confined state.
Sattig et al. (2014) suggested that 2H NMR line-shape analysis evidenced pronounced dynamical heterogeneities for confined H2O. In another study on characteristic properties of H2O dynamical attitudes in confined forms explored by quasi-elastic neutron scattering, Osti et al. (2016) mentioned primary single parameter θ, which is the ratio of the mean number of water molecules that are mostly affected by pore walls to the total number of H2O molecules under confinement. If we consider θ as equal to a constant value such as (X) for a complete saturation with and without excess water by taking filling mechanism of MCM-41 with H2O mentioned by Grünberg et al. (2004) into account, we suggest that there are both θ ≈ X and θ ≤ X where there is dynamic exchange between confined water molecules (the ones not interacting with the pore walls) and the bulk excess water. For the samples with excess fluid as in the case of silica-4 nm, θ for different fluid-solid-ratios is equal to each other. When the fluid-to-solid ratio is decreased for the partially filled samples, θ also decreases down. Because θ is utilized for the slit-type, cylindrical, and spherical geometries, θ is applicable in the current study as well. Osti et al. (2016) used exact analytical techniques to explain H2O adsorption in three model geometries of slit-type, cylinder, and sphere to have deeper explanation of the change of θ with the restricted geometry. In the present study, characterization of the engineered nanoporous proxies and the analysis of confined fluids are done in detail. For example, although nanoporous silica materials are known amorphous, degree of regular patterns of each sample was studied by XRD thoroughly to clarify the alignment and geometry of the pores.
A rough consideration of T1/T2 ratios for both confined water and methanol clearly indicate a straightforward deducing arrangement of comparative intensity of interaction with the pore uppermost layer of silica-4.0 nm: water has greater interaction with the pore surface than methanol (Weber et al., 2010; D'Agostino et al., 2012). For this reason, we think that methanol molecules establish clusters with extensive hydrogen bond formation in the pores rather than interacting with the pore surface (Tsotsalas et al., 2013). It was argued that the existence of porous medium disrupts the widespread intermolecular hydrogen-bonding system of some polyols such as glycerol and ethylene glycol, and this disruption in hydrogen bonding system resulted in boosted translation and tumbling movement degree, therefore longer T1 values. In our case, such a disruption might exist with respect to bulk liquids. However, this disruption is less effective for confined CH3OH molecules than confined water molecules given that the same nanoporous matrix system is utilized for confining the molecules. In addition, we observe shorter T1 times for both of the confined fluids with respect to their bulk state. It is already known that NMR relaxation time values of confined fluids in porous media are relatively shorter than their corresponding fluids in bulk (Barrie, 2000). This situation is attributed to the uppermost layer and dipolar interactions and a decreased degree of reorientation of molecules at the pore uppermost layer (D'Agostino et al., 2012). We suggest these interactions dominate in terms of reducing the T1 times of both of the confined fluids.
In addition to comparing relaxation behaviors of confined H2O and CH3OH, we also compare relaxation behaviors of CH3OH and CH3OD under confinement. When we switch from CH3OH to CH3OD, we only measure confined behavior of –CH3 group. Both T1 and T2 of CH3OD are longer than those of CH3OH. T1/T2 ratio of confined CH3OD is also smaller as in the case of confined CH3OH. This shows that there is weaker interaction between –CH3 and mesoporous silica-4.0 nm. Although confined CH3OD behavior deviated from that of bulk CH3OD upon confining into silica-4.0 nm, deviation is lesser than these of confined H2O and CH3OH. This also shows that hydrogen bonding capability of the molecules such as H2O and CH3OH with –OH groups decorating the pore walls influences both dynamics of the confined fluids and the layers formation on the pore walls.
T2 Distributions of Fluids Under Nanoporous Confinement
Figure 7 shows T2 distribution curves, obtained using Contin software, of H2O, CH3OH, and CH3OD confined in silica-4.0 nm. The distributed exponential approach utilizes a governing approach to the inverse Laplace transform yielding a continuous distribution of T2 relaxation times (Provencher, 1982). Mathematically speaking, the distributed exponential fitting is an ill-defined process because it is sensitive to the restrictions applied (Martens and Thybo, 2000; Hansen et al., 2010). Furthermore, there is a shorter T2 relaxation component observed in the range 10–15 ms. Such a component is mostly explained as a treating artifact due to the Contin processing stage (Aursand et al., 2008). For this reason, this component in the T2 distributions is not taken into account in evaluating T2 distribution curves of the fluids confined into silica-4.0 nm.
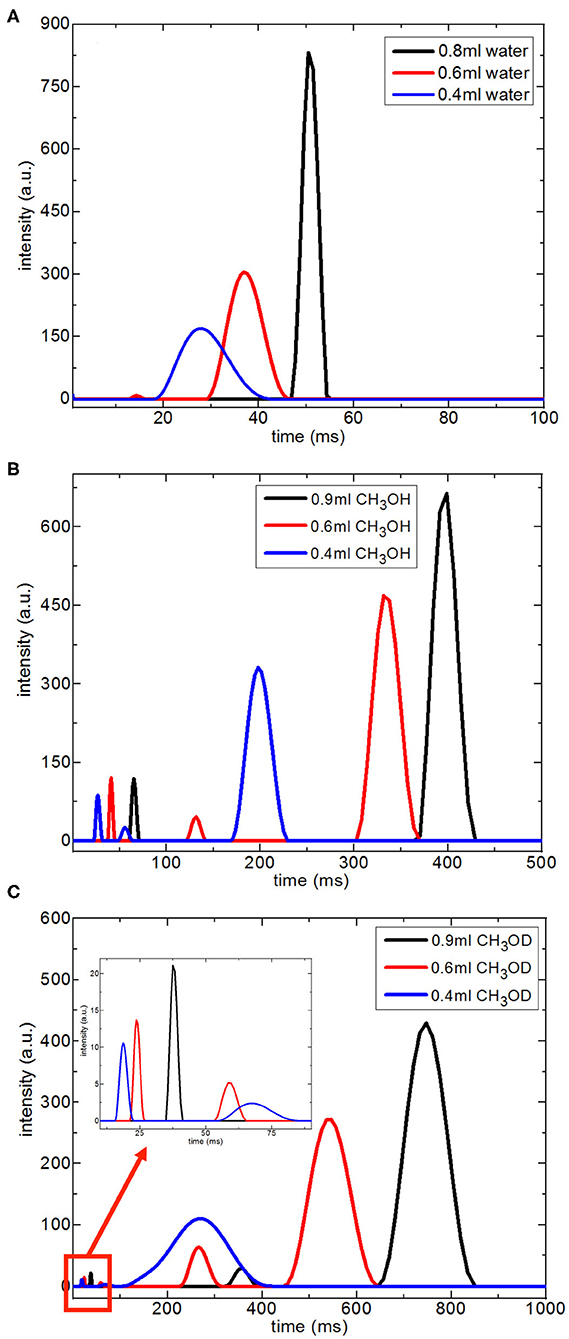
Figure 7. Continuous T2 relaxation time data for H2O (A), CH3OH (B), and CH3OD (C) confined into silica-4.0 nm with the amount of 150 mg and S/V = 574 as a function of fluid-to-solid ratio.
In the case of the confined water inside silica-4.0 nm, when the fluid-to-solid ratio is lowered, T2 curves shifted toward shorter times. In addition, T2 curves became broader and had lower intensity (Figure 7A). On the other hand, confined CH3OH has longer T2 components as seen in Figure 7B. The T2 curves with the highest intensities between 150 and 450 ms range exhibited the same tendency as in the case of confined water. In other words, lower fluid-to-solid ratio was reflected as lower intensity T2 distribution curves at shorter T2 times. For the range between 20 and 80 ms the same result was observed. However, line broadening in T2 distribution curves of confined CH3OH was less pronounced. When the fluid-to-solid ratio was at the lowest value (0.4 ml CH3OH confined to 150 mg silica 4.0 nm), there was a third T2 curve around 55 ms with broader distribution. When the fluid chemistry was switched to CH3OD, T2 distribution curves with the higher intensities were in the range between 100 and 900 ms. Consistently with the two other confined fluids, as the fluid-to-solid ratio was decreased, T2 curves shifted to shorter times with lower intensities. However, there were three T2 curves for each fluid-to-solid ratio. As the T2 curve shifts toward lower values, the T2 curve loses intensity. For this reason, the observation of three T2 curves for confined CH3OD inside silica-4.0 nm might correspond to different proportions of the confined CH3OD molecules (Bertram et al., 2002): (1) the ones forming layers on the pore walls by weak interactions with the –OH of the pore wall, (2) the ones closer to the middle of the pores and having lesser interactions with ones forming layers on the pore walls, (3) the ones clustering in the center of the pores. As reflected in longer T2 values, and continuous T2 distribution curves, among the three fluids of interest, CH3OD has the weakest interaction with the pore walls.
Conclusion
Specific pore volumes (cm3/g) of the nanoporous silica samples studied exhibit the following order: silica-1.5 nm > silica-4.0 nm > silica-2.5 nm. Nanopore diameter does not influence the dynamics of confined water significantly as revealed by the results on relaxation of water obtained by keeping pore volumes of porous matrixes constant for the given amounts of the porous materials. Rather than pore diameter, S/V ratio along with pore diameter reflects information on filling mechanism the nanopores with water. In the case of relatively larger pore diameter and small S/V ratio, wetting the surface of the nanopore walls is followed by additional filling from the pore wall to the midpoint of the pore until achieving complete filling of the pores (Grünberg et al., 2004). In the case of nanoporous silica with small pore diameter and large S/V ratio, the filling mechanism follows a different path: first, fluid fills the center of the pores leading to a co-presence of filled pore fragments with wetted pores. Further filling of the pores develops axially in the direction of the pore axis.
The possibility of distinguishing among relaxation times of excess and confined fluids, and to quantify excess fluid, fluid found in the interparticle regions of nanoporous silica powder and outside the pores, and fluid confined in the nanopores of silica matrices might have applications in the petroleum industry, where characterization of rock with various pore sizes has significance for better definition of reservoirs. However, the highest S/V ratio leads to the longest T1 times of confined water, while the lowest S/V ratio resulted in the shortest T1 times of confined water. The decrease in T2 values as decreasing the fluid-to-solid ratio is more pronounced in the case of silica-2.5 nm having the lowest pore volume. These results clearly show the importance and influence of S/V ratio on dynamical behaviors of fluids confined into nanoporous proxies.
Comparison of T1/T2 ratios, showing the affinity of the confined fluid to the pore walls, of both confined H2O and CH3OH clearly show that H2O has stronger interaction with the pore surface of silica-4.0 nm than CH3OH. The degree of deviation of confined CH3OD behavior in silica-4.0 nm from that of bulk is less than those of confined H2O and CH3OH. It was claimed that a porous medium disrupts the extensive intermolecular hydrogen-bonding network of some polyols, and this disruption led to longer T1 values (D'Agostino et al., 2012). Such a disruption in hydrogen-bonding network is less effective for confined CH3OH molecules than confined H2O molecules for the same nanoporous matrix system. In addition to S/V ratio, chemistry of confined fluids also affects the dynamical measurements. This is an important observation, for example, in interpreting dynamical behaviors of confined and saturated mixtures of water and hydrocarbons at natural confined systems, where wettability alteration occurring inside the porous structures of the rocks influences the crude oil production.
The continuous T2 distribution curves suggest that weaker interaction between CH3OD and nanoporous silica-4.0 nm with three different environments: (i) layered structure by weak interactions with the pore walls, (ii) the ones closer to the center of pores and interacting weakly with the first layer on the pore wall, (iii) the ones forming cluster in the middle of the nanopores.
Finally, the characteristics and properties of the nanoporous matrix systems are defined in a better way. Furthermore, low-field 1H NMR is a powerful technique when exploring confined fluid dynamics as a function of the aforementioned parameters. These nanoporous silica samples are ideal examples that mimic the natural geological systems such as heterogeneous subsurface materials containing crude oil and brine solutions to mimic nano-environments present in natural systems such as rocks. Based on the findings on the properties of mesoporous silica proxies and dynamical behavior of confined crude oil and brine confined into mesoporous silica materials, we also analyzed sandstone rock cores flooded with crude oil and brine with hydrophobic/oleophilic nanoparticles in addition to characterizing natural carbonate rock cores saturated with water and crude oil. The results of these measurements are to be discussed in forthcoming publications.
Data Availability Statement
All datasets generated for this study are included in the article/Supplementary Material.
Author Contributions
SO planned and conducted the low-field NMR measurements in addition to TGA measurements. BH contributed to the low-field NMR measurements. TL completed the BET and TXRD measurements. JS and SW contributed to each and every step of the study, and in particular on both TXRD and BET parts. K-HL and C-YM synthesized silica-2.5 nm and silica-1.5 nm. DC was the research leader. All authors contributed to the article and approved the submitted version.
Funding
Support for SO was provided by the A.P. Sloan Foundation sponsored Deep Carbon Observatory. DC, JS, and SW were supported by the Department of Energy, Basic Energy Sciences Geosciences Program under grant DE-SC0006878.
Conflict of Interest
The authors declare that the research was conducted in the absence of any commercial or financial relationships that could be construed as a potential conflict of interest.
Supplementary Material
The Supplementary Material for this article can be found online at: https://www.frontiersin.org/articles/10.3389/fchem.2020.00734/full#supplementary-material
References
Al-Othman, Z. A. (2012). A review: fundamental aspects of silicate mesoporous materials. Materials 5, 2874–2902. doi: 10.3390/ma5122874
Asefa, T., and Tao, Z. (2012). Mesoporous silica and organosilica materials-review of their synthesis and organic functionalization. Can. J. Chem. 90, 1015–1031. doi: 10.1139/v2012-094
Aursand, I. G., Gallart-Jornet, L., Erikson, U., Axelson, D. E., and Rustad, T. (2008). Water distribution in brine salted cod (Gadus morhua) and aalmon (Salmo salar): a low-field 1H NMR study. J. Agric. Food Chem. 56, 6252–6260. doi: 10.1021/jf800369n
Barrie, P. J. (2000). Characterization of porous media using NMR methods. Annu. Rep. NMR Spectrosc. 41, 265–316. doi: 10.1016/S0066-4103(00)41011-2
Barut, G., Pissis, P., Pelster, R., and Nimtz, G. (1998). Glass transition in liquids: two versus three-dimensional confinement. Phys. Rev. Lett. 79, 3543–3546. doi: 10.1103/PhysRevLett.80.3543
Bellisent-Funel, M.-C., Chen, S. H., and Zanotti, J. M. (1995). Single-particle dynamics of water molecules in confined space. Phys. Rev. E 51, 4558–4569. doi: 10.1103/PhysRevE.51.4558
Bergman, R., and Swenson, J. (2000). Dynamics of supercooled water in confined geometry. Nature 403, 283–285. doi: 10.1038/35002027
Bertram, H. C., Purslow, P. P., and Andersen, H. J. (2002). Relationship between meat structure, water mobility, and distribution: a low-field nuclear magnetic resonance study. J. Agric. Food Chem. 50, 824–829. doi: 10.1021/jf010738f
Bhattachrja, S., D'Orazio, F., Tarczon, J. C., Halperin, W. P., and Gerhardt, R. (1989). Internal structure of porous silica: a model system for characterization by nuclear magnetic resonance. J. Am. Ceram. Soc. 72, 2126–2130. doi: 10.1111/j.1151-2916.1989.tb06043.x
Bloembergen, N., Purcell, E. M., and Pound, R. V. (1948). Relaxation effects in nuclear magnetic resonance absorption. Phys. Rev. 73, 679–746. doi: 10.1103/PhysRev.73.679
Bruni, F., Ricci, M. A., and Soper, A. K. (1998). Water confined in vycor glass. I. A neutron diffraction study. J. Chem. Phys. 109, 1478–1485. doi: 10.1063/1.476698
Buntkowsky, G., Breitzke, H., Adamczyk, A., Roelofs, F., Emmler, T., Gedat, E., et al. (2007). Structural and dynamical properties of guest molecules confined in mesoporous silica materials revealed by NMR. Phys. Chem. Chem. Phys. 9, 4843–4853. doi: 10.1039/b707322d
D'Agostino, C., Mitchell, J., Gladden, L. F., and Mantle, M. D. (2012). Hydrogen bonding network disruption in mesoporous catalyst supports probed by PFG-NMR diffusometry and NMR relaxometry. J. Phys. Chem. C 116, 8975–8982. doi: 10.1021/jp2123295
Denisov, V., and Halle, B. (1996). Protein hydration dynamics in aqueous solution. Faraday Discuss. 103, 227–244. doi: 10.1039/fd9960300227
D'Orazio, F., Bhattaharja, S., Halperin, W. P., Eguchi, K., and Mizusaki, T. (1990b). Molecular diffusion and nuclear-magnetic-resonance relaxation of water in unsaturated porous silica glass. Phys. Rev. B 42, 9810–9818. doi: 10.1103/PhysRevB.42.9810
D'Orazio, F., Bhattaharja, S., Halperin, W. P., and Gerhardt, R. (1990a). Fluid transport in partially filled porous sol-gel silica glass. Phys. Rev. B 42, 6503–6508. doi: 10.1103/PhysRevB.42.6503
Gallegos, D. P., Smith, D. M., and Brinker, C. J. (1988). An NMR technique for the analysis of pore structure: application to mesopores and micropores. J. Coll. Inter. Sci. 124, 186–198. doi: 10.1016/0021-9797(88)90339-6
Grünberg, B., Emmler, T., Gedat, E., Shenderovich, I., Findenegg, G. H., Limbach, H.-H., et al. (2004). Hydrogen bonding of water confined in mesoporous silica MCM-41 and SBA-15 studied by 1H solid-state NMR. Chem. Eur. J. 10, 5689–5696. doi: 10.1002/chem.200400351
Hansen, C. L., Thybo, A. K., Bertram, H. C., Viereck, N., van den Berg, F., and Engelsen, S. B. (2010). Determination of dry matter content in potato tubers by low-field nuclear magnetic resonance (LF-NMR). J. Agric. Food Chem. 58, 10300–10304. doi: 10.1021/jf101319q
Kapur, G. S., Findeisen, M., and Berger, S. (2000). Analysis of hydrocarbon mixtures by diffusion-ordered NMR spectroscopy. Fuel 79, 1347–1351. doi: 10.1016/S0016-2361(99)00271-9
Liu, K.-H., Zhang, Y., Lee, J.-J., Chen, C.-C., Yeh, Y.-Q., Chen, S.-H., et al. (2013). Density and anomalous thermal expansion of deeply cooled water confined in mesoporous silica investigated by synchrotron x-ray diffraction. J. Chem. Phys. 139:064502. doi: 10.1063/1.4817186
Liu, L., Chen, S. H., Faraone, A., Yen, C. W., Mou, C. Y., Kolesnikov, A. I., et al. (2006). Quasielastic and inelastic neutron scattering investigation of fragile-to-strong crossover in deeply supercooled water confined in nanoporous silica matrices. J. Phys. Condens. Matter 18, S2261–S2284. doi: 10.1088/0953-8984/18/36/S03
Liu, Y., Zhang, W. Z., and Pinnavaia, T. J. (2000). Steam-stable aluminosilicate mesostructures assembled from zeolite type Y seeds. J. Am. Chem. Soc. 122, 8791–8792. doi: 10.1021/ja001615z
Macomber, R. S. (1998). A Complete Introduction to Modern NMR Spectroscopy. New York, NY: John Wiley and Sons, Inc.
Mallamace, F., Corsaro, C., Mallacame, D., Vasi, S., Vasi, C., and Stanley, H. E. (2014). Thermodynamic properties of bulk and confined water. J. Chem. Phys. 141:18C504. doi: 10.1063/1.4895548
Martens, H. J., and Thybo, A. K. (2000). An integrated microstructural, sensory and instrumental approach to describe potato texture. LWT Food Sci. Technol. 33, 471–482. doi: 10.1006/fstl.2000.0688
Millischuk, A. A., and Ladanyi, B. M. (2011). Structure and dynamics of water confined in silica nanopores. J. Chem. Phys. 135:174709. doi: 10.1063/1.3657408
Millischuk, A. A., and Ladanyi, B. M. (2014). Polarizability anisotropy relaxation in nanoconfinement: molecular simulation study of water in cylindrical silica pores. J. Chem. Phys. 141, 18C513-1–18C513-9. doi: 10.1063/1.4896218
Mitchell, J., Hurlimann, M. D., and Fordham, E. J. (2009). A rapid measurement of T1/T2: the DECPMG sequence. J. Magn. Reson. 200, 198–206. doi: 10.1016/j.jmr.2009.07.002
Nicotera, I., Angjeli, K., Coppola, L., Arico, A. S., and Baglio, V. (2012). NMR and electrochemical investigation of the transport properties of methanol and water in nafion and clay-nanocomposites membranes for DMFCs. Membranes 2, 325–345. doi: 10.3390/membranes2020325
Ok, S., Hoyt, D. W., Andersen, A., Sheets, J., Welch, S. A., Cole, D. R., et al. (2017). Surface interactions and confinement of methane: a high pressure magic angle spinning NMR and computational chemistry study. Langmuir 33, 1359–1367. doi: 10.1021/acs.langmuir.6b03590
Osti, N. C., Cote, A., Mamontov, E., Ramirez-Cuesta, A., Wesolowski, D. J., and Diallo, S. O. (2016). Characteristic features of water dynamics in restricted geometries investigated with quasi-elastic neutron scattering. Chem. Phys. 465–466, 1–8. doi: 10.1016/j.chemphys.2015.11.008
Provencher, S. W. (1982). A constrained regularization method for inverting data represented by linear algebraic of integral equations. Comput. Phys. Commun. 27, 213–227. doi: 10.1016/0010-4655(82)90173-4
Ricci, M. A., and Rovere, M. (2000). Studies of water in confinement by experiments and simulations. J. Phys. 10, 187–193. doi: 10.1051/jp4:2000737
Sarawade, P. B., Shao, G. N., Quang, D. V., and Kim, H. T. (2013). Effect of various structure directing agents on the physicochemical properties of the silica aerogels prepared at an ambient pressure. Appl. Surf. Sci. 287, 84–90. doi: 10.1016/j.apsusc.2013.09.072
Sattig, M., Reutter, S., Fujara, F., Werner, M., Buntkowsky, G., and Vogel, M. (2014). NMR studies on the temperature-dependent dynamics of confined water. Phys. Chem. Chem. Phys. 16, 19229–19240. doi: 10.1039/C4CP02057J
Sindorf, D. W., and Maciel, G. E. (1983). Silicon-29 NMR study of dehydrated/rehydrated silica gel using cross polarization and magic-angle spinning. J. Am. Chem. Soc. 105, 1487–1493. doi: 10.1021/ja00344a012
Sing, K. S. W., Everett, D. H., Haul, R. A. W., Moscou, L., Pierotti, R. A., Rouquerol, J., et al. (1985). Reporting physisorption data for gas–solid systems. Pure Appl. Chem. 57, 603–619. doi: 10.1351/pac198557040603
Slichter, C. P. (1990). Principles of Magnetic Resonance, 3rd Edn. New York, NY: Springer Series in Solid State Science. doi: 10.1007/978-3-662-09441-9
Steytler, D. C., and Dore, J. C. (1985). Neutron diffraction studies of water in porous silica. Mol. Phys. 56, 1001–1015. doi: 10.1080/00268978500102851
Swenson, J., Bergman, R., and Longeville, S. (2001). A neutron spin-echo study of confined water. J. Chem. Phys. 115, 11299–11305. doi: 10.1063/1.1420728
Tangestaninejad, S., Moghadam, M., Mirkhani, V., Baltork, I. M., and Ghani, K. (2009). Alkene epoxidation catalyzed by molybdenum supported on functionalized MCM-41 containing N–S chelating schiff base ligand. Catal. Commun. 10, 853–858. doi: 10.1016/j.catcom.2008.12.010
Thommes, M., Kaneko, K., Neimark, A. V., Olivier, F. R.-R., Rouquerol, J., and Sing, K. S. W. (2015). Physisorption of gases, with special reference to the evaluation of surface area and pore size distribution, IUPAC Technical Report. Pure Appl. Chem. 87, 1051–1069. doi: 10.1515/pac-2014-1117
Timur, A. (1969). Pulsed nuclear magnetic resonance studies of porosity, movable fluid, and permeability of sandstones. J. Petrol. Technol. 21, 775–786. doi: 10.2118/2045-PA
Tsotsalas, M., Hejcik, P., Sumida, K., Kalay, Z., Furukawa, S., and Kitagawa, S. (2013). Impact of molecular clustering inside nanopores on desorption processes. J. Am. Chem. Soc. 135, 4608–4611. doi: 10.1021/ja312115x
Vogel, M. (2010). NMR studies on simple liquids in confinement. Eur. Phys. J. 189, 47–64. doi: 10.1140/epjst/e2010-01309-9
Webber, B., and Dore, J. (2004). Structural and dynamic studies of water in mesoporous silicas using neutron scattering and nuclear magnetic resonance. J. Phys. Condens. Matter 16, S5449–S5470. doi: 10.1088/0953-8984/16/45/009
Weber, D., Mitchell, J., McGregor, J., and Gladden, L. F. (2009). Comparing strengths of surface interactions for reactants and solvents in porous catalysts using two-dimensional NMR relaxation correlations. J. Phys. Chem. C 113, 6610–6615. doi: 10.1021/jp811246j
Weber, D., Sederman, A. J., Mantle, M. D., Mitchell, J., and Gladden, L. F. (2010). Surface diffusion in porous catalysts. Phys. Chem. Chem. Phys. 12, 2619–2624. doi: 10.1039/b921210h
Wu, D., and Navrotsky, A. (2013). Small molecule-silica interactions in porous silica structures. Geochim. Cosmochim. Acta 109, 38–50. doi: 10.1016/j.gca.2013.01.038
Keywords: low viscous fluids, confined state, relaxation, low-field NMR, subsurface
Citation: Ok S, Hwang B, Liu T, Welch S, Sheets JM, Cole DR, Liu K-H and Mou C-Y (2020) Fluid Behavior in Nanoporous Silica. Front. Chem. 8:734. doi: 10.3389/fchem.2020.00734
Received: 08 October 2019; Accepted: 16 July 2020;
Published: 28 August 2020.
Edited by:
Doo Soo Chung, Seoul National University, South KoreaReviewed by:
Bin Ding, Donghua University, ChinaAhmet Akin Uenal, Max Born Institute for Nonlinear Optics and Short-Term Spectroscopy (LG), Germany
Copyright © 2020 Ok, Hwang, Liu, Welch, Sheets, Cole, Liu and Mou. This is an open-access article distributed under the terms of the Creative Commons Attribution License (CC BY). The use, distribution or reproduction in other forums is permitted, provided the original author(s) and the copyright owner(s) are credited and that the original publication in this journal is cited, in accordance with accepted academic practice. No use, distribution or reproduction is permitted which does not comply with these terms.
*Correspondence: Salim Ok, c29rQHVvcy5kZQ==