 Chongning Li
 Jiao Li1,2,3
- 1State Key Laboratory for Chemistry and Molecular Engineering of Medicinal Resources, School of Chemistry and Pharmaceutical Science, Guangxi Normal University, Guilin, China
- 2Key Laboratory of Ecology of Rare and Endangered Species and Environmental Protection (Guangxi Normal University), Ministry of Education, Guilin, China
- 3Guangxi Key Laboratory of Environmental Pollution Control Theory and Technology for Science and Education Combined with Science and Technology Innovation Base, Guilin, China
Sensitive and selective methods for the determination of urea in samples such as dairy products are important for quality control and health applications. Using ammonium ferric citrate as a precursor, Fe/N-codoped carbon dots (CDFeN) were prepared by a hydrothermal procedure and characterized in detail. CDFeN strongly catalyzes the oxidation of 3,3′,5,5′-tetramethylbenzidine (TMB) by H2O2 to turn on an indicator molecular reaction, forming an oxidized tetramethylbenzidine (TMBox) probe with surface-enhanced Raman scattering, resonance Rayleigh scattering, and fluorescence (SERS, RRS, and FL) signals at 1,598 cm−1, 370 nm, and 405 nm, respectively. The urea aptamer (Apt) can turn off the indicator reaction to reduce the tri-signals, and the addition of urea turns on the indicator reaction to linearly enhance the SERS/RRS/FL intensity. Thus, a novel Apt turn-on tri-mode method was developed for the assay determination of ultra-trace urea with high sensitivity, good selectivity, and accuracy. Trace adenosine triphosphate and estradiol can also be determined by the Apt-CDFeN catalytic analytical platform.
Introduction
Urea is a naturally occurring metabolite of nitrogen-containing compounds (Dervisevic et al., 2018). It has many applications and can be found in both fertilizer and dermatological cream. Because it can in some cases cause adverse effects, urea detection methods are common in clinical chemistry, agriculture, and biology. Currently, urea detection methods include surface-enhanced Raman scattering (SERS), colorimetric, electrochemical, and fluorescence (FL) approaches, (Safitri et al., 2017; Migliorini et al., 2018), most of which operate in a single mode with low sensitivity. The development of urea detection methods with enhanced sensitivity, such as highly sensitive SERS, FL, and resonance Rayleigh scattering (RRS) tri-mode reactions, has therefore attracted significant attention.
CDs are carbon-based nanomaterials with good water solubility and surfaces that can be easily functionalized with various organic polymers, inorganic moieties, or biological species (Karthikeyan et al., 2019). They have been widely used in chemistry, environmental science, food science, and biotechnology (Rong et al., 2018; Zheng et al., 2018). CDs can be doped with inorganic metal ions, which is an effective method for improving their optical and electrical properties. For example, Fe is an abundant element that is compatible with carbon-based materials. Fe-doped CDs (CDFe) are suitable for various prospective applications and can be made to fluoresce. Fluorescent CDFe have been prepared using a one-step hydrothermal carbonization method, with methylthymol blue sodium salt and FeCl3∙6H2O as precursors (Zhu et al., 2019). These CDFe were employed in a glucose/CDFe ratio FL sensing system to quantify H2O2 and glucose presence in the concentration ranges of 0–133 and 0–300 μM with limits of detection (LODs) of 0.47 and 2.5 μM, respectively. N and Fe-containing CDs (CDFeN) have been used to measure dopamine content by colorimetry and fluorometry (Wang et al., 2016). Furthermore, L-tartaric acid, urea, and FeCl3∙6H2O have been used as precursors in a solvothermal procedure to synthesize CDFeN for the immunosorbent spectrophotometric detection of carcinoembryonic antigens at levels as low as 0.1 pg/ml (Yang et al., 2017). Ethylenediamine tetraacetate and iron nitrate have been used as carbon and iron sources, respectively, to obtain CDFe through a one-step hydrothermal carbonization, which provided a favorable electron acceptor near the CDFe and produced high quenching efficiency (Zhuo et al., 2019). This FL response can quantify dopamine in the range of 0.01–50 μM with an LOD of 5 nM. However, to the best of our knowledge, there have been no reports on the use of a single precursor to prepare CDFeN or the catalytic amplification of tri-signals and their utilization to detect trace urea using an aptamer (Apt).
Apts are ideal for detecting target molecules, such as urea, as they bind to a chosen molecule. Moreover, they are easy to synthesize and modify, chemically stable, and can be stored for long periods. They have already been used to specifically capture metal ions and small organic molecules in recent trace substance analyses (Zhou and Rossi, 2017). For example, the use of a single-labeled multifunctional probe comprising a Cd(II)-specific Apt for measuring Cd(II) by FL with an LOD of 2.15 nM has been demonstrated (Zhu et al., 2017). A label-free fluorescent Apt sensor for tetracycline junction Apts and thiazole orange for the selective and sensitive FL detection of 0.05–100 μg/ml tetracycline has also been established (Sun et al., 2018). Furthermore, a label-free and off-FL method for the quantitative detection of 0.7–10 nmol/L kanamycin based on functional molecular beacons was recently developed (Zhu et al., 2018). The interaction between silver nanoparticles (AgNPs) and CdTe quantum dots to detect 0.1–30 nM adenosine has also been successfully demonstrated (Song et al., 2018). In conjunction with SERS, Apts can contribute significantly to the detection of trace urea.
SERS is a molecular spectroscopy technique based on Raman scattering and local surface plasmon resonance of nanoparticles. It has been used in numerous fields, including nanomaterial research, bioanalysis, and food testing (Chen et al., 2017b; Deng et al., 2017; Li et al., 2018b). Graphene oxide nanoribbons with a strong catalytic effect on the reduction of HAuCl4 by H2O2, forming gold nanoparticles with SERS activity, were developed (Li et al., 2018a). Coupling with an Apt reaction allowed for the quantitative analysis of 2–75 nmol/L Pb(II) with the molecular probe Victoria Blue B. The thickness of Fe2O3 coatings on Fe2O3 at graphene nanostructures was adjusted by changing the number of Fe2O3 atomic layer deposition cycles (Zhang et al., 2017). Fe2O3 was deposited on a graphene surface, and combination with an Apt yielded a simple, fast, and sensitive electrochemical Apt sensor for the detection of 1.0 × 10⁻¹¹–4.0 × 10⁻⁹ M thrombin with an LOD of 1.0 × 10⁻¹² M.
Dual-mode molecular probes (e.g., FL/colorimetry (Li et al., 2017), FL/light scattering (Liu et al., 2017), and FL/SERS (You et al., 2017)) also play a pivotal role in this experiment. They have attracted widespread attention owing to their simplicity while displaying higher sensitivity than traditional optical sensors. A SERS/FL dual-mode nanosensor with a signal transduction mechanism based on the conformational transformation of human telomeric G-quadruplex was developed (Liu et al., 2015). The nanosensor exhibited an excellent SERS/FL response to the complementary strand of the G-quadruplex. Based on T-Hg2+-T coordination chemistry, the sensor can be used to detect Hg2+ at an LOD as low as 1 ppt. Zou et al. (Zou et al., 2015) used graphene quantum dot tags to design a new dual-mode immunoassay method based on SERS and FL to detect tuberculosis through a newly developed linear comparison sensing platform for the antigen CFP-10. The sandwich-type immunoassay uses a dual-mode nanoprobe to recognize SERS signals and FL images in a highly sensitive and selective manner with an LOD of 0.0511 pg/ml. However, there have been few reports on tri-mode methods with the nanocatalytic amplification of signals. For example, Li et al. (Li et al., 2018b) reported the colorimetric/FL/SERS tri-mode sensing of nitrite based on a Griess-reaction-modulated gold nanorod–Azo–nanogold assembly. Colorimetric and FL detection were carried out in solution, whereas SERS was performed on a solid substrate, achieving LODs of 0.05, 0.01, and 0.0008 μM by their respective methods.
The gold nanoparticle-TMB-H2O2 (TMB = 3,3′,5,5′-tetramethylbenzidine) system can be used as an ultrasensitive colorimetric pH indicator, with the gold nanoparticles acting as a catalyst to mimic the function of horseradish peroxidase (Deng et al., 2016). In this catalytic reaction, the absorbance of the yellow product at 450 nm remained linear in the pH range of 6.40–6.60, and the LOD of urea was 5 μM. A nanoparticle-based urea FL sensing scheme has also been reported (Shao et al., 2015). Graphene quantum dots displayed pH-sensitive green FL upon photoexcitation at 460 nm, and urease-catalyzed urea hydrolysis led to a local increase in pH and gradual FL quenching. This approach can be used to quantify urea in the concentration range of 0.1–100 mM with an LOD of 0.01 mM SnO2 quantum dot/reduced graphene oxide composites were used to prepare enzyme-free ultrasensitive urea sensors (Dutta et al., 2014). These SnO2 quantum dots can be modified on the reduced graphene oxide layer, and urea can be detected by evaluating the sensor characteristics. The electrode prepared with the composite was sensitive to urea in a concentration range of 1.6 × 10⁻¹⁴–3.9 × 10⁻¹² M with an LOD of 11.7 mM. SERS technology is a highly sensitive detection technology, and its signal enhancement mainly depends on the probe molecule and substrates. The structure and small scattering cross-section of urea molecules cannot directly produce SERS signals on gold or silver substrates. Therefore, urea molecules are ineffective as probe molecules. In this study, we developed an indirect method to detect ultra-trace urea. We found that CDFeN catalyzes the oxidation of TMB to form TMBox, an effective SERS probe. Furthermore, urea Apt can inhibit the catalysis of CDFeN and simultaneously reduce its FL. The prepared CDFeN was used to catalyze the formation of TMBox from H2O2-TMB, from which a novel, highly sensitive, and selective Apt reaction turn-on SERS/RRS/FL tri-mode analytical platform was developed for the detection of ultra-trace small organic molecules, as demonstrated herein with urea.
Materials and Methods
Instruments and Reagents
Instruments
A Hitachi F-7000 FL spectrophotometer (Hitachi High-tech), TU-1901 dual-beam ultraviolet-visible spectrophotometer (Beijing General Analysis General Instruments), and DXR smart Raman spectrometer (Thermo, United States) with an excitation wavelength of 633 nm, laser power of 3.5 mW, slit width of 50 μm, and acquisition time of 5 s were used to measure the CD system signals. The following were used to synthesize and characterize the CD systems: a desktop centrifuge (Zhuhai Heima Medical Instrument); ultrasonic cleaner (Shanghai Kedao Ultrasonic Instrument); SYZ-550 quartz sub-boiling distilled water device (Jiangsu Crystal Glass Instrument Factory); 79-1 magnetic heating stirrer (Jiangsu Zhongda Instrument Factory); HH-S2 electric heating thermostatic water bath (Jintan Dadi Automation Instrument Factory); KP-216 air energy light wave furnace (Zhongshan Qiaokang Electric Manufacturing, rated power 1200 W); pH meter (Mettler-Toledo Instruments Shanghai); Nano-2s nanometer particle size and zeta potential analyzer (Malvern, United Kingdom); and an S-4800 field emission scanning electron microscope (SEM; Hitachi Hi-tech).
Reagents
Urea ssDNA Apt (Apturea) with the sequence 5′-3′ CAC AAG CAC AGA CAG CTG TTC CAC AT was acquired from Shanghai Biotech Biological, Shanghai, China. Ammonium ferric citrate (Sinopharm Group Chemical Reagent, Shanghai, China), 30% H2O2 (105 times dilution, Shanghai Chemical Reagent, Shanghai, China), 0.1 mol/L HCl, 0.1 mol/L Tris solution, 5.05 mmol/L pH 4.4 Tris-HCl (concentration based on the amount of HCl: 500 μL of 0.1 mol/L Tris and 505 μL of 0.1 mol/L HCl were prepared in 10 ml of ultra-pure water), and 0.5 mmol/L TMB (storage: 2–8°C, T818493-5 g, CAS: 54827-17-7, Shanghai McLean Biochemical Technology, Shanghai, China) were employed for synthesis and analyses. TMB (0.012 g) was weighed and dissolved in 100 ml of an ethanol solution (ethanol: water = 1:1) to obtain the stock solution. Water (44 ml) was added to an Erlenmeyer flask and combined with 2 ml of 10 mmol/L AgNO3, 2.0 ml of 100 mm/L trisodium citrate, 600 μL of 30% H2O2, and 600 μL of 0.1 mol/L NaBH4 added sequentially under stirring until the color turned blue. AgNPs were added to the analysis system as an SERS enhancement substrate. Without the addition of AgNPs, the system could generate very weak Raman signals. The prepared blue AgNP gel was then immediately transferred into a light-wave oven and heated at 250°C for 10 min to obtain an orange-red transparent AgNP gel. After cooling naturally, water was added to the product to obtain a total volume of 50 ml at a concentration of 4.0 × 10⁻⁴ mol/L AgNPs. All reagents were analytical grade, and all experiments employed secondary distilled water.
Preparation of CDFe and CDFeN
Ferric citrate or ammonium ferric citrate powder (0.02 g) was accurately weighed and dissolved in 30 ml of ultra-pure water. The dark yellow solution was then transferred to a polytetrafluoroethylene-based autoclave. After sealing, a hydrothermal reaction was performed in a muffle furnace at the optimal temperature of 180°C for 3 h. After the reaction was complete, ice water was used to cool the product to room temperature to obtain a brown solution. The brown-yellow solution was centrifuged at 10000 rpm for 10 min to remove the precipitate, and the supernatant was dialyzed against a dialysis bag with a molecular weight cutoff of 3,500 Da for 12 h to obtain 0.67 mg/ml CDFe or CDFeN, which was diluted for further use.
Optimization and Characterization of CDs
CD synthesis was optimized based on the product FL intensity. As shown in Supplementary Figure S1, FL was the strongest when the reaction was performed at 180°C for 30 min. The amount of precursor was selected according to the strength of the catalytic effect of the CDs. Generally, the amount corresponding to the maximum CD concentration and the maximum slope of the FL intensity curve of the TMB oxidation product were selected. The experimental results indicated that 0.02 g of ammonium ferric citrate yielded CDs with the best catalytic effect. Compared with reported procedures for the preparation of CDFe (Supplementary Table S1) (Faraji et al., 2018; Yue et al., 2019; Zhang et al., 2019; Yadav et al., 2020), our procedure is simpler and requires a shorter hydrothermal reaction time. In addition, only one reagent, ammonium ferric citrate, was used to prepare CDFeN.
Five molecular techniques were used to characterize the CDs. The FL intensity of different CDFe concentrations in a Tris-HCl buffer solution was measured. Under the conditions of voltage = 500 V, excitation slit = emission slit = 10 nm, and λex = 305 nm, the system generated a FL peak at 420 nm. With increasing CDFe concentration, the FL intensity gradually increased (Supplementary Figure S2A). The FL intensity of the CDFeN-Tris-HCl system at different concentrations was measured. The system generated an FL peak at 420 nm, which increased gradually in intensity with increasing CDFeN concentration (Supplementary Figure S2B). The CDFeN FL was stronger than that of CDFe due to the doped N element. The RRS intensity of the CDFe/CDFeN-Tris-HCl system with different concentrations was measured. Under the conditions of voltage = 350 V and excitation slit = emission slit = 5 nm, the system produced a strong RRS peak at 375 nm, the intensity of which gradually increased with CDFe/CDFeN concentration (Supplementary Figures S2C,D). The CDFeN RRS was stronger than that of CDFe due to the resonance between the large π-bond electrons and doped Fe electrons of the CDs. The UV-vis absorbance intensity of the CDFeN/CDFe-Tris-HCl system was measured. As the concentration of CDFeN/CDFe increased, an absorption peak appeared at 320 nm (Supplementary Figures S2E,F). The absorbance of both CDs was similar due to the low sensitivity of the spectrophotometric method.
A 0.025 g/ml CDFe solution (10 ml) was placed in a material tray, pre-frozen in a vacuum drying freezer cold trap for 5 h, and dried at 0.1 Pa for 24 h. The obtained solid sample and the precursor materials (ferrocene powder A, ferric ammonium citrate powder, and potassium bromide) were mixed in equal amounts and ground uniformly in an agate mortar to prepare powder tablets for infrared spectral analysis. The infrared spectra of ammonium ferric citrate (Supplementary Figures S2G) contained strong peaks at 3,189 cm−1 (O-H stretching); 1,616 cm−1 (C=C conjugate stretching); 1,394 cm−1 (CO2− symmetric stretching); 1,250 and 1,066 cm−1 (C-O stretching); and 909, 851, and 642 cm−1 (C=C-H bending). The infrared spectra of CDFeN (Supplementary Figure S2H) contained strong peaks at 3,411 cm−1 (O-H telescopic vibration); 1,617 cm−1 (C=C conjugate telescopic vibration), 1,384 cm−1 (CO2− symmetric telescopic vibration), 1,049 cm−1 (C-O telescopic vibration), 560 cm−1 (C-H out-of-plane bending), and 470 cm−1 (C=C-H bending). The infrared spectra of the CDs and the corresponding precursors were significantly different. The infrared peak at 3,411 cm−1 (O-H stretching vibration) indicated the presence of hydroxyl groups in the CDs, confirming that the precursor material was successfully modified and had good water dispersion. Raman spectra of both the CDFeN and CDFe solutions were examined, and no Raman peaks were observed. Using AgNPs in solution as a SERS substrate, weak SERS peaks were recorded (as shown in Supplementary Figures 2SI,J) at 1,160 and 1,620 cm−1 for CDFeN and 1,620 cm−1 for CDFe.
Experimental Procedures
In a 5 ml stoppered graduated test tube, 200 μL of a 0.67 μg/ml CDFe/N solution, 100 μL of a 0.1 mmol/L H2O2 solution, 100 μL of a 0.5 mmol/L TMB solution, 250 μL of a 5.05 mmol/L pH 4.07 Tris-HCl solution, 200 μL of a 0.1 μmol/L Apt solution, and an appropriate amount of a urea solution were added sequentially. Water was then added to obtain a final volume of 1.5 ml. The reaction was performed at 50°C in a water bath for 30 min and then terminated by placing it in an ice water bath. Subsequently, 400 μL of a 0.4 mmol/L AgNP solution and then water was added to reach a total volume of 2 ml. Finally, the SERS and FL/RRS spectra were acquired using a Raman spectrometer and FL spectrophotometer, respectively.
Results and Discussion
Methodology
In the Tris-HCl buffer solution, the H2O2-TMB reaction was slow because the transfer of redox electrons is difficult between H2O2 and TMB. CDFeN is rich in π-electrons and Fe metal electrons, which can enhance the redox electron transfer to effectively catalyze the formation of large π-bond TMBox in the H2O2-TMB system and generate a strong FL signal to turn on the FL indicator reaction. Apturea and the CDs form a complex morphology that suppresses the catalytic performance of the CDs, which thus reduces the system FL signal to turn off the indicator reaction. Based on the three-dimensional structure of Apturea and its flexibility, the spatial structure formed by the extension of the nucleic acid chain in solution affords a large contact area with urea, causing the CDs to change to a free state. This restores the catalytic activity to turn on the reaction, leading to an increase in the FL signal of the system. Within 3.33–20 nmol/L, the change in FL intensity displayed a linear relationship with urea concentration and TMBox exhibited good SERS activity on the AgNP substrates; the SERS signal of the system linearly increased within this concentration range. Thus, two FL and SERS analysis methods for urea were developed based on this CDFeN catalytic amplification reaction. Because the formed TMBox results in AgNP aggregation, the RRS intensity also increased linearly with urea concentration. As a result, a simple, sensitive, Apt-mediated CDFeN catalytic reaction with SERS, FL, and RRS tri-mode signals was established for the determination of urea (Figure 1).
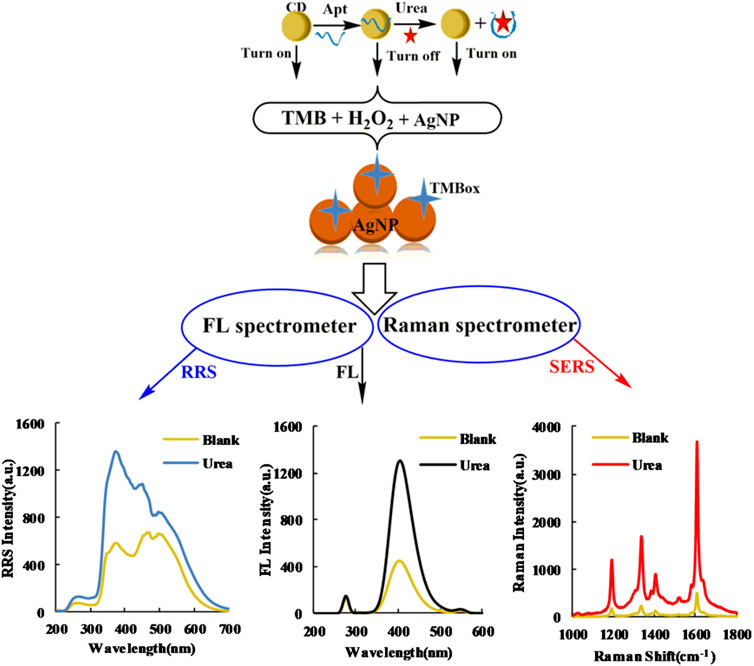
FIGURE 1. Schematic of SERS/RRS/FL tri-mode method to detect ultra-trace urea coupling Apturea with CDFeN catalysis.
SERS Analysis of CD-H2O2-TMB-Apt-Urea Nanocatalytic Systems
The SERS signal mainly arose from the TMBox molecule when AgNPs were added to the analysis system as a substrate. AgNPs were added as a uniformly dispersed colloidal system, and probe molecules could be homogeneously adsorbed on the surface of bare AgNPs to produce SERS. No SERS signal was observed when only AgNPs were employed. Although changes in the chemical environment may cause a shift in the position of the SERS peak (e.g., the presence of urea), the observed SERS peak in this study is that of TMBox. In a pH 4.07 Tris-HCl buffer solution at 50°C in a water bath, CD catalyzed the oxidation of TMB by H2O2, and the TMBox exhibited SERS activity. The addition of Apturea can wrap around the CDs, which inhibits their catalytic ability and reduces the formation of TMBox and the corresponding SERS intensity. When the target molecule urea was added, it specifically bound to the corresponding Apturea and released the CDs, restoring their catalytic activity. The Raman spectrum was obtained with a light source power of 2.5 mW and slit of 25.0 μm. The SERS intensity at 1,598 cm−1,
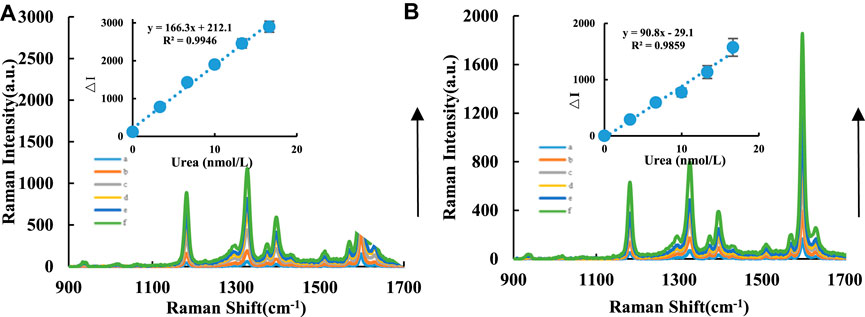
FIGURE 2. SERS spectra of CD-H2O2-TMB-Apt-AgNP analysis system. A/B compared the catalytic effects between CDFe and CDFeN in the urea analysis system. (A): CDFe-H2O2-TMB-Tris-HCl-Apt-Urea-AgNPs system, a: 0.04 μg/ml CDFe+5.0 μmol/L H2O2+ 0.03 mmol/L TMB+0.51 mmol/L PH = 4.07 Tris-HCl+10 nmol/L Apt+ Urea+0.08 mmol/L AgNPs; b: a+3.33 nmol/L Urea; c: a+6.66 nmol/L Urea; d: a+9.99 nmol/L Urea; e: a+13.32 nmol/L Urea; f: a+16.65 nmol/L Urea. (B): CDFeN-H2O2-TMB-Tris-HCl-Apt-Urea-AgNPs system, a: 0.04 μg/ml CDFeN+ 5.0 μmol/L H2O2+ 0.03 mmol/L TMB+ 0.51 mmol/L PH = 4.07 Tris-HCl+10 nmol/L Apt+ Urea+0.08 mmol/L AgNPs; b: a+3.33 nmol/L Urea; c: a+6.66 nmol/L Urea; d: a+9.99 nmol/L Urea; e: a+13.32 nmol/L Urea; f: a+16.65 nmol/L Urea.
FL Spectra of Nanocatalytic and Apt System
CDs are fluorescent nanomaterials, and in this study, the FL peak height at 405 nm was monitored instead of the peak area to approximate the FL intensity. This method is not very precise, but the calculations are easy; this caused the problem related to the change in the slope of adjacent points at both ends of the linear range. For the CD-H2O2-TMB nanocatalytic system, within a 0.02 – 0.14 μg/ml CD concentration range, the FL intensity increased from CDs more strongly catalyzing the oxidation of TMB by H2O2 (Supplementary Figures S3A,B). For the Apt inhibition system CD-HCl-H2O2-TMB-Apt, the CDs are wrapped when Apturea is added, which inhibits the ability of the CDs to catalyze H2O2-TMB, reduces TMBox formation, and thus decreases the FL intensity. FL spectra of the CD-H2O2-TMB-Apt system were measured with voltage = 350 V and excitation slit = emission slit = 10 nm. With increasing Apturea concentration, the FL intensity of the system gradually and linearly weakened (Supplementary Figures S3C,D). For the FL intensity of the CDFe-Apt system, the conditions of voltage = 500 V, excitation slit = emission slit = 10 nm, and λex = 305 nm generated a FL peak at 395 nm. With increasing Apturea concentration, the FL intensity of the system gradually decreased. For the CDFeN-Apt system, the conditions of voltage = 500 V, excitation slit = emission slit = 10 nm, and λex = 310 nm generated a FL peak at 405 nm. With increasing Apturea concentration, the FL intensity of the system gradually decreased (Supplementary Figures S3E,F). Based on these results, Apturea can effectively wrap the CDs to linearly decrease the FL intensity of the system with increasing Apturea concentration, demonstrating the interaction between the CDs and Apturea, and the applicability of the CDs as FL probes to identify the interaction. For the CD-H2O2-TMB-Apt-Urea system, when the target molecule urea was added, urea and Apturea formed a stable conjugate and released the CDs, thus restoring their catalytic activity. As a result, the FL intensity of the system gradually increased. Under the conditions of voltage = 350 V, excitation slit = emission slit = 10 nm, and λex = 275 nm, the system generated a FL peak at 405 nm. Within 3.33 – 20 nmol/L, the FL intensity displayed a linear relationship with the urea concentration (Figures 3A,B).

FIGURE 3. FL spectra of CD-H2O2-TMB analysis system. Without H2O2-TMB probe, A/B compared the fluorescence between CDFe and CDFeN in the urea analysis system. (A): CDFe-H2O2-TMB-Tris-HCl-Apt-Urea system. a: 0.04 μg/ml CDFe+ 6.7 μmol/L H2O2+ 0.03 mmol/L TMB+ 0.84 mmol/L PH = 4.4 Tris-HCl+16.65 nmol/L Apt; b: a+3.33 nmol/L Urea; c: a+6.66 nmol/L Urea; d: a+9.99 nmol/L Urea; e: a+13.32 nmol/L Urea; f: a+16.65 nmol/L Urea; g: a+20 nmol/L Urea; (B): CDFeN-H2O2-TMB-Tris-HCl-Apt-Urea system, a: 0.04 μg/ml CDFeN+6.7 μmol/L H2O2+0.03 mmol/L TMB+ 0.84 mmol/L PH = 4.4 Tris-HCl+16.65 nmol/L Apt; b: a+3.33 nmol/L Urea; c: a+6.66 nmol/L Urea; d: a+9.99 nmol/L Urea; e: a+13.32 nmol/L Urea; f: a+16.65 nmol/L Urea; g: a+20 nmol/L Urea.
RRS Analysis of Nanocatalyst and Apt System
RRS is a synchronous FL scanning technology where the excitation light wavelength is equal to the emission light wavelength (Δλ = λem−λex = 0). The signal intensity mainly originates from the scattering of excitation light by nanoparticles. The degree of aggregation of particles in the system and changes in particle size cause signal changes. For the CDFe/CDFeN-Apt system, under the conditions of voltage = 400 V and excitation slit = emission slit = 5 nm, RRS peaks appeared at 370, 380 and 385 nm. The RRS intensity of the system gradually decreased with increasing Apturea concentration (Supplementary Figures S4A,B). Therefore, Apturea can effectively wrap the CDs to linearly decrease the RRS intensity of the system with increasing Apt concentration. In the absence of AgNPs, the CD-H2O2-TMB catalytic reaction of the system occurs, but the nanocatalyst CD concentration was low and the TMB concentration was very low (0.03 mmol/L). Thus, the TMBox molecules produced were low with a very weak RRS signal, resulting in weak overall RRS spectral intensities of the system. However, the CD-H2O2-TMB-AgNP system generated a strong RRS peak at 380 nm since the produced TMBox resulted in AgNP aggregation (Yao et al., 2019). As the CD concentration increased, the RRS intensity of the system gradually increased (Supplementary Figures S4C,D). For the CD-H2O2-TMB-Apt-Urea system, when the target molecule urea was added, urea and Apturea formed a stable conjugate and released the CDs. This restored the CD catalytic activity, causing the RRS intensity of the system to gradually increase. Under the conditions of voltage = 350 V and excitation slit = emission slit = 5 nm, the CD-H2O2-TMB-Apt-Urea system produced a scattering peak at 370 nm. Within 2.5–12.5 nmol/L, the RRS intensity had a linear relationship with urea concentration (Figures 4A,B).
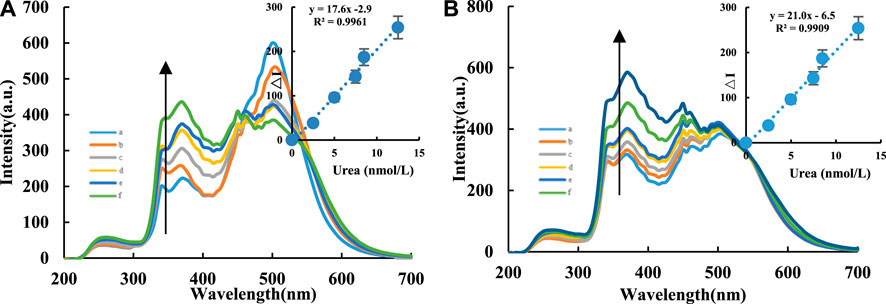
FIGURE 4. RRS spectra of CD-Tris-HCl-Apt analysis system. A/B compared the RRS analysis system of urea using CDFe and CDFeN, respectively. (A): CDFe-H2O2-TMB-Tris-HCl-Apt-Urea-AgNPs system, a: 0.04 μg/ml CDFe + 6.7 μmol/L H2O2+ 0.03 mmol/L TMB+ 0.84 mmol/L PH = 4.4 Tris-HCl+16.65 nmol/L Apt+0.08 mmol/L AgNPs; b: a+2.5 nmol/L Urea; c: a+5 nmol/L Urea; d: a+7.5 nmol/L Urea; e: a+8.5 nmol/L Urea; f: a+12.5 nmol/L Urea. (B): CDFeN-H2O2-TMB-Tris-HCl-Apt-Urea-AgNPs system, a:0.04 μg/ml CDFeN + 6.7 μmol/L H2O2+ 0.03 mmol/L TMB+ 0.84 mmol/L PH = 4.4 Tris-HCl+16.65 nmol/L Apt+0.08 mmol/L AgNPs; b: a+2.5 nmol/L Urea; c: a+5 nmol/L Urea; d: a+6 nmol/L Urea; e: a+7.5 nmol/L Urea; f: a+10 nmol/L Urea; g: a+12.5 nmol/L Urea.
SEM and Laser Scattering of the System
SEM samples were prepared by dropping a small aliquot of each sample on the surface of a dried silicon wafer and allowing it to dry naturally. The average particle size of CDFe was approximately 50 nm (Figure 5A), and that of CDFeN was approximately 30 nm (Figure 5B). CDFe and CDFeN exhibited spectral peaks at 0.2, 5.2, and 5.5 keV corresponding to elemental Fe (Figure 5C, 5D); CDFeN also showed a weak peak at 0.45 keV corresponding to N. Due to the presence of N, the CDs exhibited excellent catalytic activity. When no urea was added, the Apturea in the system wrapped the CDFeN, thereby inhibiting CDFeN from catalyzing the oxidation of TMB by H2O2. As a result, fewer TMBox fluorescent probes were formed, and the extent of aggregation was low after adding AgNPs (aggregate size of 50 nm, Figure 5E). Upon addition of urea, CDFeN encapsulation decreased, and the catalytic effect of the system was restored. As a result, the number of TMBox fluorescent probes formed gradually increased, and the extent of AgNPs-TMBox aggregation increased in the system to reach a size of 70 nm (Figure 5F), resulting in a linear increase in RRS intensity.
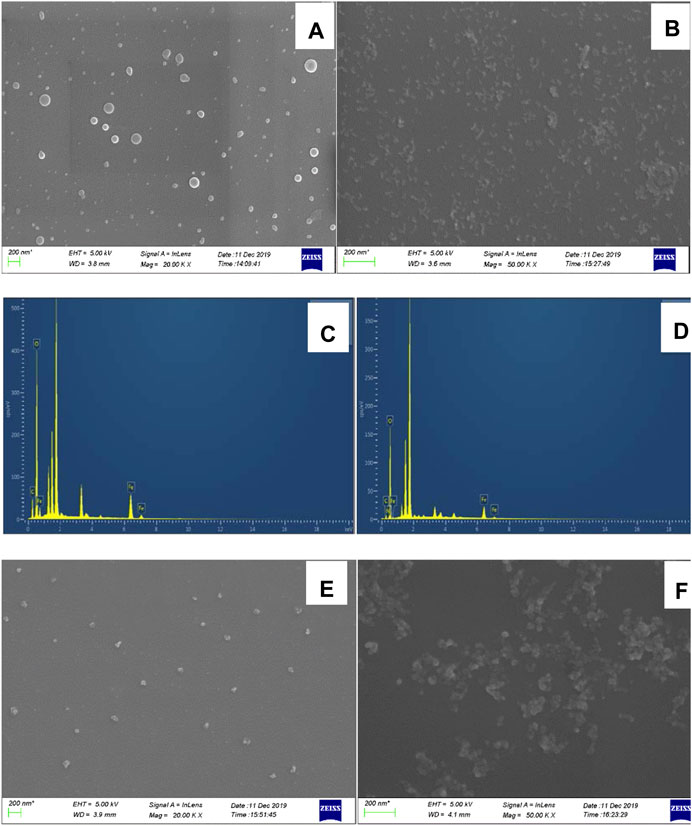
FIGURE 5. SEM and energy spectra images of analysis system. (A): SEM of CDFe; (B): SEM of CDFeN; (C): energy spectrum of CDFe; (D): energy spectrum of CDFeN; (E): Analysis system without urea, 0.08 μg/ml CDFeN+ 5.0 μmol/L H2O2+ 0.03 mmol/L TMB+ 0.51 mmol/L pH 4.07 Tris-HCl+10 nmol/L Apt+0.08 mmol/L AgNPs; (F): Analysis system with urea. E+12.5 nmol/L Urea.
Particle size analysis was used to determine the particle size distribution of the nanoparticles in the system. With increasing urea concentration, the target molecule urea and Apturea formed a stable conjugate and released the CDs, which restored their catalytic activity. Therefore, the product TMBox gradually increased along with TMBox-AgNP aggregation. The particle sizes of the reaction product of the CDFeN-H2O2-TMB-Apt-Urea-AgNP system were 98, 110, and 130 nm, respectively (Figure 6), due to aggregation in the system.
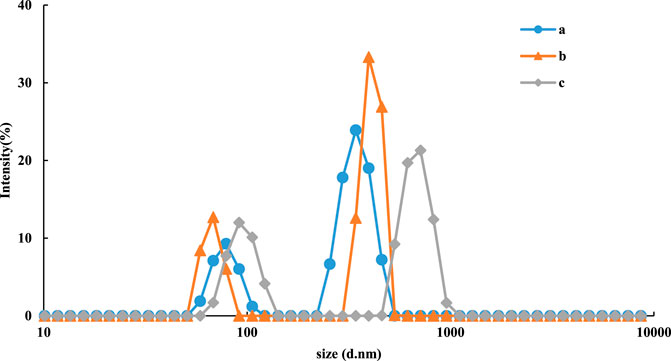
FIGURE 6. Particle size distribution of CDFeN-H2O2-TMB-Tris-HCl-Apt-Urea-AgNPs system. a: 0.08 μg/ml CDFeN+ 5.0 μmol/L H2O2+ 0.03 mmol/L TMB+ 0.51 mmol/L Tris-HCl (PH = 4.07)+10 nmol/L Apt+ Urea+0.08 mmol/LAgNPs; b: a+5.0 nmol/L Urea; c: a+12.5 nmol/L Urea.
Optimization of Analysis Conditions
The effect of the experimental parameters on the SERS and FL signal intensities was systematically examined. As shown in Supplementary Figure S5 and in accordance with the experiments described in Section Optimization and Characterization of CDs containing 0.1 nmol/L urea, the use of a 0.51 mmol/L pH 4.07 Tris-HCl solution and 0.03 mmol/L TMB resulted in the strongest SERS signal. For the FL intensity, the optimized parameters were 5.0 μmol/L H2O2, 10 nmol/L Apturea, 0.07 μg/ml CDs, 0.08 mmol/L AgNPs, a water bath temperature of 50°C, and a reaction time of 35 min.
Working Curve
In this study, the FL, SERS, and RRS spectra of the CD-H2O2-TMB-Apt-Urea system were measured (Table 1). For the H2O2-TMB reaction, the catalytic effects of the two CDs (CDFe and CDFeN) were studied. The slope of the working curve corresponds to the catalytic ability of the CDs. The slope K of the working curve of the CDFeN-H2O2-TMB-Apt-Urea system was larger than that of the CDFe system, indicating that the former can be used for the FL detection of urea with a linear range of 3.33– 20 nmol/L and LOD of 1.0 nmol/L. Similar to FL, the SERS and RRS methods using the CDFeN system were more sensitive than CDFe according to the evaluated slopes. Of the three modes, FL is simplest, as it does not require the addition of AgNPs, whereas SERS is the most sensitive. Compared with other reported urea analysis methods (Table 2) (Liu et al., 2010; Kumar et al., 2015; Chen et al., 2017a; Momenzadeh and Azadbakht, 2017; Mansouri and Azadbakht, 2019; Yarahmadi et al., 2019), this SERS method is more accurate and precise.
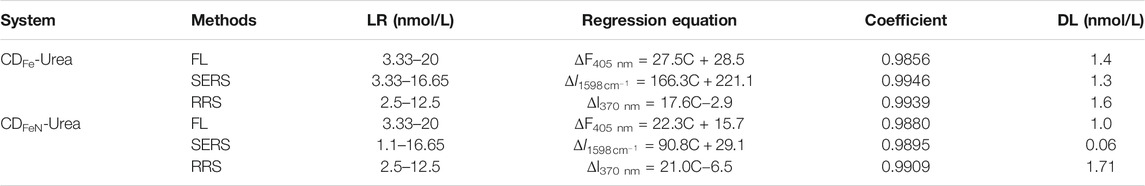
TABLE 1. The tri-mode analytical platform for assay of urea.
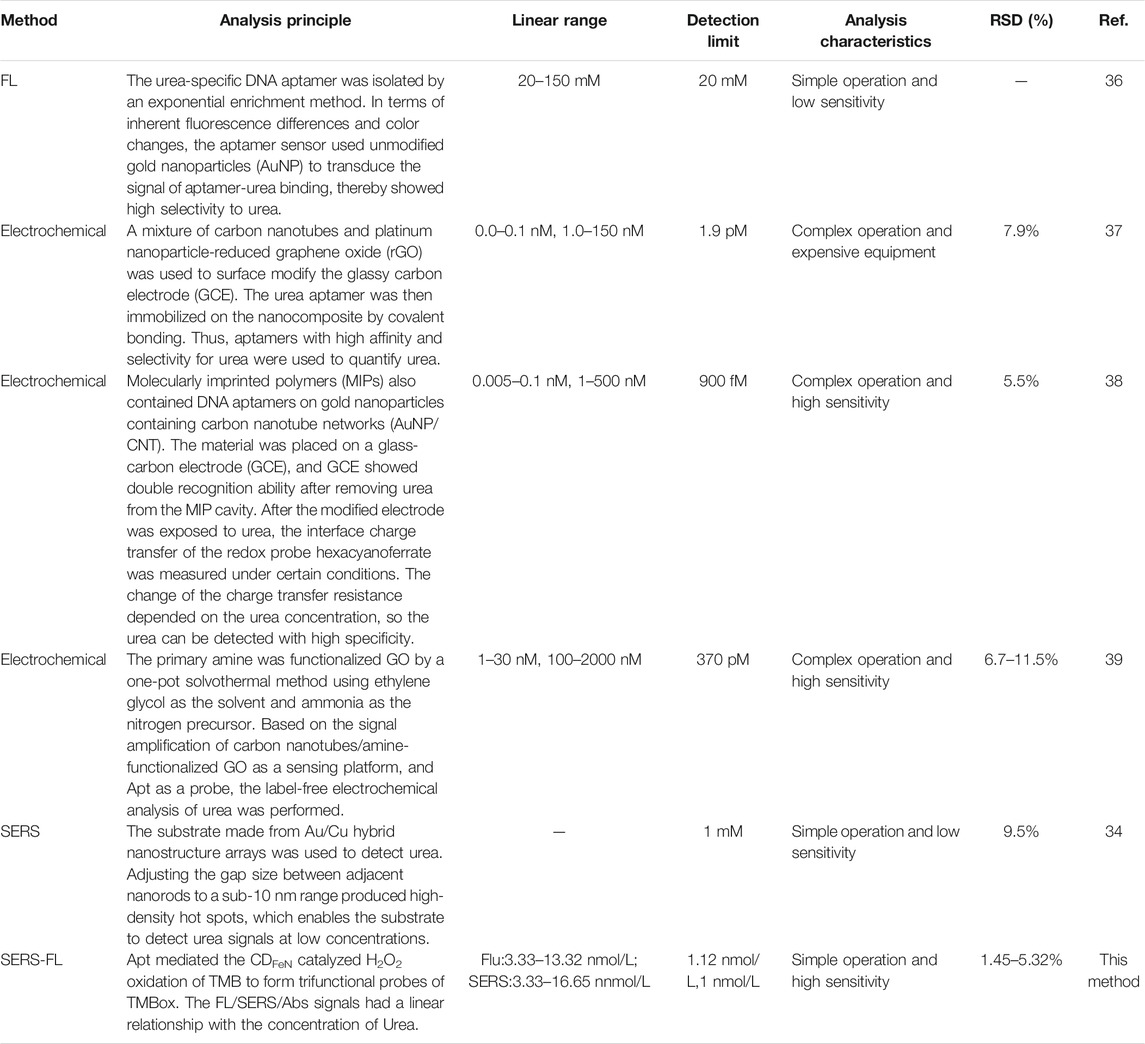
TABLE 2. Comparison of reported Urea analysis methods.
Effects of Interfering Ions
The interference of coexisting ions on 10 nmol/L urea in the system was studied by RRS. The results indicated that 10 μmol/L K+, Cr6+, NH4+, Zn2+, SiO32−, Mg2+, CO32−, I−, Ca2+, and SO42−; 5 μmol/L Al3+, Mn2+, Ba2+, Hg2+, Cu2+, and HSA; and 2 μmol/L Co2+, Fe2+, NO2−, Fe3+, Br−, Cr3+, and BSA did not interfere with the measurement. The interference of coexisting ions on 10 nmol/L urea in the system was then investigated by the SERS method. Similarly, the results showed that 10 μmol/L Ba2+, K+, Cr6+, NH4+, Zn2+, SiO32-, Mg2+, Hg2+, CO32−, I−, and Ca2+; 5 μg/L Al3+, Co2+, Mn2+, Cu2+, HSA, and SO42-; and 2 μmol/L Fe2+, NO2−, Fe3+, Br−, Cr3+, and BSA did not interfere with the measurement. The interference of coexisting ions on 10 nmol/L urea in the system was studied by FL. The results indicated that 10 μmol/L K+, NH4+, Zn2+, SiO32−, SO42−, Mg2+, CO32−, and Ca2+; 5 μmol/L Al3+, Mn2+, Fe2+, Ba2+, Hg2+, Cu2+ and NO2−; and 2 μmol/L Co2+, Br−, I−, Cr3+, HSA, and BSA did not interfere with the measurement. Therefore, our method has good selectivity.
Real Sample Determination
Urea content determination plays an important role in the dairy industry, as its content in milk and dairy products should be less than 0.70 mg/g (Kumar et al., 2015). If the urea content in milk powder exceeds the normal range, consumption can lead to certain health problems. Thus, we detected the urea content in milk samples using our new method. Five milk samples were purchased from a supermarket and treated to obtain sample solutions according to an established method (Liang et al., 2019). The samples were then analyzed by the proposed method (the results are shown in Supplementary Table S2). The recovery rates were in the range of 96.4–106%, and the results of the proposed method for the determination of urea from milk samples were in agreement with the spectrophotometric method.
Conclusion
In this study, a single reagent was used as a precursor to synthesize stable Fe/N-doped CDs (CDFeN) by a hydrothermal procedure. The molecular and spectral characteristics of the CDFeN and their catalytic effect on the reaction of H2O2 and TMB were studied in detail using SERS, RRS, FL, and UV-vis absorption spectra. Apturea can adsorb onto the surface of the CDFeN to turn off the nanocatalytic tri-mode indicator reaction. When the target molecule urea is added, Apturea releases the CDFeN due to its specific binding, thereby restoring the CDFeN catalytic activity to turn on the indicator reaction. With increasing urea concentration, the change in SERS/RRS/FL signals were linear, which establishes our method as a highly sensitive Apt-mediated, doped-CD, catalytic amplification, tri-spectroscopic platform.
Data Availability Statement
The original contributions presented in the study are included in the article/Supplementary Material, further inquiries can be directed to the corresponding authors.
Author Contributions
The manuscript was written through contributions by all authors. JL and CL contributed equally to this article.
Funding
This work was supported by the National Natural Science Foundation of China (No. 21767004).
Conflict of Interest
The authors declare that the research was conducted in the absence of any commercial or financial relationships that could be construed as a potential conflict of interest.
Supplementary Material
The Supplementary Material for this article can be found online at: https://www.frontiersin.org/articles/10.3389/fchem.2021.613083/full#supplementary-material.
References
Chen, K., Zhang, X., and MacFarlane, D. R. (2017a). Ultrasensitive surface-enhanced Raman scattering detection of urea by highly ordered Au/Cu hybrid nanostructure arrays. Chem. Commun. 53, 7949–7952. doi:10.1039/C7CC03523C
Chen, Y., Li, X., Yang, M., Yang, L., Han, X., Jiang, X., et al. (2017b). High sensitive detection of penicillin G residues in milk by surface-enhanced Raman scattering. Talanta 167, 236–241. doi:10.1016/j.talanta.2017.02.022
Deng, H., Hong, G., Lin, F., Liu, A., Xia, X., and Chen, W. (2016). Colorimetric detection of urea, urease, and urease inhibitor based on the peroxidase-like activity of gold nanoparticles. Analytica Chim. Acta 915, 74–80. doi:10.1016/j.aca.2016.02.008
Deng, R., Qu, H., Liang, L., Zhang, J., Zhang, B., Huang, D., et al. (2017). Tracing the therapeutic process of targeted aptamer/drug conjugate on cancer cells by surface-enhanced Raman scattering spectroscopy. Anal. Chem. 89, 2844–2851. doi:10.1021/acs.analchem.6b03971
Dervisevic, M., Dervisevic, E., and Şenel, M. (2018). Design of amperometric urea biosensor based on self-assembled monolayer of cystamine/PAMAM-grafted MWCNT/Urease. Sensors Actuators B: Chem. 254, 93–101. doi:10.1016/j.snb.2017.06.161
Dutta, D., Chandra, S., Swain, A. K., and Bahadur, D. (2014). SnO2 quantum dots-reduced graphene oxide composite for enzyme-free ultrasensitive electrochemical detection of urea. Anal. Chem. 86, 5914–5921. doi:10.1021/ac5007365
Faraji, M., Derakhshi, P., Tahvildari, K., and Yousefian, Z. (2018). High performance Fe and N-codoped graphene quantum dot supported Pd3Co catalyst with synergistically improved oxygen reduction activity and great methanol tolerance. Solid State Sci. 83, 152–160. doi:10.1016/j.solidstatesciences.2018.07.012
Karthikeyan, R., Nelson, D. J., and John, S. A. (2019). Non-enzymatic determination of purine nucleotides using a carbon dot modified glassy carbon electrode. Anal. Methods 11, 3866–3873. doi:10.1039/C9AY00718K
Kumar, P., Ramulu Lambadi, P., and Kumar Navani, N. (2015). Non-enzymatic detection of urea using unmodified gold nanoparticles based aptasensor. Biosens. Bioelectron. 72, 340–347. doi:10.1016/j.bios.2015.05.029
Li, C., Fan, P., Liang, A., Liu, Q., and Jiang, Z. (2018a). Aptamer based determination of Pb(II) by SERS and by exploiting the reduction of HAuCl4 by H2O2 as catalyzed by graphene oxide nanoribbons. Microchim. Acta 185, 177. doi:10.1007/s00604-018-2714-9
Li, D., Ma, Y., Duan, H., Deng, W., and Li, D. (2018b). Griess reaction-based paper strip for colorimetric/fluorescent/SERS triple sensing of nitrite. Biosens. Bioelectron. 99, 389–398. doi:10.1016/j.bios.2017.08.008
Li, Z., Liu, R., Xing, G., Wang, T., and Liu, S. (2017). A novel fluorometric and colorimetric sensor for iodide determination using DNA-templated gold/silver nanoclusters. Biosens. Bioelectron. 96, 44–48. doi:10.1016/j.bios.2017.01.005
Liang, A., Wang, H., Yao, D., and Jiang, Z. (2019). A simple and sensitive SERS quantitative analysis method for urea using the dimethylglyoxime product as molecular probes in nanosilver sol substrate. Food Chem. 271, 39–46. doi:10.1016/j.foodchem.2018.07.149
Liu, D.-Z., Chen, K., Ge, K., Me, L.-H., and Yao, S.-Z. (2010). Surface acoustic wave sensor system applied to the kinetic study of urease in plant seeds. Chin. J. Chem. 13, 231–240. doi:10.1002/cjoc.19950130307
Liu, G., Xuan, C., Feng, D., Hua, D., Liu, T., Qi, G., et al. (2017). Dual-modal fluorescence and light-scattering sensor based on water-soluble carbon dots for silver ions detection. Anal. Methods 9, 5611–5617. doi:10.1039/C7AY01873H
Liu, M., Wang, Z., Pan, L., Cui, Y., and Liu, Y. (2015). A SERS/fluorescence dual-mode nanosensor based on the human telomeric G-quadruplex DNA: application to mercury (II) detection. Biosens. Bioelectron. 69, 142–147. doi:10.1016/j.bios.2015.02.009
Mansouri, R., and Azadbakht, A. (2019). Aptamer-based approach as potential tools for construction the electrochemical aptasensor. J. Inorg. Organomet. Polym. 29, 517–527. doi:10.1007/s10904-018-1024-3
Migliorini, F. L., Sanfelice, R. C., Mercante, L. A., Andre, R. S., Mattoso, L. H. C., and Correa, D. S. (2018). Urea impedimetric biosensing using electrospun nanofibers modified with zinc oxide nanoparticles. Appl. Surf. Sci. 443, 18–23. doi:10.1016/j.apsusc.2018.02.168
Momenzadeh, H., and Azadbakht, A. (2017). A glassy carbon electrode modified with carbon nanotubes and reduced graphene oxide decorated with platinum-gold nanoparticles for voltammetric aptasensing of urea. Microchim. Acta 184, 4685–4694. doi:10.1007/s00604-017-2494-7
Rong, M., Liang, Y., Zhao, D., Chen, B., Pan, C., Deng, X., et al. (2018). A ratiometric fluorescence visual test paper for an anthrax biomarker based on functionalized manganese-doped carbon dots. Sensors Actuators B: Chem. 265, 498–505. doi:10.1016/j.snb.2018.03.094
Safitri, E., Heng, L., Ahmad, M., and Ling, T. (2017). Fluorescence bioanalytical method for urea determination based on water soluble ZnS quantum dots. Sensors Actuators B: Chem. 240, 763–769. doi:10.1016/j.snb.2016.08.129
Shao, T., Zhang, P., Tang, L., Zhuo, S., and Zhu, C. (2015). Highly sensitive enzymatic determination of urea based on the pH-dependence of the fluorescence of graphene quantum dots. Microchim. Acta 182, 1431–1437. doi:10.1007/s00604-015-1469-9
Song, Y., Xu, G., Wei, F., Cen, Y., Sohail, M., Shi, M., et al. (2018). Aptamer-based fluorescent platform for ultrasensitive adenosine detection utilizing Fe3O4 magnetic nanoparticles and silver nanoparticles. Microchim. Acta 185, 139. doi:10.1007/s00604-018-2681-1
Sun, C., Su, R., Bie, J., Sun, H., Qiao, S., Ma, X., et al. (2018). Label-free fluorescent sensor based on aptamer and thiazole orange for the detection of tetracycline. Dyes Pigm. 149, 867–875. doi:10.1016/j.dyepig.2017.11.031
Wang, B., Chen, Y., Wu, Y., Weng, B., Liu, Y., and Li, C. M. (2016). Synthesis of nitrogen- and iron-containing carbon dots, and their application to colorimetric and fluorometric determination of dopamine. Microchim. Acta 183, 2491–2500. doi:10.1007/s00604-016-1885-5
Yadav, A. N., Bindra, J. K., Jakhar, N., and Singh, K. (2020). Switching-on superparamagnetism in diluted magnetic Fe(III) doped CdSe quantum dots. CrystEngComm 22, 1738–1745. doi:10.1039/C9CE01391A
Yang, W., Huang, T., Zhao, M., Luo, F., Weng, W., Wei, Q., et al. (2017). High peroxidase-like activity of iron and nitrogen co-doped carbon dots and its application in immunosorbent assay. Talanta 164, 1–6. doi:10.1016/j.talanta.2016.10.099
Yao, D., Li, C., Liang, A., and Jiang, Z. (2019). A facile SERS strategy for quantitative analysis of trace glucose coupling glucose oxidase and nanosilver catalytic oxidation of tetramethylbenzidine. Spectrochimica Acta A: Mol. Biomol. Spectrosc. 216, 146–153. doi:10.1016/j.saa.2019.03.026
Yarahmadi, S., Azadbakht, A., and Derikvand, R. M. (2019). Hybrid synthetic receptor composed of molecularly imprinted polydopamine and aptamers for impedimetric biosensing of urea. Microchim. Acta 186, 71. doi:10.1007/s00604-018-3180-0
You, L., Li, R., Dong, X., Wang, F., Guo, J., and Wang, C. (2017). Micron-sized surface enhanced Raman scattering reporter/fluorescence probe encoded colloidal microspheres for sensitive DNA detection. J. Colloid. Interf. Sci. 488, 109–117. doi:10.1016/j.jcis.2016.10.086
Yue, G., Li, S., Liu, W., Ding, F., Zou, P., Wang, X., et al. (2019). Ratiometric fluorescence based on silver clusters and N, Fe doped carbon dots for determination of H2O2 and UA: N, Fe doped carbon dots as mimetic peroxidase. Sensors Actuators B: Chem. 287, 408–415. doi:10.1016/j.snb.2019.02.060
Zhang, H., Zhang, B., Chen, A., and Qin, Y. (2017). Controllable n-Fe2O3@graphene nanomaterials by ALD applied in an aptasensor with enhanced electrochemical performance for thrombin detection. Dalton Trans. 46, 7434–7440. doi:10.1039/C7DT01184A
Zhang, L., Liang, P., Man, X., Wang, D., Huang, J., Shu, H., et al. (2019). Fe, N co-doped graphene as a multi-functional anchor material for lithium-sulfur battery. J. Phys. Chem. Sol. 126, 280–286. doi:10.1016/j.jpcs.2018.11.027
Zheng, M., Wang, C., Wang, Y., Wei, W., Ma, S., Sun, X., et al. (2018). Green synthesis of carbon dots functionalized silver nanoparticles for the colorimetric detection of phoxim. Talanta 185, 309–315. doi:10.1016/j.talanta.2018.03.066
Zhou, J., and Rossi, J. (2017). Aptamers as targeted therapeutics: current potential and challenges. Nat. Rev. Drug Discov. 16, 181–202. doi:10.1038/nrd.2016.199
Zhu, D., Zhuo, S., Zhu, C., Zhang, P., and Shen, W. (2019). Synthesis of catalytically active peroxidase-like Fe-doped carbon dots and application in ratiometric fluorescence detection of hydrogen peroxide and glucose. Anal. Methods 11, 2663–2668. doi:10.1039/C9AY00342H
Zhu, Y., Li, W., Tan, S., and Chen, T. (2018). A label-free and functional fluorescent oligonucleotide probe based on a G-quadruplex molecular beacon for the detection of kanamycin. Chem. Res. Chin. Univ. 34, 541–545. doi:10.1007/s40242-018-7366-0
Zhu, Y., Wang, Y., Zhou, B., Yu, J., Peng, L.-L., Huang, Y., et al. (2017). A multifunctional fluorescent aptamer probe for highly sensitive and selective detection of cadmium(II). Anal. Bioanal. Chem. 409, 4951–4958. doi:10.1007/s00216-017-0436-1
Zhuo, S., Guan, Y., Li, H., Fang, J., Zhang, P., Du, J., et al. (2019). Facile fabrication of fluorescent Fe-doped carbon quantum dots for dopamine sensing and bioimaging application. Analyst 144, 656–662. doi:10.1039/C8AN01741G
Keywords: Fe/N-doped carbon dots, catalysis amplification, aptamer, surface-enhanced Raman scattering, resonance Rayleigh scattering, fluorescence
Citation: Li C, Li J, Liang A, Wen G and Jiang Z (2021) Aptamer Turn-On SERS/RRS/Fluorescence Tri-mode Platform for Ultra-trace Urea Determination Using Fe/N-Doped Carbon Dots. Front. Chem. 9:613083. doi: 10.3389/fchem.2021.613083
Received: 01 October 2020; Accepted: 18 January 2021;
Published: 15 March 2021.
Edited by:
Ottavia Giuffrè, University of Messina, ItalyReviewed by:
Alessandro Paolini, Bambino Gesù Children Hospital (IRCCS), ItalyNisha Agarwal, Ontario Tech University, Canada
Copyright © 2021 Li, Li, Liang, Wen and Jiang. This is an open-access article distributed under the terms of the Creative Commons Attribution License (CC BY). The use, distribution or reproduction in other forums is permitted, provided the original author(s) and the copyright owner(s) are credited and that the original publication in this journal is cited, in accordance with accepted academic practice. No use, distribution or reproduction is permitted which does not comply with these terms.
*Correspondence: Guiqing Wen, Z3F3ZW5AZ3hudS5lZHUuY24=; Zhiliang Jiang, emxqaWFuZ0BtYWlsYm94Lmd4bnUuZWR1LmNu