 Peter Husen1
 Ilia A. Solov’yov2*
- 1Department of Physics, Chemistry and Pharmacy, University of Southern Denmark, Odense, Denmark
- 2Department of Physics, Carl von Ossietzky Universität Oldenburg, Oldenburg, Germany
Much of the metabolic molecular machinery responsible for energy transduction processes in living organisms revolves around a series of electron and proton transfer processes. The highly redox active enzymes can, however, also pose a risk of unwanted side reactions leading to reactive oxygen species, which are harmful to cells and are a factor in aging and age-related diseases. Using extensive quantum and classical computational modeling, we here show evidence of a particular superoxide production mechanism through stray reactions between molecular oxygen and a semiquinone reaction intermediate bound in the mitochondrial complex III of the electron transport chain, also known as the cytochrome
1 Introduction
The cytochrome
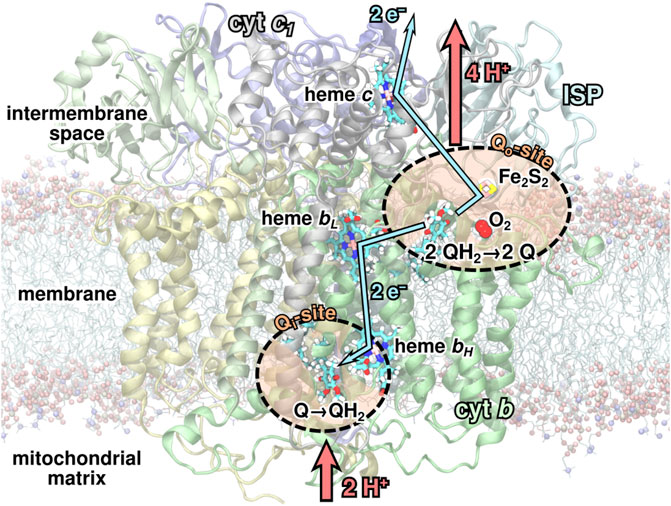
FIGURE 1. The
As part of the Q-cycle, an ubiquinol (QH2) molecule from the membrane is oxidized to ubiquinone (Q) in a bifurcated reaction at one of the two substrate binding sites, the Qo-site, of the
Earlier computational studies (Salo et al., 2017) have indicated two candidate mechanisms of superoxide production in the
and model II, in which the electron is instead transferred from the iron-sulfur cluster (Fe2S2) in the iron-sulfur protein (ISP) subunit of the
The two models are illustrated in Figure 2. The mechanism described in model II would appear to be prohibited due to the high midpoint redox potential of Fe2S2 and can essentially be ruled out from the experimental evidence (Sun and Trumpower, 2003; Bleier and Dröse, 2013). It has, however, been included in the present investigation for completeness, as the reaction is consistently observed in both earlier quantum chemical calculations (Salo et al., 2017) and new extended calculations presented here. The inclusion of this implausible reaction will serve as a test for the model and to shed light on the importance of the local environment, when modeling electron transfer processes.
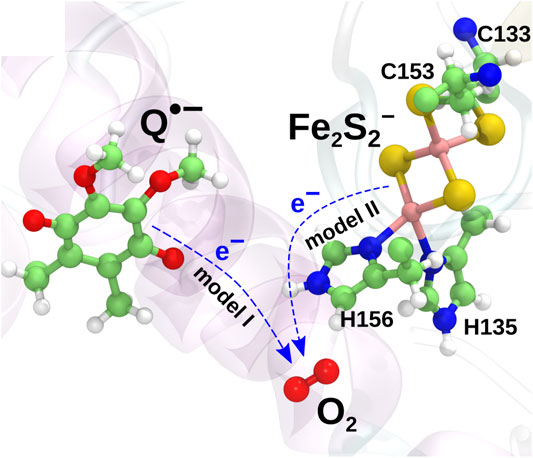
FIGURE 2. Two charge transfer mechanisms possibly leading to superoxide production. In model I, an electron is transferred from the radical semiquinone anion to the O2 molecule, oxidizing the semiquinone to a neutral quinone. In model II, an electron is instead transferred from Fe2S2− to O2 to yield a superoxide radical.
Studying complex biomolecular processes computationally generally require a range of computational modeling tools covering different time and length scales (Korol et al., 2020). The present work employs several computational modeling techniques at both the quantum and classical level to characterize the possible reactions leading to superoxide formation at the Qo-site of the
The protonation state of semiquinone at the Qo-site is debated (Pietras et al., 2016), and the choice of an anionic semiquinone in our model is based on the assumption that it would be the most reactive with oxygen, and some experimental indications exist of this form of semiquinone (Mulkidjanian, 2005; Cape et al., 2007). The anionic form is also interesting for superoxide production, as a proposed protective complex (Pietras et al., 2016; Bujnowicz et al., 2019) with a hydrogen bond between
The combined investigations include all levels of modeling of an important biomolecular process: Diffusion of O2, the quantum chemistry of electron transfer and the free energy budget of the complex protein-ligand enviroment of the hypothetical reaction. Experimental methods can only address the problem much more indirectly, so the details we can get out of modeling are essential to make sure we understand the mechanism and for this, the completeness of the model is essential to allow comparison with experiment.
2 Computational Methods
The computational protocols for the quantum chemical modeling and all-atom MD simulations employed in the present work are described in the following sections.
2.1 Quantum Chemical Calculations
The quantum chemical calculations followed the protocol of an earlier study (Salo et al., 2017), but with a significantly increased number of included snapshots to allow improved statistics following the aim of the present investigation. A total of 200 snapshots from an earlier MD simulation (Husen and Solov’yov, 2016) of the membrane embedded
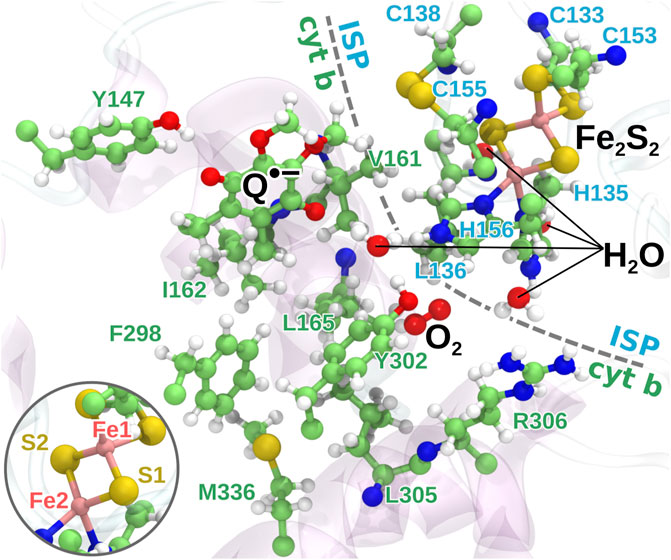
FIGURE 3. The quantum region used for QC calculations. The region consists of the head group of the semiquinone anion, the iron-sulfur cluster, 16 amino acid residues from the protein, the bound O2 molecule and four water molecules. The two iron atoms are modeled as having four and five unpaired electrons, respectively, with anti-parallel spin orientation between the two atoms as an initial guess for the QC calculations. Inset: the naming of the iron and sulfur atoms of Fe2S2 used in the model.
Quantum chemical geometry optimization calculations were carried out in Gaussian 09 (Frisch et al., 2013) using the CAM-B3LYP density functional theory method (Yanai et al., 2004) with the 6-31G basis set (Rassolov et al., 2001) on the extracted quantum region from each sampled MD snapshot. Backbone carbons of the amino acids as well as the carbon atom connecting the ring and the tail of
The relatively simple 6-31G basis set with no polarization or diffuse functions was chosen despite the inclusion of iron atoms in the model due to the size of the quantum region with a total of 263 atoms, which would have made the calculations unrealistic with a more advanced basis set. The 6-31G basis set has, however, been shown to be able to model the anti-ferromagnetic coupling in the Fe2S2-cluster (Szilagyi and Winslow, 2006) and the pKa of its coordinating histidine residues of the ISP (Barragan et al., 2015) correctly, indicating that a reasonable quantum model of the Fe2S2-cluster and its surroundings can be achieved using the basis set.
2.2 Molecular Dynamics Simulations
The MD simulation protocol from earlier studies (Barragan et al., 2015; Husen and Solov’yov, 2016) was adopted, such that equilibrated structures and simulated trajectories from those studies were employed for the further modeling and analysis in the present investigation. Briefly, the X-ray crystal structure of the
The system was solvated in a water box of
In the present study, the
The reactant state simulations (Husen and Solov’yov, 2016) included a concentration of molecular oxygen added initially to the water phase in the simulation box to study the dynamics O2 and identify its potential binding sites in the
The product state simulations were set up by choosing a simulation snapshot with a trapped O2 molecule in the binding pocket near Fe2S2 and modifying the atomic partial charges and force field parameters to model a product state according to model I and II, respectively, based on earlier parametrizations (Kaszuba et al., 2013; Husen and Solov’yov, 2016) of the involved molecular constituents in different redox states. In model I, the Qo-site was modeled with a neutral quinone and a negatively charged iron-sulfur cluster, while in model II, a semiquinone anion and a neutral Fe2S2 was assumed, as specified in Supplementary Table S1. In both cases, the bound O2 was changed to
MD simulations were performed using NAMD (Phillips et al., 2005) with the CHARMM 36 (MacKerell et al., 1998, MacKerell et al., 2004; Best et al., 2012) force field, and VMD (Humphrey et al., 1996) was used extensively for system construction, data analysis and visualization. The force field parameters and partial charges for the heme groups, iron-sulfur clusters and bound quinones and semiquinones were taken from an earlier study (Kaszuba et al., 2013; Postila et al., 2013), except for the partial charges of Fe2S2− and
2.3 Free Energy Perturbation Simulations
The free energy perturbation (FEP) simulations (Dixit and Chipot, 2001; Woo and Roux, 2005) follow the same protocol as the MD simulations described above, except that constant pressure, rather than constant volume, is employed in the simulations, and electrostatic interactions were modulated using the alchemical transformation method in NAMD. FEP transformations, where electrostatic interactions were gradually turned on or off through a coupling parameter, λ, were performed to measure the free energy change due to going from reactant to product state, when modeling the reactions in Eqs. 1, 2 for model I and II, respectively. The van der Waals and bonded interactions were assumed to be essentially unchanged after electron transfer, so the same force-field parameters were used for the product and reactant states, and the van der Waals and bonded interactions were kept fully coupled during the transformations, which simplifies the method considerably. The FEP transformations were carried out in two parts – first turning off electrostatic interactions in the reactant configuration with O2 bound at the binding pocket near Fe2S2, FEP1, and then turning the interactions back on in the product configuration with
where the “(0)” superscript indicates that all electrostatic interactions are turned off, equivalent to setting all partial charges of atoms to zero.
For model I, the part of the system undergoing the FEP transformation included
The ParseFEP plugin (Liu et al., 2012) of VMD was used to analyze the results of the FEP simulations and produce free energy curves using the Bennet acceptance ratio (BAR) estimator (Bennett, 1976) based on the combined results from forward and backward simulations.
3 Results and Discussion
The starting point of the present investigation was an earlier computational study (Husen and Solov’yov, 2016) of the dynamics and binding of molecular oxygen inside the
3.1 Quantum Chemical Modeling of the Qo-Site
A total of 200 snapshots from MD simulations with O2 trapped close to the Qo-site of the
In its ground state, O2 is a triplet diradical, and the two unpaired electrons were modeled in both spin up and spin down configurations, where the unpaired electrons of the iron atom Fe2 of the Fe2S2-cluster (see Figure 3) are considered as spin up. The calculations successfully converged for 127 and 114 snapshots, when modeled with O2 spin up and O2 spin down, respectively. After geometry optimization, a spontaneous electron transfer to the bound O2 molecule was observed in some, but not all cases: as can be seen in Figure 4A, the spin density of O2 is either 2 (no charge transfer) or 1 (charge transfer occurred) for the spin up case and −2 and −1, respectively, for the spin down case. The sign of the spin densities in Figure 4A indicate the spin orientation of the fragment, so it can e.g. be observed that the anti-parallel spin between the iron atoms of Fe2S2 is maintained after the QC geometry optimization.
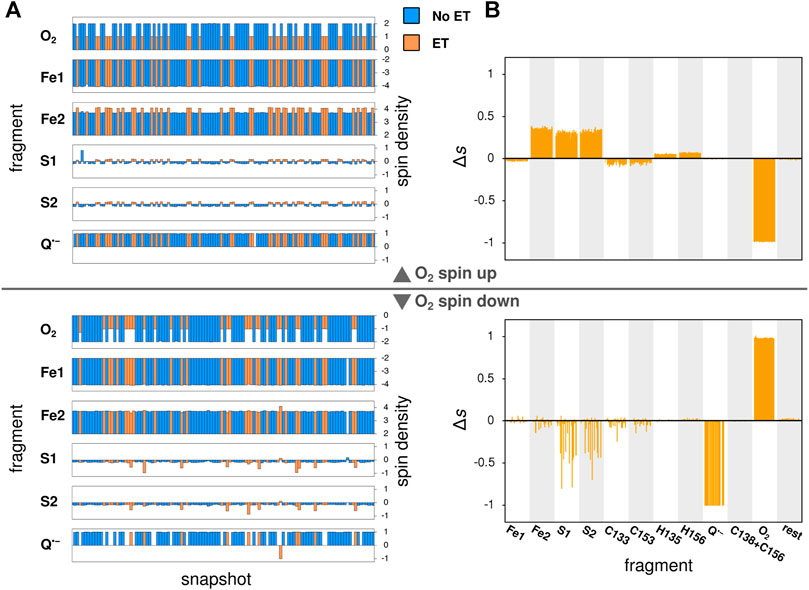
FIGURE 4. Local spin densities resulting from QC calculations on MD snapshots. (A) The local spin densities obtained from QC calculations on MD snapshots with O2 bound near the Qo-site. The snapshots where electron transfer to O2 has occurred, as determined by a change in O2 spin density, are indicated with orange color, while snapshots with no electron transfer are shown in blue. (B) The difference
To identify the source of the electron transferred to the O2 molecule, Figure 4B shows the difference in local spin density between each of the studied snapshots, where electron transfer to O2 was observed, and the average of all snapshots with no electron transfer, i.e. the quantity:
Here,
The distributions of total energies of the modeled Qo-site of the
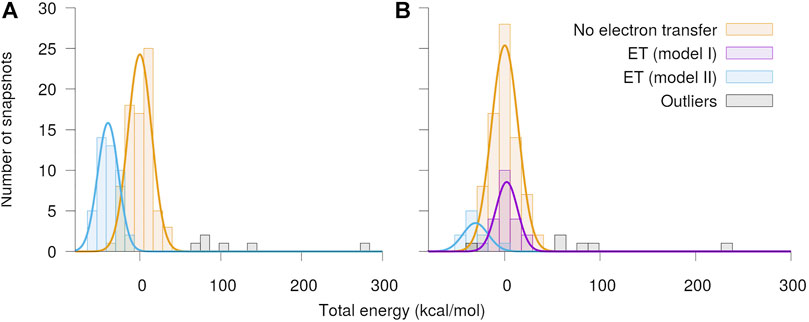
FIGURE 5. Distribution of total energy of the quantum region after QC geometry optimization. The calculations were performed separately with O2 assumed to be in the (A) spin up and (B) spin down state, respectively. The snapshots have been classified into cases with no electron transfer and electron transfer from either the semiquinone (model I) or the Fe2S2-cluster (model II) to O2. The energies are shown relative to the mean energy of the snapshots with no charge transfer.
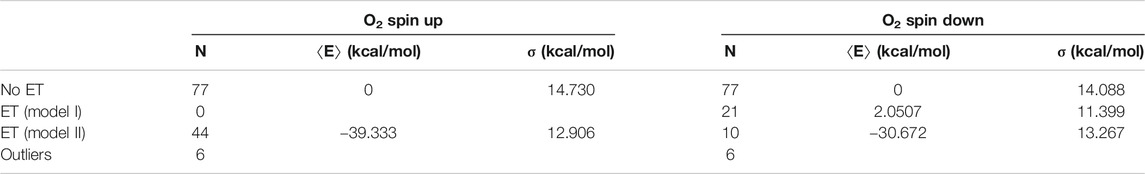
TABLE 1. Energy statistics from the QC geometry optimizations. The table shows the numbers N of snapshots along with mean energies
The size of the studied quantum region and the choice of basis set needed to be balanced due the high computational complexity of QC modeling methods. The modeled region was chosen with proximity to the O2 molecule bound near the Qo-site as the main criterion and matches the model studied in an earlier investigation (Salo et al., 2017). To assess the significance of the choice of cluster model on the results from QC modeling, all calculations were repeated using the same MD snapshots, but with the cluster model extended to include E295 from cytochrome b, which is likely to be an important interaction partner with QH2/
Aside from the redox states of the potential reaction partners at the Qo-site, the protonation of the bound semiquinone was also tracked in the extended quantum calculations to test for possible proton transfer back to
3.2 Unbinding of Superoxide
To study the binding and dynamics of superoxide after an electron transfer event at the Qo-site, a set of 100 MD simulations starting with
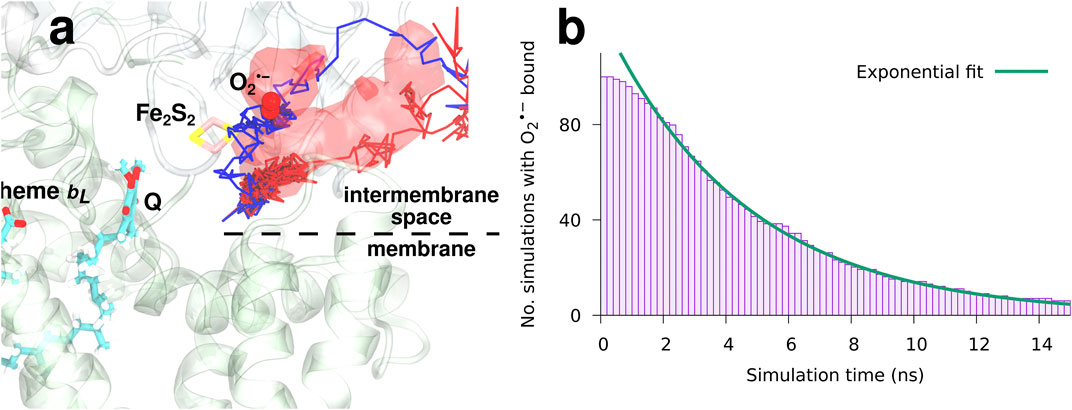
FIGURE 6. The dynamics and binding of a newly formed superoxide (model I).
The observed occupancy of
reveals a characteristic binding time of
3.3 Reorganization Energy From Classical MD Simulations
In order to construct free energy diagrams of possible electron transfer processes that could lead to superoxide production at the Qo-site of the
Figure 7 shows histograms of the energy difference
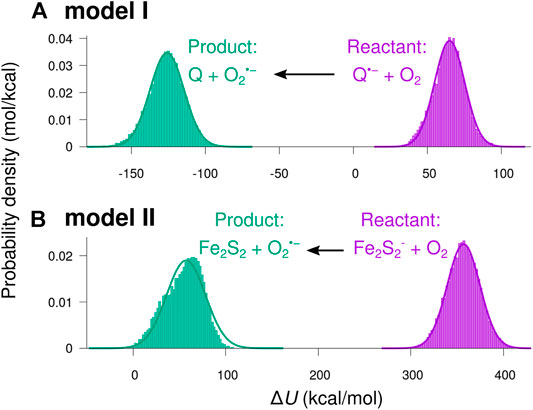
FIGURE 7. Distributions of the potential energy shift from reactant to product charge state. The potential energy difference
The smooth curves in Figure 7 indicate normal distributions based on the statistical mean values,
Except for a small skewness for the product state in model II, the sampled
The potential energy difference is a function of atomic coordinates alone and is therefore suitable as a reaction coordinate describing the mechanical reorganization accompanying the modeled electron transfer process (Miyashita and Go, 2000; Miyashita et al., 2003). By sampling
Assuming a normal distribution of
The resulting free energy curves for the studied electron transfer processes are depicted in Figure 8. The figure shows the free energy calculated from the sampled histograms in Figure 7 by using Eq. 9 with thick lines, while extrapolated parabolas obtained through Eq. 10 are shown with thin lines. The free energy of the product state was shifted to make the two curves intersect at
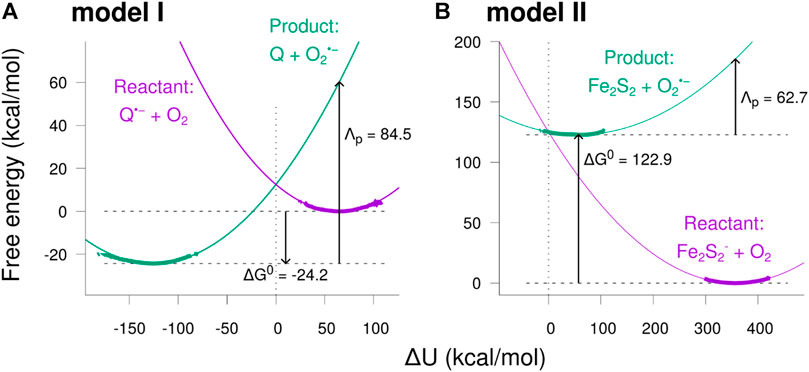
FIGURE 8. Free energy diagrams for the two model reactions. The free energy was calculated as a function of the potential energy shift
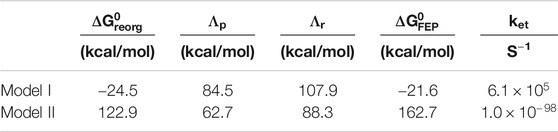
TABLE 2. Free energy parameters and estimated rates obtained from simulations.
The free energy diagrams in Figure 8 and the parameters
3.4 Free Energy Perturbation Calculations
Instead of connecting the product and reactant states in a single step, an alchemical free energy perturbation (Dixit and Chipot, 2001; Miyashita et al., 2003) (FEP) approach was employed as a second attempt of identifying the free energy change due to an electron transfer to O2. In this approach, the electrostatic interactions involving O2/
Here,
The electron transfer from
3.5 Rate of Superoxide Production
The obtained free energy shifts and reorganization energies can be used to estimate the possible rates of the modeled electron transfer processes. Marcus theory (Marcus and Sutin, 1985; Miyashita et al., 2003) predicts the following form of the electron transfer rate constant:
where
where R is the edge-to-edge distance between donor and acceptor in Å, energies are assumed in eV, and the electron transfer rate is in inverse seconds. In the reactant state simulations, the distance between donor and acceptor in model I (the head group of
The estimated electron transfer rates correspond to the state, where semiquinone and O2 are simultaneously present at the Qo-site of the
where
This is a very rough order of magnitude estimate, as e.g. using instead the reorganization energy estimate from the reactant state,
4 Conclusion
Quantum chemical modeling confirmed earlier findings (Salo et al., 2017) of two main electron transfer processes leading to superoxide formation at the Qo-site of the
Data Availability Statement
The original contributions presented in the study are included in the article/Supplementary Material, further inquiries can be directed to the corresponding author.
Author Contributions
PH preformed the simulations, analyzed the data and prepared the figures. IS supervised the project. Both authors contributed in writing the manuscript.
Funding
The authors would like to thank the Independent Research Fund Denmark, the Volkswagen Foundation (Lichtenberg Professorship to IAS), the DFG, German Research Foundation, (GRK1885—Molecular Basis of Sensory Biology and SFB 1372—Magnetoreception and Navigation in Vertebrates) and the Ministry for science and culture of Lower Saxony (Simulations meet experiments on the nanoscale: Opening up the quantum world to artificial intelligence (SMART)). Computational resources for the simulations were provided by the DeiC National HPC Center, SDU, and the CARL Cluster at the Carl-von-Ossietzky University Oldenburg, which is supported by the DFG and the ministry for science and culture of Lower Saxony. The work was supported by the North-German Supercomputing Alliance (HLRN).
Conflict of Interest
The authors declare that the research was conducted in the absence of any commercial or financial relationships that could be construed as a potential conflict of interest.
Supplementary Material
The Supplementary Material for this article can be found online at: https://www.frontiersin.org/articles/10.3389/fchem.2021.643796/full#supplementary-material
References
Barragan, A. M., Crofts, A. R., Schulten, K., and Solov’yov, I. A. (2015). Identification of Ubiquinol Binding Motifs at the Qo-Site of the Cytochromebc1Complex. J. Phys. Chem. B. 119, 433–447. doi:10.1021/jp510022w
Barragan, A. M., Schulten, K., and Solov’yov, I. A. (2016). Mechanism of the Primary Charge Transfer Reaction in the Cytochrome bc1 Complex. J. Phys. Chem. B. 120, 11369–11380. doi:10.1021/acs.jpcb.6b07394
Barragan, A. M., Soudackov, A. V., Luthey-Schulten, Z., Hammes-Schiffer, S., Schulten, K., and Solov’yov, I. A. (2021). Theoretical Description of the Primary Proton-Coupled Electron Transfer Reaction in the Cytochrome Bc1 Complex. J. Am. Chem. Soc. 143, 715–723. doi:10.1021/jacs.0c07799
Bennett, C. H. (1976). Efficient Estimation of Free Energy Differences from Monte Carlo Data. J. Comp. Phy. 22, 245–268. doi:10.1016/0021-9991(76)90078-4
Berry, E. A., Huang, L.-S., Saechao, L. K., Pon, N. G., Valkova-Valchanova, M., and Daldal, F. (2004). X-Ray Structure of Rhodobacter Capsulatus Cytochrome bc1: Comparison with its Mitochondrial and Chloroplast Counterparts. Photosynth. Res. 81, 251–275. doi:10.1023/b:pres.0000036888.18223.0e
Best, R. B., Zhu, X., Shim, J., Lopes, P. E. M., Mittal, J., Feig, M., et al. (2012). Optimization of the Additive CHARMM All-Atom Protein Force Field Targeting Improved Sampling of the Backbone ϕ, ψ and Side-Chain χ1 and χ2 Dihedral Angles. J. Chem. Theory Comput. 8, 3257–3273. doi:10.1021/ct300400x
Bleier, L., and Dröse, S. (2013). Superoxide Generation by Complex Iii: from Mechanistic Rationales to Functional Consequences. Biochimi. Biophys. Acta. 1827, 1320–1331. doi:10.1016/j.bbabio.2012.12.002
Brand, M. D. (2010). The Sites and Topology of Mitochondrial Superoxide Production. Exp. Gerontol. 45, 466–472. doi:10.1016/j.exger.2010.01.003
Bujnowicz, Ł., Borek, A., Kuleta, P., Sarewicz, M., and Osyczka, A. (2019). Suppression of superoxide production by a spin‐spin coupling between semiquinone and the Rieske cluster in cytochrome bc 1. FEBS Lett. 593, 3–12. doi:10.1002/1873-3468.13296
Cape, J. L., Bowman, M. K., and Kramer, D. M. (2007). A semiquinone intermediate generated at the Qo site of the cytochrome bc1 complex: Importance for the Q-cycle and superoxide production. Proceed. Nation. Acad. Scie. 104, 7887–7892. doi:10.1073/pnas.0702621104
Catucci, L., De Leo, V., Milano, F., Giotta, L., Vitale, R., Agostiano, A., et al. (2012). Oxidoreductase activity of chromatophores and purified cytochrome bc 1 complex from Rhodobacter sphaeroides: a possible role of cardiolipin. J. Bioenerg. Biomembr. 44, 487–493. doi:10.1007/s10863-012-9447-y
Crofts, A. R., Barquera, B., Gennis, R. B., Kuras, R., Guergova-Kuras, M., and Berry, E. A. (1999). Mechanism of Ubiquinol Oxidation by thebc1Complex: Different Domains of the Quinol Binding Pocket and Their Role in the Mechanism and Binding of Inhibitors. Biochem. 38, 15807–15826. doi:10.1021/bi990962m
Crofts, A. R., Lhee, S., Crofts, S. B., Cheng, J., and Rose, S. (2006). Proton pumping in the bc1 complex: A new gating mechanism that prevents short circuits. Biochimica et Biophysica Acta (BBA) - Bioenergetics 1757, 1019–1034. doi:10.1016/j.bbabio.2006.02.009
Crofts, A. R., Rose, S. W., Burton, R. L., Desai, A. V., Kenis, P. J. A., and Dikanov, S. A. (2017). The Q-Cycle Mechanism of the bc1 Complex: A Biologist's Perspective on Atomistic Studies. J. Phys. Chem. B. 121, 3701–3717. doi:10.1021/acs.jpcb.6b10524
Crofts, A. R., Shinkarev, V. P., Kolling, D. R. J., and Hong, S. (2003). The Modified Q-cycle Explains the Apparent Mismatch between the Kinetics of Reduction of Cytochromes c 1 and b H in the bc 1 Complex. J. Bio. Chem. 278, 36191–36201. doi:10.1074/jbc.m305461200
Dixit, S. B., and Chipot, C. (2001). Can Absolute Free Energies of Association Be Estimated from Molecular Mechanical Simulations? The Biotin−Streptavidin System Revisited. J. Phys. Chem. A. 105, 9795–9799. doi:10.1021/jp011878v
Dröse, S., and Brandt, U. (2008). The Mechanism of Mitochondrial Superoxide Production by the Cytochrome bc1 Complex. J. Biol. Chem. 283, 21649–21654. doi:10.1074/jbc.M803236200
Frisch, M. J., Trucks, G. W., Schlegel, H. B., Scuseria, G. E., Robb, M. A., Cheeseman, J. R., et al. (2013). Gaussian 09 Citation. Wallingford, CT: Gaussian, Inc.
Guillaud, F., Dröse, S., Kowald, A., Brandt, U., and Klipp, E. (2014). Superoxide production by cytochrome bc1 complex: A mathematical model. Biochim. Biophy. Acta. 1837, 1643–1652. doi:10.1016/j.bbabio.2014.05.358
Humphrey, W., Dalke, A., and Schulten, K. (1996). VMD: Visual molecular dynamics. J. Mol. Grap. 14, 33–38. doi:10.1016/0263-7855(96)00018-5
Husen, P., Nielsen, C., Martino, C. F., and Solov’yov, I. A. (2019). Molecular Oxygen Binding in the Mitochondrial Electron Transfer Flavoprotein. J. Chem. Inf. Model. 59, 4868–4879. doi:10.1021/acs.jcim.9b00702
Husen, P., and Solov’yov, I. A. (2017). Mutations at the QoSite of the Cytochromebc1Complex Strongly Affect Oxygen Binding. J. Phys. Chem. B. 121, 3308–3317. doi:10.1021/acs.jpcb.6b08226
Husen, P., and Solov’yov, I. A. (2016). Spontaneous Binding of Molecular Oxygen at the Qo-Site of the bc1 Complex Could Stimulate Superoxide Formation. J. Am. Chem. Soc. 138, 12150–12158. doi:10.1021/jacs.6b04849
Kaszuba, K., Postila, P. A., Cramariuc, O., Sarewicz, M., Osyczka, A., Vattulainen, I., et al. (2013). Parameterization of the Prosthetic Redox Centers of the Bacterial Cytochrome Bc1 Complex for Atomistic Molecular Dynamics Simulations. Theor. Chem. Acc. 132, 1–13. doi:10.1007/s00214-013-1370-8
Korol, V., Husen, P., Sjulstok, E., Nielsen, C., Friis, I., Frederiksen, A., et al. (2020). Introducing Viking: A Novel Online Platform for Multiscale Modeling. ACS Omega 5, 1254–1260. doi:10.1021/acsomega.9b03802
LeBard, D. N., and Matyushov, D. V. (2010). Protein-water electrostatics and principles of bioenergetics. Phys. Chem. Chem. Phys. 12, 15335–15348. doi:10.1039/c0cp01004a
Lee, D.-W., El Khoury, Y., Francia, F., Zambelli, B., Ciurli, S., Venturoli, G., et al. (2011). Zinc Inhibition of Bacterial Cytochromebc1Reveals the Role of CytochromebE295 in Proton Release at the QoSite. Biochemistry 50, 4263–4272. doi:10.1021/bi200230e
Lhee, S., Kolling, D. R. J., Nair, S. K., Dikanov, S. A., and Crofts, A. R. (2010). Modifications of Protein Environment of the [2Fe-2S] Cluster of the bc1 Complex. J. Biol. Chem. 285, 9233–9248. doi:10.1074/jbc.m109.043505
Liu, P., Dehez, F., Cai, W., and Chipot, C. (2012). A Toolkit for the Analysis of Free-Energy Perturbation Calculations. J. Chem. Theory Comput. 8, 2606–2616. doi:10.1021/ct300242f
MacKerell, A. D., Feig, M., and Brooks, C. L. (2004). Extending the Treatment of Backbone Energetics in Protein Force Fields: Limitations of Gas-phase Quantum Mechanics in Reproducing Protein Conformational Distributions in Molecular Dynamics Simulations. J. Comput. Chem. 25, 1400–1415. doi:10.1002/jcc.20065
MacKerell, A. D., Bashford, D., Bellott, M., Dunbrack, R. L., Evanseck, J. D., Field, M. J., et al. (1998). All-Atom Empirical Potential for Molecular Modeling and Dynamics Studies of Proteins†. J. Phys. Chem. B. 102, 3586–3616. doi:10.1021/jp973084f
Marcus, R. A., and Sutin, N. (1985). Electron transfers in chemistry and biology. Biochimica et Biophysica Acta (BBA) - Review. Bioenerg. 811, 265–322. doi:10.1016/0304-4173(85)90014-x
Martin, D. R., LeBard, D. N., and Matyushov, D. V. (2013). Coulomb Soup of Bioenergetics: Electron Transfer in a Bacterial bc1 Complex. J. Phys. Chem. Lett. 4, 3602–3606. doi:10.1021/jz401910e
Martin, D. R., and Matyushov, D. V. (2012). Non-gaussian Statistics and Nanosecond Dynamics of Electrostatic Fluctuations Affecting Optical Transitions in Proteins. J. Phys. Chem. B. 116, 10294–10300. doi:10.1021/jp305757t
Matyushov, D. V. (2013). Protein Electron Transfer: Dynamics and Statistics. J. Chem. Phys. 139, 025102. doi:10.1063/1.4812788
Mitchell, P. (1975). The Protonmotive Q Cycle: a General Formulation. FEBS Lett. 59, 137–139. doi:10.1016/0014-5793(75)80359-0
Miyashita, O., and Go, N. (2000). Reorganization Energy of Protein Electron Transfer Reaction: Study with Structural and Frequency Signature. J. Phys. Chem. B. 104, 7516–7521. doi:10.1021/jp000865z
Miyashita, O., Okamura, M. Y., and Onuchic, J. N. (2003). Theoretical Understanding of the Interprotein Electron Transfer between Cytochrome c2 and the Photosynthetic Reaction Center. J. Phys. Chem. B. 107, 1230–1241. doi:10.1021/jp026753k
Moser, C., and Dutton, P. (1992). Engineering protein structure for electron transfer function in photosynthetic reaction centers. Biochimica et Biophysica Acta (BBA) - Bioenerg. 1101, 171–176. doi:10.1016/s0005-2728(05)80012-x
Moser, C. C., Keske, J. M., Warncke, K., Farid, R. S., and Dutton, P. L. (1992). Nature of Biological Electron Transfer. Nature 355, 796–802. doi:10.1038/355796a0
Mulkidjanian, A. Y. (2005). Ubiquinol oxidation in the cytochrome bc1 complex: Reaction mechanism and prevention of short-circuiting. Biochim. Biophy. Acta. 1709, 5–34. doi:10.1016/j.bbabio.2005.03.009
Page, C. C., Moser, C. C., Chen, X., and Dutton, P. L. (1999). Natural Engineering Principles of Electron Tunnelling in Biological Oxidation-Reduction. Nature 402, 47, 52. doi:10.1038/46972
Phillips, J. C., Braun, R., Wang, W., Gumbart, J., Tajkhorshid, E., Villa, E., et al. (2005). Scalable Molecular Dynamics with NAMD. J. Comput. Chem. 26, 1781–1802. doi:10.1002/jcc.20289
Pietras, R., Sarewicz, M., and Osyczka, A. (2016). Distinct Properties of Semiquinone Species Detected at the Ubiquinol Oxidation Q o Site of Cytochrome bc 1 and Their Mechanistic Implications. J. R. Soc. Interface. 13, 20160133. doi:10.1098/rsif.2016.0133
Postila, P. A., Kaszuba, K., Kuleta, P., Vattulainen, I., Sarewicz, M., Osyczka, A., et al. (2016). Atomistic Determinants of Co-enzyme Q Reduction at the Qi-Site of the Cytochrome Bc1 Complex. Sci. Rep. 6, 33607. doi:10.1038/srep33607
Postila, P. A., Kaszuba, K., Sarewicz, M., Osyczka, A., Vattulainen, I., and Róg, T. (2013). Key Role of Water in Proton Transfer at the Qo-Site of the Cytochrome bc1 Complex Predicted by Atomistic Molecular Dynamics Simulations. Biochimi. Biophy. Acta. 1827, 761–768. doi:10.1016/j.bbabio.2013.02.005
Quinlan, C. L., Gerencser, A. A., Treberg, J. R., and Brand, M. D. (2011). The Mechanism of Superoxide Production by the Antimycin-Inhibited Mitochondrial Q-Cycle. J. Biol. Chem. 286, 31361–31372. doi:10.1074/jbc.m111.267898
Rassolov, V. A., Ratner, M. A., Pople, J. A., Redfern, P. C., and Curtiss, L. A. (2001). 6-31g* Basis Set for Third-Row Atoms. J. Comput. Chem. 22, 976–984. doi:10.1002/jcc.1058
Rottenberg, H., Covian, R., and Trumpower, B. L. (2009). Membrane Potential Greatly Enhances Superoxide Generation by the Cytochrome bc1 Complex Reconstituted into Phospholipid Vesicles. J. Biol. Chem. 284, 19203–19210. doi:10.1074/jbc.m109.017376
Salo, A. B., Husen, P., and Solov’yov, I. A. (2017). Charge Transfer at the Qo-Site of the Cytochrome bc1 Complex Leads to Superoxide Production. J. Phys. Chem. B. 121, 1771–1782. doi:10.1021/acs.jpcb.6b10403
Sarewicz, M., Borek, A., Cieluch, E., Świerczek, M., and Osyczka, A. (2010). Discrimination between two possible reaction sequences that create potential risk of generation of deleterious radicals by cytochrome bc1. Biochim. Biophy. Acta (BBA) - Bioenergetics 1797, 1820–1827. doi:10.1016/j.bbabio.2010.07.005
Sun, J., and Trumpower, B. L. (2003). Superoxide Anion Generation by the Cytochrome Bc1 Complex. Archiv. Biochem. Biophy. 419, 198–206. doi:10.1016/j.abb.2003.08.028
Szilagyi, R. K., and Winslow, M. A. (2006). On the accuracy of density functional theory for iron-sulfur clusters. J. Comput. Chem. 27, 1385–1397. doi:10.1002/jcc.20449
Warshel, A. (1982). Dynamics of Reactions in Polar Solvents. Semiclassical Trajectory Studies of Electron-Transfer and Proton-Transfer Reactions. J. Phys. Chem. 86, 2218–2224. doi:10.1021/j100209a016
Woo, H.-J., and Roux, B. (2005). Calculation of absolute protein-ligand binding free energy from computer simulations. Proceedings of the National Academy of Sciences 102, 6825–6830. doi:10.1073/pnas.0409005102
Keywords: electron transfer, computational biophysics, molecular dynamics, superoxide, free energy perturbation, quantum chemical modeling, enzymes, proteins
Citation: Husen P and Solov’yov IA (2021) Modeling the Energy Landscape of Side Reactions in the Cytochrome bc1 Complex. Front. Chem. 9:643796. doi: 10.3389/fchem.2021.643796
Received: 18 December 2020; Accepted: 27 April 2021;
Published: 19 May 2021.
Edited by:
Vivek Sharma, University of Helsinki, FinlandReviewed by:
Andrei Pisliakov, University of Dundee, United KingdomWei-Chun Kao, University of Freiburg, Germany
Copyright © 2021 Husen and Solov’yov. This is an open-access article distributed under the terms of the Creative Commons Attribution License (CC BY). The use, distribution or reproduction in other forums is permitted, provided the original author(s) and the copyright owner(s) are credited and that the original publication in this journal is cited, in accordance with accepted academic practice. No use, distribution or reproduction is permitted which does not comply with these terms.
*Correspondence: Ilia A. Solov’yov, aWxpYS5zb2xvdnlvdkB1bmktb2xkZW5idXJnLmRl