 Paul C. M. Fossati
 Alain Chartier1
- 1DES–Service de Corrosion et du Comportement des Matériaux dans leur Environnement (SCCME), CEA Saclay, Université Paris Saclay, Gif-sur-Yvette, France
- 2Institut de Recherche sur les Céramiques (IRCer), CNRS UMR 7315, Université de Limoges, Centre Européen de la Céramique, Limoges, France
Some AX2 binary compounds with the fluorite structure (space group
1 Introduction
Superionic conductors are ionic solids that exhibit a very high ionic conductivity, close to that of their melt or comparable to that of a liquid electrolyte (Rice and Roth, 1972; Boyce and Huberman, 1979). The first materials undergoing a transition to a superionic state were documented in the 19th century (Faraday, 1849). Such a transition is now known in several compounds with the fluorite structure (Derrington et al., 1975). In the literature, this is referred to as the Faraday transition, Bredig transition, or diffuse transition because the change occurs over a finite temperature range instead of a single temperature. It corresponds to a second-order or class III superionic transition (O’Keeffe, 1976; Hull, 2004). Common examples are fluorides such as CaF2, SrF2, BaF2, or β-PbF2 (Lidiard, 1980), but also chlorides such as SrCl2 (Carr et al., 1978; Dixon, 1980; Gillan and Dixon, 1980; Fomin, 2021) or β-BaCl2 (Hull et al., 2011), or oxides such as Li2O (Fracchia et al., 1998; Goel et al., 2004), CeO2 (Klarbring et al., 2018), or UO2 (Hiernaut et al., 1993). It has also been demonstrated by simulations in more complex compounds such as actinides mixed oxides (U,Pu)O2 (Cooper et al., 2015; Takoukam-Takoundjou et al., 2020; Bathellier et al., 2021) (U,Th)O2 (Cooper et al., 2014a), or (Pu,Th)O2 (Galvin et al., 2016).
Besides the increased ionic conductivity, a known feature of the superionic transition is a peak in the constant-volume heat capacity CP(T) with a characteristic Λ shape (Goff et al., 1991). The cause for this is an increase in the enthalpy H(T) beyond what would be expected from the trend measured from the same materials at low temperatures (Naylor, 1945; Dworkin and Bredig (1963, 1968)). This has been commonly referred to as anomalous heat (Dworkin and Bredig, 1968; Szwarc, 1969). Coincidently, an anomalous increase in the lattice parameter of the materials can also be measured, or equivalently a Λ peak in the linear thermal expansion coefficient α(T) (Goff et al., 1991). Both peaks have their highest point at the same temperature for any given compound, which is conventionally taken as the superionic transition temperature TS.
The fluorite structure (space group
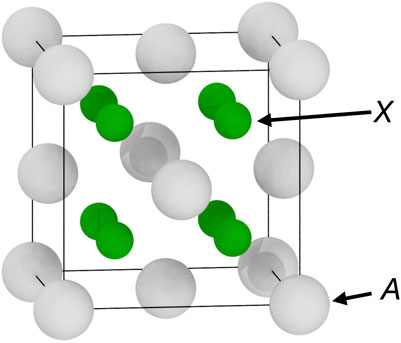
FIGURE 1. The fluorite structure (space group
Compounds with the fluorite structure have been very well studied for industrial applications (e.g. UO2, CeO2, yttria–stabilised zirconia), or because they are a simple model for ionic conductors (Hayes, 1974). Their tendency to behave as superionic conductors at high temperatures has been a particular area of interest since the 1970s. The nature of the high-temperature superionic phase in AX2 compounds with the fluorite structure is not fully explained yet, and conflicting interpretations exist. One of them is that high conductivity is the result of the availability of many crystalline sites for diffusion resulting from extensive Frenkel disorder and defects clustering on the X sublattice (Hutchings et al., 1984; Hull et al., 2011). Another view is that the superionic phase is the combination of a melted X sublattice and an A sublattice that retains its crystalline character, and thus the integrity of the material (Boyce et al., 1977; Castiglione and Madden, 2001). Recent works on the dynamical behaviour of the superionic phase of UO2 and Li2O seem to validate this description, showing string-like collective diffusion mechanisms otherwise common in supercooled liquids (Gray-Weale and Madden, 2004; Annamareddy and Eapen, 2017; Zhang et al., 2019). This interpretation is also strengthened by measurements of entropy changes during superionic transitions, which produced results consistent with some partial melting (O’Keeffe, 1976; Boyce et al., 1977).
In this work, we set out to investigate the structural aspects of the superionic transition in compounds with the fluorite structure. We aim to provide some insight on key structure changes happening at that transition and on the structural characteristics of the superionic phase. Molecular dynamics (MD) techniques have been recognised as a powerful tool for a very long time for the study of ionic conducting oxides (Catlow et al., 1978). It is particularly well-suited for this type of investigations that bridge thermodynamical properties and structural features. Indeed, its atomic-scale resolution makes accessible structure details such as point defects, local environments, or structure changes. This has resulted in a large collection of empirical potential that can be used to simulate a variety of compounds. Instead of focusing on one specific material, we considered a list of them for which successful potentials have been published. This way, we intend to describe phenomena that are characteristic of ionic compounds in the
Structures from MD simulations of superionic phases can be very difficult to analyse because of temperature-induced effects. This includes not only structural defects that form normally at high temperatures, such as Frenkel pairs, Schottky trios, or larger clusters, but also the resulting strain fields that distort the structure, and large thermal vibrations. All of this obscures the underlying structure of the materials and makes any structural analysis challenging. To overcome this, we employed computational diffraction techniques to generate virtual X-ray diffraction (XRD) patterns. These provide another way of characterising structural features that are difficult to describe otherwise, by showing structures in the reciprocal space that are not subject to the same perturbations as the atomic positions at high temperatures.
2 Methods
2.1 Empirical Potentials
We selected a broad range of empirical potentials that have been designed to simulate crystals with the fluorite structure. Thanks to the sustained interest for AX2 materials with the
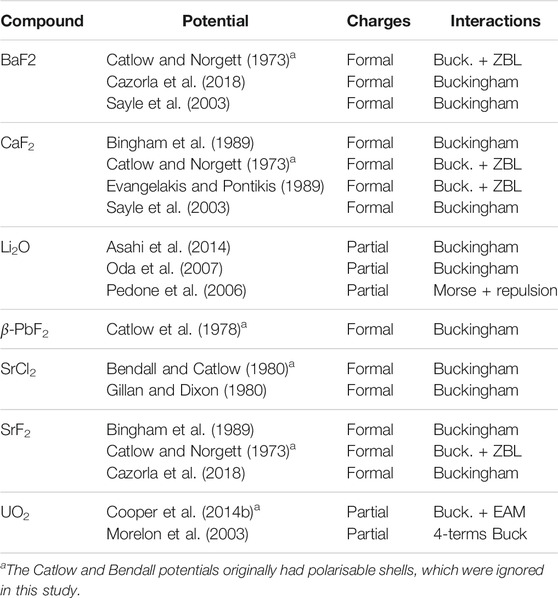
TABLE 1. Empirical potentials used in this study.
The seven selected compounds include some variety in the properties of both A and X ions. The X ions were Li, F, Cl, or O, having electric charges of respectively +1, −1,−1, and−2. The ions on the A sublattice were O, Ca, Sr, Ba, Pb, or U with masses ranging from 16 u to 238 u, and with
In some instances, several potentials were proposed in the original references. This is the case for the Catlow potential for BaF2, CaF2, and SrF2, and the Oda potential for Li2O. For the Catlow potential, we chose the first model of the three proposed. The difference between the first and second model is only a different set of parameter for the core-shell interactions, and the third model showed less accurate lattice parameters at higher temperatures in preliminary simulations. For the Oda potential for Li2O, we selected the FIT-GGA parameters, which offered the most accurate thermal expansion and melting point.
All the potentials we used predicted the
Some of the potentials were designed with polarisable core-shell models to improve dielectric properties and elastic constants. However, the shell models tested tended to show instabilities and large fluctuations of the thermodynamical properties at high temperatures. We therefore ignored core-shell interactions when using these potentials, and considered only rigid ions. This should not affect the structure at low temperatures because of the way the interactions were fitted. In fact, the first step in the potential design process was to adjust the pair interactions to reproduce the structure correctly (Catlow and Norgett, 1973). Adjusting the parameters for the shell models was done in a following step, to improve dielectric constants. In any case, these potentials were not intended to reproduce very disordered structures or melts, therefore they should not be less accurate in principle than other, rigid-ions only potentials at high temperatures.
In addition, the Catlow potentials for BaF2, CaF2, and SrF2, as well as the Evangelakis potential for CaF2 showed some instability at high temperatures, due to the relatively low energy barrier in their F–F Buckingham interactions. To avoid issues during the simulations with ions falling in the Buckingham singularity at short separation distances, a Ziegler-Biersack-Littmark (ZBL) contribution was added (Ziegler et al., 1985). We used the switching scheme implemented in LAMMPS with an outer radius of 2.0 Å and inner radii of 1.5 Å and 1.6 Å for the Catlow and Evangelakis potentials respectively. The Catlow potential for α-PbF2 was derived independently and did not suffer from the same issue, and was therefore not modified.
Considering this diversity of compounds and potentials, it is expected to see some variance in the properties and structures of each specific material depending on the potential used. However, this diversity is also expected to limit any bias in our results by separating effects shown with only some of the potentials from common features independent of potentials details. Our intent was to identify features and qualitative behaviour universal in crystals with the
2.2 Molecular Dynamics Simulations
The input structures for the MD simulations were 10 × 10 × 10 supercells of the conventional
Equilibrium MD calculations were carried out from room temperature to the temperature at which only liquid phases were observed. This upper bound for the temperature range depends on both composition and potential. To sample these ranges similarly for each potentials, 50 evenly-spaced temperatures were selected in each case. The code used was LAMMPS (Plimpton, 1995), with both temperature and pressure controlled by the time-reversible Tuckerman integrator (Tuckerman et al., 2006) based on the Nosé-Hoover (Nosé, 1984) method and the Parrinello-Rahman strain energy (Parrinello and Rahman, 1981). When structure optimisation was useful, it was done by minimising the potential energy of the structure whilst keeping the simulation box fixed, using the implementation of the Broyden—Fletcher—Goldfarb—Shanno (BFGS) algorithm from the L-BFGS library (Byrd et al., 1995).
Each simulation consisted of a several successive relaxation steps. The first one was a constant-temperature, fixed-volume (NVT) equilibration for 10 ps in order to thermalise the simulation box. This was followed by a fixed-temperature and room-pressure (NPT) equilibration for 240 ps, during which the average box lengths were calculated. Both cell size and shape were allowed to fluctuate during this step in order to avoid constraining the relaxation process. Although the box shape could change during this step, it remained very close to cubic on average except in simulations of liquids. Then, the box shape was fixed to match the average shape calculated during the NPT step. Following this, each supercell underwent a last NVT relaxation for 10 ps. Finally, data was accumulated over a 20 ps simulation at constant volume and energy (NVE). The time step for all these simulations was 1 fs, and the damping time for the thermostat and barostat were 0.01 and 0.5 ps respectively. The enthalpy H(T) was determined for each temperature T in K by taking its average over the NVE runs. The constant-pressure heat capacity CP(T) was then determined by differentiating the enthalpy
This was done numerically using a second-order centred finite difference scheme. The lattice parameter a(T) was calculated by taking the average of the box size along the x, y, and z axes and dividing it by 10, the number of conventional cells along each direction. The linear thermal expansion coefficient
was calculated using the measured lattice parameter, with the same numerical scheme employed to calculate CP(T). Eq. 2 was used instead of the equivalent and more common expression
Diffusion being an important aspect of the superionic transition, we also calculated diffusion coefficients from the MD simulations. This was done by using the Einstein relation
where t is the simulation time, and u is the atomic displacement. The mean squared displacements ⟨|u(t)|2⟩ were calculated for both A and X species separately, to produce specific diffusion coefficients.
Point defects are an important structural feature at high temperatures. Since they play an important role in diffusion and have been linked to the onset of the superionic transition (Hiernaut et al., 1993), it is useful to be able to determine how common they are. Given that the structure considered here are stoichiometric to ensure electric charge neutrality and that the number of atoms is fixed and does not change over the course of a simulation, the only possible defects are Frenkel pairs, where an ion leaves its initial lattice site to form an interstitial elsewhere in the crystal. Counting the number of Frenkel pairs requires counting either the number of vacancies or the number of interstitials. We did so by mapping each ion in structures of interest taken from MD simulations to a reference crystal, which was a
We performed additional structure analysis using the polyhedral template matching (PTM) (Larsen et al., 2016) technique implemented in Ovito (Stukowski, 2010). This method assigns a kind of symmetry environment to each atom by comparing the relative positions of its neighbours to reference polyhedra for prototype structures such as simple cubic, hexagonal close packed, body-centred cubic, or face-centred cubic. This was used to show the structural disorder across the superionic transition. The RMSD cutoff for the PTM analysis was set to 0.5 for all structures.
2.3 Diffraction Patterns
Powder diffraction patterns were generated using the Debyer code, which implements the Debye scattering equations (Farrow and Billinge, 2009; Wojdyr, (https://github.com/wojdyr/debyer)). We use the copper Kα1 wavelength λ = 1.54056 Å for these calculations. In order to increase the signal-to-noise ratio, the 12 ,000-atom fluorite cells were first duplicated 7 times in all three directions, resulting in 4,116 000-atoms supercells. To investigate separately the structures of the A and X sublattices, additional supercells were set up by copying the full supercells and then removing either the cations or the anions. Thus, for each simulation we calculated a full pattern accounting for all the atoms, plus partial patterns representing respectively the structures of the A and X sublattices. A sinc damping function was applied to the radial distribution functions. This, in combination with the supercells, is helpful to limit artefacts from the Fourier transform, which would otherwise be large if the 12 ,000-atoms boxes had been used instead. We set the cutoffs for the Fourier transforms to less than one half of the lengths of the supercells. The intensity was finally plotted in powder XRD patterns as a function of the scattering angle 2θ.
Two-dimensional single crystal diffraction patterns were generated using the approach described in (Jin et al., 2020). So called reciprocal space maps (RSMs) were computed in the HHL planes, where H and L are non-integer multiples of the reciprocal lattice unit cell of a given fluorite structure
In order to quantify the intensities of the different reflections observed in the RSMs, line scans (with a 0.2 width in HKL units) were first extracted from the 2D data. These scans were further modelled with pseudo -Voigt functions— i.e. a linear superposition of a Gaussian and a Lorentzian function—to represent the Bragg peaks, an asymmetrical Gaussian function to represent the isotropic diffuse scattering and an additional linear background. The intensities were obtained after a conventional least-square fitting of the model to the 1D scans.
3 Results and Discussion
3.1 Thermodynamical Properties
As a first step, the general behaviour of the potentials was assessed by calculating their thermodynamical properties as a function of temperature: enthalpy H, constant-volume heat capacity CP, and thermal expansion coefficient α. These were used to verify that all potentials predicted a superionic transition for their compound, and to estimate the transition temperature TS.
Some room-temperature properties calculated using the empirical potentials are shown in table 2. The constant-pressure heat capacities are very similar across the potentials, and close to the value expected from the Dulong–Petit law of 2.59 ⋅ 10–4 eV/(atom K). This indicates a strong harmonic behaviour from all the potentials, consistently with experimental observations. The main discrepancy with experiments is with Li2O, which has a significantly smaller heat capacity. The linear thermal expansion coefficient is more potential-dependent than the heat capacity. In general, the models tend to over-estimate α, sometimes significantly. For example, the Cazorla and Sayle potentials for BaF2, as well as the Bingham and Sayle potentials for CaF2, the Gillan potential for SrCl2, and the Bingham potential for SrF2 have errors between 40 and 50%. This is not surprising, considering that α is very sensitive to the details of the potentials, and that the parameters are almost never fitted to it. Overall, the values for both CP and α show that all the potentials behave well at room temperature, even though some are more accurate than others for these properties.
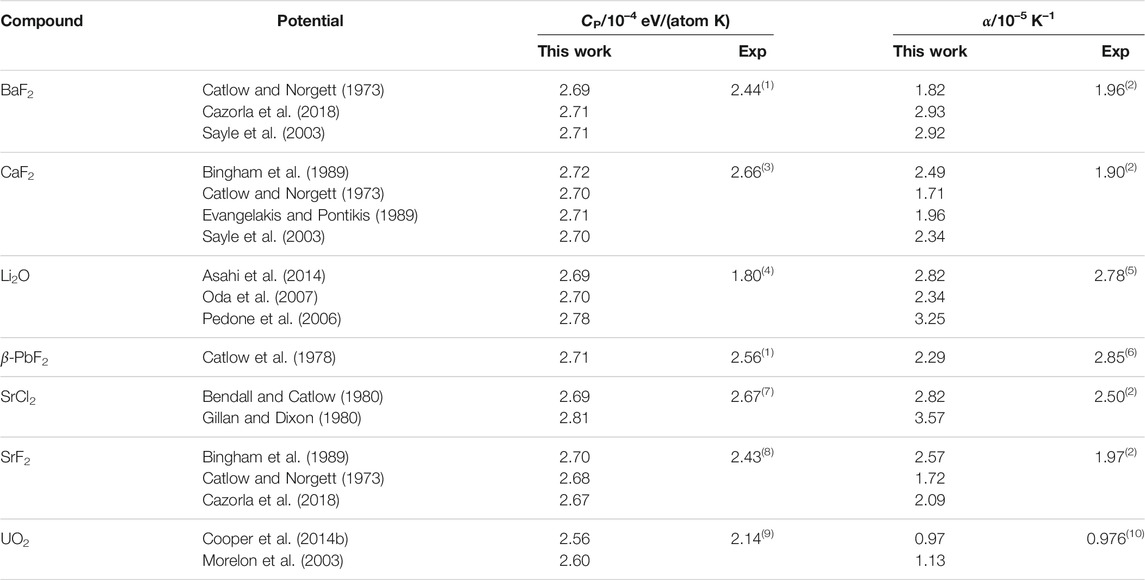
TABLE 2. Thermophysical properties at room temperature for the different potentials, compared to experimental references: (1) Wicks and Block (1963); (2) Roberts and White (1986); (3) Dworkin and Bredig (1968); (4) Johnston and Bauer (1951); (5) Hull et al. (1988); (6) Popov et al. (2017); (7) Schröter and Nölting (1980); (8) Smith et al. (1963); (9) Pavlov et al. (2017); (10) Martin (1988).
The simulation were performed in a temperature range from 300 K to the temperature TM at which the initial crystal turned into a liquid. This transition does not correspond to the experimental melting point Tm, and is in general higher as shown in Table 2. By definition, the melting point measured experimentally is the temperature at which the liquid becomes thermodynamically more favourable than the crystal. However, this does not mean that the crystal is strictly unstable: it can be metastable instead and require climbing a non-negligible energy barrier to melt. The small length-scale and short times considered in our simulations inhibits nucleation of a liquid phase, which is the first step of a usual melting transition, by preventing the structure from climbing that energy barrier. The solid to liquid transition we observe is more analogous to a mechanical melting mechanism, and indicate the temperature at which the crystal becomes unstable rather than metastable (Wang et al., 1997). Other methods, such as the so-called moving interface technique (Morris et al., 1994), would be required to measure the thermodynamical melting points Tm accurately. For this reason and to avoid confusion, the thermodynamical (experimental) and mechanical melting points will be noted Tm and TM respectively throughout this article.
The most visible manifestation of the superionic transition from an experimental point of view is the Λ-shaped peak in CP, or equivalently the inflection point in the enthalpy H(T). Such peaks have been reported for several fluoride (Hull, 2004), chloride (Schröter and Nölting, 1980; Hull et al., 2011), and oxide (Ralph, 1987) compounds with the
i) a low-temperature regime, in which the heat capacity varies slowly as a polynomial;
ii) an exponential increase leading to the top of the Λ peak and the superionic transition, attributed to the formation of Frenkel defects (Szwarc, 1969);
iii) a decrease forming the right-side of the Λ peak;
iv) a high-temperature regime in which Cp varies slowly, leading to TM.
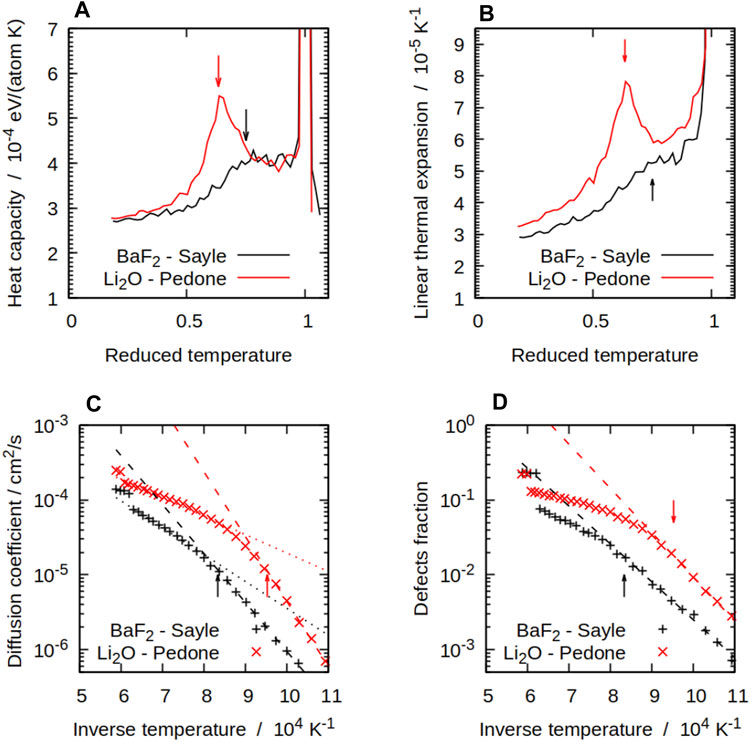
FIGURE 2. Some thermodynamical and structural properties of compounds with the
Some potentials show only some of these features. For instance, regime (i) can be very short for potentials with a low superionic transition temperature. The potential in which the CP peak is not visible would not have a clear stage (iii), instead going directly from (ii) to (iv). For the potentials that show all four stages, the CP peak is the simplest way of measuring the superionic transition temperature TS, which is by convention the temperature corresponding to the top of the peak. This is naturally more difficult to measure for potentials that show a plateau or no peak at all.
The potentials show significant variation in their predictions for TS, with differences of ∼300 K between the lowest and highest values for each compound. This highlights the variety of purposes for which the potentials were designed. More recent potentials tend to be more accurate, presumably thanks to more sophisticated potentials fitting techniques. Potentials that were intended to reproduce the superionic transition, such as Oda for Li2O, are unsurprisingly the most accurate. Overall, the trend across materials is reproduced, with SrCl2 and UO2 having respectively a lower and a higher TS on average compared to the other materials. The main outlier is the Catlow potential for β-PbF2, which overestimates TS by 700 K. However, few other potentials are available for this compound, which makes the discussion of any potential-dependent effect difficult. It should also be noted that Pb2+ ions in PbF2 are quite polarisable, which could point to a limitation of the rigid ions models to simulate this material. This point has been made in the literature (Castiglione and Madden, 2001), where calculations were done using shell models, with results closer to experimental references. The mechanical melting temperatures TM are not available experimentally, therefore those obtained from our simulations cannot be compared directly with references. We could still verify that they were greater than the reported melting temperatures Tm for each compound.
The transition temperature TS has been linked to the melting point Tm. The values for both TS and TM from our simulations are summarised in Table 3 and compared with experimental values. There is some variation across potentials, but overall there is a qualitative agreement for TS, i.e. compounds with a high transition temperature experimentally also tend to have higher values using empirical potentials. It has been reported that the
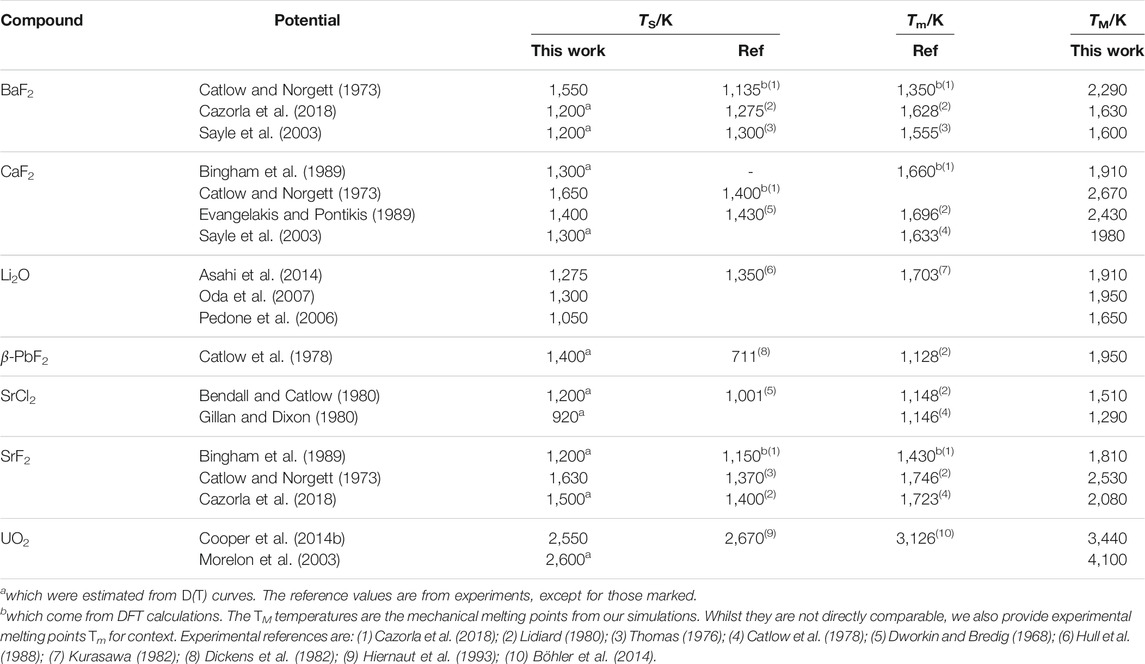
TABLE 3. Superionic transition temperatures TS for the different potentials, compared to experimental references. Superionic transition temperatures were calculated from CP(T) curves, except for those marked.
3.2 Point Defects and Diffusion
We calculated the fraction of point defects as a function of temperature for each potential. In general, we found as expected that the fraction of A defects was negligible in most of the considered temperature ranges (Catlow and Norgett (1973)). In all cases, the number of A Frenkel pairs just below TM was still two orders of magnitude smaller than that of X defects. No defect at all could be seen on the A sublattice for temperatures lower than about 100 K below TS, therefore they will be ignored and the following discussion is focused on the X defects.
Populations of X defects were significant at higher temperatures with all the potentials we considered. Figure 2D shows this for both BaF2 and Li2O with the Sayle and Pedone potentials respectively. The simulations showed a pattern with a transition from a low-temperature Arrhenius regime, in which the X defect fractions takes the form
where Hf is the formation enthalpy of an X Frenkel pair, to a high-temperature regime in which the number of defects grows with a smaller effective formation energy. The effective formation enthalpy below the superionic transition Hf is shown for all potentials in Table 4. The difference between both regimes and the inflection point can be seen in Figure 2D. The TS temperature marks the start of the deviation of the number of defects calculated from MD form its low-temperature fit. This links the change in defect properties to the onset of the superionic transition. The same pattern was observed for all potentials, with some variation in the magnitude of the transition. In general, potentials showing a sharp CP peak also had a large difference between the low-temperature and high-temperature behaviours. On the other hand, in cases such as SrCl2 with the Gillan potential, the transition is not very noticeable and there is not a large difference between both regimes. At low temperatures, Equation 4 can be fitted to data from the MD simulations to estimate the formation energy of X Frenkel pairs. Formation enthalpies for X Frenkel pairs for all the considered potential are summarised in Table 4. In general, the empirical potentials are in qualitative agreement with available references and their formation enthalpies fall within the range of experimental values. Notable outliers are the Catlow and Cooper potentials for BaF2 and UO2, which significantly over-estimate Hf, and Pedone for Li2O, which under-estimate it. Beyond the superionic transition, the X sublattice is expected to be highly disordered. However, defects are detected using the
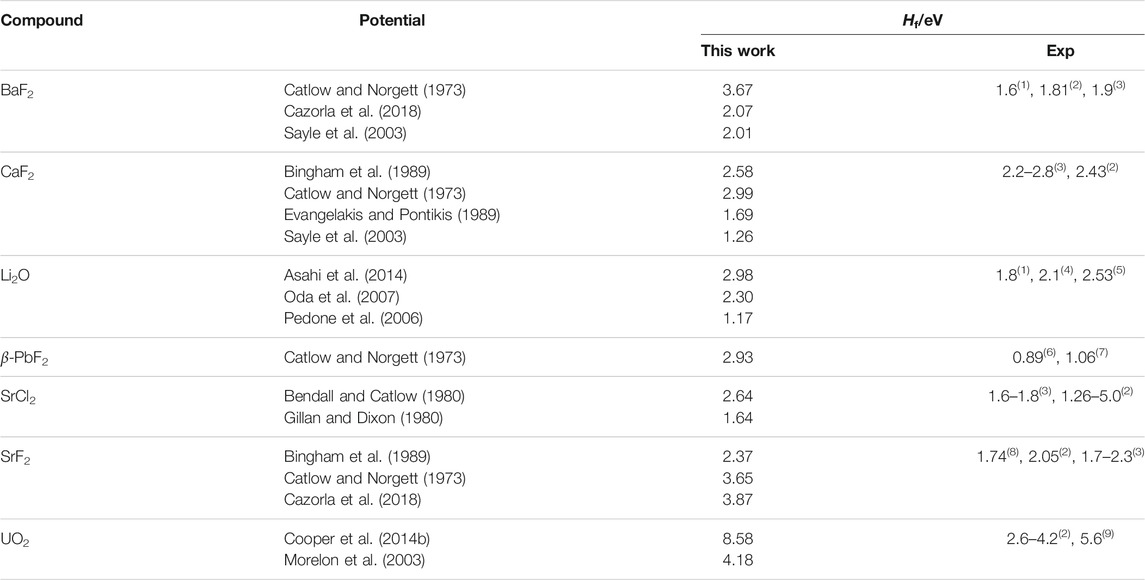
TABLE 4. Formation enthalpies for X Frenkel pairs in the fluorite structures (Hf). Experimental references are: (1) Lorger et al. (2019); (2) Bollmann (1980); (3) Lidiard (1974); (4) Farley et al. (1991); (5) Chadwick et al. (1988); (6) Samara (1979); (7) Boyce et al. (1977); (8) Bollmann et al. (1970); (9) Matzke (1987).
Crystals in the
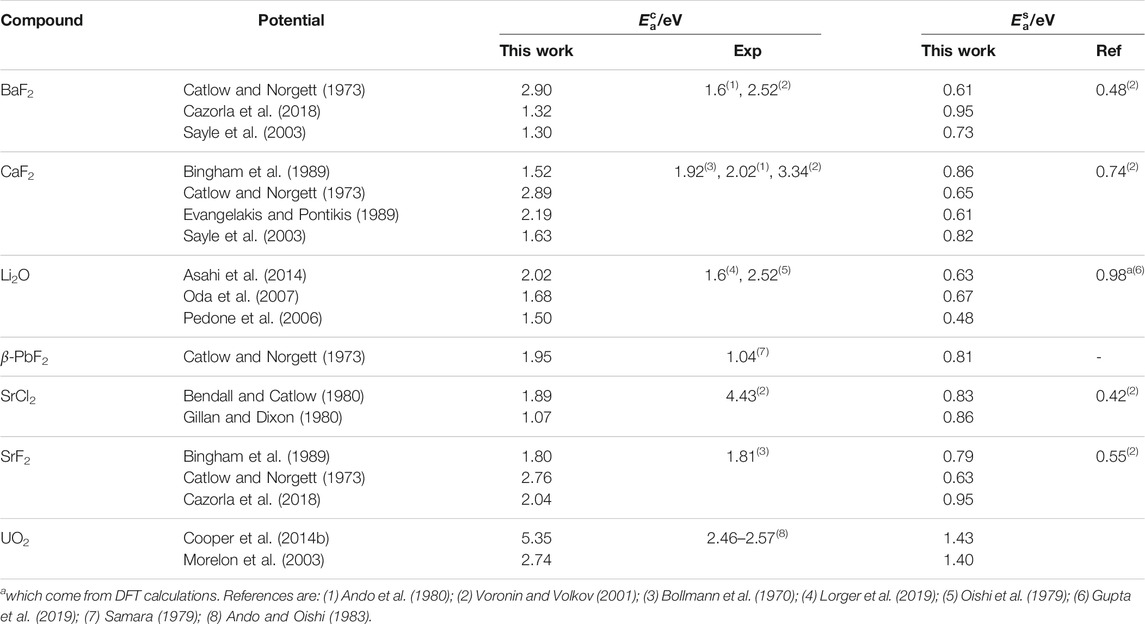
TABLE 5. Activation energies for the X diffusion process in both the perfect fluorite phase (
The activation energies in the
The fact that all potentials showed two different regimes for diffusion of the X chemical species regardless of the presence of a peak in CP and α confirms that the superionic transition can hapen without resulting in Λ peaks. This means that it is not inconceivable that such a transition could also happen without Λ peak in real materials. In fact, there are reports of this in SrCl2 (Dent et al., 2004).
3.3 Simulated Powder XRD Patterns
As mentioned previously, the analysis of the structural evolution of AX2 fluorites with temperature by a direct analysis of the MD simulations proved very challenging, particularly in the superionic phases. An approach to avoid this issue is to visualise the information contained in MD cells in a more compact representation. This is for instance the case when considering the radial distribution functions (RDFs). In the present study we choose to compute powder XRD patterns, i.e., Fourier transforms of RDFs. They are more sensitive to long-range atomic order and its alteration (Debelle et al., 2014), and are therefore a very useful complement to real-space structure analysis. We illustrate our findings with the example of BaF2 with the Sayle empirical potential, bearing in mind that all conclusions drawn below are qualitatively valid for all the other potentials. This particular case was selected firstly because it exhibits XRD features common to all the composition–potential combinations investigated, with clearly visible temperature-dependent evolutions. It also has a plateau in CP and α instead of a Λ peak. It is hence both a representative example of all configurations investigated in this work, and a demonstration of a superionic transition without a Λ peak.
The evolution of powder XRD patterns as a function of temperature is illustrated in Figure 3 (2θ–T figure), considering all atoms in the MD cell (Figure 3A) and only the X sublattice (Figure 3B). We will refer to them as full-crystal XRD and X-only XRD patterns, respectively. Additionally, we report selected full XRD and X-only XRD patterns at two temperatures on Figure 4.
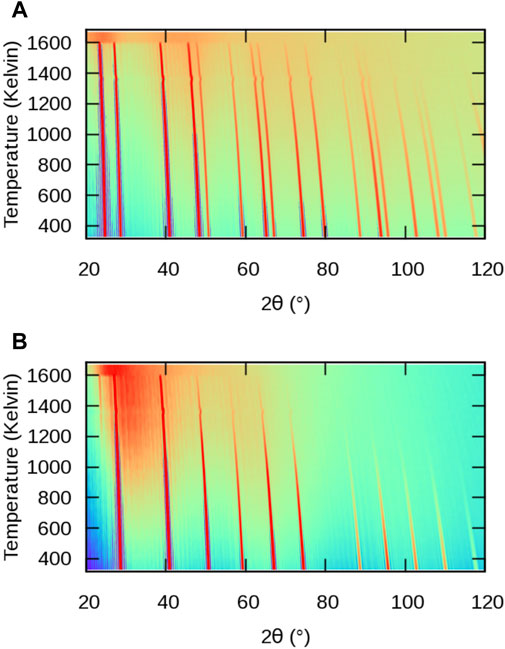
FIGURE 3. Simulated powder XRD patterns from MD simulations of BaF2 using the Sayle potential (Sayle et al., 2003) as a function of temperature: (A) full structure; (B) F sublattice only.
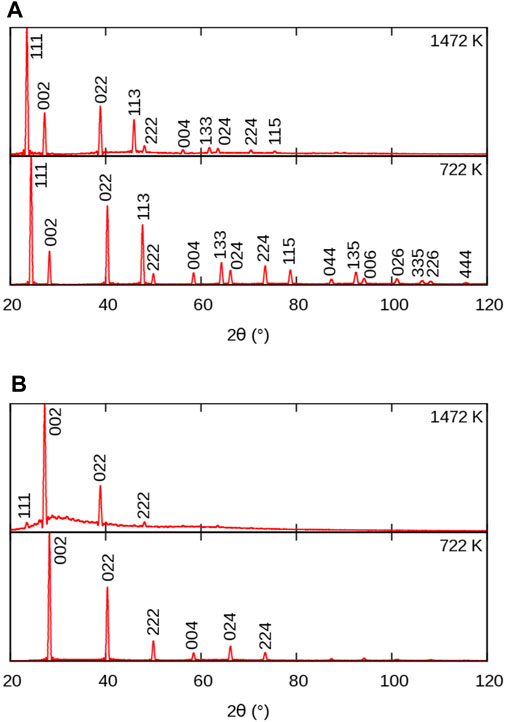
FIGURE 4. Simulated powder XRD patterns from MD simulations of BaF2 using the Sayle potential (Sayle et al., 2003), at temperatures below and above the superionic transition: (A) full crystal; (B) F sublattice only. Peak indices refer to the full
Let us first consider the full XRD patterns shown in Figures 3, 4 A. At 300 K, the characteristic peaks of the fluorite unit cell are clearly visible and can be indexed within the
ΔT being the temperature change.
The intensity of the peaks also decreases with increasing temperature, as a result of increasing local disorder, i.e. increasing thermal motion. The decrease in intensity is quantified by the Debye-Waller factor (Trueblood et al., 1996), which, in the case of harmonic and isotropic vibrations, is expressed by the simple expression
where u is the displacement of the atom from its regular lattice site. The effect of intensity damping is more pronounced at higher angles, as was the case for the peak shift.
Finally, it can be noticed that a background of diffuse scattering develops around the most intense peaks. The intensity of this background increases up to the melting point where only diffuse scattering remains, but with a significantly redistributed intensity. The origin of this diffuse scattering background lies in the presence of thermal motion also responsible for the above-mentioned intensity damping, but it can also reveal the presence of structural defects.
In all the cases we investigated, the A-specific pattern was virtually identical to the full-crystal pattern. For this reason, the A patterns will not be discussed here, but 2θ − T maps can be found int the Supplementary Material. The similarity between full-crystal and A-only patterns can be simply understood by considering the difference in atomic numbers Z between light elements constituting the X sublattice (F, Cl, O), as compared to the heavier elements occupying the A sublattice (Ca, Ba, Pb, U). The latter dominate the overall XRD signal the intensity of which is proportional to Z2, thus making the contribution from lighter elements fainter.
Let us now consider the X-only XRD patterns shown in Figures 3, 4 B. Besides the similar general features related to thermal expansion (peak shift) and thermal motion (decrease in intensity) there are two noticeable differences with the full-crystal patterns. The first difference is the positions and intensities of the peaks. This is easily explained by the fact that the X sublattice has a SC symmetry, as opposed to the FCC symmetry of the full fluorite structure. The lattice parameter of the SC sublattice is half of that of the overall
The second difference between X and full-crystal powder XRD patterns is the diffuse scattering background. Its intensity relative to the Bragg peaks is much higher, which indicates a much higher level of disorder on the X sublattice than on the A sublattice. The diffuse scattering is also more broadly distributed across the 2θ range, roughly centred around the 200 peak. This is a sign of the presence of amorphous or highly disordered local environments with a first neighbour distance approximately given by the X–X distance in the corresponding sublattice.
An additional 111 peak (or
3.4 Simulated Single-Crystal XRD Patterns
Single-crystal XRD provides another way of understanding the structural changes related to the superionic transition. Similarly to powder XRD, because it operates in the reciprocal space, it can reveal long-range features that are difficult to observe directly in simulation boxes due to thermal noise and increasing disorder at high temperatures. However, in contrast with powder XRD, there is no orientation averaging involved in the calculation. Hence, it is possible to precisely select definite regions of the reciprocal space to analyse. In order to be able to detect the appearance of superstructure peaks of the type 111, 113, etc., we computed the intensity distribution in (HHL) reciprocal lattice planes (that is, with a [1
We first briefly discuss the RSMs obtained from the A sublattice shown in Figures 5A–D. From room temperature up to TS, besides diffuse scattering concentrated around the Bragg peaks, no significant changes were observed. The peak coordinates have here been corrected for thermal expansion to allow for an easier comparison between different temperatures. At TM, a diffuse scattering halo characteristic of an amorphous structure is observed pointing to the melting of the material (Figure 5D). These observations lead to two important conclusions. Firstly, apart from the observed thermal diffuse scattering, the fact that the signal from the A sublattice remains constant throughout the process - with no visible peak shift, peak broadening or splitting, or additional diffuse scattering—seems to indicate that the A sublattice is free of structural defects. This is in stark contrast with the X sublattice, which we will discuss shortly. We also know from direct analysis of the MD simulations shown in Section 3.2 that these defects are rare up until TM. Secondly, the thermal diffuse scattering forms streaks along the main ⟨111⟩ directions, indicating that atomic displacements are more pronounced in the close-packed {111} planes. This is also consistent with the weak and inhomogeneous diffuse scattering observed in the powder XRD data.

FIGURE 5. Simulated reciprocal space maps from MD simulations of BaF2 using the Sayle potential (Sayle et al., 2003): (A–D) Ba sublattice; (E–H) F sublattice. In (F) the arrows indicate the
As far as thermal diffuse scattering is concerned, similar conclusions can be drawn for the X sublattice shown in Figures 5E–H. Diffuse scattering streaks appear along the {001} and {110} planes of the SC structure, pointing to enhanced thermal motion in the corresponding lattice planes. However, as soon as the temperature increases, major changes are observed on the X sublattice. The first difference is the appearance of weak intensity high-order 33L superstructure peaks (for instance at 722 K, indicated by the arrows on Figure 5F). The second noticeable difference is the increase of the diffuse scattering connecting the Bragg peaks, together with the appearance of a weak diffuse scattering halo with [002] radius, indicated on the figure by a dotted circle. The halo is barely visible in the RSM in this case, but it can be definitely detected by analysing line scans performed along the [111] direction (see also Figure 6). The RSMs of all cases investigated are given in the Supplementary Material. All of them exhibit the diffuse halo appearing almost concomitantly with the 33L peaks with varying intensity. In the superionic phase (Figure 5G, representing a structure at 1,472 K), additional 11L superstructure peaks are formed and the diffuse halo is now clearly visible. It should be noted that the apparent ellipsoidal shape of the halo is due to the partial superposition of the halo with the diffuse streaks along [110] and [001]. The 33L peaks are still visible, but their intensity decreases because thermal motion starts affecting high angle reflections. Finally, all Bragg peaks disappear at TM. Only the diffuse halo remains then, characteristic of an amorphous structure, in this case of the molten phase. All the potentials showed both the additional peaks and the diffuse halo. However, the relative intensity of these features is potential- or material-dependent. For instance, all the potential for Li2O showed a particularly intense diffuse halo, which is explained by the fact that the light element Li is significantly affected by thermal motion. Some potentials also produced fainter 33L and 11L peaks than others. All these features are visible in the animations, which can be found in the Supplementary Material.
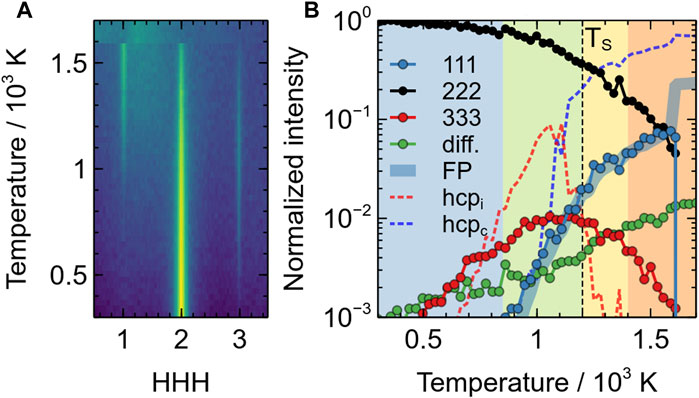
FIGURE 6. Evolution of the intensity of the additional single-crystal XRD peaks in the superionic phase of BaF2 using the Sayle potential: (A) evolution of the [111] intensity distribution as a function of temperature; (B) evolution of the 111 (blue circles), 222 (black circles), 333 (red circles) and diffuse scattering (green circles) peaks as a function of temperature. All intensities are on a logarithmic scale and normalised with respect to the room temperature of the 222 peak. Lines represent the evolutions of FP (thick blue), isolated HCP environments (red dotted) and clustered HCP environments (dotted blue). The different coloured areas correspond to the different regimes (i)–(iv) mentioned in the text.
This evolution is summarised in Figure 6, which depicts the changes of the [111] line scans and the different intensities with temperature. There, it can be clearly observed that the diffuse halo starts to appear at a temperature slightly higher than room temperature (∼ 400–500 K, green circles), hence pointing to thermal vibrations. It then steadily increases with temperature. The 333 peak appears almost concomitantly (∼ 500 K, red circles) and reaches a maximum close to TS. Around 850 K, the 111 peak starts to increase significantly (blue circles). This corresponds to the end of stage (i) and the beginning of stage (ii). The end of stage (ii), marking the superionic transition correspond to a temperature where the intensity of the 111 peak exhibit a change in slope and where the intensity of the 333 peak starts decreasing. Finally at TM, all intensities drop to 0 except the diffuse scattering, which remains constant.
This evolution is consistent with the powder XRD data, in particular the appearance of a 111 peak at TS and a broad diffuse scattering background in X-only patterns. However, because of the orientation averaging inherent in powder XRD and the consecutive peak overlap, it is not possible to detect low intensity details as those discussed here. Finally, the fact that the diffuse scattering steadily increases until the melting temperature without any discontinuity, reinforces the description of the X substructure as a liquid made in the literature. In the next section, we discuss the origin of the superstructure peaks.
3.5 Structure of the Superionic Phase
Visual examination of the structures during MD simulations at different temperatures reveals some structural changes. To highlight them, we extracted slices from supercells from MD simulations of BaF2 using the Sayle potential. The slices are 3 Å thick and centred on {100} atomic planes containing only F ions. At room temperature, the potential predicts a perfect
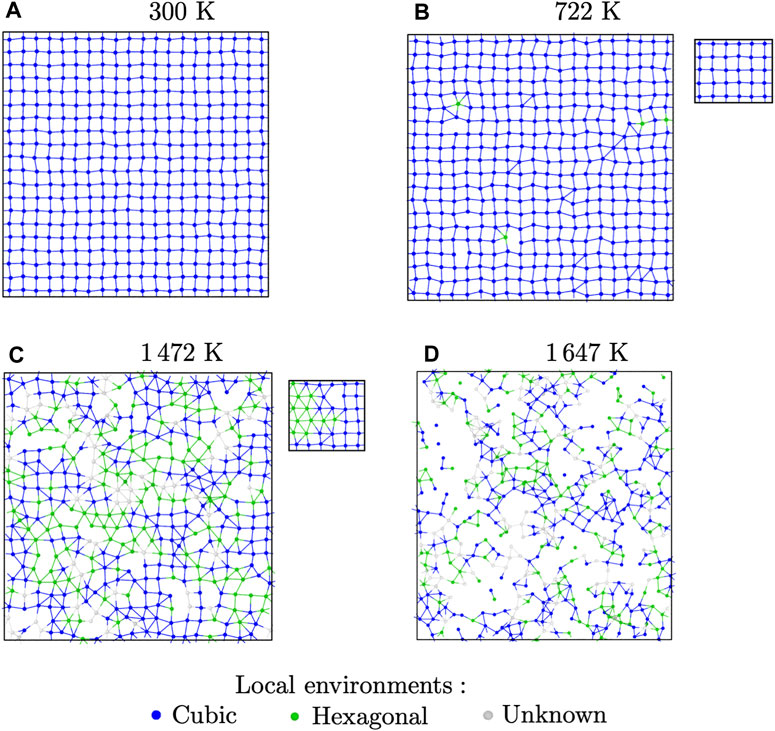
FIGURE 7. Slices showing (100) F atomic planes from MD relaxation of BaF2 with the Sayle potential at different temperatures, with Ba ions hidden for clarity: (A) room-temperature perfect crystal; (B) crystal with Frenkel defects; (C) superionic structure; (D) liquid. The colour code indicates the type of local environment according to the Polyhedral Template Matching analysis. The insets show the same slices after energy minimisation.
At intermediate temperatures, such as 722 K as in Figure 7B, some local distortions are visible, showing isolated triangular features. Visualisation of these features is helped by the use of the polyhedral template matching technique, which provides a characterisation of the local environment around each particle. At this temperature, almost all of the F ions are still in their ideal (SC) local environment. The closest matching structure for the ions with non-cubic local environments is HCP. The apparition of HCP local environments has been verified for all the potentials. With most of them, it coincides with the end of regime i and beginning of regime (ii). Most of the time, it also seemed to happen before Frenkel pairs were detected. However, this should be treated with caution. Indeed, the methods we used to count Frenkel pairs, though qualitatively accurate, can result in an under-estimation of the number of defects. On the other hand, the PTM analysis could also be too sensitive, resulting in false positives.
This changes around the superionic transition temperature TS. Indeed, in the superionic phase of regimes (iii) and (iv), we could see some clustering of the atoms with HCP environments, which were much more likely to be first neighbours. This is shown in Figure 7C, where we can see clusters of HCP environments mixed with cubic regions. This pattern holds until the mechanical melting point TM, after which the structure becomes liquid (Figure 7D).
The ions with unknown local environments are cases where the PTM algorithm could not decide how to categorise the particle. There are very few of them below TS. For example, in the case of BaF2 with the Sayle potential, they represent 5% of all F ions at the superionic transition. They are more prevalent in the superionic phase, but still amount to 13% at the mechanical melting point. They are much more present in the liquid phase, where the structure is not well-suited to the PTM analysis. These ions with disordered local environments are expected to contribute to the diffuse scattering observed in both powder and single-crystal diffraction patterns. The MD simulation boxes in the superionic phases also show that there can be a high degree of misorientation between the different types of local environments. This also contributes to the diffuse scattering.
This evolution of the number of ions with HCP local environments is plotted in Figure 6, together with the XRD data. This figure clearly confirms the findings described previously. Isolated HCP environments appear at relatively low temperatures (∼ 600 K), well before Frenkel pairs. The concentration of those isolated HCP environments, noted hcpi, are neatly correlated with the apparition of the 33L superstructure peaks, which indicate that these defects reduce the unit-cell symmetry to a period of
In terms of temperature range, the fraction of clustered HCP environments, noted hcpc, is almost perfectly correlated both with the fraction of Frenkel pairs, and the intensity of the 111 peak. This indicates that the Frenkel pairs are at the origin of (i) the clustering of HCP environments, and (ii) the formation of ordered local environments on the X sublattice, with a periodicity equal to that of a fluorite unit-cell.
The PTM analysis in itself does not give a complete picture of the local environments it detects. For example, the actual local environments also depend on the position of neighbours on the A sublattice. Those were completely ignored in our PTM analysis, which was done separately for each sublattice. Determination of the local environments directly from MD simulations proved all but impossible due to distortions and large thermal fluctuations in the superionic phases. To work around this, we performed constant-volume geometry optimisations from the final structure of the MD simulations for each potential and temperature. During this operation, the ions were moved towards more energetically favorable positions, thus removing thermal noise from vibrations and unstable defects. The results were structures that were easier to interpret and characterise. It should be noted, however, that the energy-minimised and high-temperature structures are not the same. Indeed, some temperature-activated phenomena disappear during geometry optimisation. Thus, the energy-minimised structure can only provide some clues as to how to interpret high-temperature MD simulations.
The structures optimised from high-temperature simulations showed both cubic and non-cubic local environments after PTM analysis. The trend was also similar to what was observed in high-temperature simulations. In regime i, all potentials produced a perfect
In the Pbcn structure, the X sublattice has a distorted HCP structure, whilst the A sublattice remains close to FCC, as shown in Figure 8B. The pattern shown in the (0001) basal plane of the X sublattice in that structure, shown in Figure 8, is the triangular pattern visible in both MD simulations and energy-minimised structures. Thus, we can conclude that the non-cubic local environments detected by the PTM analysis are actually X ions which have a local environment consistent with that of the Pbcn structure. The overall structure of the superionic phase, however, is quite different from what was observed during the
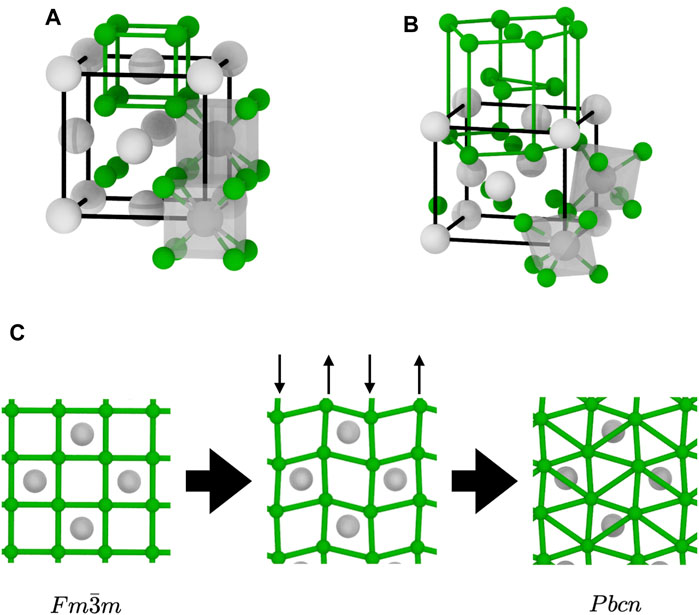
FIGURE 8. Structural transition between the two AX2 structures relevant to this study: (A)
We can now propose a mechanism for the superionic transition in materials with the fluorite structure. Upon heating, the X sublattice is subject to thermal vibrations compatible the with symmetry of the crystal. This gives rise to the diffuse scattering in the {001} planes observed in the RSMs of the X sublattice. There is a known vibration mode that fits this description. It is the B1u mode with a [0 0
4 Conclusion
We used a wide selection of empirical potentials to simulate several different compounds with the fluorite structure and investigate structural changes between the low-temperature perfect structure and that of the superionic phase.
Although a full validation of each potential was not done here, we verified that the properties they predict are realistic by comparing them to available experimental values. In particular, the superionic transition temperatures, the enthalpies of formation for the X Frenkel pairs, and the activation energies for X diffusion in both the
From a thermodynamical point of view, not all the potentials reproduced the characteristic CP and α peaks usually associated with the superionic transition, despite showing other aspects such as structural disorder and a change in the diffusion properties. This demonstrates that the transition could occur without a clearly-visible peak. Different potentials for the same compound could also exhibit different behaviour. For example, in BaF2, the Catlow potential showed a sharp Λ peak in its CP(T) curve, whereas the Sayle potentials showed a broad plateau, and the transition was almost invisible from the thermodynamical properties of the Cazorla potential.
All potentials are characterised by a 2-regime diffusion behaviour, with a change in the apparent activation energy at the superionic transition consistent with available experimental data. Moreover, populations of X Frenkel pairs showed a similar trend, with a low-temperature Arrhenius regime followed by a progressive transition towards a lower apparent formation energy in the superionic phases. This is consistent with a transition from a diffusion process mediated by isolated point defects in low-temperature crystals to a collective process involving clusters in the superionic phases.
Powder and single-crystal XRD patterns were calculated from the MD simulation boxes for investigate structural changes from the reciprocal space. Whilst the A sublattices did not change from room temperature to the melting point, additional Bragg peaks on the X sublattices showed the emergence of new structural features distinct from the simple partially molten structure sometimes assumed. This observation could not be made using experiments, which could not have separated signals from both sublattices. Subsequent analysis of the MD simulation boxes could determine that the additional peaks are the result from a the presence of local environments with a structure close to the Pbcn structure. In these local environments, the X sublattice has HCP features. This work is a demonstration of the power of combined MD and computational diffraction techniques to described structures associated with widespread disorder.
Following our observations, we can describe the evolution with temperature of the structure of the fluorite compounds, following the four stages defined from thermodynamical properties and outlined in Section 3.1. Only the X sublattice is discussed in the following: the A sublattice remains FCC from room temperature to TM, with some distortions at high temperatures.
Stage (i)
This is the low-temperature regime, in which the heat capacity varies slowly as a polynomial. Near the end of this temperature range, isolated hexagonal local environments are formed in an otherwise perfect
Stage (ii)
In this regime, CP(T) follows an exponential increase leading to the top of the Λ peak, or the left-hand edge of the plateau depending on the potential. The end of this stage is TS and the onset of the superionic transition. The structure is characterised by the accumulation of Frenkel pairs and hexagonal environments becoming more present. The number of isolated HCP environments peaks near the end of this stage. This corresponds to the intrinsic diffusion regime, limited by Frenkel pairs, where diffusion coefficients follow an Arrhenius law.
Stage (iii)
In this transition stage, the CP(T) curve decreases sharply, forming the high-temperature side of the Λ peak. The number of isolated hexagonal environments also decreases, to become negligible by the end of this stage, at which point all the hexagonal local environments are part of clusters. The beginning of this stage is associated with a change in slope of the Frenkel pair concentration, diffusion coefficient, and the concentration of clustered hexagonal local environments, which all increase at a reduced rate. The diffusion coefficients progressively change from the stage (ii) to the stage iv Arrhenius regimes. This stage might not be visible if the potential does not predict a CP peak.
Stage (iv)
The growth of the CP(T) curve resumes slowly, leading to the mechanical melting at TM. The structure is characterised by a mixture of regions with hexagonal local environments, and regions that retain the cubic local environment of the perfect fluorite structure. The X diffusion coefficient follows another Arrhenius law, with an activation energy smaller than that of stage (ii), underlying the collective diffusion mechanism underlines elsewhere (Annamareddy et al., 2014).
Data Availability Statement
The raw data supporting the conclusions of this article will be made available by the authors, without undue reservation.
Author Contributions
All authors listed have made a substantial, direct and intellectual contribution to the work, and approved it for publication.
Funding
This work was granted access to the HPC resources of the TGCC computing centre, under the DARI allocation A0100911528.
Conflict of Interest
The authors declare that the research was conducted in the absence of any commercial or financial relationships that could be construed as a potential conflict of interest.
Publisher’s Note
All claims expressed in this article are solely those of the authors and do not necessarily represent those of their affiliated organizations, or those of the publisher, the editors and the reviewers. Any product that may be evaluated in this article, or claim that may be made by its manufacturer, is not guaranteed or endorsed by the publisher.
Supplementary Material
The Supplementary Material for this article can be found online at: https://www.frontiersin.org/articles/10.3389/fchem.2021.723507/full#supplementary-material
References
Ando, K., Akiyama, M., and Oishi, Y. (1980). Lattice Diffusion Coefficient of Oxygen in Lithium Oxide. J. Nucl. Mater. 95, 259–264. doi:10.1016/0022-3115(80)90367-0
Ando, K., and Oishi, Y. (1983). Diffusion Characteristics of Actinide Oxides. J. Nucl. Sci. Tech. 20, 973–982. doi:10.1080/18811248.1983.9733499
Annamareddy, A., and Eapen, J. (2017). Low Dimensional String-like Relaxation Underpins Superionic Conduction in Fluorites and Related Structures. Sci. Rep. 7, 44149. doi:10.1038/srep44149
Annamareddy, V. A., Nandi, P. K., Mei, X., and Eapen, J. (2014). Waxing and Waning of Dynamical Heterogeneity in the Superionic State. Phys. Rev. E 89, 010301. doi:10.1103/physreve.89.010301
Asahi, R., Freeman, C. M., Saxe, P., and Wimmer, E. (2014). Thermal Expansion, Diffusion and Melting of Li2O Using a Compact Forcefield Derived From ab Initio Molecular Dynamics. Model. Simul. Mater. Sci. Eng. 22, 075009. doi:10.1088/0965-0393/22/7/075009
Bathellier, D., Lainet, M., Freyss, M., Olsson, P., and Bourasseau, E. (2021). A New Heat Capacity Law for UO2, PuO2 and (U,Pu)O2 Derived from Molecular Dynamics Simulations and Useable in Fuel Performance Codes. J. Nucl. Mater. 549, 152877. doi:10.1016/j.jnucmat.2021.152877
Bendall, P. J., and Catlow, C. R. A. (1980). Calculations of Point Defect Properties. Disorder in Pure and Doped Strontium Chloride. J. Phys. Colloques 41, C6–C61. doi:10.1051/jphyscol:1980616
Bingham, D., Cormack, A. N., and Catlow, C. R. A. (1989). Rigid-ion Potentials for SrF2, CaF2 and GdF3. J. Phys. Condens. Matter 1, 1205–1212. doi:10.1088/0953-8984/1/7/004
Böhler, R., Welland, M. J., Prieur, D., Cakir, P., Vitova, T., Pruessmann, T., et al. (2014). Recent Advances in the Study of the UO2-PuO2 Phase Diagram at High Temperatures. J. Nucl. Mater. 448, 330–339. doi:10.1016/j.jnucmat.2014.02.029
Bollmann, W. (1980). Formation Enthalpy of Schottky Defects in Alkali Halide Crystals and of Anti-frenkel Defects in CaF2-type Crystals. Phys. Stat. Sol. (A) 61, 395–410. doi:10.1002/pssa.2210610210
Bollmann, W., Görlich, P., Hauk, W., and Mothes, H. (1970). Ionic Conduction of Pure and Doped CaF2 and SrF2 Crystals. Phys. Stat. Sol. (A) 2, 157–170. doi:10.1002/pssa.19700020120
Boyce, J. B., and Huberman, B. A. (1979). Superionic Conductors: Transitions, Structures, Dynamics. Phys. Rep. 51, 189–265. doi:10.1016/0370-1573(79)90067-X
Boyce, J. B., Mikkelsen, J. C., and O'Keeffe, M. (1977). Ion Dynamics and Sublattice Melting in the Superionic Conductor PbF2. Solid State. Commun. 21, 955–958. doi:10.1016/0038-1098(77)90898-5
Byrd, R. H., Lu, P., Nocedal, J., Zhu, C., and Zhu, C. (1995). A Limited Memory Algorithm for Bound Constrained Optimization. SIAM J. Sci. Comput. 16, 1190–1208. doi:10.1137/0916069
Carr, V. M., Chadwick, A. V., and Saghafian, R. (1978). The Electrical Conductivity of PbF2 and SrCl2 crystals at High Temperatures. J. Phys. C: Solid State. Phys. 11, L637–L641. doi:10.1088/0022-3719/11/15/006
Castiglione, M. J., and Madden, P. A. (2001). Fluoride Ion Disorder and Clustering in Superionic PbF2. J. Phys. Condens. Matter 13, 9963–9983. doi:10.1088/0953-8984/13/44/311
Catlow, C. R. A., Comins, J. D., Germano, F. A., Harley, R. T., and Hayes, W. (1978). Brillouin Scattering and Theoretical Studies of High-Temperature Disorder in Fluorite Crystals. J. Phys. C: Solid State. Phys. 11, 3197–3212. doi:10.1088/0022-3719/11/15/019
Catlow, C. R. A., and Norgett, M. J. (1973). Shell Model Calculations of the Energies of Formation of point Defects in Alkaline Earth Fluorides. J. Phys. C: Solid State. Phys. 6, 1325–1339. doi:10.1088/0022-3719/6/8/002
Cazorla, C., Sagotra, A. K., King, M., and Errandonea, D. (2018). High-pressure Phase Diagram and Superionicity of Alkaline Earth Metal Difluorides. J. Phys. Chem. C 122, 1267–1279. doi:10.1021/acs.jpcc.7b10975
Chadwick, A. V., Flack, K. W., Strange, J. H., and Harding, J. (1988). Defect Structures and Ionic Transport in Lithium Oxide. Solid State Ionics 28-30, 185–188. doi:10.1016/s0167-2738(88)80030-4
Cooper, M. W. D., Murphy, S. T., Fossati, P. C. M., Rushton, M. J. D., and Grimes, R. W. (2014a). Thermophysical and Anion Diffusion Properties of (Ux ,Th1−x )O2. Proc. R. Soc. A. 470, 20140427. doi:10.1098/rspa.2014.0427
Cooper, M. W. D., Murphy, S. T., Rushton, M. J. D., and Grimes, R. W. (2015). Thermophysical Properties and Oxygen Transport in the (Ux,Pu1−x)O2 Lattice. J. Nucl. Mater. 461, 206–214. doi:10.1016/j.jnucmat.2015.03.024
Cooper, M. W. D., Rushton, M. J. D., and Grimes, R. W. (2014b). A many-body Potential Approach to Modelling the Thermomechanical Properties of Actinide Oxides. J. Phys. Condens. Matter 26, 105401. doi:10.1088/0953-8984/26/10/105401
Debelle, A., Boulle, A., Chartier, A., Gao, F., and Weber, W. J. (2014). Interplay between Atomic Disorder, Lattice Swelling, and Defect Energy in Ion-Irradiation-Induced Amorphization of SiC. Phys. Rev. B 90, 174112. doi:10.1103/physrevb.90.174112
Dent, A., Madden, P. A., and Wilson, M. (2004). Simulation of CaF2 in the Superionic State: Comparison of an Empirical and Realistic Potential. Solid State Ionics 167, 73–81. doi:10.1016/j.ssi.2004.01.002
Derrington, C. E., Lindner, A., and O'Keeffe, M. (1975). Ionic Conductivity of Some Alkaline Earth Halides. J. Solid State. Chem. 15, 171–174. doi:10.1016/0022-4596(75)90241-8
Dickens, M. H., Hayes, W., Hutchings, M. T., and Smith, C. (1982). Investigation of Anion Disorder in PbF2 at High Temperatures by Neutron Diffraction. J. Phys. C: Solid State. Phys. 15, 4043–4060. doi:10.1088/0022-3719/15/19/006
Dixon, M. (1980). Molecular Dynamics Simulation of Fast-Ion Conduction in SrCl2. II. Distribution of Ions and Specific Heat Anomaly. J. Phys. C: Solid State. Phys. 13, 1919–1929. doi:10.1088/0022-3719/13/10/011
Dworkin, A. S., and Bredig, M. A. (1968). Diffuse Transition and Melting in Fluorite and Antifluorite Type of Compounds. Heat Content of Potassium Sulfide from 298 to 1260. Degree.K. J. Phys. Chem. 72, 1277–1281. doi:10.1021/j100850a035
Dworkin, A. S., and Bredig, M. A. (1963). The Heats of Fusion and Transition of Alkaline Earth and Rare Earth Metal Halides. J. Phys. Chem. 67, 697–698. doi:10.1021/j100797a038
Evangelakis, G. A., and Pontikis, V. (1989). Direct Computation of the Superionic Conductivity in CaF2 by Constant-Temperature Equilibrium and Nonequilibrium Molecular Dynamics. Europhys. Lett. 8, 599–604. doi:10.1209/0295-5075/8/7/003
Farley, T. W. D., Hayes, W., Hull, S., Hutchings, M. T., and Vrtis, M. (1991). Investigation of Thermally Induced Li+ Ion Disorder in Li2O Using Neutron Diffraction. J. Phys. Condens. Matter 3, 4761–4781. doi:10.1088/0953-8984/3/26/001
Farrow, C. L., and Billinge, S. J. L. (2009). Relationship between the Atomic Pair Distribution Function and Small-Angle Scattering: Implications for Modeling of Nanoparticles. Acta Cryst. Sect A. 65, 232–239. doi:10.1107/S0108767309009714
Fomin, Y. D. (2021). Melting Line and Thermodynamic Properties of a Superionic Compound SrCl2 by Molecular Dynamics Simulation. Phys. Chem. Liquids 1, 1–9. doi:10.1080/00319104.2021.1916934
Fossati, P. C. M., Van Brutzel, L., Chartier, A., and Crocombette, J.-P. (2013). Simulation of Uranium Dioxide Polymorphs and Their Phase Transitions. Phys. Rev. B 88, 214112. doi:10.1103/PhysRevB.88.214112
Fracchia, R. M., Barrera, G. D., Allan, N. L., Barron, T. H. K., and Mackrodt, W. C. (1998). Lithium Oxide and Superionic Behaviour-A Study Using Potentials from Periodic Ab Initio Calculations. J. Phys. Chem. Sol. 59, 435–445. doi:10.1016/S0022-3697(97)00208-4
Galvin, C. O. T., Cooper, M. W. D., Rushton, M. J. D., and Grimes, R. W. (2016). Thermophysical Properties and Oxygen Transport in (Thx,Pu1−x)O2. Sci. Rep. 6, 36024. doi:10.1038/srep36024
Gillan, M. J., and Dixon, M. (1980). Quasi-elastic Scattering in Fast-Ion Conducting SrCl2: a Molecular Dynamics Study. J. Phys. C: Solid State. Phys. 13, L835–L839. doi:10.1088/0022-3719/13/30/003
Goel, P., Choudhury, N., and Chaplot, S. L. (2004). Superionic Behavior of Lithium Oxide Li2O: A Lattice Dynamics and Molecular Dynamics Study. Phys. Rev. B 70. doi:10.1103/physrevb.70.174307
Goff, J. P., Hayes, W., Hull, S., and Hutchings, M. T. (1991). Neutron Powder Diffusion Study of the Fast-Ion Transition and Specific Heat Anomaly in Beta -lead Fluoride. J. Phys. Condens. Matter 3, 3677–3687. doi:10.1088/0953-8984/3/21/001
Gray-Weale, A., and Madden, P. A. (2004). Dynamical Arrest in Superionic Crystals and Supercooled Liquids. J. Phys. Chem. B 108, 6624–6633. doi:10.1021/jp037706a
Gupta, M. K., Singh, B., Goel, P., Mittal, R., Rols, S., and Chaplot, S. L. (2019). Lithium Diffusion in Li2X ( X=O , S, and Se): Ab Initio Simulations and Inelastic Neutron Scattering Measurements. Phys. Rev. B 99, 224304. doi:10.1103/physrevb.99.224304
Hayes, W. (1974). Crystals with the Fluorite Structure — Electronic, Vibrational, and Defect Properties. Oxford: Clarendon Press.
Hiernaut, J. P., Hyland, G. J., and Ronchi, C. (1993). Premelting Transition in Uranium Dioxide. Int. J. Thermophys. 14, 259–283. doi:10.1007/BF00507813
Hull, S., Farley, T. W. D., Hayes, W., and Hutchings, M. T. (1988). The Elastic Properties of Lithium Oxide and Their Variation with Temperature. J. Nucl. Mater. 160, 125–134. doi:10.1016/0022-3115(88)90039-6
Hull, S., Norberg, S. T., Ahmed, I., Eriksson, S. G., and Mohn, C. E. (2011). High Temperature crystal Structures and Superionic Properties of SrCl2, SrBr2, BaCl2 and BaBr2. J. Solid State. Chem. 184, 2925–2935. doi:10.1016/j.jssc.2011.09.004
Hull, S. (2004). Superionics: crystal Structures and Conduction Processes. Rep. Prog. Phys. 67, 1233–1314. doi:10.1088/0034-4885/67/7/r05
Hutchings, M. T., Clausen, K., Dickens, M. H., Hayes, W., Kjems, J. K., Schnabel, P. G., et al. (1984). Investigation of Thermally Induced Anion Disorder in Fluorites Using Neutron Scattering Techniques. J. Phys. C: Solid State. Phys. 17, 3903–3940. doi:10.1088/0022-3719/17/22/011
Jin, X., Boulle, A., Chartier, A., Crocombette, J.-P., and Debelle, A. (2020). Analysis of Strain and Disordering Kinetics Based on Combined RBS-Channeling and X-ray Diffraction Atomic-Scale Modelling. Acta Materialia 201, 63–71. doi:10.1016/j.actamat.2020.09.076
Johnston, H. L., and Bauer, T. W. (1951). Low Temperature Heat Capacities of Inorganic Solids. VII. Heat Capacity and Thermodynamic Functions of Li2O. Thermodynamics of the Li2O-H2o System1. J. Am. Chem. Soc. 73, 1119–1122. doi:10.1021/ja01147a070
Klarbring, J., Skorodumova, N. V., and Simak, S. I. (2018). Finite-temperature Lattice Dynamics and Superionic Transition in Ceria from First Principles. Phys. Rev. B 97, 104309. doi:10.1103/physrevb.97.104309
Kurasawa, T., Takahashi, T., Noda, K., Takeshita, H., Nasu, S., and Watanabe, H. (1982). Thermal Expansion of Lithium Oxide. J. Nucl. Mater. 107, 334–336. doi:10.1016/0022-3115(82)90434-2
Larsen, P. M., Schmidt, S., and Schiøtz, J. (2016). Robust Structural Identification via Polyhedral Template Matching. Model. Simul. Mater. Sci. Eng. 24, 055007. doi:10.1088/0965-0393/24/5/055007
Léger, J.-M., and Haines, J. (1997). Crystal Chemistry of the AX2 Compounds under Pressure. Eur. J. Solid State. Inorg. Chem. 34, 785–796.
Lidiard, A. B. (1974). in Crystals with the Fluorite Structure. Editor W. Hayes (Oxford: Clarendon Press).
Lidiard, A. B. (1980). “Lattice Defects in Crystals with the Fluorite Structure,”. (AERE report T. P. 841).
López-Moreno, S., Romero, A. H., Mejía-López, J., and Muñoz, A. (2016). First-principles Study of Pressure-Induced Structural Phase Transitions in MnF2. Phys. Chem. Chem. Phys. 18, 33250–33263. doi:10.1039/c6cp05467f
Lorger, S., Usiskin, R., and Maier, J. (2019). Transport and Charge Carrier Chemistry in Lithium Oxide. J. Electrochem. Soc. 166, A2215–A2220. doi:10.1149/2.1121910jes
Martin, D. G. (1988). The thermal Expansion of Solid UO2 and (U, Pu) Mixed Oxides - a Review and Recommendations. J. Nucl. Mater. 152, 94–101. doi:10.1016/0022-3115(88)90315-7
Matzke, H. (1987). Atomic Transport Properties in UO2 and Mixed Oxides (U, Pu)O2. J. Chem. Soc. Faraday Trans. 2 83, 1121–1142. doi:10.1039/F29878301121
Morelon, N.-D., Ghaleb, D., Delaye, J.-M., and Van Brutzel, L. (2003). A New Empirical Potential for Simulating the Formation of Defects and Their Mobility in Uranium Dioxide. Phil. Mag. 83, 1533–1555. doi:10.1080/1478643031000091454
Morris, J. R., Wang, C. Z., Ho, K. M., and Chan, C. T. (1994). Melting Line of Aluminum from Simulations of Coexisting Phases. Phys. Rev. B 49, 3109–3115. doi:10.1103/physrevb.49.3109
Naylor, B. F. (1945). Heat Contents at High Temperatures of Magnesium and Calcium Fluorides1. J. Am. Chem. Soc. 67, 150–152. doi:10.1021/ja01217a052
Nosé, S. (1984). A Unified Formulation of the Constant Temperature Molecular Dynamics Methods. J. Chem. Phys. 81, 511–519. doi:10.1063/1.447334
Oda, T., Oya, Y., Tanaka, S., and Weber, W. J. (2007). Validation of Potential Models for Li2O in Classical Molecular Dynamics Simulation. J. Nucl. Mater. 367-370, 263–268. doi:10.1016/j.jnucmat.2007.03.139
Oishi, Y., Kamei, Y., Akiyama, M., and Yanagi, T. (1979). Self-diffusion Coefficient of Lithium in Lithium Oxide. J. Nucl. Mater. 87, 341–344. doi:10.1016/0022-3115(79)90570-1
O’Keeffe, M. (1976). “Phase Transitions and Translational freedom in Solid Electrolytes,” in Superionic Conductors. Editors G. D. Mahan, and W. L. Roth (New York: Plenum Press).
Parrinello, M., and Rahman, A. (1981). Polymorphic Transitions in Single Crystals: A New Molecular Dynamics Method. J. Appl. Phys. 52, 7182–7190. doi:10.1063/1.328693
Pavlov, T. R., Wenman, M. R., Vlahovic, L., Robba, D., Konings, R. J. M., Van Uffelen, P., et al. (2017). Measurement and Interpretation of the Thermo-Physical Properties of UO2 at High Temperatures: The Viral Effect of Oxygen Defects. Acta Materialia 139, 138–154. doi:10.1016/j.actamat.2017.07.060
Pedone, A., Malavasi, G., Menziani, M. C., Cormack, A. N., and Segre, U. (2006). A New Self-Consistent Empirical Interatomic Potential Model for Oxides, Silicates, and Silica-Based Glasses. J. Phys. Chem. B 110, 11780–11795. doi:10.1021/jp0611018
Plimpton, S. (1995). Fast Parallel Algorithms for Short-Range Molecular Dynamics. J. Comput. Phys. 117, 1–19. doi:10.1006/jcph.1995.1039
Popov, P. A., Sidorov, А. А., Kul’chenkov, Е. А., Аnishchenko, А. М., Аvetissov, I. C., Sorokin, N. I., et al. (2017). Thermal Conductivity and Expansion of PbF2 Single Crystals. Ionics 23, 233–239. doi:10.1007/s11581-016-1802-2
Ralph, J. (1987). Specific Heat of UO2, ThO2, PuO2 and the Mixed Oxides (Thx U1-x)O2 and (Pu0.2 U0.8) O1.97 by Enthalpy Data Analysis. J. Chem. Soc. Faraday Trans. 2 83, 1253–1262. doi:10.1039/F29878301253
Rice, M. J., and Roth, W. L. (1972). Ionic Transport in Super Ionic Conductors: a Theoretical Model. J. Solid State. Chem. 4, 294–310. doi:10.1016/0022-4596(72)90121-1
Roberts, R. B., and White, G. K. (1986). Thermal Expansion of Fluorites at High Temperatures. J. Phys. C: Solid State. Phys. 19, 7167–7172. doi:10.1088/0022-3719/19/36/008
Samara, G. A. (1979). Pressure and Temperature Dependences of the Ionic Conductivities of Cubic and Orthorhombic lead Fluoride (PbF2). J. Phys. Chem. Sol. 40, 509–522. doi:10.1016/0022-3697(79)90079-9
Sayle, D. C., Doig, J. A., Parker, S. C., and Watson, G. W. (2003). Synthesis, Structure and Ionic Conductivity in Nanopolycrystalline BaF2/CaF2. Chem. Commun. 15, 1804–1806. doi:10.1039/b305393h
Schröter, W., and Nölting, J. (1980). Specific Heats of Crystals with the Fluorite Structure. J. Phys. Colloques 41, C6–C20. doi:10.1051/jphyscol:1980605
Smith, D. F., Gardner, T., Letson, B., and Taylor, A. R. (1963). Thermodynamic Properties of Strontium Chloride and Strontium Fluoride from 0° to 300°K, Rep no. 6316. Washington: (US Department of the Interior, Bureau of Mines).
Stukowski, A. (2010). Visualization and Analysis of Atomistic Simulation Data with OVITO-The Open Visualization Tool. Model. Simul. Mater. Sci. Eng. 18, 015012. doi:10.1088/0965-0393/18/1/015012
Szwarc, R. (1969). The Defect Contribution to the Excess Enthalpy of Uranium Dioxide-Calculation of the Frenkel Energy. J. Phys. Chem. Sol. 30, 705–711. doi:10.1016/0022-3697(69)90024-9
Takoukam-Takoundjou, C., Bourasseau, E., and Lachet, V. (2020). Study of Thermodynamic Properties of U1-yPuyO2 MOX Fuel Using Classical Molecular Monte Carlo Simulations. J. Nucl. Mater. 534, 152125. doi:10.1016/j.jnucmat.2020.152125
Thomas, M. W. (1976). Neutron Diffraction Evidence for Anion Sublattice Disordering in Alkali Earth Fluorides at High Temperatures. Chem. Phys. Lett. 40, 111–115. doi:10.1016/0009-2614(76)80131-5
Trueblood, K. N., Bürgi, H. B., Burzlaff, H., Dunitz, J. D., Gramaccioli, C. M., Schulz, H. H., et al. (1996). Atomic Dispacement Parameter Nomenclature. Report of a Subcommittee on Atomic Displacement Parameter Nomenclature. Acta Cryst. Sect A. 52, 770–781. doi:10.1107/S0108767396005697
Tuckerman, M. E., Alejandre, J., López-Rendón, R., Jochim, A. L., and Martyna, G. J. (2006). A Liouville-Operator Derived Measure-Preserving Integrator for Molecular Dynamics Simulations in the Isothermal-Isobaric Ensemble. J. Phys. A: Math. Gen. 39, 5629–5651. doi:10.1088/0305-4470/39/19/S18
Voronin, B. M. (1995). Some Simple Thermodynamic Approaches to Superionic Disorder in Fluorite-type Crystals: Application to SrCl2 and K2S. J. Phys. Chem. Sol. 56, 839–847. doi:10.1016/0022-3697(94)00276-2
Voronin, B. M., and Volkov, S. V. (2001). Ionic Conductivity of Fluorite Type Crystals CaF2, SrF2, BaF2, and SrCl2 at High Temperatures. J. Phys. Chem. Sol. 62, 1349–1358. doi:10.1016/s0022-3697(01)00036-1
Wang, J., Li, J., Yip, S., Wolf, D., and Phillpot, S. (1997). Unifying Two Criteria of Born: Elastic Instability and Melting of Homogeneous Crystals. Physica A: Stat. Mech. its Appl. 240, 396–403. doi:10.1016/S0378-4371(97)00161-1
Wicks, C. E., and Block, F. E. (1963). Thermodynamic Properties of 65 Elements: Their Oxides, Halides, Carbides and Nitrides, Rep no. 605. Washington: (US Government Printing Office).
Wojdyr, M. Debye’s Scattering Equation & Other Analysis of Atomistic Models, Available at: https://github.com/wojdyr/debyer (Accessed 6 september 2021)
Wolf, D., Keblinski, P., Phillpot, S. R., and Eggebrecht, J. (1999). Exact Method for the Simulation of Coulombic Systems by Spherically Truncated, Pairwise R−1 Summation. J. Chem. Phys. 110, 8254–8282. doi:10.1063/1.478738
Zhang, H., Wang, X., Chremos, A., and Douglas, J. F. (2019). Superionic UO2: A Model Anharmonic Crystalline Material. J. Chem. Phys. 150, 174506. doi:10.1063/1.5091042
Zhang, Y., Liu, X.-Y., Millett, P. C., Tonks, M., Andersson, D. A., and Biner, B. (2012). Crack Tip Plasticity in Single crystal UO2: Atomistic Simulations. J. Nucl. Mater. 430, 96–105. doi:10.1016/j.jnucmat.2012.06.044
Keywords: molecular dynamics, fluorite, superionic, atomic-scale simulation, computational diffraction, XRD
Citation: Fossati PCM, Chartier A and Boulle A (2021) Structural Aspects of the Superionic Transition in AX2 Compounds With the Fluorite Structure. Front. Chem. 9:723507. doi: 10.3389/fchem.2021.723507
Received: 10 June 2021; Accepted: 30 August 2021;
Published: 18 October 2021.
Edited by:
Gordon James Thorogood, Australian Nuclear Science and Technology Organisation, AustraliaReviewed by:
Ranjan Mittal, Bhabha Atomic Research Centre (BARC), IndiaJacob Eapen, North Carolina State University, United States
Samrath Lal Chaplot, Bhabha Atomic Research Centre (BARC), India
Copyright © 2021 Fossati, Chartier and Boulle. This is an open-access article distributed under the terms of the Creative Commons Attribution License (CC BY). The use, distribution or reproduction in other forums is permitted, provided the original author(s) and the copyright owner(s) are credited and that the original publication in this journal is cited, in accordance with accepted academic practice. No use, distribution or reproduction is permitted which does not comply with these terms.
*Correspondence: Paul C. M. Fossati, cGF1bC5mb3NzYXRpQGNlYS5mcg==