 Nuzhat Parveen
 Yan-Liang Lin2
 Chung-Ming Sun
 Chin Yu
- 1Chemistry Department, National Tsing Hua University, Hsinchu, Taiwan
- 2Department of Applied Chemistry, National Yang Ming Chiao Tung University, Hsinchu, Taiwan
- 3Graduate Institute of Biomedical Sciences, China Medical University, Taichung, Taiwan
- 4The Ph.D. Program of Biotechnology and Biomedical Industry, China Medical University, Taichung, Taiwan
- 5Center for Molecular Medicine, China Medical University Hospital, Taichung, Taiwan
- 6Department of Medical Laboratory and Biotechnology, Asia University, Taichung, Taiwan
- 7Department of Medicinal and Applied Chemistry, Kaohsiung Medical University, Kaohsiung, Taiwan
A promising approach in cancer therapy is the inhibition of cell proliferation using small molecules. In this study, we report the synthesis of suramin derivatives and their applications. We used NMR spectroscopy and docking simulations to confirm binding sites and three-dimensional models of the ligand-protein complex. The WST-1 assay was used to assess cell viability and cell proliferation in vitro to evaluate the inhibition of protein–protein interactions and to investigate the anti-proliferative activities in a breast cancer cell line. All the suramin derivatives showed anti-proliferative activity by blocking FGF1 binding to its receptor FGFRD2. The dissociation constant was measured by fluorescence spectroscopy. The suramin compound derivatives synthesized herein show potential as novel therapeutic agents for their anti-proliferative activity via the inhibition of protein–protein interactions. The cytotoxicity of these suramin derivatives was lower than that of the parent suramin compound, which may be considered a significant advancement in this field. Thus, these novel suramin derivatives may be considered superior anti-metastasis molecules than those of suramin.
Introduction
One of the most commonly occurring cancers in women is breast cancer, which is the second most common cancer overall. There are around 2 million new cases discovered every year. Female breast cancer ranks as the fifth leading cause of death (627,000 deaths, 6.6%) due to the relatively favorable prognosis (breast cancer statistics). A recent study suggested that suramin, a sulfonated naphthylurea compound, could inhibit cell proliferation in breast cancer cell lines (Wu et al., 2016). Suramin is a member of the phenyl urea class, in which the amino groups have been substituted by a 3-({2-methyl-5-[(4,6,8-trisulfo-1-naphthyl) carbamoyl] phenyl}carbamoyl) (National Center for Biotechnology Information, 2019) phenyl group with potential antineoplastic activity.
Trypanosomiasis and onchocerciasis are common diseases in sub-Saharan Africa and are specifically treated with suramin (Anderson et al., 1976; Cheson, et al., 1987; Barrett et al., 2007; Brun, 2010; Babokhov et al., 2013; Federica et al., 2016; Büscher et al., 2017). This market-approved anti-parasite medication was developed in 1921 and its pharmacological development was stimulated for its antitumor, anti-inflammatory, and antiviral activities (Yahi et al., 1994; Liu. et al., 2012; Basavannacharya and Vasudevan, 2014; Li et al., 2015; Henß et al., 2016; Koval et al., 2016; Albulescu et al., 2017). In the 1980s, suramin was briefly studied as a possible antiviral agent for the treatment of acquired immune deficiency syndrome (AIDS). In addition to inhibiting the function of viral reverse transcriptase, structural changes in the host cell following human immunodeficiency virus (HIV) infection are also blocked by suramin in vitro (De Clercq, 1979; Mitsuya et al., 1984; Broder et al., 1985; Clercq, 2021).
Most of the pharmacological and biological properties of suramin are due to the presence of aromatic rings defined by the spatial arrangement of six sulfonic groups. The binding of suramin to proteins usually occurs by ring stacking interactions (i.e., proteins bind to the aromatic amino acids) and is a consequence of its overall anionic charge.
Fibroblast growth factors (FGFs) are systematic mitogenic agents that control a wide variety of cellular functions, including proliferation, differentiation, migration, and survival (Yun et al., 2010; Xie et al., 2020). It has been reported that FGFs play an important role in tissue homeostasis, development, and metabolism (Xie et al., 2020) in a variety of human diseases, such as chronic kidney diseases (CKDs), congenital craniosynostosis, insulin resistance, obesity, dwarfism syndromes, and various tumors.
Based on phylogeny, FGFs are divided into six subfamilies consisting of one endocrine subfamily and five paracrine subfamilies. The five paracrine subfamilies include FGF1, FGF4, FGF7, FGF8, and FGF9 subfamilies, and the endocrine subfamily is represented by the FGF19 subfamily (Ornitz and Itoh, 2001; Beenken and Mohammadi, 2009; Ornitz and Itoh, 2015; Xie et al., 2020). FGFs also play a role in pleiotropism (Wiedemann and Trueb, 2000).
The FGF receptor (FGFR) contains three domains: an extracellular domain, a transmembrane domain, and an intracellular tyrosine kinase domain (Lemmon and Schlessinger, 2010). The extracellular domain consists of three immunoglobulin-like domains (domains D1–D3) (Beenken and Mohammadi, 2009; Goetz and Mohammadi, 2013), an acidic region, heparin cofactors, a partner protein, and a heparin-binding motif for FGFs (Farrell and Breeze, 2018). The transmembrane domain supports receptors and promotes dimerization within the cell membrane. The juxtamembrane region of FGFRs in the cytosol is involved in receptor dimerization, and split kinase domains are involved in the transmission of FGF-related signaling (Goetz and Mohammadi, 2013).
Binding of inactive monomeric FGFRs to FGFs triggers a conformational change in the FGFRs, resulting in the activation and dimerization of tyrosine kinases (Dai et al., 2019; Latko et al., 2019). This occurs by phosphorylating the tyrosine residues in the FGFR cytosolic tail. After phosphorylation, the phosphorylated tyrosine residues are allocated to docking sites for downstream signaling molecules (Furdui et al., 2006; Goetz and Mohammadi, 2013; Ornitz and Itoh, 2015; Farrell and Breeze, 2018) and induces cell proliferation.
Suramin is known to block receptor binding of various growth factors, such as epidermal growth factor (EGF), insulin-like growth factor (IGF-I), platelet-derived growth factor (PDGF), and tumor growth factor-beta (TGF-beta). This results in the inhibition of migration and endothelial cell proliferation (Chamberlain et al., 1995; Schrell et al., 1995; Hosang, 1985; Garg and Corona Benjamin., 2015). The mechanism by which suramin interrupts the activity of growth factors is not completely understood, but it is assumed to bind to FGF directly and not to its complementary receptor (Middaugh et al., 1992; Lozano et al., 1998; Sola et al., 1999; Zamai et al., 2002; Kathir et al., 2006).
Suramin is a polyanion, and the growth factors that it inhibits are primarily heparin-binding proteins. The interaction of suramin with its target proteins is due to its polyanion binding site (La Rocca et al., 1990; Middaugh et al., 1992). Based on the FGF2 crystal structure, suramin inhibits receptor binding in two ways: by changing its conformation and sterically occluding the region of receptor binding (Eriksson et al., 1991; Middaugh et al., 1992; Pagano et al., 2012; Eberle et al., 2019).
Suramin is highly toxic and hypersensitive, and to enhance its chemotherapeutic potential, there is a need to develop drugs with less toxicity. If the polypharmacology of suramin was understood, less toxic and more specific new molecules could be identified for the numerous potential applications of suramin (Wiedemar et al., 2020).
Suramin appears to be a promising antagonist in terms of angiogenic activity. When FGF1 binds to its receptor (FGFRD2), it dimerizes FGFRD2 and brings the cytoplasmic domains of the receptor close to each other. Autophosphorylation between these two cytoplasmic domains then occurs. This triggers a signal transduction cascade and results in cell proliferation. If a compound (such as a suramin derivative) can block the interaction between FGF1 and FGFRD2, it can prevent the dimerization of the receptor FGFRD2, avoid the occurrence of autophosphorylation, and will not allow signal transduction or triggering of cell proliferation, which ultimately results in anti-proliferative activity.
Thus, in this study, we used suramin as the template, to synthesize several suramin derivatives (compounds 14, 15, 17, 18, and 21), as shown in Figure 1. These analogs show strong inhibition between FGF1 and its receptor FGFRD2, but have lower cytotoxicity than suramin.
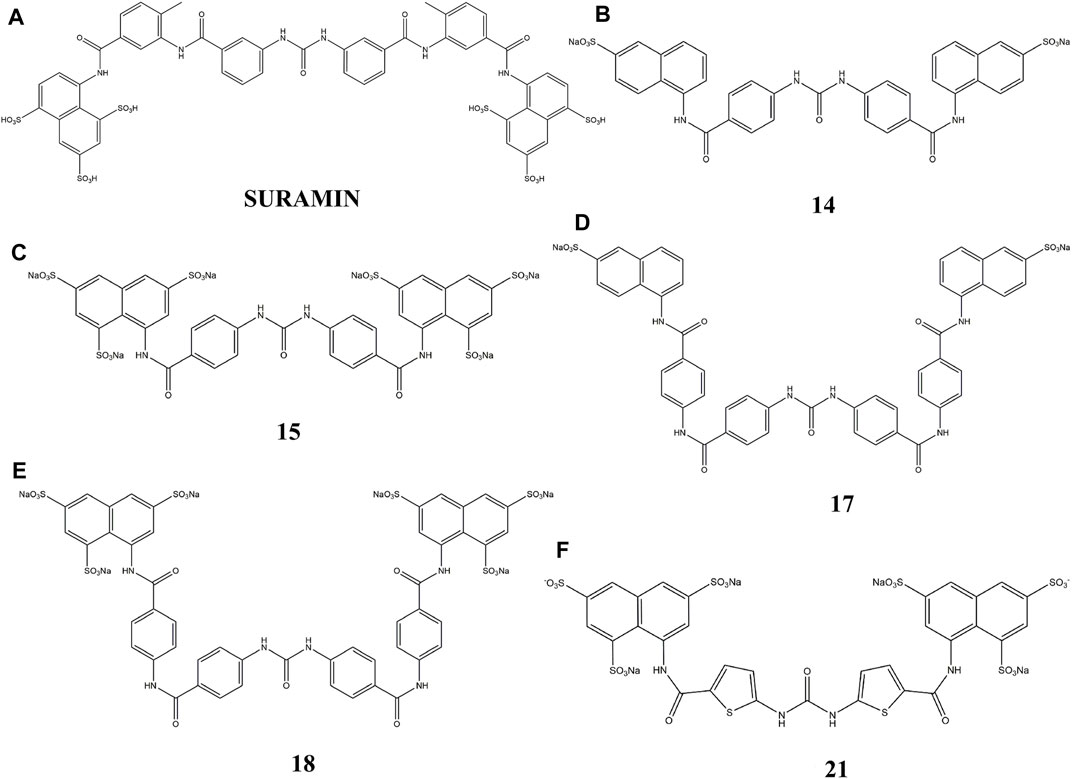
FIGURE 1. Chemical structure of suramin and its five derivatives (compounds 14, 15, 17, 18 and 21).
Materials and Methods
Milli-Q water was used for all buffers and experimental studies. A broad-range protein marker was obtained from Bio-Rad. The MCF7 cell line was purchased from the American Type Culture Collection.
Synthesis of Compounds
Bioactive compounds derived from suramin were synthesized as shown below. Variations in the aryl sulfonic acid moieties (mono or trisulfonic acids of naphthalene) were incorporated as new building blocks in the target molecules. We introduced novel scaffolds to construct different lengths of suramin-like symmetrical urea structures. Two types of compounds were synthesized: first, the preparation of the suramin-like symmetrical urea compound (14 and 15) from its precursors (6 and 7); second, replacement of the nitrobenzoyl group by the nitrothiophene moiety in the synthesis of symmetrical urea 21 which contains a heterocyclic building block. To prepare these building blocks, two aminonaphthalenesulfonic acids (1 and 2) were allowed to react with carboxylic acid chloride 3a–c in the aqueous solution of toluene to give nitrobenzamides (4 and 5) in high yield.
Reduction of the nitro compounds (4 and 5) was performed to deliver the corresponding aromatic amines (6 and 7) though palladium with charcoal catalysis. Different reduction methods were used in this transformation. We also replaced palladium with zinc powder and used ammonium formate as the hydrogen source. Although, the reaction time was reduced from 16 h to 15 min, many byproducts were formed, which caused difficulty in purifying them after reduction. Moreover, we synthesized suramin symmetrical urea precursors (11, 12, and 13) from aromatic amines (6 and7) by amidation and reduction (Scheme 1).
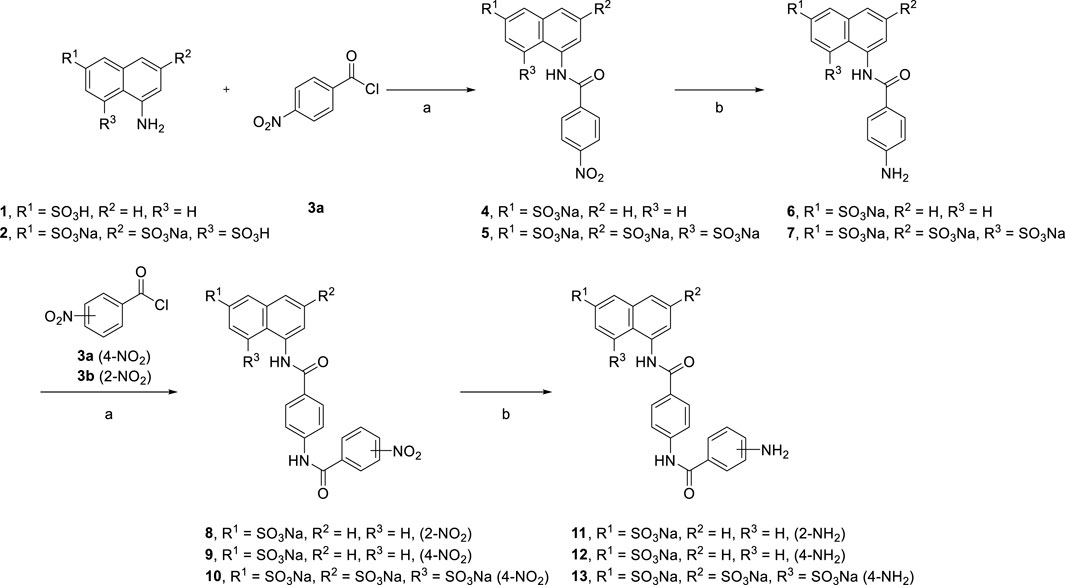
SCHEME 1. Syntheses of suramin analog precursors 6, 7, and 11, 12, and 13.
[Reagents/reaction conditions: 1) 1 (200 mg, 0.89 mmol), 4-nitrobenzoyl chloride 3a (248 mg, 1.34 mmol) in H2O (15 ml)/toluene (5 ml), room temperature, 12 h. 2) Pd/C (10%), H2 gas, H2O (10 ml), room temperature, 16 h]
Treatment of aqueous solution of arylamines (6 and 7) with a solution of triphosgene in toluene resulted in the synthesis of the target suramin-like derivatives (14 and 15, Scheme 2), but these were not soluble in methanol. Therefore, these crude products were purified by washing several times with methanol.
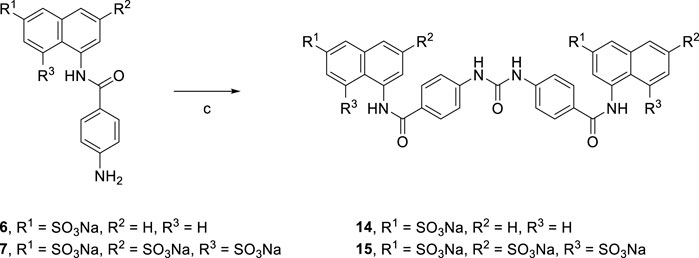
SCHEME 2. Syntheses of suramin-like derivatives 14 and 15.
[Reagents/reaction conditions: 3) 6 (200 mg, 0.55 mmol), in H2O (15 ml), triphosgene (81.51 mg, 0.27 mmol) in toluene (5 ml), room temperature, 16 h]
Suramin precursors 12 and 13 were also successfully used to synthesize suramin derivatives 17 and 18. However, when suramin precursor 11 was used as a building block to prepare the suramin derivative, an unexpected isocyanate compound 16 was obtained instead of the desired symmetrical urea suramin derivative (Scheme 3).
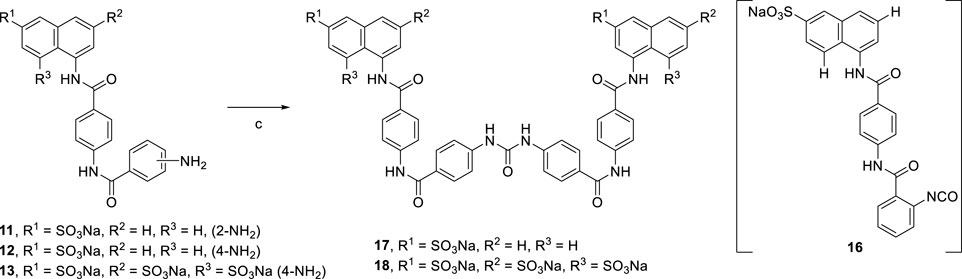
SCHEME 3. Syntheses of suramin derivatives 17 and 18.
[Reagents/reaction conditions: 3) 11 (200 mg, 0.41 mmol) in H2O (15 ml), triphosgene (61.42 mg, 0.20 mmol) in toluene (5 ml), room temperature, 16 h]
In Scheme 4 replacement of the nitrobenzoyl group by the nitrothiophene moiety was achieved for the synthesis of symmetrical urea 21 which contains a heterocyclic building block.
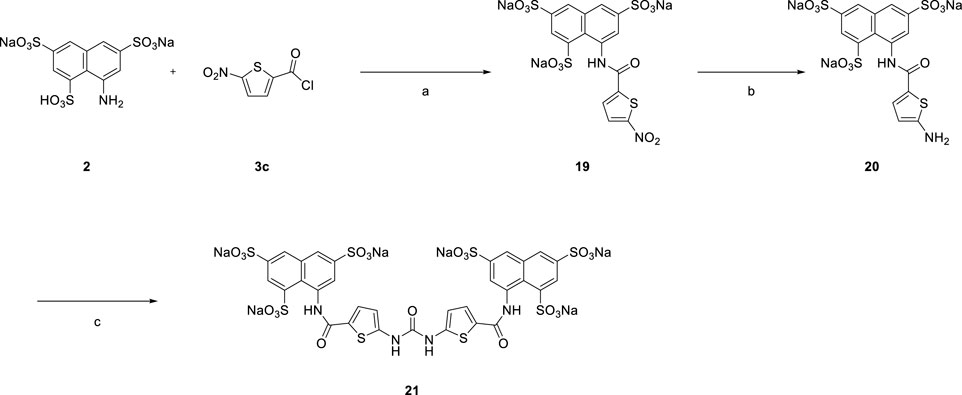
SCHEME 4. Syntheses of heterocyclic suramin derivative 21.
[Reagents/reaction conditions: 1) 2 (200 mg, 0.46 mmol) in H2O (15 ml), 3c (133.66 mg, 0.70 mmol) in toluene (5 ml), room temperature, 12 h. 2) Pd/C (10%), H2 gas, H2O (10 ml), room temperature, 16 h 3) 20 (200 mg, 0.34 mmol) in H2O (15 ml), triphosgene (51.70 mg, 0.17 mmol) in toluene (5 ml), room temperature, 16 h]
Due to the steric hindrance on the ortho-position of the amino group on precursor 11, the amidation reaction of activated triphosgene was blocked. The other reaction pathway was en route. The potential mechanism for the formation of isocyanate compound 16 is proposed in Scheme 5.
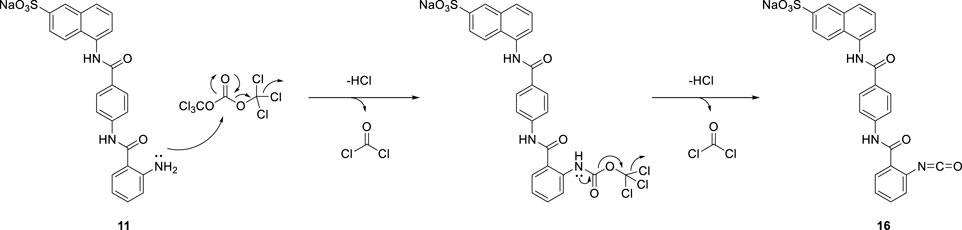
SCHEME 5. A potential mechanism for the formation of compound 16.
General acylation procedure and synthesis of nitro derivatives 4, 5, 8, 9, 10, and 19
Sodium 5-(4-nitrobenzamido) naphthalene-2-sulfonate (4)
In 100 ml water, 5-amino-2-naphthalenesulfonic acid (5 g, 22.42 mmol) was dissolved, and the solution was adjusted to pH 4.0 using 2 M Na2CO3 solution. Next, in 10 ml toluene, 4-nitrobenzoylchloride (5.80 g, 31.38 mmol) was dissolved and by stirring, it was slowly added to the reaction mixture.
When the coupling reaction was completed, toluene was removed from the reaction mixture. The water phase solution was adjusted to pH 2.0 and then was extracted with diethyl ether (4 × 70 ml). After neutralization of the solution to pH 7.0, the water phase was removed under vacuum. The crude product was purified by recrystallization from methanol in 80% isolated yield (7.06 g). 1H NMR (400 MHz, DMSO-d6) δ 10.86 (s, 1H), 8.46–8.27 (m, 4H), 8.25 (s, 1H), 7.90 (dd, J = 23.3, 8.1 Hz, 2H), 7.75 (dd, J = 8.6, 1.7 Hz, 1H), 7.65–7.52 (m, 2H); LRMS (ESI, m/z): 371.1 (M-H)−.
Sodium 8-(4-nitrobenzamido) naphthalene-1,3,6-trisulfonate (5)
Yield: 82%. 1H NMR (400 MHz, DMSO-d6) δ 12.73 (s, 1H), 8.60 (d, J = 1.9 Hz, 1H), 8.47 (d, J = 1.7 Hz, 1H), 8.40–8.33 (m, 4H), 8.22 (d, J = 1.8 Hz, 1H), 8.08 (d, J = 1.7 Hz, 1H); LRMS (ESI, m/z): 276.1.1 (M + Na-2H)2−.
Sodium 5-(4-(2-nitrobenzamido) benzamido) naphthalene-2-sulfonate (8)
Yield: 67%. 1H NMR (400 MHz, DMSO-d6) δ 11.04 (s, 1H), 10.47 (s, 1H), 8.27 (s, 1H), 8.16 (d, J = 8.2 Hz, 1H), 8.10 (d, J = 8.3 Hz, 2H), 7.91 (t, J = 8.7 Hz, 2H), 7.88–7.78 (m, 4H), 7.75 (t, J = 8.7 Hz, 2H), 7.55 (d, J = 4.8 Hz, 2H); LRMS (ESI, m/z): 492.1 (M + H)+.
Sodium 5-(4-(4-nitrobenzamido) benzamido) naphthalene-2-sulfonate (9)
Yield: 72%. 1H NMR (400 MHz, DMSO-d6) δ 10.86 (s, 1H), 10.46 (s, 1H), 8.42–8.34 (m, 2H), 8.29–8.19 (m, 3H), 8.11 (d, J = 8.2 Hz, 2H), 7.98 (d, J = 8.4 Hz, 2H), 7.91 (dd, J = 8.8, 2.9 Hz, 1H), 7.84 (q, J = 4.3 Hz, 1H), 7.73 (d, J = 8.6 Hz, 1H), 7.54 (d, J = 4.3 Hz, 2H); LRMS (ESI, m/z): 490.1 (M-H)−.
Sodium 8-(4-(4-nitrobenzamido) benzamido) naphthalene-1,3,6-trisulfonate (10)
Yield: 72%. 1H NMR (400 MHz, DMSO-d6) δ 12.43 (s, 1H), 10.96 (s, 1H), 8.58 (d, J = 1.5 Hz, 1H), 8.47 (d, J = 1.5 Hz, 1H), 8.34 (d, J = 8.7 Hz, 2H), 8.25 (d, J = 8.7 Hz, 2H), 8.20–8.13 (m, 3H), 8.02 (s, 1H), 7.95 (d, J = 8.6 Hz, 2H); LRMS (ESI, m/z): 650.1 (M-H)-, 324.8 (M-2H)2−.
Sodium 8-(5-nitrothiophene-2-carboxamido) naphthalene-1,3,6-trisulfonate (19)
Yield: 76%. 1H NMR (400 MHz, DMSO-d6) δ 12.99 (s, 1H), 8.58 (d, J = 2.0 Hz, 1H), 8.46 (d, J = 1.8 Hz, 1H), 8.21 (s, 2H), 8.16 (d, J = 2.0 Hz, 1H), 8.03 (d, J = 1.9 Hz, 1H). ); LRMS (ESI, m/z): 580.8 (M+2Na-H)−.
General hydrogenation procedure and synthesis of amino derivatives 6, 7, 11, 12, 13, and 20
Sodium 5-(4-aminobenzamido) naphthalene-2-sulfonate (6)
In 65 ml of water, sodium 5-(4-nitrobenzamido) naphthalene-2-sulfonate 4 (5 g, 12.68 mmol) was dissolved and bubbled by hydrogen and then palladium or carbon (500 mg, 10% of the weight of the nitro compound) was added as a catalyst. After the reduction completion, filtration methods were used for the removal of the palladium catalyst. The water phase was removed. The isolated yield was 82% (3.78 g). 1H NMR (400 MHz, DMSO-d6) δ 10.03 (s, 1H), 8.23 (s, 1H), 7.89 (d, J = 8.6 Hz, 1H), 7.80 (d, J = 8.4 Hz, 3H), 7.71 (d, J = 8.4 Hz, 1H), 7.59–7.42 (m, 2H), 6.62 (d, J = 8.4 Hz, 2H), 5.76 (s, 2H); LRMS (ESI, m/z): 341.1 (M-H)−.
Sodium 8-(4-aminobenzamido) naphthalene-1,3,6-trisulfonate (7)
Yield: 83%. 1H NMR (600 MHz, DMSO-d6) δ 12.07 (s, 1H), 8.55 (s, 1H), 8.39 (s, 1H), 8.16 (s, 1H), 7.96 (s, 1H), 7.85 (d, J = 8.3 Hz, 2H), 6.59 (d, J = 8.3 Hz, 2H), 5.65 (s, 2H); LRMS (ESI, m/z): 545.0 (M+2Na-H)−.
Sodium 5-(4-(2-aminobenzamido) benzamido) naphthalene-2-sulfonate (11)
Yield: 82%. 1H NMR (400 MHz, DMSO-d6) δ 10.42 (s, 1H), 10.28 (s, 1H), 8.26 (s, 1H), 8.07 (d, J = 8.7 Hz, 2H), 7.91 (dd, J = 8.7, 2.1 Hz, 3H), 7.83 (t, J = 8 Hz, 1H), 7.73 (dd, J = 8.5, 1.3 Hz, 1H), 7.67 (d, J = 7.1 Hz, 1H), 7.54 (d, J = 5.2 Hz, 2H), 7.21 (t, J = 8.2 Hz, 1H), 6.76 (d, J = 8.1 Hz, 1H), 6.60 (t, J = 7.4 Hz, 1H), 6.37 (s, 2H); LRMS (ESI, m/z): 462.1 (M + H)+.
Sodium 5-(4-(4-aminobenzamido) benzamido) naphthalene-2-sulfonate (12)
Yield: 70%. 1H NMR (400 MHz, DMSO-d6) δ 10.38 (s, 1H), 10.04 (s, 1H), 8.25 (s, 1H), 8.05 (d, J = 8.5 Hz, 2H), 7.93 (dd, J = 15.9, 8.5 Hz, 3H), 7.83 (dd, J = 6.1, 3.4 Hz, 1H), 7.74 (t, J = 9.4 Hz, 3H), 7.59–7.50 (m, 2H), 6.61 (d, J = 8.2 Hz, 2H), 5.80 (s, 2H); LRMS (ESI, m/z): 460.1 (M-H)−.
Sodium 8-(4-(4-aminobenzamido) benzamido) naphthalene-1,3,6-trisulfonate (13)
Yield: 75%. 1H NMR (600 MHz, DMSO-d6) δ 12.38 (s, 1H), 10.05 (s, 1H), 8.57 (s, 1H), 8.45 (s, 1H), 8.15 (s, 1H), 8.10 (d, J = 8.0 Hz, 2H), 7.98 (s, 1H), 7.91–7.88 (m, 2H), 7.75 (d, J = 7.4 Hz, 2H), 6.61 (d, J = 7.4 Hz, 2H), 5.81 (s, 2H); LRMS (ESI, m/z): 620.1 (M-H)−.
Sodium 8-(5-aminothiophene-2-carboxamido) naphthalene-1,3,6-trisulfonate (20)
Yield: 80%. 1H NMR (400 MHz, DMSO-d6) δ 12.14 (s, 1H), 8.60 (s, 1H), 8.55 (s, 1H), 8.18 (s, 1H), 7.96 (s, 1H), 7.74 (d, J = 3.6 Hz, 1H), 6.36 (s, 2H), 5.93 (d, J = 3.6 Hz, 1H).
Synthesis of urea derivatives 14, 15, 17, 18, and 21 and isocyanate compound 16.
Sodium 5,5'-((4,4'-(carbonylbis (azanediyl)) bis (benzoyl)) bis (azanediyl)) bis (naphthalene-2-sulfonate) (14)
In 10 ml water, sodium 5-(4-aminobenzamido) naphthalene-2-sulfonate 6 (1 g, 2.74 mmol) was dissolved, and the solution was adjusted to pH 4.0 using 2 M Na2CO3 solution. Triphosgene (0.4 g, 1.37 mmol), dissolved in 5 ml toluene, was added to the reaction mixture slowly by stirring.
Toluene was removed after the completion of the reaction from the water layer, and then the water phase was neutralized using 2 M Na2CO3. Under vacuum, the water phase was evaporated. The crude product was purified by washing with methanol (2 × 5 ml) to obtain a pure compound in 65% (1.34 g). 1H NMR (400 MHz, DMSO-d6) δ 10.41 (s, 2H), 10.18 (s, 2H), 8.28 (s, 2H), 8.06 (d, J = 7.8 Hz, 4H), 7.93 (d, J = 8.3 Hz, 2H), 7.86–7.81 (m, 2H), 7.75 (d, J = 8.3 Hz, 2H), 7.68 (d, J = 7.8 Hz, 4H), 7.58–7.51 (m, 4H); 13C NMR (400 MHz, DMSO-d6) δ 166.1, 153.0, 145.6, 143.6, 135.3, 134.0, 129.4, 129.3, 128.1, 127.6, 126.5, 126.3, 125.2, 124.4, 120.3, and 117.4; LRMS (ESI, m/z): 755.0 (M + H)+; HRMS (ESI) calcd for C35H24N4NaO9S2 m/z: 731.0882; found 731.0885 (M + Na-H)−; C35H24N4O9S2 m/z: 708.0984; found 708.0968 (M-2H)2−.
Sodium 8,8'-((4,4'-(carbonylbis (azanediyl)) bis (benzoyl)) bis (azanediyl))bis (naphthalene-1,3,6-trisulfonate) (15)
Yield: 73%. 1H NMR (400 MHz, DMSO-d6) δ 12.32 (s, 2H), 9.80 (s, 2H), 8.56 (d, J = 1.9 Hz, 2H), 8.42 (d, J = 1.8 Hz, 2H), 8.15 (d, J = 1.8 Hz, 2H), 8.09 (d, J = 8.8 Hz, 4H), 7.98 (d, J = 1.7 Hz, 2H), 7.59 (d, J = 8.8 Hz, 4H); 13C NMR (400 MHz, DMSO-d6) δ 165.3, 153.2, 145.1, 143.5, 143.4, 142.0, 134.9, 133.9, 129.4, 128.7, 128.5, 126.5, 122.9, 122.5, and 117.3; LRMS (ESI, m/z): 514.0 (M-2H)2−.
Sodium 5-(4-(2-isocyanatobenzamido) benzamido) naphthalene-2-sulfonate (16)
Yield: 71%. 1H NMR (400 MHz, DMSO-d6) δ 11.61 (s, 1H), 10.64 (s, 1H), 8.32 (s, 1H), 8.15 (d, J = 7.0 Hz, 2H), 7.95 (dd, J = 14.2, 8.1 Hz, 2H), 7.86 (d, J = 8 Hz, 2H), 7.73 (dd, J = 18.1, 7.7 Hz, 2H), 7.59–7.53 (m, 3H), 7.30–7.19 (m, 2H); 13C NMR (400 MHz, DMSO-d6) δ 166.3, 162.5, 150.4, 145.9, 140.3, 139.1, 135.7, 134.9, 134.7, 134.0, 129.7, 129.1, 128.7, 128.2, 128.0, 126.6, 126.5, 125.1, 124.5, 123.0, 120.0, 115.7, and 114.7; LRMS (ESI, m/z): 486.0 (M-H)−; HRMS (ESI) calcd for C49H37N6Na1O11S2 m/z: 972.1859; found 972.1459 (M-H)−.
Sodium 5,5'-((4,4'-((4,4'-(carbonylbis (azanediyl)) bis (benzoyl)) bis (azanediyl)) bis (benzoyl)) bis(azanediyl)) bis (naphthalene-2-sulfonate) (17)
Yield: 73%. 1H NMR (400 MHz, DMSO-d6): δ 10.62 (s, 2H), 10.47 (s, 2H), 10.41 (s, 2H), 8.34 (s, 2H), 8.19 (s, 2H), 8.10 (d, J = 8.5 Hz, 4H), 8.05–7.97 (m, 6H), 7.95 (d, J = 8.9 Hz, 2H), 7.89 (d, J = 8.0 Hz, 2H), 7.76–7.71 (m, 2H), 7.67 (d, J = 8.3 Hz, 4H), 7.61 (d, J = 6.8 Hz, 2H), 7.55 (t, J = 7.7 Hz, 2H); 13C NMR (400 MHz, DMSO-d6) δ 166.3, 165.8, 152.8, 145.4, 145.1, 143.5, 142.9, 134.2, 133.3, 129.5, 129.4, 129.2, 129.0, 127.7, 127.3, 126.6, 125.1, 124.9, 124.0, 123.7, 120.0, and 117.5; LRMS (ESI, m/z): 947.2 (M-H)-, 473.3 (M-2H)2-; HRMS (ESI) calcd for C49H36N6O11S2 m/z: 947.1811; found 947.1885 (M-H)−.
Sodium 8,8'-((4,4'-((4,4'-(carbonylbis (azanediyl)) bis (benzoyl)) bis (azanediyl)) bis (benzoyl)) bis(azanediyl)) bis (naphthalene-1,3,6-trisulfonate) (18)
Yield: 70%. 1H NMR (600 MHz, DMSO-d6) δ 12.38 (s, 2H), 10.42 (s, 2H), 9.92 (s, 2H), 8.58 (s, 2H), 8.45 (s, 2H), 8.19 (s, 2H), 8.13 (d, J = 7.1 Hz, 4H), 8.02 (s, 2H), 8.01–7.96 (m, 4H), 7.95–7.88 (m, 4H), 7.64 (s, 4H); LRMS (ESI, m/z): 677.3 (M+4Na-2H)2−
Sodium 8,8'-((5,5'-(carbonylbis (azanediyl)) bis (thiophene-5,2-diyl-2-carbonyl)) bis (azanediyl)) bis (naphthalene-1,3,6-trisulfonate) (21)
Yield: 70%. 1H NMR (400 MHz, DMSO-d6) δ 12.38 (s, 4H), 8.57 (d, J = 6.9 Hz, 4H), 8.14 (s, 2H), 7.95 (d, J = 6.9 Hz, 4H), 6.60 (s, 2H); LRMS (ESI, m/z): 519.9 (M-2H)2−.
The NMR results for all the compounds are shown in the supporting file Supplementary Figure S1.
Exposure Stability Studies
The stability of the compounds was verified in both aqueous and DMSO solutions. In aqueous medium, the stability of the suramin derivatives 15 and 18 were considered to verify the stability. A control experiment consisting of a DMSO-d6 (0.017 mol/L) solution of 15 and a D2O solution of 15 (0.017 mol/L) was maintained on the laboratory bench. All experiments were performed in NMR tubes containing 0.017 mol/L solutions of compounds 15 and 18 in DMSO-d6 and D2O, respectively. NMR spectra were recorded over 11 days (initially daily for 1 week). As shown in the 1H NMR spectra, the suramin derivatives 15 and 18 were remarkably stable under these solutions (Supplementary Figure S2).
Exposure Stability Study in DMSO
10 mg of the newly synthesized compound was diluted in 500 µL DMSO-d6 under investigation in a 5-mm NMR tube. The procedure was maintained as it is for 11 days in the solution. The 1H NMR spectrum was recorded daily for 4 days up to 11 days.
Exposure Stability Study in Water
10 mg of the novel compound was diluted in 500 µL D2O under investigation in a 5-mm NMR tube. The procedure was maintained as it is for 11 days in the solution. The 1H NMR spectrum was recorded daily for 4 days up to 11 days.
Characterization of the Novel Compounds
The physical properties of new compounds were determined to define accurate mass data using high-resolution mass spectrometry (HRMS) to support the molecular formula assignment.
Sodium 5-(4-nitrobenzamido) naphthalene-2-sulfonate (4)
In 100 ml water, 5-amino-2-naphthalenesulfonic acid (5 g, 22.42 mmol) was dissolved, and the solution was adjusted to pH 4 by adding 2 M Na2CO3 solution. Next, 4-nitrobenzoylchloride 2 (5.80 g, 31.38 mmol) was dissolved in 10 ml toluene and was added slowly by stirring to the reaction mixture.
When the coupling reaction was completed, toluene was removed from the reaction mixture. The pH of the water phase solution was adjusted to 2.0, and diethyl ether was used for the extraction of the water phase (4 × 70 ml). Under vacuum, the water phase was removed after the neutralization of the solution to pH 7.0. The crude product was purified by recrystallization from methanol in 80% isolated yield (7.06 g). Brown solid; 1H NMR (400 MHz, DMSO-d6) δ 10.86 (s, 1H), 8.46–8.27 (m, 4H), 8.25 (s, 1H), 7.90 (dd, J = 23.3, 8.1 Hz, 2H), 7.75 (dd, J = 8.6, 1.7 Hz, 1H), 7.65–7.52 (m, 2H); LRMS (ESI, m/z): 371.1 (M-H)−.
Sodium 8-(4-nitrobenzamido) naphthalene-1, 3, 6-trisulfonate (5)
Yellow solid; Yield: 82%. 1H NMR (400 MHz, DMSO-d6) δ 12.73 (s, 1H), 8.60 (d, J = 1.9 Hz, 1H), 8.47 (d, J = 1.7 Hz, 1H), 8.40–8.33 (m, 4H), 8.22 (d, J = 1.8 Hz, 1H), 8.08 (d, J = 1.7 Hz, 1H); LRMS (ESI, m/z): 276.1.1 (M + Na-2H)2−.
Sodium 5-(4-(2-nitrobenzamido) benzamido) naphthalene-2-sulfonate (8)
Brown solid; Yield: 67%. 1H NMR (400 MHz, DMSO-d6) δ 11.04 (s, 1H), 10.47 (s, 1H), 8.27 (s, 1H), 8.16 (d, J = 8.2 Hz, 1H), 8.10 (d, J = 8.3 Hz, 2H), 7.91 (t, J = 8.7 Hz, 2H), 7.88–7.78 (m, 4H), 7.75 (t, J = 8.7 Hz, 2H), 7.55 (d, J = 4.8 Hz, 2H); LRMS (ESI, m/z): 492.1 (M + H)+.
Sodium 5-(4-(4-nitrobenzamido) benzamido) naphthalene-2-sulfonate (9)
Brown solid; Yield: 72%. 1H NMR (400 MHz, DMSO-d6) δ 10.86 (s, 1H), 10.46 (s, 1H), 8.42–8.34 (m, 2H), 8.29–8.19 (m, 3H), 8.11 (d, J = 8.2 Hz, 2H), 7.98 (d, J = 8.4 Hz, 2H), 7.91 (dd, J = 8.8, 2.9 Hz, 1H), 7.84 (q, J = 4.3 Hz, 1H), 7.73 (d, J = 8.6 Hz, 1H), 7.54 (d, J = 4.3 Hz, 2H); LRMS (ESI, m/z): 490.1 (M-H)−.
Sodium 8-(4-(4-nitrobenzamido) benzamido) naphthalene-1,3,6-trisulfonate (10)
White solid; Yield: 72%. 1H NMR (400 MHz, DMSO-d6) δ 12.43 (s, 1H), 10.96 (s, 1H), 8.58 (d, J = 1.5 Hz, 1H), 8.47 (d, J = 1.5 Hz, 1H), 8.34 (d, J = 8.7 Hz, 2H), 8.25 (d, J = 8.7 Hz, 2H), 8.20–8.13 (m, 3H), 8.02 (s, 1H), 7.95 (d, J = 8.6 Hz, 2H); LRMS (ESI, m/z): 650.1 (M-H)-, 324.8 (M-2H)2−.
Sodium 8-(5-nitrothiophene-2-carboxamido) naphthalene-1,3,6-trisulfonate (19)
Yellow solid; Yield: 76%. 1H NMR (400 MHz, DMSO-d6) δ 12.99 (s, 1H), 8.58 (d, J = 2.0 Hz, 1H), 8.46 (d, J = 1.8 Hz, 1H), 8.21 (s, 2H), 8.16 (d, J = 2.0 Hz, 1H), 8.03 (d, J = 1.9 Hz, 1H). ); LRMS (ESI, m/z): 580.8 (M+2Na-H)−.
Sodium 5-(4-aminobenzamido) naphthalene-2-sulfonate (6)
In 65 ml of water, sodium 5-(4-nitrobenzamido) naphthalene-2-sulfonate 4 (5 g, 12.68 mmol) was dissolved and bubbled by hydrogen, and then palladium or carbon was added as catalysts (500 mg, 10% of the weight of the nitro compound). When the reduction was completed, the palladium catalyst was removed by the filtration method. The water phase was removed. The isolated yield was 82% (3.78 g). Brown solid; 1H NMR (400 MHz, DMSO-d6) δ 10.03 (s, 1H), 8.23 (s, 1H), 7.89 (d, J = 8.6 Hz, 1H), 7.80 (d, J = 8.4 Hz, 3H), 7.71 (d, J = 8.4 Hz, 1H), 7.59–7.42 (m, 2H), 6.62 (d, J = 8.4 Hz, 2H), 5.76 (s, 2H); LRMS (ESI, m/z): 341.1 (M-H)−.
Sodium 8-(4-aminobenzamido) naphthalene-1,3,6-trisulfonate (7)
Yellow solid; Yield: 83%. 1H NMR (600 MHz, DMSO-d6) δ 12.07 (s, 1H), 8.55 (s, 1H), 8.39 (s, 1H), 8.16 (s, 1H), 7.96 (s, 1H), 7.85 (d, J = 8.3 Hz, 2H), 6.59 (d, J = 8.3 Hz, 2H), 5.65 (s, 2H); LRMS (ESI, m/z): 545.0 (M+2Na-H)−.
Sodium 5-(4-(2-aminobenzamido) benzamido) naphthalene-2-sulfonate (11)
Brown solid; Yield: 82%. 1H NMR (400 MHz, DMSO-d6) δ 10.42 (s, 1H), 10.28 (s, 1H), 8.26 (s, 1H), 8.07 (d, J = 8.7 Hz, 2H), 7.91 (dd, J = 8.7, 2.1 Hz, 3H), 7.83 (t, J = 8 Hz, 1H), 7.73 (dd, J = 8.5, 1.3 Hz, 1H), 7.67 (d, J = 7.1 Hz, 1H), 7.54 (d, J = 5.2 Hz, 2H), 7.21 (t, J = 8.2 Hz, 1H), 6.76 (d, J = 8.1 Hz, 1H), 6.60 (t, J = 7.4 Hz, 1H), 6.37 (s, 2H); LRMS (ESI, m/z): 462.1 (M + H)+.
Sodium 5-(4-(4-aminobenzamido) benzamido) naphthalene-2-sulfonate (12)
Compound 12 was synthesized from sodium 5-(4-(4-nitrobenzamido) benzamido) naphthalene-2-sulfonate 9 according to the method described for the synthesis of sodium 5-(4-aminobenzamido ) naphthalene-2-sulfonate 6. Brown solid; Yield: 70%. 1H NMR (400 MHz, DMSO-d6) δ 10.38 (s, 1H), 10.04 (s, 1H), 8.25 (s, 1H), 8.05 (d, J = 8.5 Hz, 2H), 7.93 (dd, J = 15.9, 8.5 Hz, 3H), 7.83 (dd, J = 6.1, 3.4 Hz, 1H), 7.74 (t, J = 9.4 Hz, 3H), 7.59–7.50 (m, 2H), 6.61 (d, J = 8.2 Hz, 2H), 5.80 (s, 2H); LRMS (ESI, m/z): 460.1 (M-H)−.
Sodium 8-(4-(4-aminobenzamido) benzamido) naphthalene-1,3,6-trisulfonate (13)
White solid; Yield: 75%. 1H NMR (600 MHz, DMSO-d6) δ 12.38 (s, 1H), 10.05 (s, 1H), 8.57 (s, 1H), 8.45 (s, 1H), 8.15 (s, 1H), 8.10 (d, J = 8.0 Hz, 2H), 7.98 (s, 1H), 7.91–7.88 (m, 2H), 7.75 (d, J = 7.4 Hz, 2H), 6.61 (d, J = 7.4 Hz, 2H), 5.81 (s, 2H); LRMS (ESI, m/z): 620.1 (M-H)−.
Sodium 8-(5-aminothiophene-2-carboxamido) naphthalene-1,3,6-trisulfonate (20)
Yellow solid; Yield: 80%. 1H NMR (400 MHz, DMSO-d6) δ 12.14 (s, 1H), 8.60 (s, 1H), 8.55 (s, 1H), 8.18 (s, 1H), 7.96 (s, 1H), 7.74 (d, J = 3.6 Hz, 1H), 6.36 (s, 2H), 5.93 (d, J = 3.6 Hz, 1H).
Sodium 5,5'-((4,4'-(carbonylbis (azanediyl)) bis (benzoyl)) bis (azanediyl)) bis (naphthalene-2-sulfonate) (14)
In 10 ml of water, sodium 5-(4-aminobenzamido) naphthalene-2-sulfonate 6 (1 g, 2.74 mmol) was dissolved, and the solution was adjusted to pH 4 by using solution of 2 M Na2CO3. 5 ml toluene in which triphosgene (0.4 g, 1.37 mmol) was dissolved was added slowly by stirring in the reaction mixture.
Toluene was removed from the water layer after the reaction was completed, and by using the 2 M Na2CO3, the water phase was neutralized. Under vacuum, evaporation of the water phase was performed, and the purification of the crude product was carried out by washing with methanol (2 × 5 ml) to obtain a pure compound in 65% (1.34 g). Brown solid; 1H NMR (400 MHz, DMSO-d6) δ 10.41 (s, 2H), 10.18 (s, 2H), 8.28 (s, 2H), 8.06 (d, J = 7.8 Hz, 4H), 7.93 (d, J = 8.3 Hz, 2H), 7.86–7.81 (m, 2H), 7.75 (d, J = 8.3 Hz, 2H), 7.68 (d, J = 7.8 Hz, 4H), 7.58–7.51 (m, 4H); 13C NMR (400 MHz, DMSO-d6) δ 166.1, 153.0, 145.6, 143.6, 135.3, 134.0, 129.4, 129.3, 128.1, 127.6, 126.5, 126.3, 125.2, 124.4, 120.3, and 117.4; LRMS (ESI, m/z): 755.0 (M + H)+; HRMS (ESI) calcd for C35H24N4NaO9S2 m/z: 731.0882; found 731.0885 (M + Na-H)-; C35H24N4O9S2 m/z: 708.0984; found 708.0968 (M-2H)2−.
Sodium 8,8'-((4,4'-(carbonylbis (azanediyl)) bis (benzoyl)) bis (azanediyl)) bis (naphthalene-1,3,6-trisulfonate) (15)
White solid; Yield: 73%. 1H NMR (400 MHz, DMSO-d6) δ 12.32 (s, 2H), 9.80 (s, 2H), 8.56 (d, J = 1.9 Hz, 2H), 8.42 (d, J = 1.8 Hz, 2H), 8.15 (d, J = 1.8 Hz, 2H), 8.09 (d, J = 8.8 Hz, 4H), 7.98 (d, J = 1.7 Hz, 2H), 7.59 (d, J = 8.8 Hz, 4H); 13C NMR (400 MHz, DMSO-d6) δ 165.3, 153.2, 145.1, 143.5, 143.4, 142.0, 134.9, 133.9, 129.4, 128.7, 128.5, 126.5, 122.9, 122.5, and 117.3; LRMS (ESI, m/z): 514.0 (M-2H)2−.
Sodium 5-(4-(2-isocyanatobenzamido) benzamido) naphthalene-2-sulfonate (16)
White solid; Yield: 71%. 1H NMR (400 MHz, DMSO-d6) δ 11.61 (s, 1H), 10.64 (s, 1H), 8.32 (s, 1H), 8.15 (d, J = 7.0 Hz, 2H), 7.95 (dd, J = 14.2, 8.1 Hz, 2H), 7.86 (d, J = 8 Hz, 2H), 7.73 (dd, J = 18.1, 7.7 Hz, 2H), 7.59–7.53 (m, 3H), 7.30–7.19 (m, 2H); 13C NMR (400 MHz, DMSO-d6) δ 166.3, 162.5, 150.4, 145.9, 140.3, 139.1, 135.7, 134.9, 134.7, 134.0, 129.7, 129.1, 128.7, 128.2, 128.0, 126.6, 126.5, 125.1, 124.5, 123.0, 120.0, 115.7, and 114.7; LRMS (ESI, m/z): 486.0 (M-H)-; HRMS (ESI) calcd for C49H37N6Na1O11S2 m/z: 972.1859; found 972.1459 (M-H)−.
Sodium 5,5'-((4,4'-((4,4'-(carbonylbis (azanediyl)) bis (benzoyl)) bis (azanediyl)) bis (benzoyl)) bis (azanediyl)) bis (naphthalene-2-sulfonate) (17)
Brown solid; Yield: 73%. 1H NMR (400 MHz, DMSO-d6) δ 10.62 (s, 2H), 10.47 (s, 2H), 10.41 (s, 2H), 8.34 (s, 2H), 8.19 (s, 2H), 8.10 (d, J = 8.5 Hz, 4H), 8.05–7.97 (m, 6H), 7.95 (d, J = 8.9 Hz, 2H), 7.89 (d, J = 8.0 Hz, 2H), 7.76–7.71 (m, 2H), 7.67 (d, J = 8.3 Hz, 4H), 7.61 (d, J = 6.8 Hz, 2H), 7.55 (t, J = 7.7 Hz, 2H); 13C NMR (400 MHz, DMSO-d6) δ 166.3, 165.8, 152.8, 145.4, 145.1, 143.5, 142.9, 134.2, 133.3, 129.5, 129.4, 129.2, 129.0, 127.7, 127.3, 126.6, 125.1, 124.9, 124.0, 123.7, 120.0, 117.5; LRMS (ESI, m/z): 947.2 (M-H)-, 473.3 (M-2H)2-; HRMS (ESI) calcd for C49H36N6O11S2 m/z: 947.1811; found 947.1885 (M-H)−.
Sodium 8,8'-((4,4'-((4,4'-(carbonylbis (azanediyl)) bis (benzoyl)) bis (azanediyl)) bis (benzoyl)) bis (azanediyl)) bis (naphthalene-1,3,6-trisulfonate) (18)
White solid; Yield: 70%. 1H NMR (600 MHz, DMSO-d6) δ 12.38 (s, 2H), 10.42 (s, 2H), 9.92 (s, 2H), 8.58 (s, 2H), 8.45 (s, 2H), 8.19 (s, 2H), 8.13 (d, J = 7.1 Hz, 4H), 8.02 (s, 2H), 8.01–7.96 (m, 4H), 7.95–7.88 (m, 4H), 7.64 (s, 4H); LRMS (ESI, m/z): 677.3 (M+4Na-2H)2−
Sodium 8,8'-((5,5'-(carbonylbis (azanediyl)) bis (thiophene-5,2-diyl-2-carbonyl)) bis (azanediyl)) bis (naphthalene-1,3,6-trisulfonate) (21)
Yellow solid; Yield: 70%. 1H NMR (400 MHz, DMSO-d6) δ 12.38 (s, 4H), 8.57 (d, J = 6.9 Hz, 4H), 8.14 (s, 2H), 7.95 (d, J = 6.9 Hz, 4H), 6.60 (s, 2H); LRMS (ESI, m/z): 519.9 (M-2H)2−.
Purification of FGF1 and FGFR Proteins
The expression and the purification of FGF1 and FGFRD2 together with the respective experimental procedures are reported in the literature (Wu et al., 2016). The purification of the protein was performed using HPLC, and the protein band was confirmed by SDS-PAGE followed by electrospray ionization (ESI)-mass spectroscopy, and the results are shown in Supplementary Figures S3–S5.
Sample Preparation for the NMR Experiments
A minimal (M9) medium with 15NH4Cl was prepared to obtain 15N isotope labeling. The same concentration of vitamins was added to the M9 medium for the maximum expression yield. Thiamine was added in the medium as the host strain BL21 (DE3) and pLyss does not have a sufficient amount of vitamin B1.
NMR Experiments
The NMR experiment was performed on a Varian 700-MHz equipped with a cryoprobe spectrometer. A concentration of approximately 0.5 mM was used for the 1H-15N heteronuclear single quantum coherence (HSQC) experiments. The buffer used for the sample preparation contained 10% D2O, 50 mM AMS, 20 mM phosphate buffer, and 50 mM NaCl at pH 6.5.
Docking Experiments
Docking of FGF1 and the synthesized compounds was performed using the software HADDOCK (Chang et al., 2016; Khan et al., 2018). The PDB files for the HADDOCK experiment were all obtained from the Protein Data Bank with the following ID’s: FGF1: 1BAR and FGF1-D2 complex: 3CU1. The PDB files for the suramin derivatives were generated using PyMOL (DeLano, 2020).
Fluorescence Spectroscopy
The binding constant Kd was calculated for FGF1 and the five derivatives in a buffer containing 10% D2O, 50 mM AMS, 20 mM phosphate buffer, and 50 mM NaCl at pH 6.5 using an F-2500 Hitachi fluorescence spectrophotometer.
Water-Soluble Tetrazolium Salt Assay for Cell Proliferation and Cytotoxicity
The water-soluble tetrazolium salt (WST-1) assay was performed to assess the effects of the compounds on cell proliferation and cytotoxicity. DMEM/F12 containing 10% FBS was used for the cell culture, and incubation was performed in 5% CO2 till the logarithmic growth phase was achieved. On the day before the experiment, the cells were trypsinized and seeded in a 96-well plate at a density of 5000 cells/well. For the FGF1-stimulated cell proliferation assay, the cells were then incubated for 24 h in a serum-free medium containing 0.1% bovine serum albumin (BSA). Serum-starved cells with or without a specified concentration of suramin, 14, 15, 17, 18, 21, and FGFRD2 were stimulated with 100 nM of FGF1 again for 48 h. For the purpose of the cytotoxicity assay, the cells were treated with an increased concentration of suramin and compounds 14, 17, 15, 18, and 21 (Figure 6) for 48 h. Also, 1/10 of the volume of WST-1 cell reagent was inserted in every well and maintained at 37°C for another 4 h before harvesting. There was gentle agitation of the medium in the cell culture plate for 10 min using a shaker. A Synergy 2 microplate reader (BioTek Instruments, Inc., VT, United States) was used to measure the absorbance at 450 nm. The relative absorbance was compared with the control treatment to determine the relative cell number.
Results and Discussion
Suramin is used successfully for onchocerciases treatment and parasitic infections. In particular, suramin has been tested for NSCLC’s, prostate cancer, and brain tumors. Most studies have been carried out based on suramin’s capability to behave as an antagonist against growth factors that are frequently overexpressed by tumors. Suramin and its five derivatives indicated in Figure 1 show strong antitumor activity and a capacity to disrupt the interaction of FGF1 from its receptors of the D2 and D3 domains of the FGFR (Sola et al., 1999; Zamai et al., 2002; Manetti et al., 2005).
Characterization of Suramin Analog Binding Sites on FGF1
The NMR HSQC experiments perform an essential role in the determination of the backbone conformation of a protein. Chemical shift perturbation and decreases in peak intensity occur as shown in the HSQC spectra upon the addition of suramin derivatives to the protein. These changes provide significant data about protein-drug binding and provide insight about the binding site between the protein and drugs (Yu et al., 2003). All the residues that are clearly absent in the tested compounds (14, 15, 17, 18, and 21) represent the backbone amide of FGF1 (Ogura et al., 1999; Chi et al., 2002).
The changes in the residues of the 1H-15N HSQC spectra of FGF1 indicate the putative binding sites of compounds on the protein acquired mostly at 1:1 molar ratio of protein to drug. At a 1:1 ratio of FGF1 to compound 14, three residues in FGF1 display peak disappearance (C16, G20, and Y94), and another three cross-peaks show a decrease in intensity (Y97, L132, and L133), as shown in Figure 2A-1. The side chains of these residues (stick form in blue) are shown in the structure of FGF1 in Figure 2A-2.
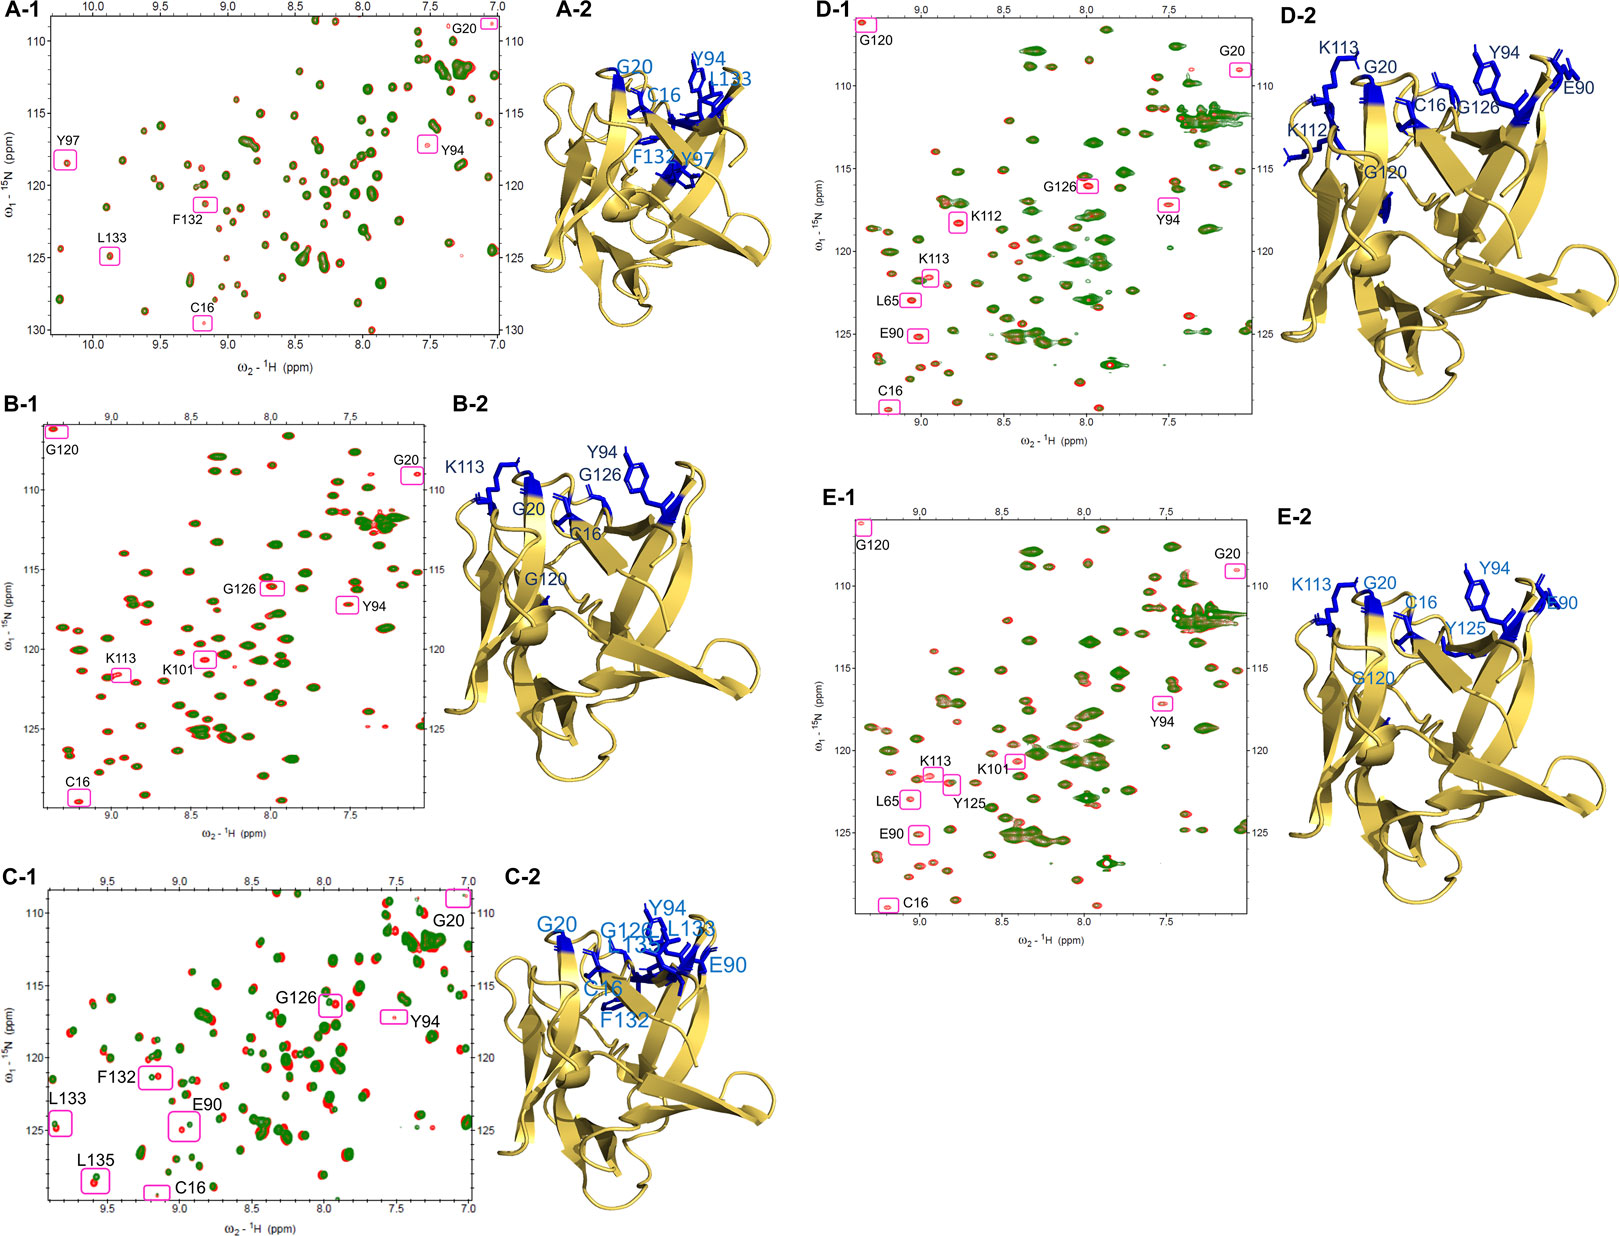
FIGURE 2. HSQC Spectra of free FGF1 (red) overlapped with different compounds to 1: 1 ratio (green): (A-1) HSQC spectrum showing peak intensity decrease and some peak disappearances upon addition of compound 14. (A-2) Residues that shows peak intensity decrease or disappeared are highlighted in blue (side-chain) in the illustration of cartoon form of FGF1. (B-1) HSQC spectrum showing peak intensity decrease and some peak disappearances by compound 15. (B-2) Residues that showing decreased peak intensity or disappeared are highlighted in blue (side-chain) in the illustration of cartoon form of FGF1. (C-1) HSQC spectrum showing perturbation and peak disappearance by compound 17 (green). (C-2) Residues that were perturbed or disappeared are highlighted in blue (side-chain) in the illustration of cartoon form of FGF1. (D-1) HSQC spectrum displaying peak intensity decrease and peak disappearance by compound 18. (D-2) Residues that decrease in their peak intensity or disappeared are highlighted in blue (side-chain) in the illustration of cartoon form of FGF1. (E-1) HSQC spectrum displaying peak intensity decrease and peak disappearance by compound 21. (E-2) Residues showing peak intensity decrease or disappeared are highlighted in blue (side-chain) in the illustration of cartoon form of FGF1.
For the titration of FGF1 and compound 15 at a ratio of 1:1, four residues showed a decrease in peak intensity (C16, Y94, G120, and G126), and three residues showed peak disappearance (G20, K101, and K113) (Figure 2B-1). Representations of the side chains of these residues (stick form in blue) are shown in the structure of FGF1 in Figure 2B-2. At a 1:1 ratio of FGF1 to compound 17, one peak disappeared (Y94) after titration, and seven peaks showed chemical shift perturbation (C16, G20, E90, G126, F132, L133, and L135) (Figure 2C-1). The side chains of the perturbed residues (stick form painted in blue) are illustrated in the structure of FGF1 in Figure 2C-2. The titration of FGF1 and compound 18 at a ratio of 1:1 displayed a decrease in peak intensity for six residues (C16, L65, E90, Y94, K112, and G120), and three residues completely disappeared (G20, K113, and G126) (Figure 2D-1). A representation of the side chains of the altered residues (stick form in blue) is shown in Figure 2D-2. At a 1:0.5 ratio of FGF1 to compound 21, the titration resulted in a decrease in peak intensity for five residues (L65, E90, Y94, K101 and Y125), and four residues showed peak disappearance (C16, G20, K113, and G120) (Figure 2E-1). The side chains of the residues that were altered or disappeared (stick form in blue) are shown in the structure of FGF1 in Figure 2E-2.
The altered residues shown in the HSQC spectra may possibly constitute the binding sites of the derivatives. For all five compounds (14, 15, 17, 18, and 21), the intensities of the altered residues after titration with FGF1 are shown in Figure 2. They mostly constitute the same region of FGF1, which is the interface between FGF1 and FGFRD2 in the X-ray structure of the FGF1–FGFRD2 complex. In addition, derivatives including sulfonated naphthalene showed that five compounds mostly targeted the FGF1-heparin interface (Lozano et al., 1998; Sola et al., 1999; Zamai et al., 2002; Fernández-Tornero et al., 2003; Manetti et al., 2005). Binding between FGF1 and the five ligands was also supported by the fluorescence spectroscopy results, which showed that FGF1 binds to the five ligands (Figure 3).
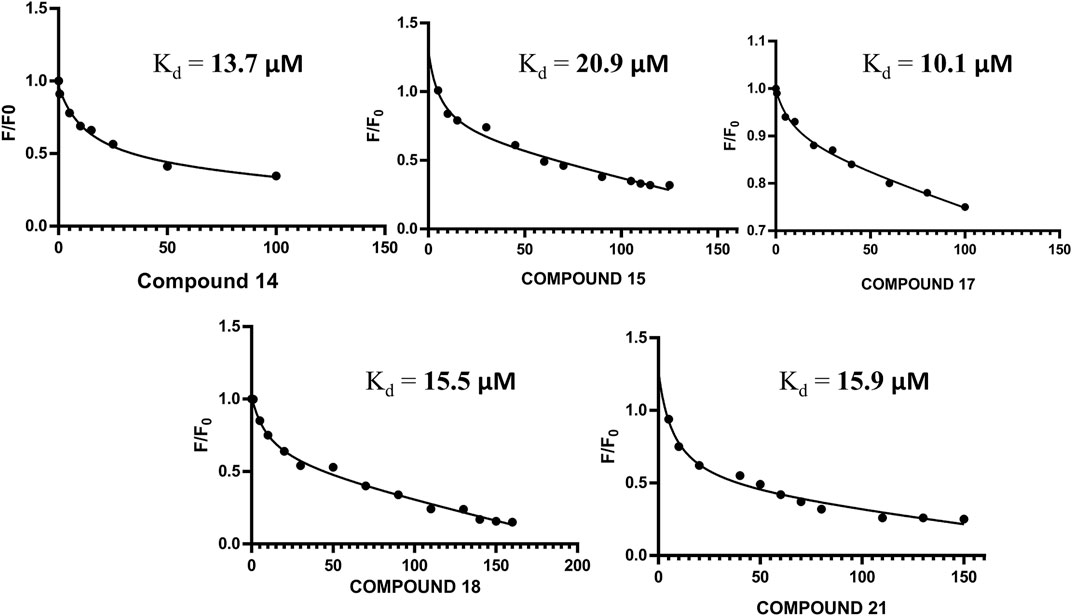
FIGURE 3. (A) Non-linear regression curve for compound 14 and FGF1 with calculated Kd of 13.70 μM. (B) Non-linear regression curve for compound 15 and FGF1 with calculated Kd of 20.9 μM. (C) Non-linear regression curve for compound 17 and FGF1 with calculated Kd of 10.1 μM. (D) Non-linear regression curve for compound 18 and FGF1 with calculated Kd of 15.50 μM. (E) Non-linear regression curve for compound 21 and FGF1 with calculated Kd of 15.9 μM.
Structure–Activity Relationships
Taking suramin as the template, compounds carrying a replacement of the aryl sulfonic acid moieties by mono and trisulfonic acids of naphthalene from compounds 14–18 and the replacement of benzene by thiophene in compound 21 were incorporated in the suramin structure as shown in Figures 1A–E. Five compounds (14–18 and 21) were prepared for biological evaluation as described below in the WST-1 assays for cell proliferation and cytotoxicity. The derivatives (nitro and amino compounds) of the precursor were tested for interactions with FGF1 as shown in Figure 2. The interaction between the derivatives and FGF1 was determined using 1H-15N HSQC experiments. After analyzing the 1H-15N HSQC results, some derivatives displayed the chemical shift perturbation or peak intensity decrease. Considering these changes, HADDOCK simulations were performed and docking results of all the five derivatives (compounds 14, 15, 17, 18, and 21) showed an interaction at the interface region blocking the interaction between FGF1 and its receptor FGFR2D2. To define biological activity of the compounds, we performed the water-soluble tetrazolium salt (WST-1) assay using the breast cancer cell line MCF7 to verify its effects on cell proliferation. After the addition of these five derivatives to FGF1 in the MCF7 cell cultures, cell proliferation was decreased compared to the addition of FGF1 alone. All nitro and amino derivatives bound to and blocked FGF1 activity by decreasing cell proliferation, which indicated an inhibition of the interaction of FGF1 with its receptor FGFRD2.
Mechanism of Action of Compounds 14, 15, 17, 18, and 21
Fluorescence anisotropy has tremendous significance for biochemical application because it provides valuable knowledge about the probability of quencher activity. The anti-mitogenic activity of the five compounds was achieved by the same mechanism in which suramin inhibits the mitogenic activity of FGF1. A non-linear regression curve was plotted for the relative intensities of activity versus drug concentration using the Stern–Volmer equation (Eq. 1).
where F0 represents the fluorescence intensity in the absence of the compounds, and F represents the fluorescence intensity in the presence of the [Q] concentration of the compounds.
Increasing concentrations of these five suramin derivatives were added to a solution containing 5 µM FGF1. A reduction in the fluorescence intensity was reported for all five suramin derivatives. The Stern–Volmer equation was used to calculate the binding constant between FGF1 and compounds 14, 15, 17, 18, and 21 for relative intensities versus the total concentration in a non-linear regression curve.
Docking of FGF1 and Five Compounds and Their Complex Formation
The HADDOCK tool (van Zundert and Bonvin, 2014) is a modular method of docking based on the knowledge of bimolecular simulations. This tool can solve a wide variety of modeling problems encountered in different protein complexes, such as the ligand-protein complex and protein–protein complex. The core principle of HADDOCK is to use experiments to direct the docking and molecular refining of simulations (including, though not limited to, chemical cross linking, mutagenesis data, and NMR data) (van Zundert and Bonvin, 2014; Van Zundert et al., 2016; Imran Khan et al., 2019), such that:
The terms Evdw (intermolecular van der Waals energy), Eelec (intermolecular electrostatic energy), Edesol (empirical desolvation energy), and Eair (ambiguous interaction restraint (AIR) energy) were adapted from the study by Fernandez et al. (de Vries. et al., 2007; Ezgi; Karaca, et al., 2010; Parveen et al., 2020).
HSQC NMR titration results were compared for the binding interface of FGF1with compounds 14, 15, 17, 18, and 21. We found that the maximum number of residues showing peak disappearance/or perturbation after titration with the five suramin derivatives were located in the region of the binding interface between FGF1 and FGFRD2. The five complexes were simulated by structural modeling. The identification of ambiguous interaction restraints (AIRs) was based on differences in intensity from the HSQC results among the compounds and FGF1. The crystal structure of FGF1 for the HADDOCK calculations was obtained from PDB (1BAR), and the five compound PDB structures were created using PyMOL (DeLano, 2020).
The best 200 structures were refined on the basis of their overall lower energy. All 200 complexes were divided into approximately seven clusters for each compound. The first cluster was the most robust due to a high degree of similarity and lower energy of refined water interactions than the other clusters. The HADDOCK complex between FGF1 and the compounds is shown in Figures 4A-1(FGF1 complexed with compound 14), Figure 4B-1 (FGF1 complexed with compound 15), Figure 4C-1 (FGF1 complexed with compound 17), Figure 4D-1 (FGF1 complexed with compound 18), and Figure 4E-1 (FGF1 complexed with compound 21). When these HADDOCK complexes overlapped with the X-ray crystal structure of the FGF1-D2 complex (PDB:3CU1) Figures 4A-2,B-2,C-2,D-2,E-2, it generated tertiary complexes as shown in Figures 4A-3,B-3,C-3,D-3,E-3) with respect to the different compounds 14, 15, 17, 18, and 21. All five compounds effectively blocked the interaction between FGF1 and its receptor D2 of FGFRD2 (Figure 4). The figure shows an overlapped view of the ternary complex of FGF1, the five compounds, and D2 of FGFRD2. These five suramin derivatives block in between the FGF1 and D2 and interrupted the signal transduction cascade and, thus, could interfere with downstream cell proliferation.
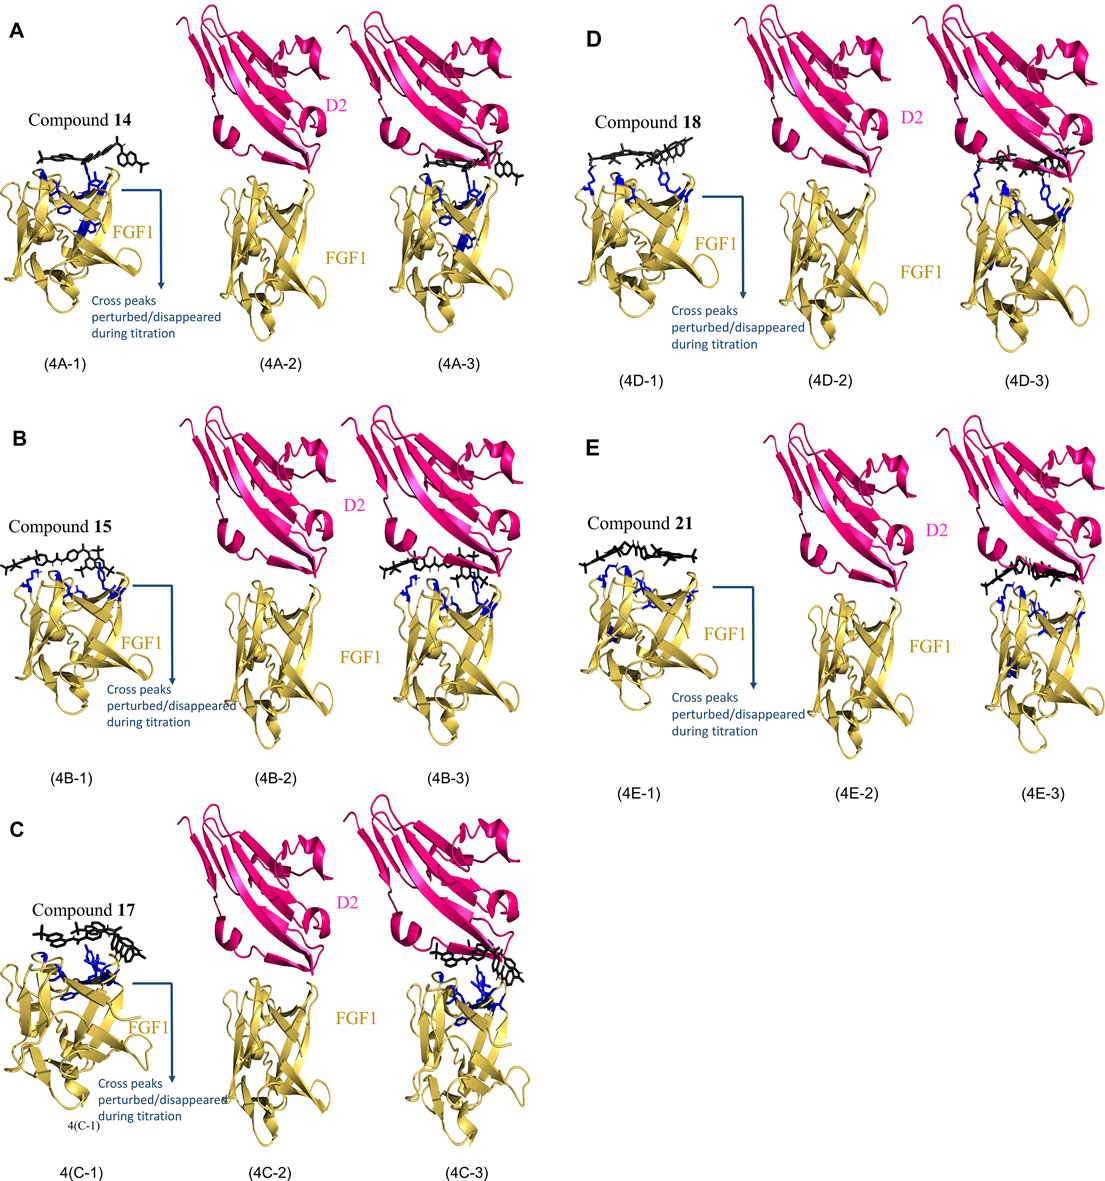
FIGURE 4. HADDOCK results of FGF1 with the five compounds. (4A): (4A-1) Calculated HADDOCK of Compound 14 (black) complex with FGF1 (Yellow) with AIR painted in blue, (4A-2) X-ray crystallographic structure of FGF1 and D2 (PDB ID: 3CU1). (4A-3) overlap of (4A-1) and (4A-2). (4B): (4B-1) Calculated HADDOCK of Compound 15 (black) complex with FGF1 (Yellow) with AIR painted in blue, (4B-2) X-ray crystallographic structure of FGF1 and D2 (PDB ID: 3CU1). (4B-3) overlap of (4B-1) and (4B-2). (4C): (4C-1) Calculated HADDOCK of Compound 17 (black) complex with FGF1 (Yellow) with AIR painted in blue, (4C-2) X-ray crystallographic structure of FGF1 and D2 (PDB ID: 3CU1). (4C-3) overlap of (4C-1) and (4C-2). (4D): (4D-1) Calculated HADDOCK of Compound 18 (black) complex with FGF1 (Yellow) with AIR painted in blue, (4D-2) X-ray crystallographic structure of FGF1 and D2 (PDB ID: 3CU1). (4D-3) overlap of (4D-1) and (4D-2). (4E): (4E-1) Calculated HADDOCK of Compound 21 (black) complex with FGF1 (Yellow) with AIR painted in blue, (4E-2) X-ray crystallographic structure of FGF1 and D2 (PDB ID: 3CU1). (4E-3) overlap of (4E-1) and (4E-2).
In the docking calculations the binding energies between suramin derivatives and proteins were calculated using PRODIGY HADDOCK software. PRODIGY is a webserver used for predicting the protein–protein complex binding affinity, which was initially limited to protein–protein complex interactions, and later was extended to the protein-ligand complex in the PRODIGY-LIG module. The latter predicted the protein-ligand complex affinity by atomic contacts inspite of amino acid contacts. Most of the atomic contacts within a 10.5 Å distance cutoff between the ligand and the protein are considered and grouped on the basis of their atomic interaction (N-nitrogen, C-carbon, O-oxygen, and X-all other atoms). The final predictor models of the binding energy ∆Gscore and ∆Gprediction used to predict the binding affinities and ranking ligands, respectively, are as follows:
∆Gscore = 0.343794 + Eelec−0.037597 * ACCC + 0.138738 * ACNN + 0.160043 * ACOO−3.088861 * ACXX + 187.011384.
∆Gprediction = 0.0115148 * Eelec−0.0014852 ACCC + 0.0057097 * ACNN−0.1301806 * ACXX−5.1002233.
ACCC–(atomic contact between carbon and carbon), ACNN - (atomic contact between nitrogen and nitrogen), ACOO–(atomic contact between oxygen and oxygen), ACXX–(atomic contact between all other atoms).
In PRODIGY-LIG, only atomic contacts are considered, and thus, only ∆Gnoelec was obtained after using this program.
∆Gnoelec = 0.0354707 * ACNN–0.1277895 * ACCC −0.0072166 * ACCN −5.1923181 (Anna Vangone et al., 2019).
The PRODIGY-LIG binding energy calculated for all the five complexes is shown below
FGF1-comp 14, ∆Gnoelec = −7.6 kcal/mol, FGF1-comp 15, ∆Gnoelec = −8.3 kcal/mol, FGF1-comp 17, ∆Gnoelec = −13.8 kcal/mol, FGF1-comp 18, ∆Gnoelec = −8.3 kcal/mol, FGF1-comp 21, ∆Gnoelec = −11.5 kcal/mol.
The interactions between the FGF1 and the five compounds were hydrophobic interactions and in addition, hydrogen bond interaction was identified between the compounds and the protein.
Validation of the HADDOCK Protocol
HADDOCK which has been implemented in the CNS is used to calculate structure interactions using Python scripts. The docking follows the three steps, 1) randomization of orientations and rigid body energy minimization, 2) semi-rigid simulated annealing in torsion angle space (TAD-SA), and 3) final refinement in the Cartesian space with an explicit solvent. The average interaction energies such as van der Waals, desolvation and electrostatic energies, and buried surface area were used to finalize the final structures. HADDOCK simulations were carried out for the five ligand complexes using 1H-15N HSQC perturbation, and the intensity of the decrease in data defined the ambiguous interaction restraints. Only the active ambiguous interaction restraints were used for the HADDOCK simulations. The complexes obtained from the HADDOCK stimulations are shown in Figure 4, and were validated by Ramachandran plots. Ramachandran plots were obtained by the RAMPAGE server (https://zlab.umassmed.edu/bu/rama/where the favored and disallowed regions were calculated. The residues in the favored region for the complex FGF1-comp14 were 99.065%, complex FGF1-comp15 were 92.523%, complex FGF1-comp17 were 97.342%, complex FGF1-comp 18 were 98.131%, and for the complex FGF1-comp21 were 96.177%. The Ramachandran plots for all the five complexes are shown in supporting information Supplementary Figure S6.
Analysis of Cell Proliferation
Cell proliferation was measured using the WST-1 assay. The breast cancer cell line MCF-7 was used, which is known to express the FGFR. As shown in Figure 5, treating serum-starved MCF-7 cells with 100 nM FGF1 significantly stimulated cell proliferation of breast cancer cells. To determine the effects of suramin and its derivatives (compounds 14, 15, 17, 18, and 21) on the disruption of FGF1–EGFRD2-mediated cellular activity, increasing concentrations of 100 nM, 500 nM, and 1 µM were used to treat cells in combination with FGF1. As shown in Figure 5, the results revealed that the FGF1-stimulated cell proliferation could be attenuated by co-treatment with all five suramin derivatives in a dose-dependent manner. Compounds 17 and 14 showed more potent inhibitory effects on FGF1-stimulated cell proliferation. A similar phenomenon was also observed for the suramin-treated group (Figure 5). Exogenous recombinant FGFRD2 protein was used as the control, as the inhibitor could block the interaction between FGF1 and endogenous FGFR2D2 on the cell membrane. A decrease in the cell number was observed in the exogenous FGFRD2 competition group (Figure 5). These data indicated that suramin and its derivatives attenuated FGF1-stimulated cell proliferation likely through the disruption of the interaction between FGF1 and FGFRD2. The WST-1 assay was used to analyze cytotoxicity.
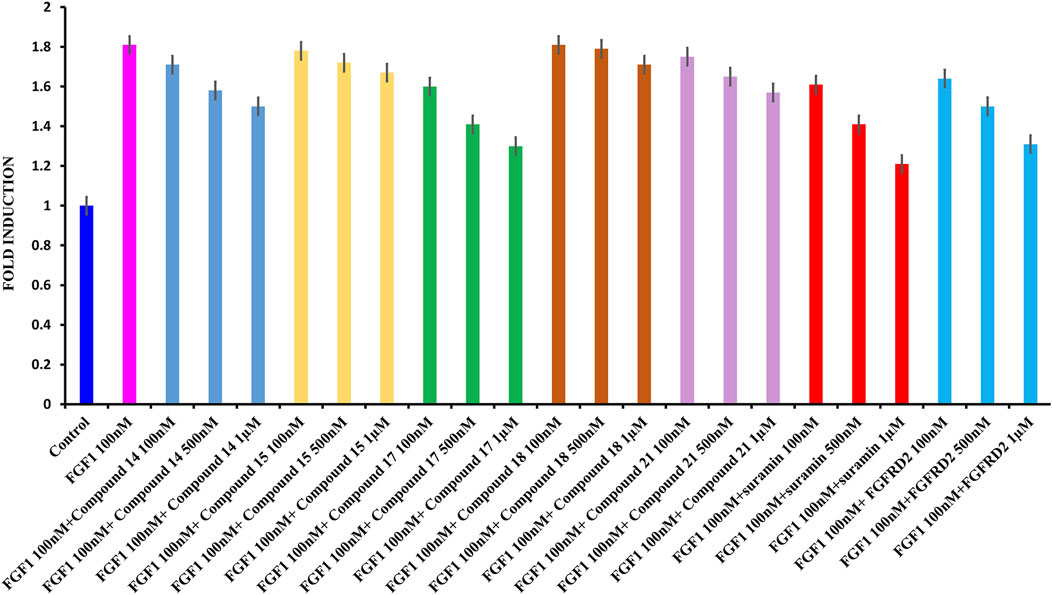
FIGURE 5. WST1 ASSAY results for cell proliferation. (A): From left to right: control in blue; FGF1 in pink (100 nM) and 100 nM, 500 nM, and 1 μM of compound 14 in blue; 100 nM, 500 nM, and 1 μM of compound 15 in yellow; 100 nM, 500 nM, and 1 μM of compound 17 in green, 100 nM, 500 nM, and 1 μM of compound 18 in brown, 100 nM, 500 nM, and 1 μM of compound 21 in light pink, 100 nM, 500 nM, and 1 μM of suramin in red, and 100 nM, 500 nM, and 1 μM of D2 in cyan.
To determine the cytotoxic effects of suramin and its derivatives, compounds 14, 15, 17, 18, and 21, with increasing concentrations of each compound (1, 5, 10, 50, and 100 µM) were used to treat MCF-7 cells for 48 h, and the WST-1 assay was performed. The results showed that compounds 14, 15, 17, 18, and 21 were less toxic to MCF-7 cells than to suramin, especially at concentrations higher than 10 µM (Figure 6). The cytotoxicity of suramin was the highest among all the analogs. The reason for the higher cytotoxicity was the presence of methyl groups on the suramin structure (Martello et al., 2001).
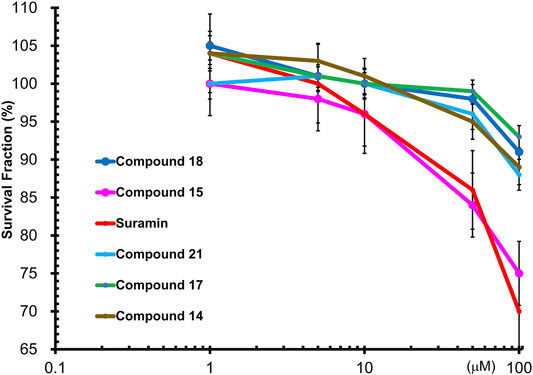
FIGURE 6. Wst1-Assay results of cytotoxicity of FGF1 with five compounds (14, 15, 17, 18 and 21): Compound 14 in brown, Compound 15 in pink, Compound 17 in green, Compound 18 in blue, Compound 21 in cyan, and suramin in red.
Suramin-induced neuropathy may depend on the effects on calcium (Ca2+) homeostasis as a potential pathological mechanism, and the full or partial positive charge of the element when directly attached to the ring at each of the sulphonic groups (HSO3). These interactions exert a moderate to strong electron-withdrawing inductive effect, which may be responsible for the observed suramin cytotoxicity (Prasetyaningrum et al., 2018; Von Der Ahe et al., 2018). The cytotoxicity of the synthesized analogs was lower as there were methyl groups and no sulfonic acid groups attached to the suramin backbone. The IC50 values of the synthesized compounds in MCF-7 breast cancer cells were analyzed using SigmaPlot software. The estimated IC50 values of suramin and its derivatives in MCF-7 cells are as follows: suramin: 153.96 ± 1.44 μM, compound 14: 408.8 ± 3.08 μM, compound 15: 193.04 ± 1.57 μM, compound 17: 619.4 ± 1.73 μM, compound 18: 325.63 ± 2.03 μM, and compound 21: 417.01 ± 0.99 μM.
In order to gain some insight about the selectivity of the compounds between tumorigenic and non-tumorigenic cells, the cytotoxicity was also being evaluated against normal breast cell lines by examining the cytotoxicity of suramin and its derivatives, compounds 15, 18, and 21, in a normal breast epithelial cell line (non-tumorigenic), MCF-10A. The results revealed that not only suramin but also the derivatives were not very toxic (IC50 > 100 μM) to the non-tumorigenic MCF-10A cells (Supplementary Figure S7). Compared to their cytotoxicity in tumorigenic MCF-7 cells (Figure 6), the estimated IC50 values in MCF-10A were higher than those in MCF-7 cells. The estimated IC50 values in non-tumorigenic cells (MCF-10A) vs. those in tumorigenic cells (MCF-7) were as following: suramin: 222.10 ± 2.40 μM vs. 153.96 ± 1.44 μM; compound 15: 220.84 ± 3.57 μM vs. 193.04 ± 1.57 μM; compound 18: 653.39 ± 2.31 μM vs. 325.63 ± 2.03 μM; and compound 21: 628.04 ± 1.45 μM vs. 417.01 ± 0.99 μM. However, the estimated IC50 value of suramin and its derivatives in both non-tumorigenic MCF-10A and tumorigenic MCF-7 cells were over 100 μM. The effective concentrations of suramin and its derivatives to attenuate FGF1-stimulated cell proliferation in MCF-7 cells were around 1 μM (Figure 5), which is non-toxic concentration to both MCF-7 cells and MCF-10A cells. Previous reports have demonstrated that FGFR gene loci were amplified and overexpressed in different subtypes of breast cancers (Maria Francesca Santolla, 2020). Therefore, in addition to the specificity of each drug, the selectivity of suramin and its derivatives to disrupt the FGF1/FGFR-mediated breast cancer growth might rely on the overexpression or amplification of FGFR2 in breast cancer cells, but not in normal cells, and the secreted FGF1 ligand by autocrine or paracrine effects from cancer cells or their surrounding stroma cells or adipocytes (tumor microenvironment). The statistical data for the cytotoxicity are shown in Supplementary Figure S8.
Limitations
The ex vivo cell line model was a simpler and direct method to demonstrate the functional effects of the suramin derivatives when compared to an in vivo animal model (Chan et al., 2016). We used the MCF-7 breast cancer cell line as an ex vivo model to evaluate cell proliferation and cytotoxicity (Figures 5, 6). Historically, human tumor-derived cell lines play a crucial role in the development, design, and discovery of novel therapies for cancer. The ex vivo cell line model is widely used in preclinical drug screening and discovery using different human cancer-derived cell lines. For example, 60 different human tumor cell lines were used to develop a high-throughput platform and the NCI-60 human tumor cell line screen, to identify and characterize novel compounds with growth inhibition or killing of tumor cell lines (NCI). However, there are limitations in the ex vivo cell line model. The results from ex vivo cell line models need to be validated by in vivo animal models, including genetically engineered mouse models (Kersten et al., 2017), mice xenograft models, and patient-derived xenograft (PDX) models (Koga, 2019) to better determine their effects on human tumorigenesis and as new agents for anticancer therapy. In addition, the cancer organoid model is an emerging approach to develop personalized anticancer therapy to reduce the use of mice (Fan et al., 2019). The validated drug candidates will be further verified in clinical trials.
Data Availability Statement
The datasets presented in this study can be found in online repositories. The names of the repository/repositories and accession number(s) can be found in the article/Supplementary Material.
Author Contributions
NP wrote the manuscript and provided data for Figures 2–4. Also, she performed protein expression and purification. Yan Liang performed the synthesis of the derivatives using their NMR data. The WST-1 assay for cell proliferation and cytotoxicity was conducted in the laboratory of R-HC.
Funding
This study was funded under the Grant Numbers (MOST107B3079I5 (CY), MOST 107-2113-M-009-018-MY3 (C-MS), MOST 109-2320-B-039-015 (R-HC)); (Funding Agency # 2 China Medical University under Grant (CMU110-MF-70)) (Funding Agency # 3 Drug Development Center, China Medical University by the Ministry of Education (MOE)).
Conflict of Interest
The authors declare that the research was conducted in the absence of any commercial or financial relationships that could be construed as a potential conflict of interest.
Publisher’s Note
All claims expressed in this article are solely those of the authors and do not necessarily represent those of their affiliated organizations, or those of the publisher, the editors, and the reviewers. Any product that may be evaluated in this article, or claim that may be made by its manufacturer, is not guaranteed or endorsed by the publisher.
Acknowledgments
We are very thankful to the instrumentation center of NTHU and NYCU for the NMR facility and ESI-MASS facility.
Supplementary Material
The Supplementary Material for this article can be found online at: https://www.frontiersin.org/articles/10.3389/fchem.2021.764200/full#supplementary-material
Abbreviations
FGF, fibroblast growth factor; FGFR, fibroblast growth factor receptor; HSQC, heteronuclear single quantum coherence; MCF7, Michigan Cancer Foundation-7.
References
Albulescu, I. C., Kovacikova, K., Tas, A., Snijder, E. J., and van Hemert, M. J. (2017). Suramin Inhibits Zika Virus Replication by Interfering with Virus Attachment and Release of Infectious Particles. Antivir. Res, 230–236. doi:10.1016/j.antiviral.2017.04.016
Anderson, J., Fuglsang, H., and Marshall, T. F. (1976). Effects of Suramin on Ocular Onchocerciasis. Tropenmed. Parasitol., 279–296.
Anna Vangone, J. S., Koukos, P., Geng, C., Citro, N., Mikael, E., Trellet, L. C. X., et al. (2019). Large-scale Prediction of Binding Affinity in Protein–Small Ligand Complexes: the PRODIGYLIG Web Server. doi:10.1093/bioinformatics/bty816
Babokhov, P., Sanyaolu, A. O., Oyibo, W. A., Fagbenro-Beyioku, A. F., and Iriemenam, N. C. (2013). A Current Analysis of Chemotherapy Strategies for the Treatment of Human African Trypanosomiasis. Pathog. Glob. Health, 242–252. doi:10.1179/2047773213Y.0000000105
Barrett, M., Boykin, D., and Tidwell, R. B. (2007). Human African Trypanosomiasis: Pharmacological Re-engagement with a Neglected Disease. Hoboken, NJ: Wiley-Blackwell on behalf of the British Pharmacological Society, 1155–1171. doi:10.1038/sj.bjp.0707354
Basavannacharya, C., and Vasudevan, S. G. (2014). Suramin Inhibits Helicase Activity of NS3 Protein of Dengue Virus in a Fluorescence-Based High Throughput Assay Format. Biochem. Biophys. Res. Commun. 453, 539–544. doi:10.1016/j.bbrc.2014.09.113
Beenken, A., and Mohammadi, M. (2009). The FGF Family: Biology, Pathophysiology and Therapy. Nat. Rev. Drug Discov., 235–253. doi:10.1038/nrd2792
Broder, S., Yarchoan, R., Collins, J. M., Lane, H. C., Markham, P. D., Klecker, R. W., et al. (1985). Effects of Suramin on HTLV-III/LAV Infection Presenting as Kaposi’s Sarcoma or AIDS-Related Complex: Clinical Pharmacology and Suppression of Virus Replication In Vivo. Lancet, 627–630. doi:10.1016/s0140-6736(85)90002-9
Brun, R., Blum, J., and Chappuis, F. (2010). Human African Trypanosomiasis. Amsterdam, Netherlands: Elsevier, 148–159. doi:10.1016/S0140-6736(09)60829-1
Büscher, P., Cecchi, G., and Vincent Jamonneau, G. P. (2017). Human African Trypanosomiasis. Amsterdam, Netherlands: Elsevier, 2397–2409.
Chamberlain, J., Shah, M., and Ferguson, M. W. J. (1995). The Effect of Suramin on Healing Adult Rodent Dermal Wounds. J. Anat. 186, 87–96.
Chan, C.-Y., Lien, C.-H., Lee, M.-F., and Huang, C.-Y. (2016). Quercetin Suppresses Cellular Migration and Invasion in Human Head and Neck Squamous Cell Carcinoma (HNSCC). BioMedicine 6, 15. doi:10.7603/s40681-016-0015-3
Chang, C. C., Khan, I., Tsai, K. L., Li, H., Yang, L. W., Chou, R. H., et al. (2016). Blocking the Interaction between S100A9 and RAGE V Domain Using CHAPS Molecule: A Novel Route to Drug Development against Cell Proliferation. Biochim. Biophys. Acta - Proteins Proteomics 1864, 1558–1569. doi:10.1016/j.bbapap.2016.08.008
Cheson, B. D., Levine, A. M., Mildvan, D., Kaplan, L. D., Wolfe, P., Rios, A., et al. (1987). JAMAJ. Am. Med. Assoc. 258, 13.
Chi, Y. H., Kumar, T. K. S., Kathir, K. M., Lin, D. H., Zhu, G., Chiu, I. M., et al. (2002). Investigation of the Structural Stability of the Human Acidic Fibroblast Growth Factor by Hydrogen - Deuterium Exchange. Biochemistry 41, 15350–15359. doi:10.1021/bi026218a
Clercq, E. (2021). 1984 Discovery of the First Anti-HIV Drug. Suramin. Basel, Switzerland: MDPI. doi:10.3390/v13081646
Dai, S., Zhou, Z., Chen, Z., Xu, G., and Chen, Y. (2019). Fibroblast Growth Factor Receptors (FGFRs): Structures and Small Molecule Inhibitors. Cells 8, 614. doi:10.3390/cells8060614
De Clercq, E. (1979). Suramin: A Potent Inhibitor of the Reverse Transcriptase of RNA Tumor Viruses. Cancer Lett. 8, 1–22. doi:10.1016/0304-3835(79)90017-X
de Vries, S. J., van Dijk, A. D. J., Krzeminski, M., van Dijk, M., and Thureau, A. (2007). No TitHADDOCK versus HADDOCK: New Features and Performance of HADDOCK2.0 on the CAPRI Targetsle. Proteins Struct. Funct. Bioinforma. 69, 726–733. doi:10.1002/prot.21723
DeLano, W. L. (2020). The PyMOL Molecular Graphics System. South San Francisco, CA: Schrödinger LLC.Version 2.3
Eberle, R. J., Coronado, M. A., Peinado, R. S., de Moraes, F. R., Olivier, D., Dreyer, T., et al. (2019). The Polyanions Heparin and Suramin Impede Binding of Free Adenine to a DNA Glycosylase from C. Pseudotuberculosis. Int. J. Biol. Macromol. 125, 459–468. doi:10.1016/j.ijbiomac.2018.12.067
Eriksson, A. E., Cousens, L. S., Weaver, L. H., and Matthews, B. W. (1991). Three-dimensional Structure of Human Basic Fibroblast Growth Factor. Proc. Natl. Acad. Sci. U. S. A. 88, 3441–3445. doi:10.1073/pnas.88.8.3441
Fan, H., Demirci, U., and Chen, P. (2019). Emerging Organoid Models: Leaping Forward in Cancer Research. J. Hematol. Oncol. 12, 142. doi:10.1186/s13045-019-0832-4
Farrell, B., and Breeze, A. L. (2018). Structure, Activation and Dysregulation of Fibroblast Growth Factor Receptor Kinases: Perspectives for Clinical Targeting. Biochem. Soc. Trans., 1753–1770. doi:10.1042/BST20180004
Federica, G., Liam, J., TimRowan, G., and Harry, P. D. K. (2016). The Animal Trypanosomiases and Their Chemotherapy: A Review. Cambridge, United Kingdom: Cambridge University Press. doi:10.1017/S0031182016001268
Fernández-Tornero, C., Lozano, R. M., Redondo-Horcajo, M., Gómez, A. M., López, J. C., Quesada, E., et al. (2003). Leads for Development of New Naphthalenesulfonate Derivatives with Enhanced Antiangiogenic Activity. Crystal Structure of Acidic Fibroblast Growth Factor in Complex with 5-Amino-2-Naphthalenesulfonate. J. Biol. Chem. 278, 21774–21781. doi:10.1074/jbc.M212833200
Furdui, C. M., Lew, E. D., Schlessinger, J., and Anderson, K. S. (2006). Autophosphorylation of FGFR1 Kinase Is Mediated by a Sequential and Precisely Ordered Reaction. Mol. Cel 21, 711–717. doi:10.1016/j.molcel.2006.01.022
Garg, K., and Corona Benjamin, T., W. T. J. (2015). Therapeutic Strategies for Preventing Skeletal Muscle Fibrosis after Injury, 87. doi:10.3389/fphar.2015.00087
Goetz, R., and Mohammadi, M. (2013). Exploring Mechanisms of FGF Signalling through the Lens of Structural Biology. Nat. Rev. Mol. Cel Biol., 166–180. doi:10.1038/nrm3528
Henß, L., Beck, S., Weidner, T., Biedenkopf, N., Sliva, K., Weber, C., et al. (2016). Suramin Is a Potent Inhibitor of Chikungunya and Ebola Virus Cell Entry. Virol. J. 13, 147. doi:10.1186/s12985-016-0607-2
Hosang, M. (1985). Suramin Binds to Platelet‐derived Growth Factor and Inhibits its Biological Activity. J. Cel. Biochem. 29 (3), 265–273. doi:10.1002/jcb.240290310
Imran Khan, M., Dowarha, D., Katte, R., Chou, R. H., Filipek, A., and Yu, C. (2019). Lysozyme as the Anti-proliferative Agent to Block the Interaction between S100A6 and the RAGE V Domain. PLoS One. doi:10.1371/journal.pone.0216427
Karaca, E., Adrien, S., Melquiond‡, J., Sjoerd, J., de Vries‡, , Panagiotis, L., et al. (2010). Building Macromolecular Assemblies by Information-Driven Docking. Mol. Cel. Proteomics 9 (8 9), 1784–1794. doi:10.1074/mcp.M000051-MCP201
Kathir, K. M., and Kumar, T. K. (2006). Understanding the Mechanism of the Antimitogenic Activity of Suramin. Biochemistry., 899–906. doi:10.1021/bi051389b
Kersten, K., de Visser, K. E., van Miltenburg, M. H., and Jonkers, J. (2017). Genetically Engineered Mouse Models in Oncology Research and Cancer Medicine. EMBO Mol. Med. 9, 137–153. doi:10.15252/emmm.201606857
Khan, M. I., Su, Y. K., Zou, J., Yang, L. W., Chou, R. H., and Yu, C. (2018). S100B as an Antagonist to Block the Interaction between S100A1 and the RAGE V Domain. PLoS One 13, e0190545.. doi:10.1371/journal.pone.0190545
Koga, Y. (2019). Systematic Review of Patient-Derived Xenograft Models for Preclinical Studies of Anti-cancer Drugs in Solid Tumors, 418. doi:10.3390/cells8050418
Koval, A., Ahmed, K., and Katanaev, V. L. (2016). Inhibition of Wnt Signalling and Breast Tumour Growth by the Multi-Purpose Drug Suramin through Suppression of Heterotrimeric G Proteins and Wnt Endocytosis. Biochem. J. 473, 371–381. doi:10.1042/BJ20150913
La Rocca, R. V., Stein, C. A., La Rocca, R. V., Stein, C. A., and Myers, C. E. (1990). Cancer Cells 2 (4), 106–115.
Latko, M., Czyrek, A., Porębska, N., Kucińska, M., Otlewski, J., Zakrzewska, M., et al. (2019). Cross-Talk between Fibroblast Growth Factor Receptors and Other Cell Surface Proteins. Cells 8. doi:10.3390/cells8050455
Lemmon, M. A., and Schlessinger, J. (2010). Cell Signaling by Receptor Tyrosine Kinases. Cell, 1117–1134. doi:10.1016/j.cell.2010.06.011
Li, H. P., Li, H. L., Qu, H. J., Zhao, M. Z., Yuan, B., Cao, M. H., et al. (2015). Suramin Inhibits Cell Proliferation in Ovarian and Cervical Cancer by Downregulating Heparanase Expression. Cancer Cel Int 52. doi:10.1186/s12935-015-0196-y
Liu, N,, He, S., Tolbert, E,, and Gong, R.(2012). Suramin Alleviates Glomerular Injury and Inflammation in the Remnant Kidney. PLoS One, 1723. doi:10.1007/978-3-662-48986-4_301184
Lozano, R. M., Jiménez, M. Á., Santoro, J., Rico, M., and Giménez-Gallego, G. (1998). Solution Structure of Acidic Fibroblast Growth Factor Bound to 1,3,6-naphthalenetrisulfonate: A Minimal Model for the Anti-tumoral Action of Suramins and Suradistas. J. Mol. Biol. 281, 899–915. doi:10.1006/jmbi.1998.1977
Manetti, F., Corelli, F., and Botta, M. (2005). Fibroblast Growth Factors and Their Inhibitors. Curr. Pharm. Des. 6, 1897–1924. doi:10.2174/1381612003398528
Maria Francesca Santolla, M. M. (2020). The FGF/FGFR System in Breast Cancer: Oncogenic Features and Therapeutic Perspectives, 3029. doi:10.3390/cancers12103029
Martello, A., LaMarche, M. J., He, L., Beauchamp, T. J., and Smith, A. B. S. B. H. (2001). AB, Horwitz SB. The Relationship between Taxol and (+)-discodermolide: Synthetic Analogs and Modeling Studies. Chem. Biol. 8 (9), 843–855. doi:10.1016/s1074-5521(01)00055-2
Middaugh, C. R., Mach, H., Burke, C. J., Volkin, D. B., Dabora, J. M., Tsai, P. K., et al. (1992). Nature of the Interaction of Growth Factors with Suramin. Biochemistry 31, 9016–9024. doi:10.1021/bi00152a044
Mitsuya, H., Popovic, M., Yarchoan, R., Matsushita, S., Gallo, R. C., and Broder, S. (1984). Suramin protection of T Cells In Vitro against Infectivity and Cytopathic Effect of HTLV-III. Sci.26, 172–174. doi:10.1126/science.6091268
Ogura, K., Nagata, K., Hatanaka, H., Habuchi, H., Kimata, K., Tate, S. I., et al. (1999). Solution Structure of Human Acidic Fibroblast Growth Factor and Interaction with Heparin-Derived Hexasaccharide. J. Biomol. NMR 13, 11–24. doi:10.1023/A:1008330622467
Ornitz, D. M., and Itoh, N. (2001). Fibroblast Growth Factors. Genome Biol. 2 (3), 1–12. doi:10.2165/00128415-200711520-00032
Ornitz, D. M., and Itoh, N. (2015). The Fibroblast Growth Factor Signaling Pathway. Wiley Interdiscip. Rev. Dev. Biol. 4, 215–266. doi:10.1002/wdev.176
Pagano, K., Torella, R., Foglieni, C., Bugatti, A., Tomaselli, S., Zetta, L., et al. (2012). Direct and Allosteric Inhibition of the FGF2/HSPGs/FGFR1 Ternary Complex Formation by an Antiangiogenic. Thrombospondin-1-Mimic Small Molecule, e36990. doi:10.1371/journal.pone.0036990
Parveen, N., Lin, Y. L., Khan, M. I., Chou, R. H., Sun, C. M., and Yu, C. (2020). Suramin Derivatives Play an Important Role in Blocking the Interaction between FGF1 and FGFRD2 to Inhibit Cell Proliferation. Eur. J. Med. Chem. 206, 112656. doi:10.1016/j.ejmech.2020.112656
Prasetyaningrum, P. W., Bahtiar, A., and Hayun, H. (2018). Synthesis and Cytotoxicity Evaluation of Novel Asymmetrical Mono-Carbonyl Analogs of Curcumin (AMACs) against Vero, HeLa, and MCF7 Cell Lines. Sci. Pharm. 86, 25. doi:10.3390/scipharm86020025
Schrell, U. M., Gauer, S., Kiesewetter, F., Bickel, A., Hren, J., and Adams, E. F. (1995). Inhibition of Proliferation of Human Cerebral Meningioma Cells by Suramin: Effects on Cell Growth, Cell Cycle Phases, Extracellular Growth Factors, and PDGF-BB Autocrine Growth Loop, 600–607. doi:10.3171/jns.1995.82.4.0600
Sola, F., Capolongo, L., Moneta, D., Ubezio, P., and Grandi, M. (1999). The Antitumor Efficacy of Cytotoxic Drugs Is Potentiated by Treatment with PNU 145156E, a Growth-Factor-Complexing Molecule. Cancer Chemother. Pharmacol. 43, 241–246. doi:10.1007/s002800050890
Sola, F. L., Capolonga, D., Moneta, P., Ubezio, P., and Grandi, M. (1999). Cancer Chemother. Pharmacol. 36, 217–222.
van Zundert, G. C. P., and Bonvin, A. M. J. J. (2014). Modeling Protein–Protein Complexes Using the HADDOCK Webserver “Modeling Protein Complexes with HADDOCK. Methods Mol. Biol. 1137, 163–179. doi:10.1007/978-1-4939-0366-5_12
Van Zundert, G. C. P., Rodrigues, J. P. G. L. M., Trellet, M., Schmitz, C., Kastritis, P. L., Karaca, E., et al. (2016). The HADDOCK2.2 Web Server: User-Friendly Integrative Modeling of Biomolecular Complexes. J. Mol. Biol. 428 (4), 720–725. doi:10.1016/j.jmb.2015.09.014
Von Der Ahe, D., Huehnchen, P., Balkaya, M., Peruzzaro, S., Endres, M., and Boehmerle, W. (2018). Suramin-induced Neurotoxicity: Preclinical Models and Neuroprotective Strategies. Molecules 23, 346. doi:10.3390/molecules23020346
Wiedemann, M., and Trueb, B. (2000). Characterization of a Novel Protein (FGFRL1) from Human Cartilage Related to FGF Receptors. Genomics 69, 275–279. doi:10.1006/geno.2000.6332
Wiedemar, N., Hauser, D. A., and Mäser, P. (2020). 100 Years of Suramin. Antimicrob. Agents Chemother., 1–14. doi:10.1128/AAC.01168-19
Wu, Z. S., Liu, C. F., Fu, B., Chou, R. H., and Yu, C. (2016). Suramin Blocks Interaction between Human FGF1 and FGFR2 D2 Domain and Reduces Downstream Signaling Activity. Biochem. Biophys. Res. Commun. 477, 861–867. doi:10.1016/j.bbrc.2016.06.149
Xie, Y., Su, N., Yang, J., Tan, Q., Huang, S., Jin, M., et al. (2020). FGF/FGFR Signaling in Health and Disease. Signal. Transduct. Target. Ther. 5, 181. doi:10.1038/s41392-020-00222-7
Yahi, N., Sabatier, J. M., Nickel, P., Mabrouk, K., Gonzalez-Scarano, F., and Fantini, J. (1994). Suramin Inhibits Binding of the V3 Region of HIV-1 Envelope Glycoprotein Gp120 to Galactosylceramide, the Receptor for HIV-1 Gp120 on Human colon Epithelial Cells. J. Biol. Chem. 269, 24349–24353.
Yu, L., Oost, T. K., Schkeryantz, J. M., Yang, J., Janowick, D., and Fesik, S. W. (2003). Discovery of Aminoglycoside Mimetics by NMR-Based Screening of Escherichia coli A-Site RNA. J. Am. Chem. Soc. 125, 4444–4450. doi:10.1021/ja021354o
Yun, Y. R., Won, J. E., Jeon, E., Lee, S., Kang, W., Jo, H., et al. (2010). Fibroblast Growth Factors: Biology, Function, and Application for Tissue Regeneration. J. Tissue Eng., 18. doi:10.4061/2010/218142
Zamai, M., Hariharan, C., Pines, D., Safran, M., Yayon, A., Caiolfa, V. R., et al. (2002). Nature of Interaction between Basic Fibroblast Growth Factor and the Antiangiogenic Drug 7,7-(carbonyl-Bis[imino-N-Methyl-4,2-pyrrolecarbonylimino[N-Methyl-4,2-Pyrrole]-Carbonylimino])-Bis-(1,3-Naphtalene Disulfonate). II. Cambridge, MA: Removal of polar interactions af, 2652–2664.
Zamai, M., Hariharan, C., Pines, D., Safran, M., Yayon, A., Caiolfa, V. R., et al. (2002). Nature of Interaction between Basic Fibroblast Growth Factor and the Antiangiogenic Drug 7,7-(carbonyl-Bis[imino-N-Methyl-4,2-Pyrrolecarbonylimino [N-Methyl-4,2-Pyrrole]-Carbonylimino])-Bis-(1,3-Naphtalene Disulfonate). II. Removal of Polar Interactions a. Biophys. J. 82, 2652–2664. doi:10.1016/S0006-3495(02)75607-5
Keywords: protein-ligand interaction, FGF1, FGFRD2, NMR, WST1 assay, cell proliferation, cytotoxicity
Citation: Parveen N, Lin Y-L, Chou R-H, Sun C-M and Yu C (2022) Synthesis of Novel Suramin Analogs With Anti-Proliferative Activity via FGF1 and FGFRD2 Blockade. Front. Chem. 9:764200. doi: 10.3389/fchem.2021.764200
Received: 25 August 2021; Accepted: 20 October 2021;
Published: 03 January 2022.
Edited by:
Guillermo Raul Castro, Consejo Nacional de Investigaciones Científicas y Técnicas (CONICET), ArgentinaReviewed by:
Felix Bast, Central University of Punjab, IndiaMasood Fereidoonnezhad, Ahvaz Jundishapur University of Medical Sciences, Iran
Copyright © 2022 Parveen, Lin, Chou, Sun and Yu. This is an open-access article distributed under the terms of the Creative Commons Attribution License (CC BY). The use, distribution or reproduction in other forums is permitted, provided the original author(s) and the copyright owner(s) are credited and that the original publication in this journal is cited, in accordance with accepted academic practice. No use, distribution or reproduction is permitted which does not comply with these terms.
*Correspondence: Ruey-Hwang Chou, cmhjaG91QGdtYWlsLmNvbQ==; Chung-Ming Sun, Y21zdW5AbmN0dS5lZHUudHc=; Chin Yu, Y3l1Lm50aHVAZ21haWwuY29t