 In Yea Kim1
 Jae-Hong Lim
- 1Department of Materials Science and Engineering, Gachon University, Seongnam, South Korea
- 2Center for Energy Materials Research, Korea Institute of Science and Technology, Seoul, South Korea
- 3Department of Materials Science and Engineering, University of Seoul, Seoul, South Korea
Controlling the electronic transport behavior in thermoelectric composites is one of the most promising approaches to enhance their power factor because this enables decoupling of the correlation between the electrical conductivity and Seebeck coefficient. Herein, we show that the unexpected high power factor of the Se nanowire array embedded in poly(3,4-ethylenedioxythiophene)-poly(styrenesulfonate) (PEDOT:PSS) can be achieved by controlling the interfacial band structure engineering. The electrical conductivity and Seebeck coefficient simultaneously increased, confirming that the synthesis of organic/inorganic hybrid thermoelectric materials with improved performance was possible. Our exploration can be helpful for the rational design of high-performance thermoelectric composites through interface engineering.
Introduction
Considering the expansion of thermoelectric (TE) materials to future energy and electronic devices, functional aspects (e.g., flexibility, transparency, and lightweight) need to be improved to widen their applicability (William and Wong, 2009; Reuss et al., 2015; Oh et al., 2016; Varghese et al., 2016; Ou et al., 2018). Organic TE materials have the potential for application in low-temperature energy harvesting systems and wearable (or flexible) heating and cooling devices (Yue and Xu, 2012; Wang and Yu, 2019). Recently, desirable results regarding the electronic transport properties of poly(3,4-ethylenedioxythiophene) (PEDOT)-based materials (Park et al., 2012; Kang et al., 2016; Kang and Snyder, 2017), such as the high TE performance of PEDOT:poly(styrenesulfonate) (PSS) and PEDOT:poly(3,4-ethylenedioxythiophene)-tosylate), have been demonstrated by engineering the degree of conformation at the molecular level (Bubnova et al., 2011; Kim et al., 2013; Noriega et al., 2013; Cho et al., 2014). An enhanced TE figure of merit (zT = S2σT/κ, where S, σ, and κ, are the Seebeck coefficient, electrical conductivity, and total thermal conductivity at a given absolute temperature T, respectively) of 0.42 was achieved at 300 K by mixing dimethyl sulfoxide with commercial PEDOT:PSS (Kim et al., 2013)13; however, it remains unsatisfactory for commercial applications. The limited zT values in PEDOT-based organic TE materials are mainly due to their poor electronic transport properties, which results in a low power factor (σS2) despite their highly desirable low κ values (e.g., κ ∼0.2 Wm−1 K−1 for PEDOT:PSS).
A nanocomposite approach by embedding nanoscale conductive fillers into the PEDOT-based matrix has been carried out to increase the σ (Du et al., 2012; Wang et al., 2012; Coates et al., 2013; Ju and Kim, 2016); however, improving the power factor is still challenging owing to the strong correlation between σ and S. For example, graphene was introduced and a high σ was obtained because of the aligned PEDOT:PSS chains along the graphene; however, S remained at the intrinsic level (Kim et al., 2012). A hybrid of inorganic compounds with a large S and highly conductive organic materials is a potential approach for achieving the theoretical maximum power factor because the independent control of σ and S becomes possible based on the parallel and series models in the composites. Additionally, the generation of a phase boundary between the organic TE matrix and inorganic compounds can trigger the improvement in S benefitting from a carrier filtering effect. This is because S is related to the energy derivative of the electronic density-of-states (DOS) and the carrier relaxation time through the Mott relationship (See et al., 2010; Yee et al., 2013; Du et al., 2014; Peng et al., 2016). However, there has been no experimental evidence for decoupling the correlation between σ and S, even in organic TE composites with well-controlled inorganic nanophases.
In the study by Roh et al. (2017), the inorganic Ge2Sb2Te5 (GST) was arranged into a nanowire, and its performance was evaluated by fabricating a composite with PEDOT:PSS. Since this study produced aligned GST through the nanopattern printing method, the height of the GST nanowire was at the nanoscale. Nevertheless, it was confirmed that the decoupling phenomenon of this material increases the S, even though σ increases. This establishes that a well-arrayed structure can obtain an improved zT. However, its nanoscale length of the wire limits its performance improvement.
Various methods have been used to synthesize nanophase inorganic TEs, for example, methods using microwaves (Wang et al., 2017), the hydrothermal synthesis method (Li et al., 2019), and the electrochemical method (Recatala-Gomez et al., 2020). Among these methods, the galvanic displacement reaction (GDR) offers several advantages, including low synthesis cost and easy reaction conditions (Xin et al., 2021). This method is an electrochemical process driven by the redox potential difference between the sacrificial material and solution reacting ions.
In this study, a wire of length at the microscale was formed through the GDR. It is easier to control the length of the wire to increase the height of the inorganic materials via this method as compared to the nanoprinting method. In addition, a high S of ≥1,000 μV/K at room temperature is desired; therefore, the most attractive material, Se, is used (Kim et al., 2019). However, to use Se as a high-performance TE material, it is necessary to improve its σ, which can be achieved by forming a composite structure with the organic PEDOT:PSS.
Materials and Methods
Formation of Se Wire Array
The Se wires were formed on a silicon wafer (2 × 2 cm) using GDR. The wafer used in this work was p-type, boron-doped, (100)-oriented silicon. The silicon wafer was cleaned with acetone and ethanol. The solution used for the Se deposition is a combination of two chemicals: hydrofluoric acid (HF, J.T Baker, United States) and a saturated solution of selenium oxide (SeO2, Sigma Aldrich, United States). The Se nanowire growth was processed in a Teflon vessel for 24 h at 70°C. After completion of the GDR, the synthesized Se wires were carefully rinsed several times with deionized water and ethanol. The Se wire was then dried in a desiccator for 1 day. The prepared wires were transferred to polydimethylsiloxane (PDMS, Sylgard® 184). The PDMS was prepared as a film and hardened at 25°C for 18 h. The silicon wafer on which the Se wires are grown was then placed on top of the prepared PDMS film and pressed with weak pressure. Throughout this process, Se wires were transferred to the PDMS film surface.
Formation of Se Wire and PEDOT:PSS Composition
The effect of doping ethylene glycol (EG, Samchun, Korea) on the TE properties of PEDOT:PSS was determined. According to the volume ratio, 2%, 4%, 6%, 8%, and 10% of EG was added to the PEDOT:PSS solution (CleviosTM PH1000) contained in each vial bottle. Then, the mixed solution of PEDOT:PSS/EG was applied to the Se wire array on the PDMS surface by drop-casting. The Se wire array applied with the PEDOT:PSS/EG mixed solution was dried in a vacuum oven at 40°C for 16 h. In addition, PEDOT:PSS was applied twice to increase the contact between the Se wire and PEDOT:PSS. The process of synthesizing the Se wire and the PEDOT:PSS composite is schematically illustrated in Figure 1.
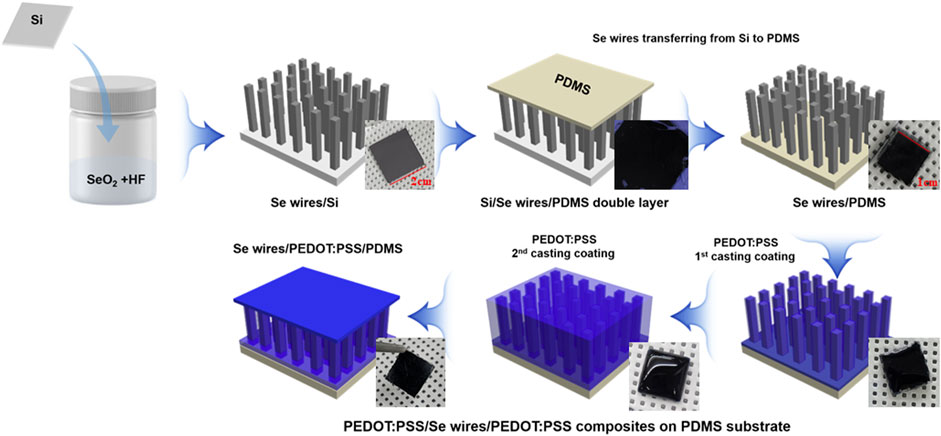
FIGURE 1. Scheme of the synthesis of the Se wire and poly(3,4-ethylenedioxythiophene)-poly(styrenesulfonate) (PEDOT:PSS) composite.
Characterization of Prepared Se Wire and PEDOT:PSS
The Se wire array grown via the GDR was observed using scanning electron microscopy (SEM, Hitachi S-4200) and scanning transmission electron microscopy energy dispersive spectroscopy (STEM-EDS, Talos F200X, FE, US) at an accelerating voltage of 200 kV (Schottky X-FEG gun) equipped with a Super-X EDS system comprising four windowless silicon drift detectors (SDDs) in the STEM mode with a probe current of ∼0.7 nA. The Se wire and composite structure were measured at 20°–65° (2θ) by X-ray diffraction (XRD, Ultima IV). The chemical state of the synthesized Se wire and the compound according to the PEDOT:PSS application was confirmed using X-ray photoelectron spectrometry (XPS, AXIS-NOVA, Kratos Inc.). To measure the work function, ultraviolet photoelectron spectroscopy (UPS, Thermo Fisher Scientific, NEXSA) was used. Conductivity of the synthesized Se wire/PEDOT:PSS composite was measured on a Keithley 2400 Electrometer using the four-point probe technique. The Seebeck coefficient was measured using Seebeck apparatus built in-house. Three samples were analyzed under each condition, and each measurement was repeated five times.
Results and Discussion
Se wires were synthesized on a silicon substrate by immersing the Si substrate in a mixed solution consisting of 2 mM SeO2 and 4.5 M HF at 70°C. The mobility of GDR is caused by the difference in the redox potential between the solid material and the ionic solution used. This technology uses primitive electrochemical phenomena that form the basis of a battery (Kakati et al., 2017)30. When a silicon substrate is immersed in an acidic fluoride solution containing only
During the GDR of Si, positive and negative reactions simultaneously occur on the Si surface as charges are exchanged through the substrate. The fluorine ions in the solution corrode and dissolve the Si substrate in the form of silicon hexafluoride, preventing the formation of passive silicon oxide and helping to maintain the reaction by constantly exposing the new Si surface (Figure 2).
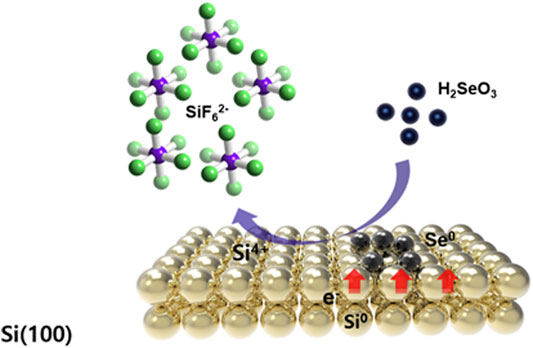
FIGURE 2. Schematic representation of the synthesis of the Se nanowires by the galvanic displacement reaction of the Si wafer.
As shown in Figure 3, it was confirmed that the nanowires formed by the nucleation and growth mechanisms (Hwang et al., 2019). Furthermore, we were able to determine the optimum reaction time required for the growth of the Se wire through the GDR method on the Si wafer surface. Figure 3A–E demonstrates the initial process of the Se wire formation; the SEM image is shown in the top view. At the initial stage, the 3D Se nuclei were formed on the Si wafer surface (Figure 3A). The mechanism by which this nucleus grows can be described as the Volmer–Weber nucleation and growth mechanism (Choi and Choi, 2013). Initially, the size of the nucleus was 100 nm; as the GDR reaction time increased, the nuclei formed on the surface grew, transforming into an island shape. Then, the grown island-shaped Se coalesced with the adjacent island-shaped Se and completely covered the Si wafer surface in the form of a film (Figure 3E). When the Si surface was completely covered, the reaction was completed on the upper surface. Thus, the reaction between the Si wafer and HSeO3− and the growth of the Se wire required more than 6 h. To analyze the length of the Se wire grown via the GDR, a cross-section of the sample was obtained after 6 h (Figure 3F); it is apparent that the growth of the wire starts under the Se island. The Se wire grows vertically in the downward direction because a redox potential reaction occurs through Si etching by HF contained in the synthesis solution; however, the upper part of the Si wafer, where the Se thin film is formed, is not etched by HF. Nevertheless, Si is present under the Se thin film, the galvanic reaction occurs because of the etching, and the Se wire starts to grow in a vertical direction (Gadea et al., 2015). The Se wire produced by the 6-h reaction grew to a length of 2.11 μm randomly. However, after 9 h, the Se wire constantly grew in a vertical direction at a growth rate of 390 nm/h.
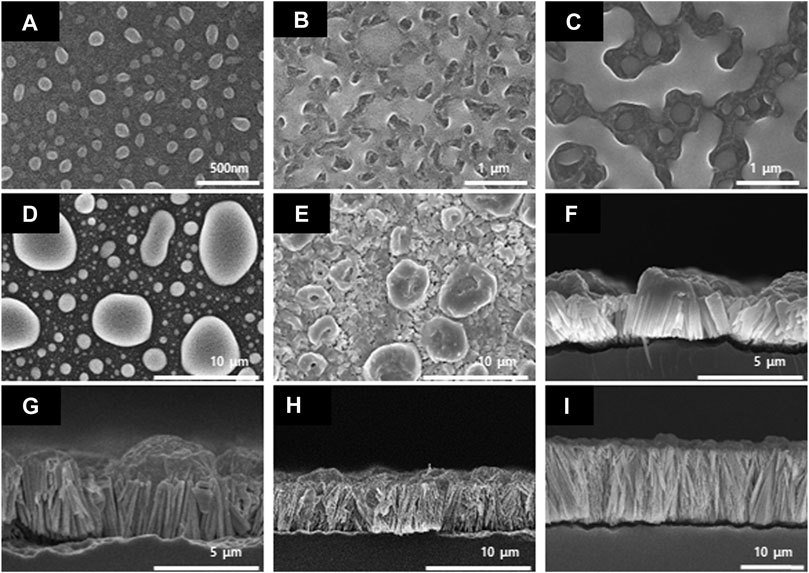
FIGURE 3. Scanning electron microscopy images of the Se nanowires synthesized by the galvanic displacement reaction at different reaction times. Top-view (A) 5 min, (B) 30 min, (C) 1 h, (D) 3 h, and (E) 6 h; cross-section (F) 6 h, (G) 9 h, (H) 12 h, and (I) 24 h.
A composite with PEDOT:PSS with high σ and low κ was fabricated to improve the TE performance of the Se wire grown by the GDR method. The structure and elemental state of the Se wire and Se wire/PEDOT:PSS were analyzed using XRD and XPS. First, the Se wires were prepared on the Si wafer surface using the GDR method. All reflections of the prepared selenium nanowires are consistent with those of selenium (JCPDS card number 06-0362) (curve a in Figure 4). In addition, the structure of the Se wire, which was transferred to the PDMS, was maintained, and the structural characteristics of the Se wire/PEDOT:PSS composite were confirmed to have similar diffraction patterns to the Se wire. This implies that the composite did not undergo phase separation or change in its crystal structure. However, the reason for the high intensity of (003) in Se/Si is that the Se/Si XRD (003) peak intensity is stronger than other results because of the Se grain size (Lu et al., 1997; Cheng and Samulski, 2003). The reason for the change in the size of the grains is outlined in Figure 3, as the Se nano wire growth direction proceeds downward. Therefore, as the initial Se growth starts from the surface, the grain size is large, hence we were able to obtain this result. In addition, X-ray penetration is difficult owing to the PEDOT:PSS applied to the Se wire surface and transferred to the PDMS.
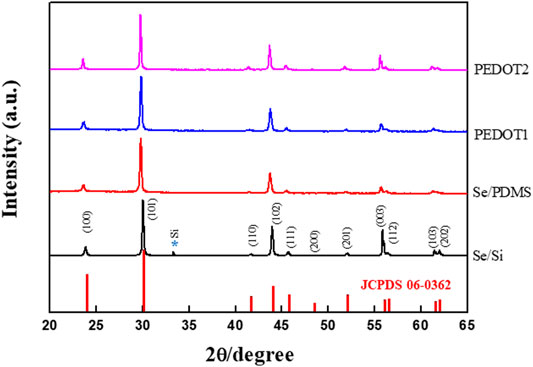
FIGURE 4. X-ray diffraction pattern of the Se nanowire structure and Se nanowire:PEDOT. The structure change according to the PSS complex process is confirmed.
The location of the Se wire and PEDOT:PSS of the manufactured Se wire/composite was confirmed using STEM-EDS. Figure 5A–D shows the STEM and STEM-EDS mapping images of Si wire/PEDOT:PSS. It was revealed that the vertically aligned Se wires were covered by PEDOT:PSS. Figure 5A is a STEM image of a Se wire/PEDOT:PSS composite in which the Se wire and PEDOT:PSS are clearly distinguished. The obtained TEM image was confirmed to be consistent with the images shown in Figure 3I. To clearly distinguish the area identified in the TEM image, specific elements were identified via EDS mapping. Figure 5C coincides with the nanowire area composed of Se, and Figure 5D shows the element constituting PEDOT:PSS, which coincides with PEDOT:PSS in Figure 5A. Figure 5B corresponds with the identified Se and C via EDS mapping. Additionally, this result can be calculated as the area ratio of the Se wire and PEDOT:PSS. This confirmed that the Se wire and PEDOT:PSS area ratio was 54.57% and 45.43%, respectively. It was clarified that the Se wire surface was sufficiently coated and filled with PEDOT:PSS.
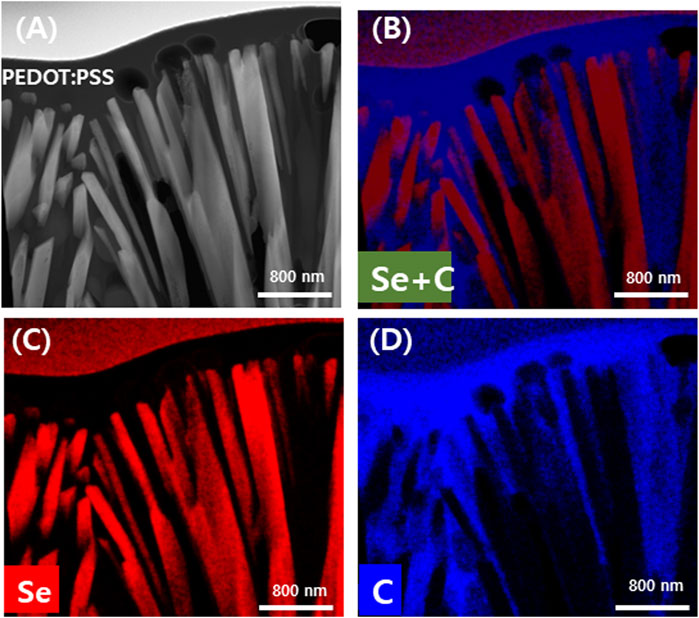
FIGURE 5. Transmission electron microscopy energy dispersive spectroscopy analysis of the Se nanowires:PEDOT:PSS composite coated twice with PEDOT:PSS. TEM image (A) and mapping image according to element (B) Se and C (C) Se and (D) C.
The interfacial reaction between the Se wires and PEDOT:PSS can be discussed using the XPS spectra of the Se wire/PEDOT:PSS composite according to the first and second applications of PEDOT:PSS (Figure 6). The 3d3/2 and 3d5/2 binding energies of pure Se appear at 56.3 and 55.4 eV, respectively, and the oxidized Se, Se2− (54.6 eV) or SeO2 (59.2 eV), are also observed (Jang et al., 2018). The binding energies of the synthesized Se wire are in the Se0 state because 3d3/2 and 3d5/2 are identified at 55.6 and 56.3 eV, respectively. In addition, no other binding energy was identified as PEDOT:PSS. These results confirm that no oxidation occurred upon applying PEDOT:PSS; therefore, Se remained pure.
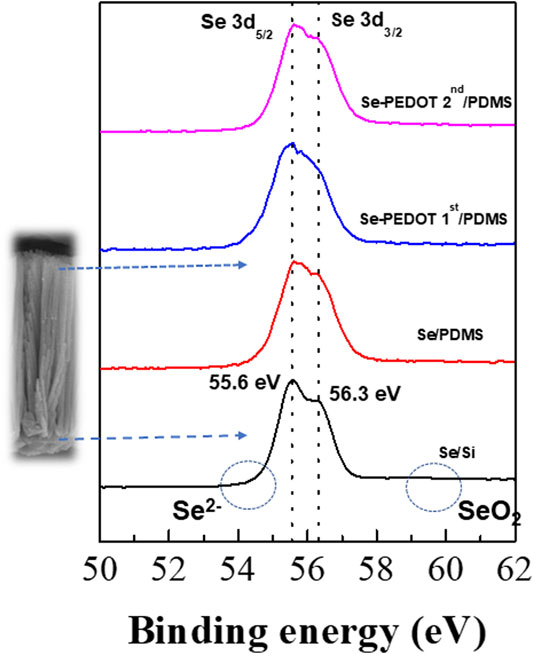
FIGURE 6. X-ray photoelectron spectra of Se 3d5/2 BE and Se 3d3/2 of the Se wire:PEDOT:PSS composite.
The above results also confirmed the viability of synthesizing Se nanowires and Se wire/PEDOT:PSS composites. However, the chain structure of PEDOT:PSS is released as the EG doping content increases (Lee et al., 2016; Roh et al., 2017). This change in the PEDOT:PSS chain structure shows a difference in filling between the Se wires upon application. Therefore, the electrical properties of PEDOT:PSS can be tuned using EG.
Figure 7 shows the TE properties (S, σ, and power factor) of the Se wire/PEDOT:PSS composite with different EG doping concentrations measured at 22°C–25°C. At 0% EG, the σ was as low as 8.03 S/cm and significantly increased to 509, 581, and 597 S/cm at 2%, 4%, and 6%, respectively. Further increasing the amount of EG gradually decreased the σ to 466 S/cm (8%) and 411 S/cm (10%). The increase in σ with increasing EG content in PEDOT:PSS (Lim, 2013) has been previously reported. On the other hand, the S of the Se wire/PEDOT:PSS composite remains relatively stable between 54 and 60 μV/K. However, a slight increase is observed at higher EG content; a maximum value of 59.61 μV/K at 10% EG and a minimum of 53.86 μV/K at 4% EG is observed. Furthermore, the power factor increased with EG doping (Figure 7B). At 2% EG, it increased by 61 times compared to that at 0% EG. A maximum power factor value (203.29 μW/mK2) was observed at 6% EG for the PEDOT:PSS and Se wire because of the corresponding maximum electrical conductivity and unchanged S. Table 1 contains a summary of the properties of representative organic/inorganic composite thermoelectric. As indicated in Table 1, the prepared thermoelectric material achieves an enhancive thermoelectrical performance compared to the other samples, which is only lower than Cu2Se/PEDOT:PSS. However, the Cu2Se/PEDOT:PSS composite was synthesized through complex processes, including long chemical reaction time, hard washing, filtration process, and cold-press process sequentially.
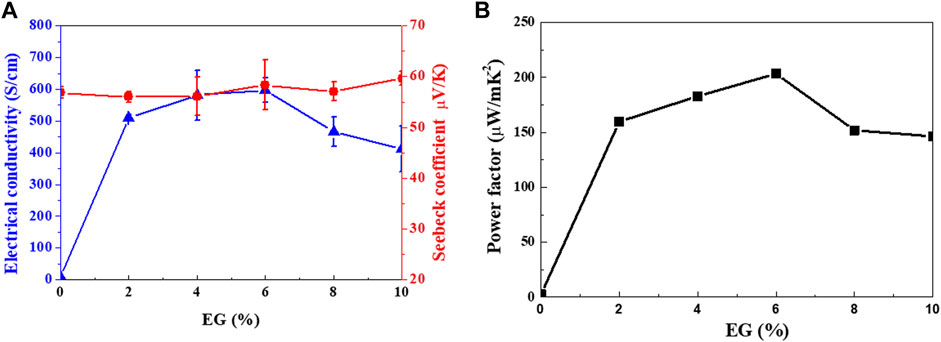
FIGURE 7. (A) Seebeck coefficient and electrical conductivity, and (B) power factor of the Se wire/PEDOT:PSS composite as functions of ethylene glycol (EG) doping concentrations.
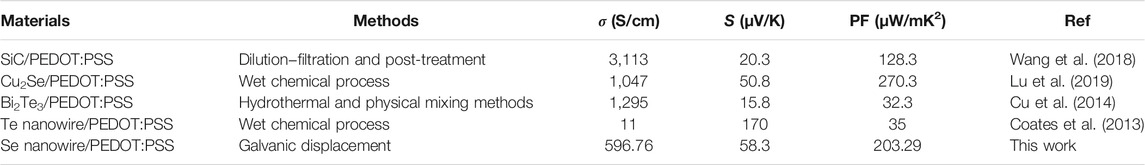
TABLE 1. Comparison of the characteristics properties of organic/inorganic composite thermoelectric.
The effect of EG doping on the TE transport properties of the Se wire/PEDOT:PSS composite can be summarized as the following: 1) Compared to the undoped composite, at 2% EG, the σ significantly increased by more than 60 times, while the S remained the same. 2) As the amount of doped EG increased to 6%, σ and S simultaneously increased. 3) Above 6% EG, the S increased, while σ decreased.
In general, when S increases, σ tends to decrease; these characteristics can be correlated with the following equation:
In addition, the σ is expressed as follows:
where kB is the Boltzmann constant, h is the Planck constant, m* is the effective mass, and n and μ are the concentration and mobility of electrons, respectively. It can be seen that S is inversely proportional to n in Eq. 3. However, for 2%–6% EG (Figure 7A), a simultaneous increase in σ and S was observed. This may be due to the carrier energy filtering effect between the organic and inorganic TE materials. Carrier energy filtering restricts unnecessary carrier movement by removing cold carriers with low carrier energy because of the difference in work function between the organic and inorganic materials; thus, even if σ increases, S cannot decrease. To confirm the optimal EG concentration, the work function of PEDOT:PSS was analyzed using UPS.
It was confirmed that the work function of PEDOT:PSS decreased as a result of EG doping (Figure 8). Furthermore, the increase in the σ of PEDOT:PSS with increased EG doping affects the decrease in the work function.
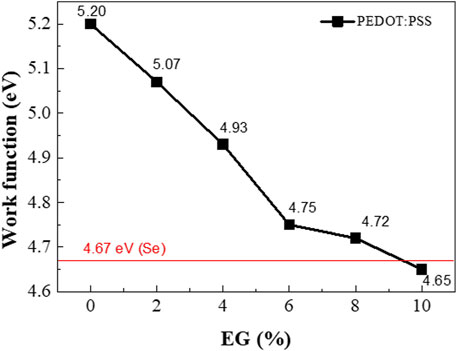
FIGURE 8. Work function of the Se wire:PEDOT:PSS composite as a function of the EG doping concentration.
As an example, Figure 9 shows the band bending induced at the interface between PEDOT:PSS with 6% EG (work function ∼4.75 eV) and the Se wires, which generates a possible carrier filtering effect. The work function difference between PEDOT:PSS with 6% EG and the Se wire yields a barrier height of 0.08 eV (4.75–4.67 eV). Therefore, the barrier height of the interface with the Se wires is expected to be 0.4, 0.26, and 0.08 eV for PEDOT:PSS with 2%, 4%, and 6% EG, respectively. As a result, S can be improved despite the increase in σ because of the possible carrier energy filtering effect (Song and Cai, 2017; Hu et al., 2018; Choi et al., 2016). For higher EG doping samples, the barrier height becomes very small (∼0.05 eV) and negative (−0.02 eV), which might not successfully induce a carrier filtering effect.
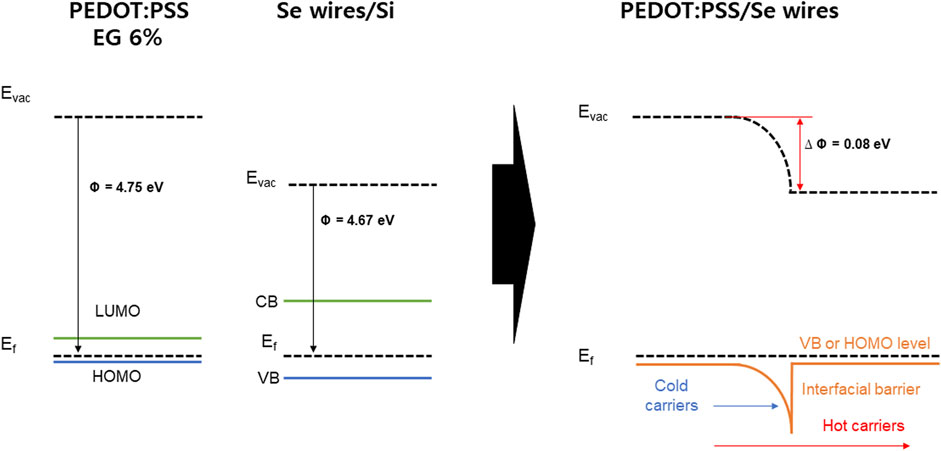
FIGURE 9. Energy diagram of the PEDOT:PSS and Se wires/Si and energy filtering effects at PEDOT:PSS/Se wires junctions.
Conclusion
In this study, the electrical and TE properties were measured for a GDR-grown Se wire coated with EG-doped PEDOT:PSS. For the undoped wire, the S and σ of the Se wire/PEDOT:PSS composite were 56.81 μV/Κ and 8.082 S/cm, respectively. Increasing the EG doping concentration increased the S and σ of the prepared composites, with maximum values (58.36 μV/Κ and 596.76 S/cm, respectively) observed at 6% EG. In addition, at 6% EG, the maximum value of the power factor (203.29 μW/mK2) was obtained. Increasing the EG concentration improved the electrical conductivity because the charge path of PEDOT:PSS was controlled; as a result, an organic/inorganic composite with improved TE properties was obtained by adding a Se wire array with a high S. These results suggest a source technology that can enhance the properties of composite TE materials by controlling the structure and direction.
Data Availability Statement
The original contributions presented in the study are included in the article/Supplementary material; further inquiries can be directed to the corresponding author.
Author Contributions
IK carried out the experiments and wrote the manuscript. J-HL conceptualized and designed the study. DC supported the TEM analyses. S-IK and J-HL reviewed the manuscript. All authors contributed to the article and approved the submitted version.
Funding
This work was supported by the Global Frontier Program through the Global Frontier Hybrid Interface Materials (GFHIM) project (grant number 2013M3A6B1078870) and Noiseless Hyper-Speed Electric Power Systems Based on Interface- ontrolled Low-Dimensional Material Structures (2020R1A4A407983712).
Conflict of Interest
The authors declare that the research was conducted in the absence of any commercial or financial relationships that could be construed as a potential conflict of interest.
Publisher’s Note
All claims expressed in this article are solely those of the authors and do not necessarily represent those of their affiliated organizations, or those of the publisher, the editors and the reviewers. Any product that may be evaluated in this article, or claim that may be made by its manufacturer, is not guaranteed or endorsed by the publisher.
References
Bubnova, O., Khan, Z. U., Malti, A., Braun, S., Fahlman, M., Berggren, M., et al. (2011). Optimization of the Thermoelectric Figure of Merit in the Conducting Polymer Poly(3,4-Ethylenedioxythiophene). Nat. Mater 10 (6), 429–433. doi:10.1038/nmat3012
Cheng, B., and Samulski, E. T. (2003). Rapid, High Yield, Solution-Mediated Transformation of Polycrystalline Selenium Powder into Single-crystal nanowires Electronic Supplementary Information (ESI) Available: Histogram of Diameter Distribution of As-Prepared Single-Crystalline Trigonal Selenium Nanowires. See http://www.rsc.Org/suppdata/cc/b3/b303755j/. Chem. Commun. (16), 2024–2025. doi:10.1039/b303755j
Cho, B., Park, K. S., Baek, J., Oh, H. S., Koo Lee, Y.-E., and Sung, M. M. (2014). Single-Crystal Poly(3,4-Ethylenedioxythiophene) Nanowires with Ultrahigh Conductivity. Nano Lett. 14 (6), 3321–3327. doi:10.1021/nl500748y
Choi, Y. Y., and Choi, D. J. (2013). Investigating and Understanding the Initial Growth Mechanisms of Catalyst-free Growth of 1D SiC Nanostructures. CrystEngComm. 15(35) 6963–6970. doi:10.1039/C3CE40745D
Choi, J., Lee, J. Y., Lee, S.-S., Park, C. R., and Kim, H. (2016). High-Performance Thermoelectric Paper Based on Double Carrier-Filtering Processes at Nanowire Heterojunctions. Adv. Energ. Mater. 6 (9), 1502181. doi:10.1002/aenm.201502181
Coates, N. E., Yee, S. K., McCulloch, B., See, K. C., Majumdar, A., Segalman, R. A., et al. (2013). Effect of Interfacial Properties on Polymer-Nanocrystal Thermoelectric Transport. Adv. Mater. 25 (11), 1629–1633. doi:10.1002/adma.201203915
Du, Y., Shen, S. Z., Cai, K., and Casey, P. S. (2012). Research Progress on Polymer-Inorganic Thermoelectric Nanocomposite Materials. Prog. Polym. Sci. 37 (6), 820–841. doi:10.1016/j.progpolymsci.2011.11.003
Du, Y., Cai, K. F., Chen, S., Cizek, P., and Lin, T. (2014). Facile Preparation and Thermoelectric Properties of Bi2Te3 Based Alloy Nanosheet/PEDOT:PSS Composite Films. ACS Appl. Mater. Inter. 6 (8), 5735–5743. doi:10.1021/am5002772
Gadea, G., Morata, A., Santos, J. D., Dávila, D., Calaza, C., Salleras, M., et al. (2015). Towards a Full Integration of Vertically Aligned Silicon Nanowires in MEMS Using Silane as a Precursor. Nanotechnology. 26(19), 195302. doi:10.1088/0957-4484/26/19/195302
Hu, X., Zhang, K., Zhang, J., Wang, S., and Qiu, Y. (2018). Thermoelectric Properties of Conducting Polymer Nanowire-Tellurium Nanowire Composites. ACS Appl. Energ. Mater. 1(9) 4883–4890. doi:10.1021/acsaem.8b00909
Hwang, T.-Y., Song, Y., Kim, S., Lee, J., Eom, N. S. A., Kwon, Y.-T., et al. (2019). Rice-like Tellurium Thin Films Deposited by a Galvanic Displacement Reaction and Ultra-high Sensing Response to Hydrogen Sulfide (H2S) Gas at Room Temperature. Sensors Actuators B: Chem. 282, 756–764. doi:10.1016/j.snb.2018.11.075
Jang, J. H., Lee, E., Xiao, P., Park, K., Kim, I. Y., Henkelman, G., et al. (2018). Superior Oxygen Electrocatalysis on RuSe X Nanoparticles for Rechargeable Air Cathodes. Adv. Energ. Mater. 8 (8), 1702037. doi:10.1002/aenm.201702037
Jeong, D.-B., Lim, J.-H., Lee, J., Park, H., Zhang, M., Lee, Y.-I., et al. (2013). Template-Free Synthesis of Vertically Oriented Tellurium Nanowires via a Galvanic Displacement Reaction. Electrochimica Acta 111, 200–205. doi:10.1016/j.electacta.2013.07.228
Ju, H., and Kim, J. (2016). Fabrication of Conductive Polymer/Inorganic Nanoparticles Composite Films: PEDOT:PSS with Exfoliated Tin Selenide Nanosheets for Polymer-Based Thermoelectric Devices. Chem. Eng. J. 297, 66–73. doi:10.1016/j.cej.2016.03.137
Kakati, N., Lee, K., and Yoon, Y. S. (2017). Synthesis of ZnNiSnO 4 Nanorods by a Simple Hydrothermal Method as a New Anode Material for Li Ion Battery. J. Alloys Comp. 711, 387–394. doi:10.1016/j.jallcom.2017.04.011
Kang, S. D., and Snyder, G. J. (2017). Charge-Transport Model for Conducting Polymers. Nat. Mater 16 (2), 252–257. doi:10.1038/nmat4784
Kang, K., Watanabe, S., Broch, K., Sepe, A., Brown, A., Nasrallah, I., et al. (2016). 2D Coherent Charge Transport in Highly Ordered Conducting Polymers Doped by Solid State Diffusion. Nat. Mater 15 (8), 896–902. doi:10.1038/nmat4634
Kim, G. H., Hwang, D. H., and Woo, S. I. (2012). Thermoelectric Properties of Nanocomposite Thin Films Prepared with Poly(3,4-Ethylenedioxythiophene) Poly(Styrenesulfonate) and Graphene. Phys. Chem. Chem. Phys. 14 (10), 3530–3536. doi:10.1039/C2CP23517J
Kim, G.-H., Shao, L., Zhang, K., and Pipe, K. P. (2013). Engineered Doping of Organic Semiconductors for Enhanced Thermoelectric Efficiency. Nat. Mater 12 (8), 719–723. doi:10.1038/nmat3635
Kim, C., Hong, J., and Park, J.-W. (2019). Synthesis and Thermoelectric Properties of Selenium Nanoparticles Coated with PEDOT:PSS. Polymers 11 (6), 1052. doi:10.3390/polym11061052
Lee, W., Kang, Y. H., Lee, J. Y., Jang, K.-S., and Cho, S. Y. (2016). Improving the Thermoelectric Power Factor of CNT/PEDOT:PSS Nanocomposite Films by Ethylene Glycol Treatment. RSC Adv. 6 (58), 53339–53344. doi:10.1039/C6RA08599G
Li, Y., Li, C., Wang, B., Li, W., and Che, P. (2019). A Comparative Study on the Thermoelectric Properties of CoSb3 Prepared by Hydrothermal and Solvothermal Route. J. Alloys Comp. 772, 770–774. doi:10.1016/j.jallcom.2018.09.114
Lim, E. (2013). Enhanced Photovoltaic Performance of P3HT:PCBM Cells by Modification of PEDOT:PSS Layer. Mol. Crystals Liquid Crystals, 585, 53–59. doi:10.1021/acsaem.8b00909 doi:10.1080/15421406.2013.849494
Lu, K., Zhang, H. Y., Zhong, Y., and Fecht, H. J. (1997). Grain Size Dependence of Mechanical Properties in Nanocrystalline Selenium. J. Mater. Res., 12(4), 923–930. doi:10.1557/JMR.1997.0132
Lu, Y., Ding, Y., Qiu, Y., Cai, K., Yao, Q., Song, H., et al. (2019). Good Performance and Flexible PEDOT:PSS/Cu2Se Nanowire Thermoelectric Composite Films. ACS Appl. Mater. Inter. 11 (13), 12819–12829. doi:10.1021/acsami.9b01718
Majidzade, V. A., Aliyev, A. S., Guliyev, P. H., Babayev, Y. N., Elrouby, M., and Tagiyev, D. B. (2018). Electrochemical Behaviour of Selenite Ions in Tartaric Electrolytes. J. Electrochem. Sci. Eng. 8 (3), 197–204. doi:10.5599/jese.490
Noriega, R., Rivnay, J., Vandewal, K., Koch, F. P. V., Stingelin, N., Smith, P., et al. (2013). A General Relationship between Disorder, Aggregation and Charge Transport in Conjugated Polymers. Nat. Mater 12 (11), 1038–1044. doi:10.1038/nmat3722
Oh, J. Y., Lee, J. H., Han, S. W., Chae, S. S., Bae, E. J., Kang, Y. H., et al. (2016). Chemically Exfoliated Transition Metal Dichalcogenide Nanosheet-Based Wearable Thermoelectric Generators. Energy Environ. Sci. 9 (5), 1696–1705. doi:10.1039/C5EE03813H
Ou, C., Sangle, A. L., Datta, A., Jing, Q., Busolo, T., Chalklen, T., et al. (2018). Fully Printed Organic-Inorganic Nanocomposites for Flexible Thermoelectric Applications. ACS Appl. Mater. Inter. 10 (23), 19580–19587. doi:10.1021/acsami.8b01456
Park, E., Kwon, O. s., Park, S. J., Lee, J. S., You, S., and Jang, J. (2012). One-pot Synthesis of Silver Nanoparticles Decorated Poly(3,4-Ethylenedioxythiophene) Nanotubes for Chemical Sensor Application. J. Mater. Chem. 22 (4), 1521–1526. doi:10.1039/C1JM13237G
Peng, S., Wang, D., Lu, J., He, M., Xu, C., Li, Y., et al. (2016). A Review on Organic Polymer-Based Thermoelectric Materials. J. Polym. Environ. 25 (4), 1208–1218. doi:10.1016/j.jmat.2021.03.013
Recatala-Gomez, J., Kumar, P., Suwardi, A., Abutaha, A., Nandhakumar, I., and Hippalgaonkar, K. (2020). Direct Measurement of the Thermoelectric Properties of Electrochemically Deposited Bi2Te3 Thin Films. Sci. Rep. 10 (1), 1–10. doi:10.1038/s41598-020-74887-z
Reuss, R. H., Raupp, G. B., and Gnade, B. E. (2015). Special Issue on Advanced Flexible Electronics for Sensing Applications [Scanning the Issue]. Proc. IEEE 103 (4), 491–496. doi:10.1109/JPROC.2015.2414486
Roh, S.-H., Kim, J., Park, W.-I., Kim, Y.-D., and Lim, J.-H. (2017). Fabrication and Characterization of Ge2Sb2Te5 Nanowire Arrays and PEDOT: PSS Hybrid Thermoelectric Composites. Korean J. Met. Mater. 55 (6), 432–439. doi:10.3365/KJMM.2017.55.6.432
Saha, S., Johnson, M., Altayaran, F., Wang, Y., Wang, D., and Zhang, Q. (2020). Electrodeposition Fabrication of Chalcogenide Thin Films for Photovoltaic Applications. Electrochem 1 (3), 286–321. doi:10.3390/electrochem1030019
See, K. C., See, J. P., Chen, C. E., Majumdar, A., Urban, J. J., and Segalman, R. A. (2010). Water-Processable Polymer-Nanocrystal Hybrids for Thermoelectrics. Nano Lett. 10 (11), 4664–4667. doi:10.1021/nl102880k
Song, H., and Cai, K. (2017). Preparation and Properties of PEDOT:PSS/Te Nanorod Composite Films for Flexible Thermoelectric Power Generator. Energy. 125, 519–525. doi:10.1002/aelm.201800822
Tran, M., Roy, S., Kmiec, S., Whale, A., Martin, S., Sundararajan, S., et al. (2020). Formation of Size and Density Controlled Nanostructures by Galvanic Displacement. Nanomaterials 10 (4), 644. doi:10.3390/nano10040644
Varghese, T., Hollar, C., Richardson, J., Kempf, N., Han, C., Gamarachchi, P., et al. (2016). High-Performance and Flexible Thermoelectric Films by Screen Printing Solution-Processed Nanoplate Crystals. Sci. Rep. 6, 33135. doi:10.1038/srep33135
Wang, Q., Yao, Q., Chang, J., and Chen, L. (2012). Enhanced Thermoelectric Properties of CNT/PANI Composite Nanofibers by Highly Orienting the Arrangement of Polymer Chains. J. Mater. Chem. 22 (34), 17612. doi:10.1039/C2JM32750C
Wang, L., Chang, S., Zheng, S., Fang, T., Cui, W., Bai, P.-p., et al. (2017). Thermoelectric Performance of Se/Cd Codoped SnTe via Microwave Solvothermal Method. ACS Appl. Mater. Inter. 9(27), 22612–22619. doi:10.1021/acsami.7b06083
Wang, X., Meng, F., Wang, T., Li, C., Tang, H., Gao, Z., et al. (2018). High Performance of PEDOT:PSS/SiC-NWs Hybrid Thermoelectric Thin Film for Energy Harvesting. J. Alloys Comp. 734, 121–129. doi:10.1016/j.jallcom.2017.11.013
Wang., H., and Yu, C. (2019). Organic Thermoelectrics: Materials Preparation, Performance Optimization, and Device Integration. Joule. 3(1), 53–80. doi:10.1016/j.joule.2018.10.012
William, S., and Wong, A. S. (2009). Flexible Electronics: Materials and Applications. Stanford, CA: Springer.
Xin, J., Basit, A., Li, S., Danto, S., Tjin, S. C., and Wei, L. (2021). Inorganic Thermoelectric Fibers: A Review of Materials, Fabrication Methods, and Applications. Sensors 21 (10), 3437. doi:10.3390/s21103437
Yee, S. K., Coates, N. E., Majumdar, A., Urban, J. J., and Segalman, R. A. (2013). Thermoelectric Power Factor Optimization in PEDOT:PSS Tellurium Nanowire Hybrid Composites. Phys. Chem. Chem. Phys. 15 (11), 4024–4032. doi:10.1039/C3CP44558E
Keywords: thermoelectric, Se wires array, PEDOT:PSS, galvanic displacement, carrier scattering
Citation: Kim IY, Chun DW, Kim S-I and Lim J-H (2022) Enhanced Thermoelectric Properties of Composites Prepared With Poly(3,4-Ethylenedioxythiophene) Poly(Styrenesulfonate) and Vertically Aligned Se Wire. Front. Chem. 9:791155. doi: 10.3389/fchem.2021.791155
Received: 08 October 2021; Accepted: 15 December 2021;
Published: 26 January 2022.
Edited by:
Elizabeth J. Podlaha, Clarkson University, United StatesReviewed by:
Hong Wang, Xi’an Jiaotong University, ChinaMohammadsadegh Beheshti, Louisiana State University, United States
Copyright © 2022 Kim, Chun, Kim and Lim. This is an open-access article distributed under the terms of the Creative Commons Attribution License (CC BY). The use, distribution or reproduction in other forums is permitted, provided the original author(s) and the copyright owner(s) are credited and that the original publication in this journal is cited, in accordance with accepted academic practice. No use, distribution or reproduction is permitted which does not comply with these terms.
*Correspondence: Jae-Hong Lim, bGltamhAZ2FjaG9uLmFjLmty