 Guankai Wang†
 Lupei Du
 Minyong Li
- Key Laboratory of Chemical Biology (MOE), Department of Medicinal Chemistry, School of Pharmaceutical Sciences, Cheeloo College of Medicine, Shandong University, Jinan, China
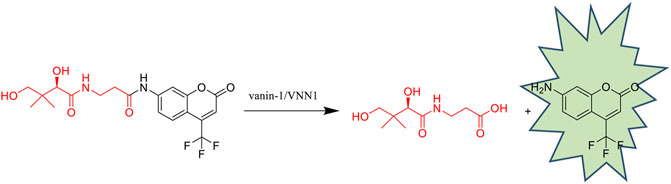
The main effect of Vanin-1/VNN1 is related to its pantetheinase sulfhydrylase activity, which can hydrolyze pantetheine into pantothenic acid and cysteamine. In recent studies, the enzymatic activity of vanin-1/VNN1 has been found to be essential in the development of many diseases. The study of specific vanin-1/VNN1 inhibitors can give us a deeper understanding of its role in the disease process. In this study, different skeletal inhibitors were designed and synthesized using pyrimidine amide compounds as lead compounds. In order to screen inhibitors intuitively, a fluorescent probe PA-AFC for in vitro evaluation of inhibitors was designed and synthesized in this study, which has good sensitivity and specificity. The bioluminescent probe PA-AL was then used for cellular level and in vivo inhibitor evaluation. This screening method was convenient, economical and highly accurate. Finally, these inhibitors were applied to a mouse colitis model, confirming that vanin-1 is useful in IBD and providing a new therapeutic direction.
GRAPHICAL ABSTRACT
Introduction
Vanin-1 is expressed on the surface of thymic stromal cell membrane around blood vessels, which is anchored by glycosylphosphatidylinositol (GPI) (Rommelaere et al., 2013). The main effect of Vanin-1/VNN1 is related to its pantetheinase sulfhydrylase activity, which can hydrolyze pantetheine into pantothenic acid and cysteamine (Dupre et al., 1970). Pantothenic acid is also known as vitamin B5, which can be used as a precursor of coenzyme A (Naquet et al., 2014). The vanin-1/VNN1-cysteamine pathway is involved in pro-inflammatory and oxidative stress under physiological conditions (Boersma et al., 2014). In recent years, many studies in both human and animal models have confirmed Vanin-1 as a key player in disease progression. For example, it is reported that 2,4,6-trinitrobenzenesulfonic acid (TNBS)-induced mouse colitis model, the lack of vanin-1 gene can protect mice from colitis (Berruyer et al., 2006). Similarly, vanin-1 specific inhibitors have also become an important tool for studying the biological effects of vanin-1. It may not only provide new strategies for disease treatment, but also has the potential to develop new therapeutic anti-inflammatory drugs.
There are few studies on vanilloid-1 specific inhibitors in the world and they are mainly in the form of patents. In 2013, Schalkwijk et al. developed a ubiquine analogue inhibitor, of which the most active compound is RR6 (IC50 = 0.54 μM). This compound can competitively and reversibly inhibit pantothenate activity, and its efficacy has been confirmed in an in vivo rat model. So far, RR6 has been widely used in various studies to analyze the role of vanin-1 targets in various disease processes (Jansen et al., 2013; van Diepen et al., 2014; Wedel et al., 2016).
From 2016 to 2019, several series of compound patents with different core types were reported as vanin-1 specific inhibitors. The number of compounds is not only huge, but the IC50 values have reached the nanomolar level. Pfizer applied for two patents in 2016 and 2018. In 2016, the vanin-1 enzyme inhibitor patent is a new heterocyclic compound as an inhibitor of vanin-1 enzyme. On this basis, in 2018 the company refined the skeleton for pyrimidine amides. In 2018, Shen et al. applied for a patent for heteropolyester compounds as vanin-1 inhibitors, while Burch et al. applied for a patent for aminothiazole compounds in 2019. We used pyrimidine amide compounds as lead compounds to change the skeleton structure, hoping to discover a new skeleton for inhibitors.
Recently, some probes were designed for the detection of vanin-1 enzyme activity, and reflecting the inhibitory effect of its inhibitors, measure their IC50 value, so that they can achieve the purpose of visually screening inhibitors (Gurung et al., 2020). Compared with traditional detection methods, depending on the connected luminophore, the scope of application becomes wider and wider. In 2010, Ruan et al. linked pantothenic acid with 4-amino-methylcoumarin fluorophore to synthesize the probe AMC-Pan (Ruan et al., 2010). The probe can not only be used for the detection of vanin-1 enzyme activity, but also can be used to screen inhibitors. But this probe is not suitable for cell, deep tissue imaging, and small animal live imaging. In 2017, Ma’s group developed a ratiometric fluorescent probe CV-PA (Hu et al., 2017), which was successfully applied to fluorescence imaging of living cells, but the probe has not been applied to in vivo detection. In 2018, the Li group developed the bioluminescence probe, PA-AL (Lin et al., 2018). Its emission wavelength is 590 nm, which is the first probe that can be used in the detection of vanin-1 enzyme in vivo (Ueno et al., 2004). PA-AL can effectively reflect the endogenous vanin-1 level and realize dynamic real-time monitoring. Because of its excellent selectivity and sensitivity, PA-AL will serve as an important tool in vivo for studying the effects of vanin-1 enzyme and visually screening inhibitors.
Experimental Section
Synthesis
Synthesis of probe PA-AFC and inhibitors were completed within a few steps as depicted in Supplementary Scheme S1–S3 of the Supporting Information (SI). The detailed synthesis is described in the SI.
The synthesis of probe PA-AFC mainly goes through three steps. The first step is to use the acetal structure to condense the two hydroxyl groups in the pantothenic acid structure to protect it, and only expose the carboxyl group to avoid the influence on the reaction. The second step uses isobutyl chloroformate and N-methylmorpholine to condense the carboxyl group of pantothenic acid with the amino group of the fluorophore AFC to form an amide structure. The third step uses acetic acid to remove the acetal protecting group.
The synthesis of compounds a-h first utilizes the nucleophilic addition of aldehyde groups and amino groups under acidic conditions to generate imine structures. The imine is unstable, so use sodium cyanoborohydride or sodium borohydride to directly reduce it to a secondary amine structure. The ester group is then used to hydrolyze under alkaline conditions to generate its sodium salt, and hydrochloric acid is used to adjust the pH to neutral or make it generate carboxylic acid. Finally, the condensing agent HATU is used to condense the carboxylic acid and the amino group in the spiroalkane to form an amide structure.
The synthesis of compound i-j first involves the nucleophilic substitution reaction of amino and halogen using a palladium catalyst and its ligand under alkaline conditions. Then the ester group is hydrolyzed under alkaline conditions to generate its sodium salt, and the pH is adjusted to neutral with hydrochloric acid. Finally, SOCl2 is used to make it an acid chloride, and the secondary amine in the spiroalkane is nucleophilically attacked to form an amide.
All compounds have been confirmed by characterization methods, and their purity is >95%.
Sensitivity Determination of Fluorescent Probe PA-AFC
After the fluorescent probe PA-AFC reacts, the fluorophore AFC can be obtained, and the light signal can be collected, so the change of fluorescence intensity can reflect the sensitivity of the probe.
In this study, the probe response to different concentrations of human recombinant VNN1 enzyme was measured to study the sensitivity of the fluorescent probe PA-AFC. Human recombinant VNN1 solutions of different concentrations were prepared with buffer solution (500, 250, 125, 62.5, 31.25, 15.63, 7.81, 3.91, 1.95, 0.98, and 0.49 ng/ml). Prepare the fluorescent probe PA-AFC solution with a buffer solution at a concentration of 20 μM. Add 50 μl of the above-mentioned VNN1 solution to a black 96-well plate, then add 50 μl of probe solution to each well, and immediately transfer to a 37°C shaker for 30 min. They were placed in a POLARstar Omega microplate reader, a 420 nm filter for excitation light, a 510 nm filter for emission light, and record the fluorescence intensity data at 510 nm.
Selective Determination of Fluorescent Probe PA-AFC
To prove that the detected fluorescent signal is generated by the reaction between human recombinant VNN1 enzyme and probe PA-AFC, this study incubated the probe with several interfering substances, and the fluorescence intensity of the probe allowed the selectivity of the probe to be determine.
In this study, the interfering substances FeCl3, MgCl2, BaCl2, MnSO4, CaCl2, ZnCl2, AlCl3, PbCl2, and CuSO4 were prepared with a buffer solution to a concentration of 1 mM, and diluted GSH, D-cysteine, glucose, VcNa, L-valine, and Hcy to 1 mM, APN and GGT were diluted to a concentration of 50 U/L, and TYR was diluted to a concentration of 100 ng/ml. Dilute the recombinant human VNN1 enzyme concentration to 20 ng/ml, and dilute the probe PA-AFC to 20 μM with buffer.
Take 50 μl of probe solution and 50 μl of different substance solutions and mix them in a black 96-well plate, and incubate at 37°C for 30 min in a constant temperature shaker. Immediately after taking it out, place it in a POLARstar Omega microplate reader, use a 420 nm filter for excitation light, select a 510 nm filter for emission light, record the fluorescence intensity data at 510 nm and emission spectrum.
Meanwhile, Fe3+ is an efficient emission quencher for most fluorescent indicators. To further confirm the fluorescence quenching of probe PA-AFC by Fe3+, fluorescence microscopic imaging experiment and fluorescence quantum yield experiment were conducted (Sahoo and Crisponi, 2019).
Dilute the probe PA-AFC to 20 μM with buffer, and dilute the Fe3+ to 1 mM with buffer. ES-2-Fluc cells were plated on glass-bottom culture dishes and incubated at 37°C for 12 h. Add 500 μl fluorescent probe solution to each well, add 500 μl PBS buffer in the control group, and add 500 μl PBS buffer solution containing Fe3+ in the experimental group. After mixing, place the small dish plate on a shaker at 37°C and incubate for 30 min. Take the small dish plate out of the shaker and place it inverted fluorescence microscope for imaging.
Accordance with ultraviolet-visible spectrophotometer absorbance value of compound (between 0.01 and 0.05), and then determined by fluorescence spectrophotometer maximum excitation wavelength of fluorescence spectrum peak area, after the abbe refractometer is used to test the same conditions of different solvent refractive index data from generation into the following formula to calculate quantity of fluorescent quantum yield of the fluorescent samples under test.
In the formula, φ and A respectively refer to the quantum yield and the absorbance at the excitation wavelength, ƞ and F respectively represent the refractive index of the solvent and the peak area of the fluorescence emission spectrum, X and S respectively are the substance to be measured and the reference substance. Here, fluorescein is selected as the reference substance, and its quantum yield in 1 N NaOH aqueous solution is 92%.
Similarly, in order to evaluate the merits and disadvantages of our probes, we comprehensively compared the published fluorescent probes, and summarized them as depicted in Table 1.
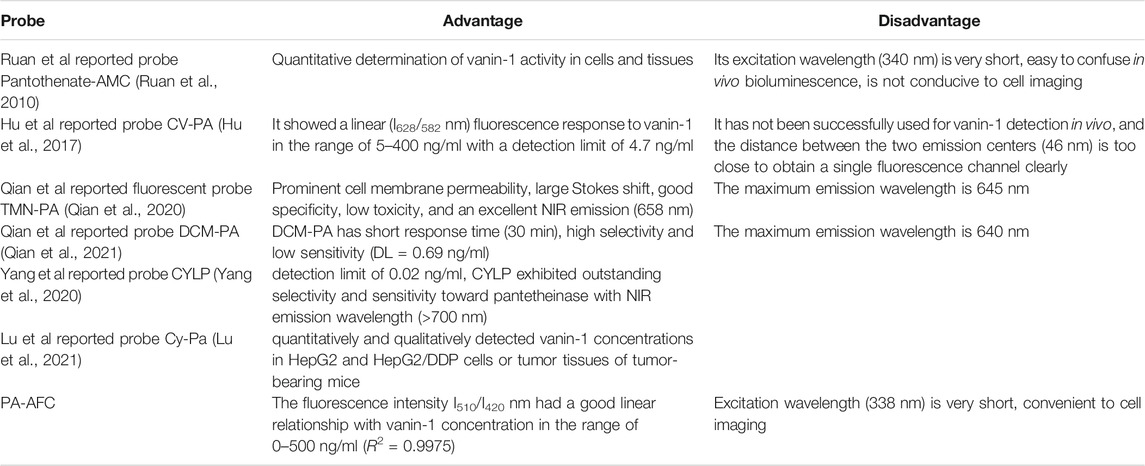
TABLE 1. The summary of fluorescent probes for VNN1.
Determination of the Inhibitory Activity Against Human Recombinant VNN1 Enzyme in vitro
This study was used human recombinant VNN1 enzyme and fluorescent probe PA-AFC to determine the IC50 value of inhibitors.
Dilute the lead compound and each inhibitor to be tested with buffer to, for example, 400, 200, 100, 50, 25, 12.50, 6.25, 3.13, and 1.56 μM, 781 nM, 391 nM The gradient concentration of the solution. Prepare the human recombinant VNN1 enzyme solution at a concentration of 30 ng/ml. Prepare the fluorescent probe PA-AFC solution with a concentration of 20 μM.
Add 50 μl of gradient concentration of the inhibitor to be tested to each well of the black 96-well plate, and then continue to add 50 μl of the newly prepared human recombinant VNN1 enzyme solution to each well. Among them, the control group and the blank group were replaced with the same volume of buffer. After the solution is mixed, place the black 96-well plate on a shaker at 37°C for 30 min. Continue to add 100 μl of the prepared fluorescent probe solution to each well of the black 96-well plate. After mixing, place the black 96-well plate on a shaker at 37°C and incubate for 30 min. Take the black 96-well plate out of the shaker and place it in a POLARstar Omega microplate reader. Use a 420 nm filter for the excitation light and a 510 nm filter for the emission light. Record the fluorescence intensity data at 510 nm. Through GraphpadPrism mapping, the IC50 value of each inhibitor to be tested was obtained.
Cytotoxicity Test
The study chose the MTT method to study the toxicity of inhibitors to human ovarian cancer cells ES-2-Fluc expressing firefly luciferase. Dilute the cells to a cell suspension with a concentration of 8 × 10⁴ cells/ml, take a completely transparent 96-well plate, add 100 μl to each well to reach about 8,000 cells in each well, and incubate at 37°C for 12 h. Dilute the lead compound and each inhibitor to be tested to the final concentration of 250, 125, and 62.5 μM. Add 100 μl to each well of a 96-well plate and incubate at 37°C for 12 h. Pipette 20 μl of 0.5 mg/ml MTT solution into each well of a 96-well plate, and incubate at 37°C for 4 h. Add 150 μl of DMSO to each well, shake at 22°C for 5 min and mix, place in a POLARstar Omega microplate reader, read the OD value of each well at 570 nm, and calculate the cell survival rate.
Inhibitory Activity of Vanin-1 Enzyme at the Cellular Level
This study explores the inhibition of Vanin-1 enzyme at the cellular level using firefly luciferase labeled human ovarian cancer cells (ES-2-Fluc) and the bioluminescent probe PA-AL.
Take a black 96-well plate with a transparent bottom, dilute the cells to a cell suspension with a concentration of 4 × 10⁵ cells/ml, add 100 μl to each well to reach about 40,000 cells in each well, and incubate at 37°C for 12 h. Dilute the lead compound and each inhibitor to be tested to the final concentration of 200, 100, 50, 25, 12.50, 6.25, 3.13, 1.56, and 0.78 μM, and add 100 μl to each well. After mixing, transfer to a shaker at 37°C and incubate the cells with the inhibitor for 30 min. Prepare bioluminescent probe PA-AL solution with a concentration of 20 μM. Immediately after adding, put it into in vivo imaging for bioluminescence imaging. The bioluminescence intensity value of each hole was analyzed by the software of the living body imager, and the exposure time was 1 min. Graphpad Prism software is used to draw the IC50 value of each inhibitor to be tested.
Inhibition of Vanin-1 Inhibitor on Transgenic Mice in vivo
In this study, the lead compound and selected superior compounds were applied to transgenic mice expressing firefly luciferase, and the inhibition of vanin-1 enzyme was investigated at the in vivo level using the bioluminescent probe PA-AL.
We divided FVB-luc + mice into three groups:
(1) Control group: gavage lead compound, the dose is 25 mg/kg, the gavage volume is 200 μl;
(2) Experimental group: gavage compound a, the dose is 50 mg/kg, the gavage volume is 200 μl;
(3) Blank group: Administer normal saline, the volume of intragastric administration is 200 μl.
After intragastric administration, mice were fed routinely for 1.5 h, and then mice in each group were anesthetized with 4% chloral hydrate solution and injected intraperitoneally with physiological saline solution of bioluminescent probe PA-AL (1 mM, 200 μl). In 55 min, the bioluminescence imaging of the whole body of each group of mice was measured every 5 min, and then the bioluminescence intensity was obtained by analyzing the images with the software of the in vivo imager.
Preparation of TNBS Solution
The dose of TNBS used in this experiment is 2.0 mg/50% alcohol enema, each with a volume of 100 μl. The preparation method is 40 μl of 5% TNBS (w/v) aqueous solution, 50 μl of absolute ethanol, and 10 μl of distilled water. well mixed.
Establishment of Animal Model
The study bred C57BL/6J mice adaptively with ordinary diet for 1 week, in an ordinary clean environment, normal light and free drinking water. The mice were randomly divided into 3 groups and numbered, fasted without water for 24 h before modeling. After weighing the mouse, use isoflurane anesthesia, insert a rubber hose with a diameter of about 0.2–0.3 cm into the mouse 3.5 cm from the anus, and slowly push 100 μl of the 2.0 mg TNBS/50% alcohol mixture solution through the hose Enter the colon, slowly pull out the plastic tube after the administration, pinch the anus with your hand, and invert it for 1 min, so that the model agent can fully penetrate the intestinal cavity of the mouse. Then put them back into the breeding cage to keep lying down, wait for the mice to wake up naturally, and create a model together. The mice in the control group were given 200 μl of lead compound solution (25 mg/kg) once a day, the mice in the experimental group were given 200 μl of compound 1c solution (50 mg/kg) once a day, and the mice in the model group were given physiological salt once a day 200 μl of aqueous solution. Eight days after modeling, the mice were sacrificed for follow-up evaluation.
Disease Activity Index Score of Each Group of Mice
After making the model, observe and record the weight changes of each group of mice every day, and observe and record the stool characteristics and occult blood of each group of mice at the same time. DAI scores are performed on each group of mice to obtain the average value of each group of mice’s DAI score. To evaluate the disease activity of each group of mice, that is, clinical symptoms.
Specimen Tissue Collection and Processing
After the mice were sacrificed, the intestinal cavity was cut along the edge of the mesentery, and the colon was separated 4 cm from the anus. After the steps of fixation, cutting, dehydration, paraffin embedding, sectioning, staining, and scanning imaging, the histopathological evaluation was performed.
Result and Discussion
HPLC Analysis
To verify the mechanism of the off-on switch of our probe PA-AFC, an HPLC analysis was performed by a 1260 Infinity HPLC system (Agilent Technologies, Santa Clara, CA). The retention time of AFC and probe was 19.291 and 21.283 min, respectively (Figures 1A,B). When the probe was incubated with VNN1 for 10 min, the retention time showed that the fluorophore AFC peak appeared. When the probe was incubated with VNN1 for 30 min, the retention time showed that the peak of probe PA-AFC disappeared, and only the peak of the fluorophore AFC was available. As a result, probe PA-AFC can release AFC via reaction with pantetheinase (Figures 1C,D).
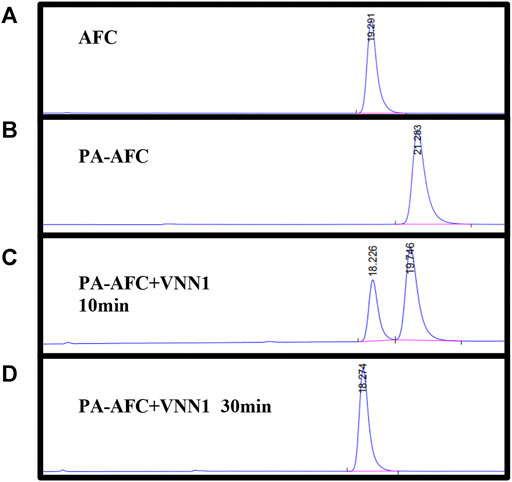
FIGURE 1. HPLC verified the reaction mechanism between fluorescent probe PA-AFC and pantothenate: (A) fluorophore AFC (0.2 mM); (B) fluorescent probe PA-AFC (0.2 mM); (C) probe PA-AFC (0.2 mM), 1 ml) and pantothenate (500 ng/ml, 1 ml) incubate at 37°C for 10 min, and then filter and inject; (D) probe PA-AFC (0.2 mM, 1 ml) and pantothenate (500 ng/ml, 1 ml) After incubating at 37°C for 30 min, filter injection.
Sensitivity of Fluorescent Probe PA-AFC
We incubated the 20 μM probe PA-AFC with different concentrations of human recombinant VNN1 enzyme at 37°C for 30 min, and recorded its fluorescence intensity with a microplate reader. Then, the obtained fluorescence intensity value of each concentration is divided by the intensity of the blank group to obtain the relative fluorescence intensity. In Figure 2A, we can see that the fluorescence intensity increases as the concentration of human recombinant VNN1 enzyme increases. In Figure 2B, after we linearly fitted the data in Figure A, we found that our probe has good linearity, conforming to the linear equation of y = 0.9775x + 11.17 and R2 = 0.9975. The detection limit of the probe is 1 ng/ml. This shows that we can use the probe PA-AFC to quantify the amount of VNN1, so our probe has good sensitivity.
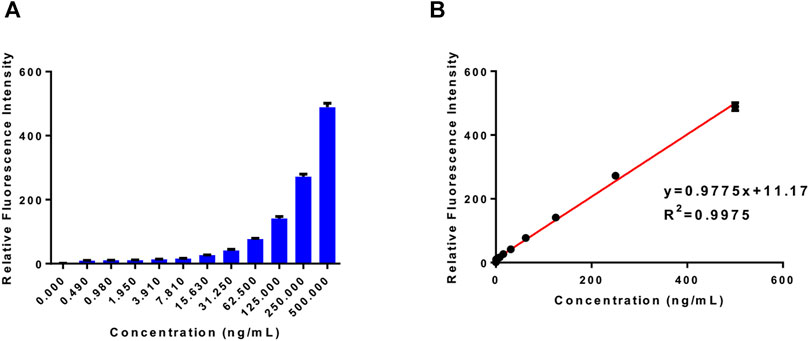
FIGURE 2. Probe sensitivity test. (A) The relative fluorescence intensity of the probe (20 μM) and different concentrations of human recombinant VNN1 enzyme after incubation at 37°C for 30 min; (B) The linear relationship between the relative fluorescence intensity and the concentration of pantothenate conforms to the linear equation y = 0.9775 x + 11.17, which R2 = 0.9975.
Selectivity of Fluorescent Probe PA-AFC
We incubate the probe with the following substances, inorganic salt solutions, such as FeCl3, MgCl2, BaCl2, MnSO4, CaCl2, ZnCl2, AlCl3, PbCl2, CuSO4, and biologically active molecules such as GSH, D-cysteine, glucose, VcNa, L-valine, Hcy, and some proteases, such as APN, GGT, and TYR. Compared with 15 ng/ml VNN1 enzyme, the fluorescence intensity of other interfering substances has almost no change, which proves that our probe has good selectivity in vitro (Figure 3). Meanwhile, compared with 15 ng/ml VNN1 enzyme, the emission spectrum of other interfering substances has almost no change, which proves that our probe has good selectivity in vitro (Figure 4). As depicted in Figure 5, ES-2-Fluc cells incubated with probe PA-AFC (20 μM) for 30 min without treated with Fe3+ provide strong fluorescent cells. After ES-2-Fluc cells were treated with Fe3+ and then incubated with probe PA-AFC for 30 min, they could emit weak fluorescence imaging in the cells. These thought-provoking results confirmed again that fluorescence quenching of probe PA-AFC by Fe3+. The results of fluorescence quantum yield also support this conclusion (Table 2).
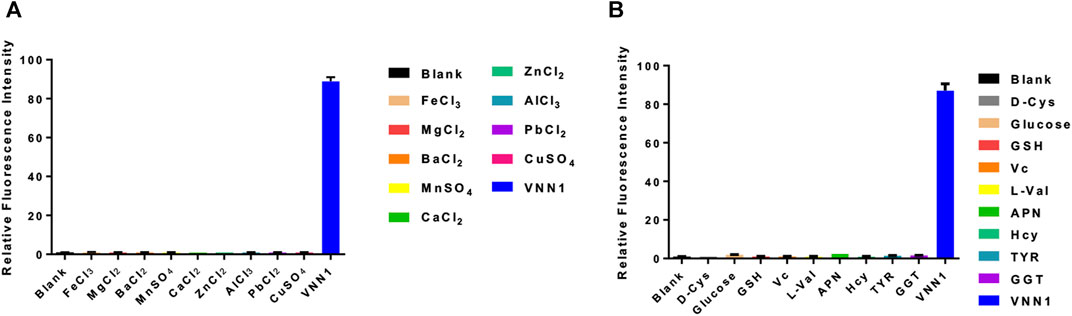
FIGURE 3. Probe in vitro selectivity experiment. (A) Relative fluorescence intensity of probe PA-AFC and various inorganic salts (1 mM), VNN1 enzyme concentration is 15 ng/ml; (B) Relative fluorescence intensity of probe PA-AFC and the following substance: Reduced glutathione (1 mM), D-cysteine (1 mM), glucose (1 mM), vitamin C sodium salt (1 mM), L-valine (1 mM), Homocysteine (1 mM) (1 mM), APN, (50 U/L) GGT (50 U/L), TYR (100 ng/ml), and VNN1 enzyme (15 ng/ml).
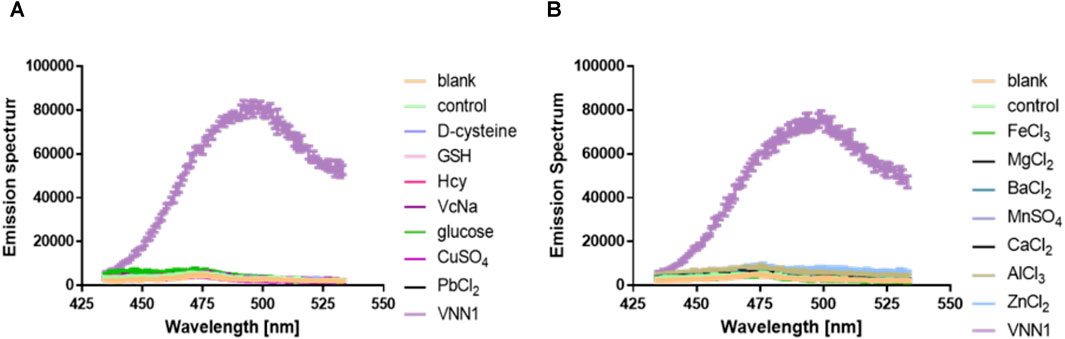
FIGURE 4. Probe in vitro selectivity experiment. (A) Emission spectrum of probe PA-AFC and the following substance: Reduced glutathione (1 mM), D-cysteine (1 mM), glucose (1 mM), vitamin C sodium salt (1 mM), Homocysteine (1 mM) (1 mM), inorganic salts (1 mM) and VNN1 enzyme (15 ng/ml); (B) Emission spectrum of probe PA-AFC and various inorganic salts (1 mM), VNN1 enzyme concentration is 15 ng/ml.
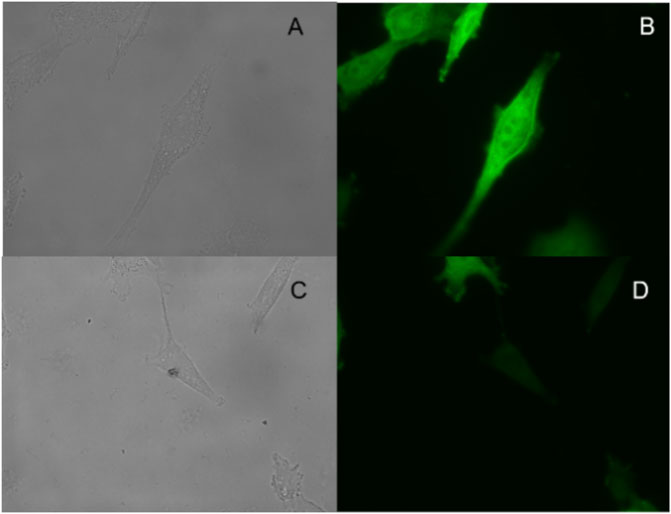
FIGURE 5. Fluorescence imaging of living ES-2-Fluc cells: top row, ES-2-Fluc cells incubated with the probe PA-AFC (20 μM) for 30 min: (A) bright-field, (B) green channel; bottom row, ES-2-Fluc cells incubated with the probe PA-AFC (20 μM) and Fe3+ (1 mM) for 30 min: (C) bright-field, (D) green channel.
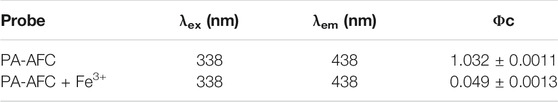
TABLE 2. Fluorescence quantum yield.
Inhibitory Activity in vitro
We used the fluorescent probe PA-AFC to evaluate the inhibitory activity of the designed and synthesized small molecule inhibitors on human recombinant VNN1 enzyme in vitro (Table 3). Among them, compound a has the best inhibitory activity, with an IC50 value of 20.17 μM, which is expected to become a new skeleton for vanin-1 enzyme inhibitors and drugs for the treatment of related diseases.
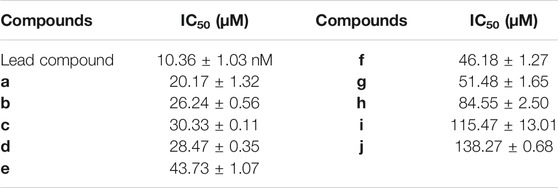
TABLE 3. Inhibitory activity of compounds in vitro.
Inhibitory Activity in Cellulo
We first dilute the inhibitor to three concentrations of 250, 125, and 62.5 μM, and use the MTT method and bioluminescence probe PA-AL to study the cytotoxicity of the inhibitor. As shown in Supplementary Figure S1, our inhibitor has less cytotoxicity and will not interfere with the experimental results under the experimental conditions of cell bioluminescence imaging.
Afterward, we applied the compound to ES-2-Fluc cells expressing firefly luciferase, using the bioluminescent probe PA-AL, to visually evaluate its inhibitory activity at the cellular level. Among them, compound a has the best inhibitory effect, with an IC50 value of 9.08 μM (Table 4). In addition, we found that the cellular level and enzyme level in vitro screening results are highly consistent in trend.
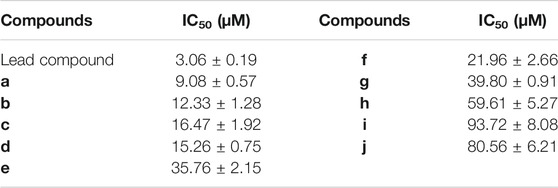
TABLE 4. Inhibitory activity of each compound at the cellular level.
Inhibitory Effects of Inhibitors on Transgenic Mice in vivo
We tested the in vivo activity of lead compound and the dominant compound a in transgenic mice. As shown in Figure 6, about 30 min after injection of the bioluminescence probe PA-AL, the bioluminescence intensity of each group of mice reached the peak. As shown in Figures 4A,B, at the peak, whether it is the leading compound group or the compound a group, under physiological conditions. The bioluminescence intensity of transgenic mice has been significantly reduced, which has a good inhibitory effect. As shown in Figure 4C, when it reaches the peak, the bioluminescence intensity of the lead compound group is only about one-third of that of the blank group, group 1c. The bioluminescence intensity is about one-half of the blank group.
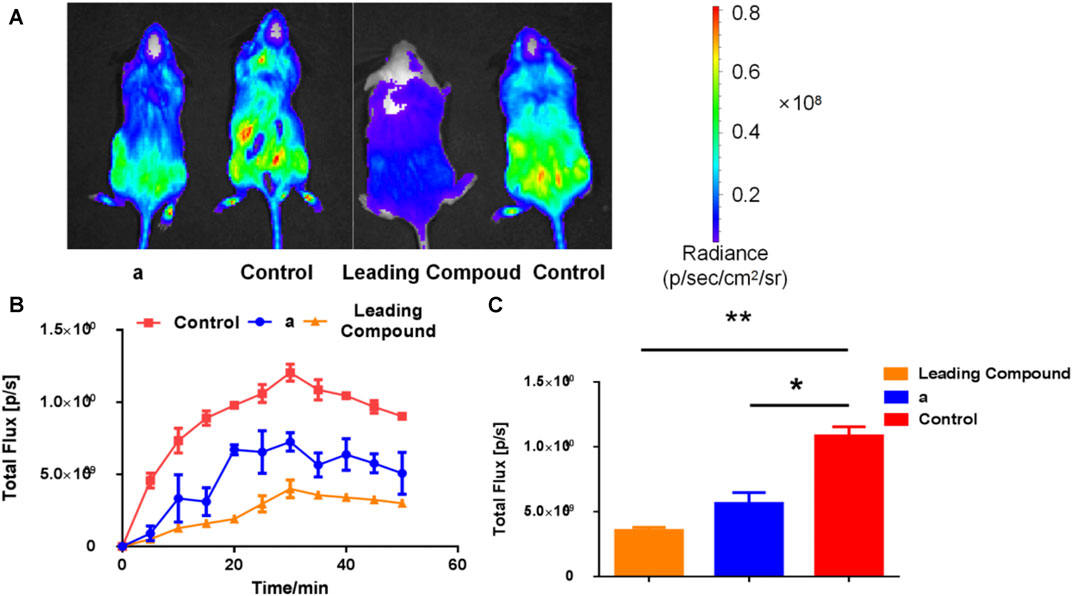
FIGURE 6. The expression of vanin-1 enzyme in FVB-luc + transgenic mice after oral administration of inhibitors, and probe (1 mM, 200 μl) was injected 1.5 h later. (A) Bioluminescence imaging pictures of compound a group (50 mg/kg) and lead compound group (25 mg/kg) 30 min after probe injection; (B) bioluminescence intensity in mice at different times after probe injection (C) Software analysis Figure 4A is the bioluminescence intensity value 30 min after the probe is injected (n ≥ 3; *p < 0.05, **p < 0.01 vs. Control).
Application of Vanin-1 Inhibitors in Mouse Colitis Model
Subsequently, we explored the effects of two vanin-1/VNN1 small molecule inhibitors on mouse colitis models. We selected the chemical agent TNBS to induce colitis in mice. The subsequent exploration process was mainly carried out by observing the macroscopic clinical symptoms of each group of mice (Table 5), intestinal specimen observation (Figure 7), microscopic pathological section observation, and section inflammation score. The experimental results obtained are uniform. TNBS can indeed cause serious intestinal damage to mice, causing them to experience symptoms such as lack of food, curled up, dull coat, loose stools, bloody stools, and even death. However, this damage can be significantly improved by oral vanin-1/VNN1 small molecule inhibitors. The clinical symptoms are varied or no symptoms appear, the intestinal necrosis or atrophy is reduced, and the fatality rate is greatly reduced (Figure 8B). However, the effects of the two inhibitors are not the same (Figure 8A), which is probably caused by the difference in the inhibitory effects of the two inhibitors. The better the inhibitory effect, the more obvious the improvement of the inflammatory injury, and vice versa, the less obvious the effect.
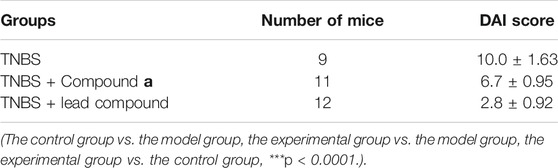
TABLE 5. DAI score results of mice in each group.
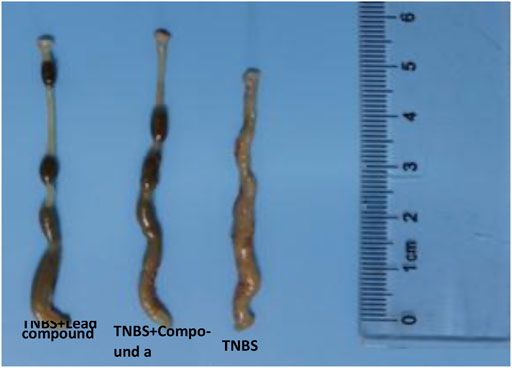
FIGURE 7. Observation of intestinal characteristics of mice in each group.
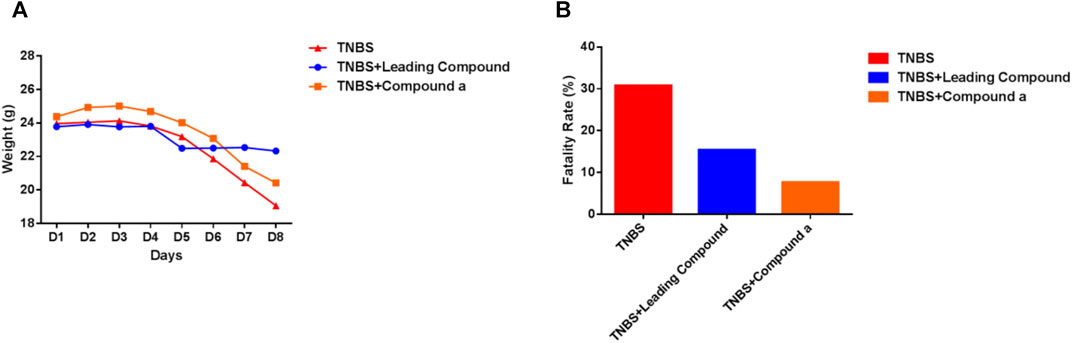
FIGURE 8. Clinical symptoms of mice in each group. (A) Changes in the average body weight of each group of mice during the modeling period. (B) Fatality rate of mice in each group (n = 13).
After taking out the intestinal specimens of each group of mice, they were observed by naked eyes. Observation results display that in the TNBS colitis animal model, the lesions of the end of the colon are the main ones. Compared with the control group, the experimental group has obvious intestinal distortion and non-granular intestinal contents, while the model group has obvious continuous edema, transmural necrosis, and shortened intestinal atrophy (Figure 9 and Table 6).
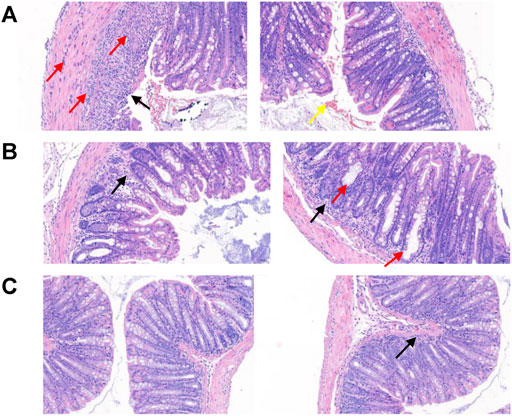
FIGURE 9. Observation of intestinal pathological sections of mice in each group. (A) In the model group, the intestinal pathological section of the mice was imaged. Observation and analysis showed that the tissues were local ulcers and the mucosal epithelium was missing (black arrow); the intestinal gland structure disappeared and was replaced by hyperplastic connective tissue, and a small amount of connective tissue hyperplasia was also seen in the submucosa. More inflammatory cell infiltration can be seen in the mucosal layer, submucosa, and muscle layer (red arrow), a small amount of epithelial cell necrosis, and nuclear fragmentation or pyknosis (yellow arrow). (B) The intestinal pathological section of the mice in the experimental group was imaged. Observation and analysis showed that the structure of each layer of the tissue was clear, the mucosal epithelium was intact, the intestinal glands were loosely arranged, and a small amount of inflammatory cell infiltration (black arrow) was seen in the lamina propria, and more intestinal glands were expanded in Irregular shape (red arrow). (C) The intestinal pathological section of mice in the control group was imaged. Observation and analysis showed that the structure of each layer of the tissue was clear, the mucosal epithelium was intact, the intestinal glands were abundant and arranged tightly, and a small amount of inflammatory cell infiltration (black arrow) was seen in the mucosal layer, without obvious abnormality.
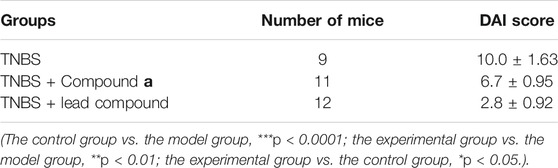
TABLE 6. Intestinal inflammation scores of mice in each group.
Conclusion
In the current study, we designed and synthesized a series of vanin-1/VNN1 small molecule inhibitors with different backbones, and used fluorescent probes and bioluminescent probes to visually evaluate their inhibitory activity at different levels, and established a set of screening inhibitors of this enzyme. In addition, we have proved that vanin-1/VNN1 does play a certain role as a pro-inflammatory agent during the occurrence of IBD. Our research results also indicate that the development of vanin-1/VNN1 inhibitors will become a new direction of effective treatment for IBD to relieve the suffering of patients.
We will continue to use visualization-based method to screen out inhibitors with enhanced inhibitory activity, and apply them to more disease models related to vanin-1/VNN1, evaluate their effects, explore their mechanisms of action, and develop diseases therapeutic drugs.
Data Availability Statement
The original contributions presented in the study are included in the article/Supplementary Material, further inquiries can be directed to the corresponding author.
Ethics Statement
The animal study was reviewed and approved by the Ethics Committee of Cheeloo College of Medicine, Shandong University.
Author Contributions
GW, JW, and LD conceived and designed the experiments. GW and JW performed the experiments. GW, JW, LD, and ML contributed to writing the manuscript. All authors read and approved the manuscript.
Funding
The present project is supported by the National Natural Science Foundation of China (No. 81874308), the Shandong Natural Science Foundation (No. ZR2018ZC0233) and the Taishan Scholar Program at Shandong Province.
Conflict of Interest
The authors declare that the research was conducted in the absence of any commercial or financial relationships that could be construed as a potential conflict of interest.
Publisher’s Note
All claims expressed in this article are solely those of the authors and do not necessarily represent those of their affiliated organizations, or those of the publisher, the editors, and the reviewers. Any product that may be evaluated in this article, or claim that may be made by its manufacturer, is not guaranteed or endorsed by the publisher.
Acknowledgments
The article was written through contributions of all authors.
Supplementary Material
The Supplementary Material for this article can be found online at: https://www.frontiersin.org/articles/10.3389/fchem.2021.809495/full#supplementary-material
References
Berruyer, C., Pouyet, L., Millet, V., Martin, F. M., LeGoffic, A., Canonici, A., et al. (2006). Vanin-1 Licenses Inflammatory Mediator Production by Gut Epithelial Cells and Controls Colitis by Antagonizing Peroxisome Proliferator-Activated Receptor γ Activity. J. Exp. Med. 203 (13), 2817–2827. doi:10.1084/jem.20061640
Boersma, Y. L., Newman, J., Adams, T. E., Cowieson, N., Krippner, G., Bozaoglu, K., et al. (2014). The Structure of Vanin 1: a Key Enzyme Linking Metabolic Disease and Inflammation. Acta Crystallogr. D Biol. Crystallogr. 70 (Pt 12), 3320–3329. doi:10.1107/S1399004714022767
Dupre, S., Graziani, M. T., Rosei, M. A., Fabi, A., and Grosso, E. (1970). The Enzymatic Breakdown of Pantethine to Pantothenic Acid and Cystamine. Eur. J. Biochem. 16 (3), 571–578. doi:10.1111/j.1432-1033.1970.tb01119.x
Gurung, A. B., Bhutia, J. T., and Bhattacharjee, A. (2020). High-throughput Virtual Screening of Novel Potent Inhibitor(s) for Human Vanin-1 Enzyme. J. Biomol. Struct. Dyn., 1–16. doi:10.1080/07391102.2020.1854857
Hu, Y., Li, H., Shi, W., and Ma, H. (2017). Ratiometric Fluorescent Probe for Imaging of Pantetheinase in Living Cells. Anal. Chem. 89 (20), 11107–11112. doi:10.1021/acs.analchem.7b03303
Jansen, P. A. M., van Diepen, J. A., Ritzen, B., Zeeuwen, P. L. J. M., Cacciatore, I., Cornacchia, C., et al. (2013). Discovery of Small Molecule Vanin Inhibitors: New Tools to Study Metabolism and Disease. ACS Chem. Biol. 8 (3), 530–534. doi:10.1021/cb3006424
Lin, Y., Gao, Y., Ma, Z., Li, Z., Tang, C., Qin, X., et al. (2018). Bioluminescent Probe for Detection of Starvation-Induced Pantetheinase Upregulation. Anal. Chem. 90 (15), 9545–9550. doi:10.1021/acs.analchem.8b02266
Lu, P., Zhang, C., Fu, L., Wei, Y., Huang, Y., Wang, X., et al. (2021). Near-infrared Fluorescent Probe for Imaging and Evaluating the Role of Vanin-1 in Chemotherapy. Anal. Chem. 93 (29), 10378–10387. doi:10.1021/acs.analchem.1c02386
Naquet, P., Pitari, G., Duprè, S., and Galland, F. (2014). Role of the Vnn1 Pantetheinase in Tissue Tolerance to Stress. Biochem. Soc. Trans. 42 (4), 1094–1100. doi:10.1042/bst20140092
Qian, J., Teng, Z., Wang, J., Zhang, L., Cao, T., Zheng, L., et al. (2020). Visible to Near-Infrared Emission Ratiometric Fluorescent Probe for the Detection of Vanin-1 In Vivo. ACS Sens. 5 (9), 2806–2813. doi:10.1021/acssensors.0c00880
Qian, J., Zhang, L., Wang, J., Teng, Z., Cao, T., Zheng, L., et al. (2021). Red Emission Ratio Fluorescent Probe for the Activity of Vanin-1 and Imaging In Vivo. J. Hazard. Mater. 401, 123863. doi:10.1016/j.jhazmat.2020.123863
Rommelaere, S., Millet, V., Gensollen, T., Bourges, C., Eeckhoute, J., Hennuyer, N., et al. (2013). PPARalpha Regulates the Production of Serum Vanin-1 by Liver. FEBS Lett. 587 (22), 3742–3748. doi:10.1016/j.febslet.2013.09.046
Ruan, B. H., Cole, D. C., Wu, P., Quazi, A., Page, K., Wright, J. F., et al. (2010). A Fluorescent Assay Suitable for Inhibitor Screening and Vanin Tissue Quantification. Anal. Biochem. 399 (2), 284–292. doi:10.1016/j.ab.2009.12.010
Sahoo, S., and Crisponi, G. (2019). Recent Advances on Iron(III) Selective Fluorescent Probes with Possible Applications in Bioimaging. Molecules 24 (18), 3267. doi:10.3390/molecules24183267
Ueno, T., Urano, Y., Setsukinai, K.-i., Takakusa, H., Kojima, H., Kikuchi, K., et al. (2004). Rational Principles for Modulating Fluorescence Properties of Fluorescein. J. Am. Chem. Soc. 126 (43), 14079–14085. doi:10.1021/ja048241k
van Diepen, J. A., Jansen, P. A., Ballak, D. B., Hijmans, A., Hooiveld, G. J., Rommelaere, S., et al. (2014). PPAR-alpha Dependent Regulation of Vanin-1 Mediates Hepatic Lipid Metabolism. J. Hepatol. 61 (2), 366–372. doi:10.1016/j.jhep.2014.04.013
Wedel, J., Jansen, P. A. M., Botman, P. N. M., Rutjes, F. P. J. T., Schalkwijk, J., and Hillebrands, J.-L. (2016). Pharmacological Inhibition of Vanin Activity Attenuates Transplant Vasculopathy in Rat Aortic Allografts. Transplantation 100 (8), 1656–1666. doi:10.1097/tp.0000000000001169
Keywords: vanin-1, VNN1 inhibitors, probe, visualization of biological activity, colitis model in mice
Citation: Wang G, Wang J, Du L and Li M (2022) Visualization-Based Discovery of Vanin-1 Inhibitors for Colitis. Front. Chem. 9:809495. doi: 10.3389/fchem.2021.809495
Received: 05 November 2021; Accepted: 29 December 2021;
Published: 28 January 2022.
Edited by:
Maria Valeria Raimondi, University of Palermo, ItalyReviewed by:
Wenwu Qin, Northeast Normal University, ChinaAdriano Mollica, University “G. d’Annunzio” of Chieti-Pescara, Italy
Copyright © 2022 Wang, Wang, Du and Li. This is an open-access article distributed under the terms of the Creative Commons Attribution License (CC BY). The use, distribution or reproduction in other forums is permitted, provided the original author(s) and the copyright owner(s) are credited and that the original publication in this journal is cited, in accordance with accepted academic practice. No use, distribution or reproduction is permitted which does not comply with these terms.
*Correspondence: Minyong Li, bWxpQHNkdS5lZHUuY24=
†These authors have contributed equally to this work