 Meenu Upadhyay
 Markus Meuwly
- Department of Chemistry, University of Basel, Basel, Switzerland
The formation of molecules in and on amorphous solid water (ASW) as it occurs in interstellar space releases appreciable amounts of energy that need to be dissipated to the environment. Here, energy transfer between CO2 formed within and on the surface of amorphous solid water (ASW) and the surrounding water is studied. Following CO(1Σ+) + O(1D) recombination the average translational and internal energy of the water molecules increases on the
1 Introduction
The motion of adsorbates in and on amorphous solid water (ASW) is essential for chemistry at astrophysical conditions. Typically, bulk water is present in the form of ASW which is the main component of interstellar ices. (Hagen et al., 1981). The structure of ASW is usually probed by spectroscopic measurements (Hagen et al., 1981; Jenniskens and Blake, 1994) although interference-based methods have also been employed. (Bossa et al., 2012). ASWs are porous structures characterized by surface roughness and internal cavities of different sizes which can retain molecular or atomic guests. (Bar-Nun et al., 1987). Under laboratory conditions the water ices have been reported to be porous (He et al., 2016; Kouchi et al., 2020) or non-porous (Oba et al., 2009; He et al., 2016; Kouchi et al., 2020) ASW whereas the morphology of ices in the interstellar medium is more debated. (Keane et al., 2001; Kouchi et al., 2021).
The high porosity of ASW (Bossa et al., 2014; Bossa et al., 2015; Cazaux et al., 2015) makes it a good catalyst for gas-surface reactions involving oxygen (Ioppolo et al., 2011a; Romanzin et al., 2011; Chaabouni et al., 2012; Minissale et al., 2013a; Dulieu et al., 2017; Pezzella et al., 2018; Pezzella and Meuwly, 2019; Christianson and Garrod, 2021), hydrogen (Hama and Watanabe, 2013), carbonaceous (Minissale et al., 2013b; Minissale et al., 2016a; Qasim et al., 2020; Molpeceres et al., 2021) and nitrogen-containing (Minissale et al., 2014) species and helps maintaining those species on (Minissale et al., 2019) or inside ASW. (Minissale et al., 2016b; Tsuge et al., 2020). This increases the probability for the reaction partners to diffuse to locations for collisions and association reactions to occur. As the diffusivity of individual atoms and small molecules has been established from both, experiments and simulations, (Minissale et al., 2013b; Lee and Meuwly, 2014; Pezzella et al., 2018), this is a likely scenario for formation of molecules on and within ASW.
Earlier thermoluminescence experiments suggested that the O(3P)+CO(1Σ+) reaction with both reaction partners in their electronic ground state yields excited
For adsorbed species to react on ASW they need to be able to diffuse. This has been demonstrated from MD simulations with diffusion coefficients and desorption energies consistent with experiments. (Lee and Meuwly, 2014; Ghesquière et al., 2015). Atomic oxygen (Pezzella et al., 2018) on ASW experiences diffusional barriers between Edif = 0.2 kcal/mol and 2 kcal/mol (100–1000 K) compared with values of
As such association reactions are in general exothermic, the energy released needs to be transferred to environmental degrees of freedom for the reaction products to stabilize. This is the quest of the present work which investigates the time scale and degrees of freedom to receive the energy liberated for the O(1D)+CO(1Σ+) reaction to form ground state CO2(
After recombination O(1D)+CO(1Σ+) → CO2(
2 Computational Methods
All molecular dynamics (MD) simulations were carried out using the CHARMM suite of programs (Brooks et al., 2009) with provisions for bond forming reactions through multi state adiabatic reactive MD (MS-ARMD). (Nagy and Yosa Reyes, 2014). The simulation system, Figure 1, consisted of an equilibrated cubic box of amorphous solid water with dimension 31 × 31 × 31 Å3 containing 1000 water molecules. As all bonds and angles are flexible, the simulations were run with a time step of Δt = 0.1 fs and the non-bonded cutoff was at 13 Å. Simulations were started from an existing, equilibrated ASW structure (Pezzella et al., 2018; Pezzella and Meuwly, 2019; Upadhyay et al., 2021) by adding COA and OB inside (Figure 1A) or on top of (Figure 1B) ASW.
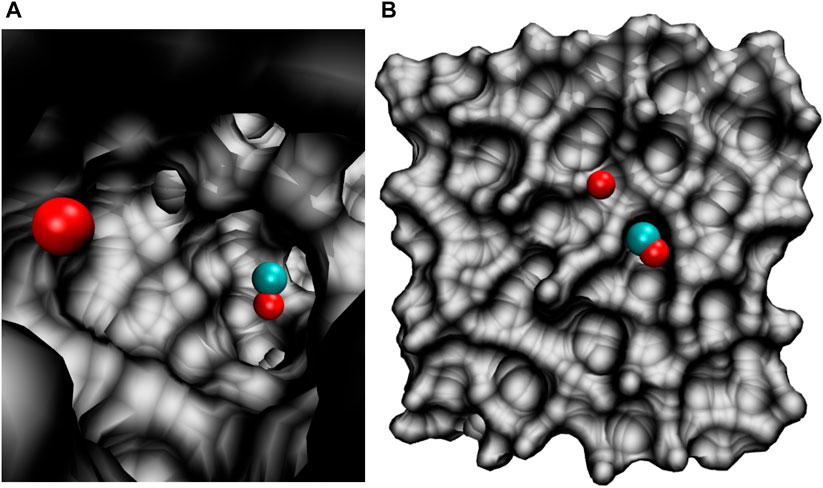
FIGURE 1. The simulation system for studying the O(1D)+CO(1Σ+)→ CO2(
In the following, the coordinates are the CO stretch r, the separation R between the center of mass of COA and OB and θ is the OACOB angle. In addition, the C–OB separation will be considered where appropriate. Initial conditions were generated for a grid of angles θ and separations R and simulations were carried out to obtain initial coordinates and velocities for each of the grid points. With constrained CO and O position, first 750 steps of steepest descent and 100 steps Adopted Basis Newton-Raphson minimization were carried out, followed by 50 ps heating dynamics to 50 K. Then, 100 ps equilibration dynamics was carried out. From each of the runs coordinates and velocities were saved regularly to obtain initial conditions for each combination of angle and distance. Production simulations 500 ps or 6 ns in length were then run from saved coordinates and velocities in the NVE ensemble. Data (energies, coordinates and velocities) were saved every 1000 steps for subsequent analysis.
Water was described by a reparametrized, (Burnham et al., 1997; Plattner and Meuwly, 2008), flexible KKY (Kumagai, Kawamura, Yokokawa) model. (Kumagai et al., 1994). The typical water modes that couple in the
For CO2, the partial charges were qO = − 0.3e and qC = 0.6e with standard van der Waals parameters from CHARMM. These charges are consistent with those obtained from B3LYP/6-31G (d,p) calculations snapshots from the MD simulations with CO2 adsorbed to a small water cluster (H2O)10 which yield qC = 0.73e and qO = − 0.35e. This compares with charges of qC = 0.22e and qO = − 0.21e for the CO molecule and qO = − 0.1e for an oxygen atom adsorbed to (H2O)10. To assess the dependence of the results on the partial charges used, additional reactive MD simulations using the MMH parametrization were carried out with qO = − 0.1e and qC = 0.2e (i.e., qCO = 0.1e) and with qO = − 0.2e and qC = 0.4e (i.e., qCO = 0.2e). In all cases, recombination was found to speed up compared with qCO = 0.3e and qO = − 0.3e due to the increased mobility of the CO molecule and the O atom on the ASW when reduced partial charges are used.
The main focus of the present work is to study energy redistribution within the system following recombination of COA + OB to form CO2. For this, the average total, translational and internal energy of the water molecules is analyzed for recombination on top of and inside ASW. Both, the time scale and amount of energy dissipated into translational and internal degrees of freedom was determined. The translational energy for the water molecules at each timestep was determined by first calculating the magnitude of the linear momentum of each water molecule from the stored velocities. From this the translational energy contribution is calculated for each water molecule considered and the total translational energy is accumulated. The internal energy for each water molecule is determined from the difference of the total kinetic energy and the translational energy.
3 Results and Discussion
In the following, the energy distribution in the water matrix of the ASW is separately discussed on the
3.1 Recombination on the 100 ps Time Scale
A typical trajectory for COA + OB recombination inside the ASW cavity is shown in Figure 2 (left column). Initially, the C–OB separation is
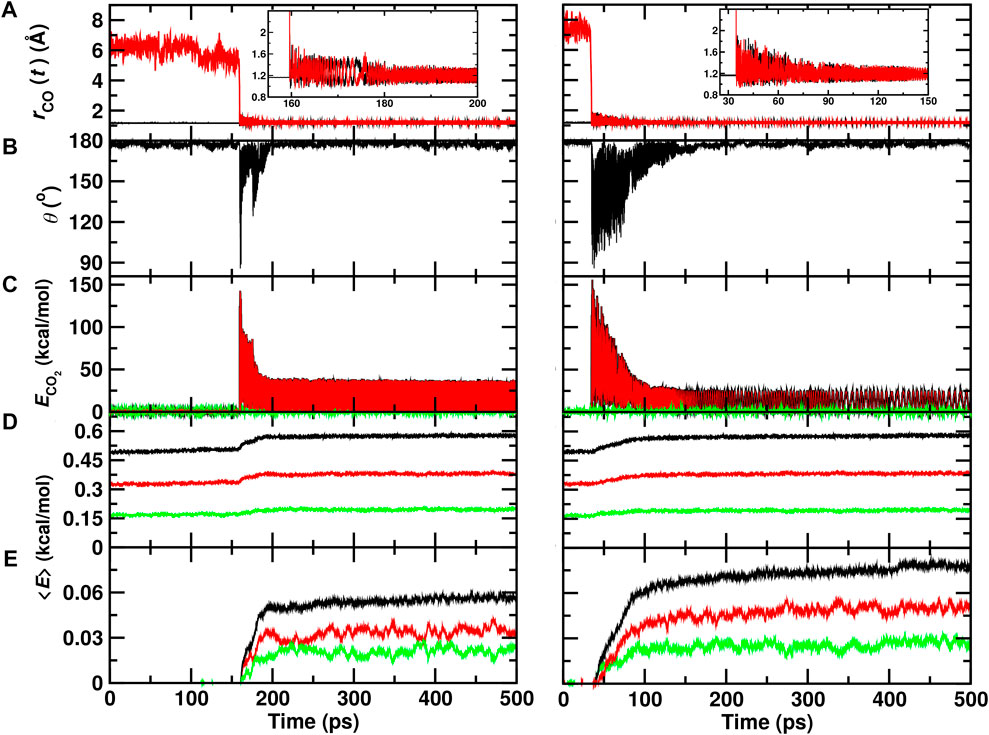
FIGURE 2. Recombination of O (1D)+CO(1Σ+) to form ground state
Figure 2 (right column) reports a recombination trajectory on top of ASW. In this case, recombination takes place after
From a set of 70 recombination trajectories for the reaction within the cavity and on top of the ASW surface, the averaged energy contents in translational, internal and all degrees of freedom of the water molecules were determined (Figure 3). For this analysis, the time of reaction was set to zero (t = 0) to align all reactive trajectories and all energies are reported relative to the averages before recombination. The translational contribution for recombination within and on top of ASW re-equilibrates on the ∼ 25 ps time scale after which no change in the phononic degrees of freedom is observed. Contrary to that, the internal degrees of freedom (red traces) show temporal evolution on two time scales: a rapid phase on the picosecond time scale, followed by a slow, long increase in the internal energies. This is also reflected in the averaged total energy (black).
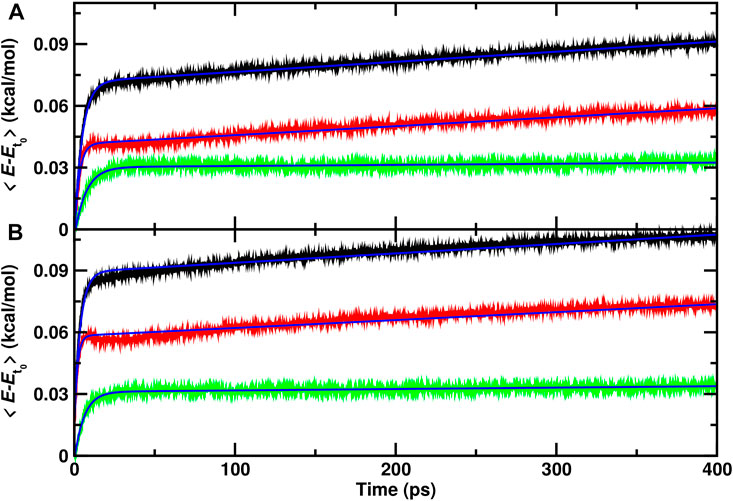
FIGURE 3. Average total (black), internal (red) and translational (green) energies for water over 70 independent runs relative to the average before recombination. The time of reaction for all trajectories is shifted to t =0 and defined by the first instance at which
As for the single trajectories, the amount of energy released from the recombination reaction into the translational degrees of freedom is similar for the reaction inside the cavity and on top of the ASW surface. For the internal degrees of freedom, however, recombination on top of the ASW surface leads on an average increase per water molecule by 0.075 kcal/mol within 400 ps (Figure 3B) compared with 0.06 kcal/mol for the process inside the cavity. Also, there is a characteristic decrease in the internal contribution for recombination on the surface after 15 ps which is even present when averaging over 70 independent runs. This feature is not found for recombination within ASW.
To estimate approximate time scales for the different processes involved, the average energies were fitted to an empirical expression
Average internal energies from representative independent runs for recombination inside the cavity and on top of the ASW surface are shown in Supplementary Figures S1, S2. For recombination inside the cavity (Supplementary Figure S1) the results confirm that the energy content in the internal degrees of freedom increases considerably faster than for the translation. Also, it is found that the amount of energy transferred to translation after recombination is smaller than that partitioned into internal degrees of freedom. For recombination on the ASW surface the same observations are made. In addition, the pronounced maximum after
3.2 Recombination Dynamics on Longer Time Scales
It is also of interest to analyze the energy redistribution on the multi-nanosecond time scale. Figure 4A demonstrates that the average total kinetic energy per water molecule continuously increases even on the nanosecond time scale. Most of this increase is due to the internal degrees of freedom although the translational component also shows a continuous slow increase on the nanosecond time scale.
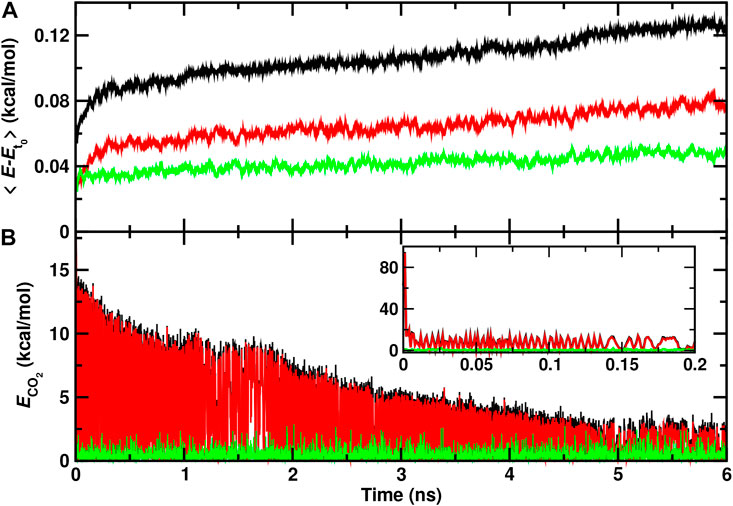
FIGURE 4. Total (black), internal (red), and translational (green) energies for water molecules (A) and for the recombined CO2 molecule (B) form a 6 ns rebinding trajectory on the top of the ASW surface. The time of reaction is shifted to t = 0 and defined by the first instance at which
The relaxation of the CO2 internal energy is reported in Figure 4B. Within the first few picoseconds (inset) the internal energy is quenched to
3.3 Energy Migration Around the Recombination Site
For a positionally resolved picture of energy flow the simulation system was separated in voxels with dimension 31 × 1 × 1 Å3. The kinetic energy of all water molecules within one such voxel was averaged along the trajectory and projected onto the (y, z) − plane. Which water molecules belong to a particular voxel was decided based on the water-oxygen atom coordinates. Figure 5A reports the distribution of total kinetic energy distribution before recombination. The recombination site is at (y = 2, z = 2) Å and marked as a large cross. Within the first 5 ps after recombination the kinetic energy of water molecules within ∼ 10 Å of the recombination site increases considerably, by up to a factor of 4. Following this, energy redistributes continuously across the entire surface on the 200 ps time scale, see panels C to F.
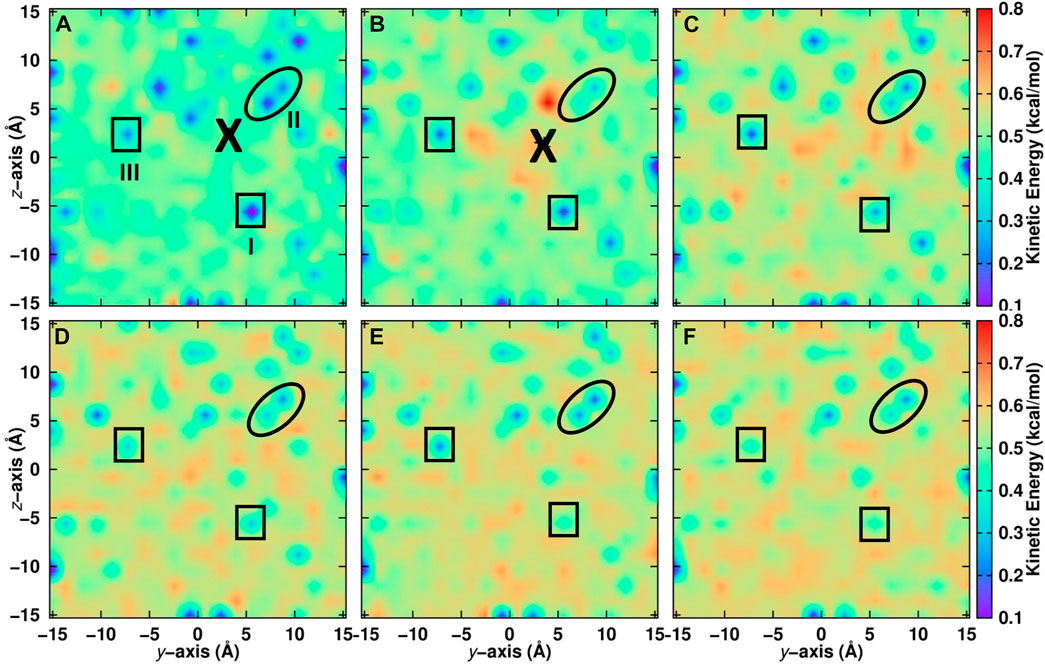
FIGURE 5. Kinetic energy of water molecules projected onto the (y, z) − plane averaged over seven independent simulations on the top layer of the ASW surface. Recombination of CO and O takes place at the location labelled with “X”. Before recombination (A): − 5 ≤ t ≤ 0 ps) and after recombination (B): 0 ≤ t ≤ 5 ps, (C): 5 ≤ t ≤ 10 ps, (D): 10 ≤ t ≤ 50 ps, (E): 50 ≤ t ≤ 100 ps and (F): 100 ≤ t ≤ 200 ps). The average position of CO is indicated by a large black cross. Noteworthy regions are labelled I to III and surrounded by solid lines. Region I is cool at early times and gradually warms up. Region II remains cool for most of the simulation time and region III alternates between cool and warm. For results within 10 Å of the surface, see Supplementary Figure S4.
Certain regions that are initially “cold” (blue)—e.g., the region labelled “I” at (y = 5, z = − 5) Å in Figure 5—warm up as energy transfer from CO2 to the water molecules occurs. Conversely, other regions remain “cool”, such as region “II” around (y = 5, z = 5) Å for which the color code remains blue until 200 ps. Yet for other regions, such as “III”, the total kinetic energy oscillates between cooler and warmer. It is also instructive to include only the first few ASW layers in this analysis which was done in Supplementary Figure S4. Here, the voxels have sizes 1 × 1 × 1 A3. For one, the cool regions are more extended before recombination. After recombination energy transfer occurs in a similar fashion as for the full system. However, the warm regions are less extended. This suggests that energy transfer also occurs to a considerable extent into the bulk rather than across the surface of the ASW even for recombination on top of ASW.
3.4 Energy Flow to Nearby Water Molecules
Finally, individual water molecules in immediate proximity of the recombination site are analyzed. For one trajectory with recombination on the ASW surface the average total, internal, and translational energies for the 5 water molecules closest to the recombination site are reported in Figure 6. During the first 10 ps after recombination the average total kinetic energy increases by up to 0.6 kcal/mol per water molecule. Conversely, the translational energy contribution fluctuates around zero which indicates that the local structure of ASW remains intact and most of the energy flows into internal degrees of freedom.
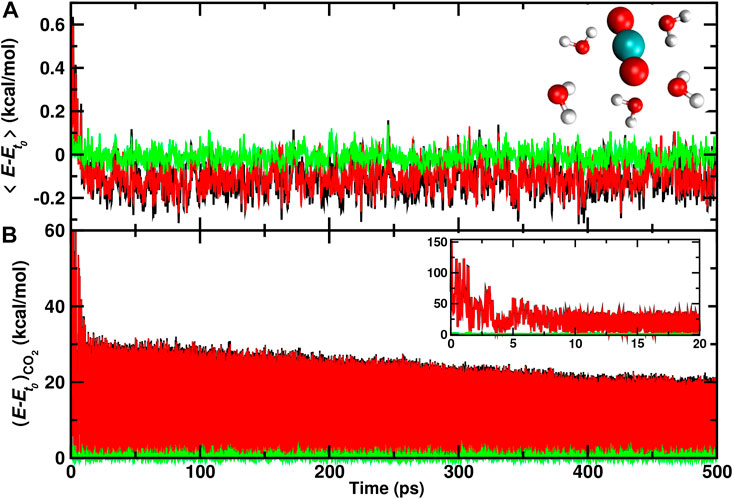
FIGURE 6. Average total (black), internal (red), and translational (green) energies for 5 water molecules (A) closest to the CO2, and the CO2 molecule (B) formed from a recombination trajectory on the ASW surface. The time of reaction is shifted to t = 0 and defined by the first instance at which
After this initial increase, cooling of these few nearby water molecules takes place with a long-time average of −0.1 kcal/mol per water molecule in the internal degrees of freedom. On the 500 ps no noticeable change in the translational energy content is observed. For the CO2 molecule (Figure 6B) the translational energy remains small throughout the trajectory whereas the internal energy decreases rapidly within the first 5 ps following recombination. Subsequently, slow gradual cooling on the 100 ps to nanosecond time scale takes place as was already found earlier, Figure 4.
4 Discussion and Conclusion
The present work reports on the energy redistribution across ASW following O(1D)+CO(1Σ+) recombination to form
It is of interest to note that - ultimately - energy redistribution in such systems follows quantum mechanical principles. The present results suggest that the local energy generated from CO + O recombination is probably sufficient to excite internal modes of individual water molecules surrounding the recombination site. Hence, after CO + O recombination the ASW will be in a state characterized by a few internally and vibrationally excited water molecules embedded into a matrix of water molecules in the ground state. Earlier work on a related problem—the vibrational relaxation of a quantum oscillator coupled to oscillators of a biomolecule (Stock, 2009)—found that using classical mechanics leads to qualitatively correct results compared with a full quantum treatment. For the relaxation times a moderate factor of two for the difference between classical and rigorous quantum simulations was reported. Hence, for the present problem it is also expected that similar conclusions apply and that the nonequilibrium relaxation dynamics of individual vibrationally excited water molecules surrounded by vibrationally cold water molecules can be captured qualitatively from using classical dynamics.
In summary, the present work demonstrates that O(1D)+CO(1Σ+) recombination to form
Data Availability Statement
The raw data supporting the conclusion of this article will be made available by the authors, without undue reservation. Data on the simulations and the PESs is available at: https://github.com/MMunibas/co2.asw and https://github.com/MMunibas/CO2-PESs.
Author Contributions
MM designed research, MU carried out simulations, MU and MM analyzed results, MU and MM wrote manuscript.
Conflict of Interest
The authors declare that the research was conducted in the absence of any commercial or financial relationships that could be construed as a potential conflict of interest.
Publisher’s Note
All claims expressed in this article are solely those of the authors and do not necessarily represent those of their affiliated organizations, or those of the publisher, the editors and the reviewers. Any product that may be evaluated in this article, or claim that may be made by its manufacturer, is not guaranteed or endorsed by the publisher.
Acknowledgments
The authors gratefully acknowledge financial support from the Swiss National Science Foundation through grant 200 021-117 810 and to the NCCR-MUST.
Supplementary Material
The Supplementary Material for this article can be found online at: https://www.frontiersin.org/articles/10.3389/fchem.2021.827085/full#supplementary-material
References
Bar-Nun, A., Dror, J., Kochavi, E., and Laufer, D. (1987). Amorphous Water Ice and its Ability to Trap Gases. Phys. Rev. B 35, 2427–2435. doi:10.1103/physrevb.35.2427
Bossa, J.-B., Isokoski, K., de Valois, M. S., and Linnartz, H. (2012). Thermal Collapse of Porous Interstellar Ice. A&A 545, A82. doi:10.1051/0004-6361/201219340
Bossa, J.-B., Isokoski, K., Paardekooper, D. M., Bonnin, M., van der Linden, E. P., Triemstra, T., et al. (2014). Porosity Measurements of Interstellar Ice Mixtures Using Optical Laser Interference and Extended Effective Medium Approximations. A&A 561, A136. doi:10.1051/0004-6361/201322549
Bossa, J.-B., Maté, B., Fransen, C., Cazaux, S., Pilling, S., Rocha, W. R. M., et al. (2015). Porosity and Band-Strength Measurements of Multi-phase Composite Ices. ApJ 814, 47. doi:10.1088/0004-637x/814/1/47
Brooks, B. R., Mackerell, A. D., Nilsson, L., Petrella, R. J., Roux, B., Won, Y., et al. (2009). CHARMM: the Biomolecular Simulation Program. J. Comput. Chem. 30, 1545–1614. doi:10.1002/jcc.21287
Burnham, C. J., Li, J.-C., and Leslie, M. (1997). Molecular Dynamics Calculations for Ice Ih. J. Phys. Chem. B 101, 6192–6195. doi:10.1021/jp9632596
Cazaux, S., Bossa, J.-B., Linnartz, H., and Tielens, A. G. G. M. (2015). Pore Evolution in Interstellar Ice Analogues. A&A 573, A16. doi:10.1051/0004-6361/201424466
Chaabouni, H., Minissale, M., Manicò, G., Congiu, E., Noble, J. A., Baouche, S., et al. (2012). Water Formation through O2 + D Pathway on Cold Silicate and Amorphous Water Ice Surfaces of Interstellar Interest. J. Chem. Phys. 137, 234706–706. doi:10.1063/1.4771663
Christianson, D. A., and Garrod, R. T. (2021). Chemical Kinetics Simulations of Ice Chemistry on Porous versus Non-porous Dust Grains. Front. Astro. Space Sci. 8, 21. doi:10.3389/fspas.2021.643297
Dulieu, F., Minissale, M., and Bockelée-Morvan, D. (2017). Production of O2 through Dismutation of H2O2 during Water Ice Desorption: a Key to Understanding Comet O2 Abundances. A&A 597, A56. doi:10.1051/0004-6361/201628445
Fournier, J., Deson, J., Vermeil, C., and Pimentel, G. C. (1979). Fluorescence and Thermoluminescence of N2O, CO, and CO2 in an Argon Matrix at Low Temperature. J. Chem. Phys. 70, 5726–5730. doi:10.1063/1.437399
Fredon, A., Radchenko, A. K., and Cuppen, H. M. (2021). Quantification of the Role of Chemical Desorption in Molecular Clouds. Acc. Chem. Res. 54, 745–753. doi:10.1021/acs.accounts.0c00636
Garstang, R. H. (1951). Energy Levels and Transition Probabilities in P2 and P4 Configurations. Monthly Notices R. Astronomical Soc. 111, 115–124. doi:10.1093/mnras/111.1.115
Ghesquière, P., Mineva, T., Talbi, D., Theulé, P., Noble, J. A., and Chiavassa, T. (2015). Diffusion of Molecules in the Bulk of a Low Density Amorphous Ice from Molecular Dynamics Simulations. Phys. Chem. Chem. Phys. 17, 11455–11468. doi:10.1039/c5cp00558b
Hagen, W., Tielens, A. G. G. M., and Greenberg, J. M. (1981). The Infrared Spectra of Amorphous Solid Water and Ice Ic between 10 and 140 K. Chem. Phys. 56, 367–379. doi:10.1016/0301-0104(81)80158-9
Hama, T., and Watanabe, N. (2013). Surface Processes on Interstellar Amorphous Solid Water: Adsorption, Diffusion, Tunneling Reactions, and Nuclear-Spin Conversion. Chem. Rev. 113, 8783–8839. doi:10.1021/cr4000978
He, J., Acharyya, K., and Vidali, G. (2016). Binding Energy of Molecules on Water Ice: Laboratory Measurements and Modeling. ApJ 825, 89. doi:10.3847/0004-637x/825/2/89
He, J., Emtiaz, S., and Vidali, G. (2018). Measurements of Diffusion of Volatiles in Amorphous Solid Water: Application to Interstellar Medium Environments. ApJ 863, 156. doi:10.3847/1538-4357/aad227
Ioppolo, S., Cuppen, H. M., and Linnartz, H. (2011). Surface Formation Routes of Interstellar Molecules: Hydrogenation Reactions in Simple Ices. Rend. Fis. Acc. Lincei 22, 211–224. doi:10.1007/s12210-011-0135-3
Ioppolo, S., Van Boheemen, Y., Cuppen, H. M., Van Dishoeck, E. F., and Linnartz, H. (2011). Surface Formation of CO2 Ice at Low Temperatures. Mon. Not. R. Astron. Soc. 413, 2281–2287. doi:10.1111/j.1365-2966.2011.18306.x
Jenniskens, P., and Blake, D. F. (1994). Structural Transitions in Amorphous Water Ice and Astrophysical Implications. Science 265, 753–756. doi:10.1126/science.11539186
Karssemeijer, L., Ioppolo, S., van Hemert, M., van der Avoird, A., Allodi, M., Blake, G., et al. (2013). Dynamics of CO in Amorphous Water-Ice Environments. Astrophys. J. 781, 1–15. doi:10.1088/0004-637x/781/1/16
Keane, J. V., Tielens, A. G. G. M., Boogert, A. C. A., Schutte, W. A., and Whittet, D. C. B. (2001). Ice Absorption Features in the 5-8μm Region toward Embedded Protostars. A&A 376, 254–270. doi:10.1051/0004-6361:20010936
Kouchi, A., Furuya, K., Hama, T., Chigai, T., Kozasa, T., and Watanabe, N. (2020). Direct Measurements of Activation Energies for Surface Diffusion of CO and CO2 on Amorphous Solid Water Using In Situ Transmission Electron Microscopy. ApJL 891, L22. doi:10.3847/2041-8213/ab78a2
Kouchi, A., Tsuge, M., Hama, T., Oba, Y., Okuzumi, S., Sirono, S.-i., et al. (2021). Transmission Electron Microscopy Study of the Morphology of Ices Composed of H2O, CO2, and CO on Refractory Grains. ApJ 918, 45. doi:10.3847/1538-4357/ac0ae6
Kumagai, N., Kawamura, K., and Yokokawa, T. (1994). An Interatomic Potential Model for H2O: Applications to Water and Ice Polymorphs. Mol. Simulation 12, 177–186. doi:10.1080/08927029408023028
Lee, M. W., and Meuwly, M. (2014). Diffusion of Atomic Oxygen Relevant to Water Formation in Amorphous Interstellar Ices. Faraday Discuss. 168, 205–222. doi:10.1039/c3fd00160a
Lee, M. W., and Meuwly, M. (2011). On the Role of Nonbonded Interactions in Vibrational Energy Relaxation of Cyanide in Water. J. Phys. Chem. A. 115, 5053–5061. doi:10.1021/jp202503m
Minissale, M., Congiu, E., Baouche, S., Chaabouni, H., Moudens, A., Dulieu, F., et al. (2013). Quantum Tunneling of Oxygen Atoms on Very Cold Surfaces. Phys. Rev. Lett. 111, 053201. doi:10.1103/PhysRevLett.111.053201
Minissale, M., Congiu, E., and Dulieu, F. (2016). Direct Measurement of Desorption and Diffusion Energies of O and N Atoms Physisorbed on Amorphous Surfaces. A&A 585, A146. doi:10.1051/0004-6361/201526702
Minissale, M., Congiu, E., Manicò, G., Pirronello, V., and Dulieu, F. (2013). CO2 formation on Interstellar Dust Grains: a Detailed Study of the Barrier of the CO + O Channel. A&A 559, A49. doi:10.1051/0004-6361/201321453
Minissale, M., Fedoseev, G., Congiu, E., Ioppolo, S., Dulieu, F., and Linnartz, H. (2014). Solid State Chemistry of Nitrogen Oxides - Part I: Surface Consumption of NO. Phys. Chem. Chem. Phys. 16, 8257–8269. doi:10.1039/c3cp54917h
Minissale, M., Moudens, A., Baouche, S., Chaabouni, H., and Dulieu, F. (2016). Hydrogenation of CO-bearing Species on Grains: Unexpected Chemical Desorption of CO. Mon. Not. R. Astron. Soc. 458, 2953–2961. doi:10.1093/mnras/stw373
Minissale, M., Nguyen, T., and Dulieu, F. (2019). Experimental Study of the Penetration of Oxygen and Deuterium Atoms into Porous Water Ice. A&A 622, A148. doi:10.1051/0004-6361/201833830
Molpeceres, G., Kästner, J., Fedoseev, G., Qasim, D., Schömig, R., Linnartz, H., et al. (2021). Carbon Atom Reactivity with Amorphous Solid Water: H2O-Catalyzed Formation of H2CO. J. Phys. Chem. Lett. 12, 10854–10860. doi:10.1021/acs.jpclett.1c02760
Nagy, T., and Yosa Reyes, J. (2014). Multisurface Adiabatic Reactive Molecular Dynamics. J. Chem. Theor. Comput. 10, 1366–1375. doi:10.1021/ct400953f
Noble, J. A., Dulieu, F., Congiu, E., and Fraser, H. J. (2011). CO2 Formation in Quiescent Clouds: An Experimental Study of the CO + OH Pathway. ApJ 735, 121. doi:10.1088/0004-637x/735/2/121
Noble, J., Congiu, E., Dulieu, F., and Fraser, H. (2012). Thermal Desorption Characteristics of CO, O2 and CO2 on Non-porous Water, Crystalline Water and Silicate Surfaces at Submonolayer and Multilayer Coverages. Mon. Not. R. Astron. Soc. 421, 768–779.
Oba, Y., Miyauchi, N., Hidaka, H., Chigai, T., Watanabe, N., and Kouchi, A. (2009). Formation of Compact Amorphous H2O Ice by Codeposition of Hydrogen Atoms with Oxygen Molecules on Grain Surfaces. ApJ 701, 464–470. doi:10.1088/0004-637x/701/1/464
Oba, Y., Watanabe, N., Kouchi, A., Hama, T., and Pirronello, V. (2010). Experimental Study of CO2 Formation by Surface Reactions of Non-energetic OH Radicals with CO Molecules. ApJ 712, L174–L178. doi:10.1088/2041-8205/712/2/l174
Pezzella, M., and Meuwly, M. (2019). O2 Formation in Cold Environments. Phys. Chem. Chem. Phys. 21, 6247–6255. doi:10.1039/c8cp07474g
Pezzella, M., Unke, O. T., and Meuwly, M. (2018). Molecular Oxygen Formation in Interstellar Ices Does Not Require Tunneling. J. Phys. Chem. Lett. 9, 1822–1826. doi:10.1021/acs.jpclett.8b00328
Plattner, N., and Meuwly, M. (2008). Atomistic Simulations of CO Vibrations in Ices Relevant to Astrochemistry. ChemPhysChem 9, 1271–1277. doi:10.1002/cphc.200800030
Qasim, D., Fedoseev, G., Chuang, K.-J., He, J., Ioppolo, S., van Dishoeck, E. F., et al. (2020). An Experimental Study of the Surface Formation of Methane in Interstellar Molecular Clouds. Nat. Astron. 4, 781–785. doi:10.1038/s41550-020-1054-y
Qasim, D., Lamberts, T., He, J., Chuang, K.-J., Fedoseev, G., Ioppolo, S., et al. (2019). Extension of the HCOOH and CO2 Solid-State Reaction Network during the CO Freeze-Out Stage: Inclusion of H2CO. A&A 626, A118. doi:10.1051/0004-6361/201935068
Romanzin, C., Ioppolo, S., Cuppen, H. M., van Dishoeck, E. F., and Linnartz, H. (2011). Water Formation by Surface O3 Hydrogenation. J. Chem. Phys. 134, 084504–504. doi:10.1063/1.3532087
Roser, J. E., Vidali, G., Manicò, G., and Pirronello, V. (2001). Formation of Carbon Dioxide by Surface Reactions on Ices in the Interstellar Medium. Astrophys. J. Lett. 555, L61–L64. doi:10.1086/321732
Ruffle, D. P., and Herbst, E. (2001). New Models of Interstellar Gas-Grain Chemistry - III. Solid CO2. Mon. Not. R. Astron. Soc. 324, 1054–1062. doi:10.1046/j.1365-8711.2001.04394.x
Schmidt, F., Swiderek, P., and Bredehöft, J. H. (2019). Formation of Formic Acid, Formaldehyde, and Carbon Dioxide by Electron-Induced Chemistry in Ices of Water and Carbon Monoxide. ACS Earth Space Chem. 3, 1974–1986. doi:10.1021/acsearthspacechem.9b00168
Stief, L. J., Payne, W. A., and Klemm, R. B. (1975). A Flasch Photolysis-Resonance Fluorescence Study of the Formation of O(1D) in the Photolysis of Water and the Reaction of O(1D) with H2, Ar, and He −. J. Chem. Phys. 62, 4000–4008. doi:10.1063/1.430323
Stock, G. (2009). Classical Simulation of Quantum Energy Flow in Biomolecules. Phys. Rev. Lett. 102, 118301. doi:10.1103/physrevlett.102.118301
Tsuge, M., Hidaka, H., Kouchi, A., and Watanabe, N. (2020). Diffusive Hydrogenation Reactions of CO Embedded in Amorphous Solid Water at Elevated Temperatures ∼70 K. ApJ 900, 187. doi:10.3847/1538-4357/abab9b
Upadhyay, M., Pezzella, M., and Meuwly, M. (2021). Genesis of Polyatomic Molecules in Dark Clouds: CO2 Formation on Cold Amorphous Solid Water. J. Phys. Chem. Lett. 12, 6781–6787. doi:10.1021/acs.jpclett.1c01810
Veliz, J. C. S. V., Koner, D., Schwilk, M., Bemish, R. J., and Meuwly, M. (2021). The C(3P) + O2(
Keywords: reactive molecular dynamics, amorphous solid water, interstellar chemistry, energy redistribution, CO2 formation
Citation: Upadhyay M and Meuwly M (2022) Energy Redistribution Following CO2 Formation on Cold Amorphous Solid Water. Front. Chem. 9:827085. doi: 10.3389/fchem.2021.827085
Received: 01 December 2021; Accepted: 08 December 2021;
Published: 08 February 2022.
Edited by:
Heribert Reis, National Hellenic Research Foundation, GreeceCopyright © 2022 Upadhyay and Meuwly. This is an open-access article distributed under the terms of the Creative Commons Attribution License (CC BY). The use, distribution or reproduction in other forums is permitted, provided the original author(s) and the copyright owner(s) are credited and that the original publication in this journal is cited, in accordance with accepted academic practice. No use, distribution or reproduction is permitted which does not comply with these terms.
*Correspondence: Markus Meuwly, bS5tZXV3bHlAdW5pYmFzLmNo