 Menglin Chen1,2Jichao Zhai3Yulong An3Yan Li3
 Yunwu Zheng3Hao Tian4
 Rui Shi2
 Xiahong He2
 Can Liu3*
 Xu Lin1,2*
- 1Yunnan Key Laboratory of Wood Adhesives and Glued Products National Joint Engineering Research Center for Highly-Efficient Utilization of Forest Biomass Resources, Southwest Forestry University, Kunming, China
- 2Key Laboratory for Forest Resources Conservation and Utilization in the Southwest Mountains of China, Ministry of Education, Southwest Forestry University, Kunming, China
- 3National Joint Engineering Research Center for Highly-Efficient Utilization Technology of Forestry Resources, Kunming, China
- 4Agro-products Processing Research Institute, Yunnan Academy of Agricultural Sciences, Kunming, China
Biomass carbon dots (BCDs) have the advantages of being nontoxic, low cost and simple to prepare, have excellent optical properties, good biocompatibility and stability, and therefore have broad application prospects in areas such as heavy metal ion detection and optoelectronic devices. Herein, a simple, green, solvent-free method of preparing BCDs was developed. CDs with certain fluorescence properties were prepared by a solvent-free pyrolysis method at different temperatures using two abundant components (cellulose and lignin) of biomass resources as carbon sources. Both the cellulose CDs prepared at 300°C and the lignin CDs prepared at 350°C exhibited high quantum yields of 11.7% and 23.4%, respectively, a result that was mainly due to the high degree of graphitization. The analysis and results demonstrated the selectivity of CDs for the detection of various metal ion solutions. In particular, CDs are sensitive to Fe3+ and can be used as a fluorescent sensor for the detection of Fe3+, providing a more efficient, sustainable alternative for metal ion detection.
Introduction
Heavy metal ions are some of the most widespread hazards that cause water pollution. The smelting, printing and dyeing industries discharge a large amount of wastewater containing heavy metal ions during rapid development, and the heavy metal ions contained in the wastewater pose a serious threat to the environment and human health when they enter the ecological environment (Gogoi et al., 2015). Currently, several methods of detecting heavy metals in water have been developed, including atomic absorption spectroscopy, inductively coupled X-ray absorption spectroscopy and surface-enhanced Raman scattering (Pyle et al., 1996; Ding et al., 2012; Sun et al., 2017). These techniques have good detection limits and have been shown to provide accurate results. The available tests have excellent detection limits and provide more accurate results for this stage of demand (Lu et al., 2017). However, they also suffer from a number of disadvantages, such as the sample preparation process is complex, the instruments used are expensive and the analysis and testing process is time-consuming and costly.
To date, many detection methods based on fluorescent nanomaterials and organic molecules have been discovered, heavy metal ions are generally detected by measuring the intensity of fluorescence signals in water bodies (Ullah et al., 2018; Ding Y. et al., 2016; Zhang et al., 2018; Xu et al., 2004). However, the syntheses of fluorescent materials and organic molecules are limited by expensive raw materials and toxic reaction solvents, which result in secondary contamination in the detection of metal ions in water bodies. Therefore, it is highly desirable to find a green, sensitive and simple method of detecting metal ions. Fe3+ is widespread in nature and in biological systems and is important for oxygen metabolism and electron transfer in all living organisms. Both deficiency of Fe3+ and excess Fe3+ can disrupt cellular homeostasis in vivo, so it is essential to detect Fe3+ in the environment (Chang et al., 2019; Chen et al., 2020).
As a new type of carbon nanomaterial, fluorescent CDs have attracted much attention for their unique properties, including their high-water solubility and biocompatibility (Xu et al., 2004; Liu et al., 2012). These properties enable them to provide a strong signal for the detection of metal ions in aqueous media, making them an excellent choice for environmental analysis methods. Much of the current research is focused on the properties and applications of CDs. However, the exploration of methods and raw materials for their preparation has been neglected. The common solvothermal synthesis of CDs involves expensive or toxic raw materials and solvents as well as complex processes. The search for an environmentally friendly raw material and an efficient preparation method has become a common topic of research. In terms of preparation methods, the solvent-free method is a pioneering new strategy for obtaining CDs. Hu et al. obtained CDs that can be used for metal ion detection by thermal oxidation of agricultural waste such as bitter tea residues Hu et al. (2021). Recently, Han et al. proposed a physical method of extracting CDs from carbon black Han et al. (2017). BCDs prepared from renewable, inexpensive and environmentally friendly biomass resources are also gaining interest as raw materials. In contrast to those created through conventional synthesis methods, BCDs are synthesized using only renewable natural products as raw materials, and due to the diversity of raw materials, BCDs with different properties and structures can be obtained (Zhang et al., 2016).
Herein, we report a method for the preparation of fluorescent CDs using biomass (cellulose and lignin) by solvent-free pyrolysis. As the biomass can be incompletely charred or burnt to ash when charred at different temperatures, using 50°C as a temperature gradient, the temperature range for cellulose and lignin charcoal was 200–400°C. After biomass carbon black was obtained, it was added to ethanol, extracted for a period of time and purified to obtain a yellow carbon dot solution with bright blue fluorescence under 365 nm excited ultraviolet light (Figure 1). The CDs were named CDs-C (250–400) and CDs-L (200–400) according to the different raw materials and pyrolysis temperatures. To differential them from those prepared via the traditional solvothermal method, the CDs fabricated from the cellulose and lignin solvothermal method are referred to as CDs-C Solvo (180–300) and CDs-L Solvo (180–300), respectively. No blue fluorescence was observed at pyrolysis temperatures below 250°C or above 400°C for cellulose or below 200°C or above 400°C for lignin. These CDs are simple, time saving, and inexpensive to produce; the ethanol solution used for extraction is reusable, and the CDs react surprisingly well to Fe3+, making them strong candidates for metal ion detection.
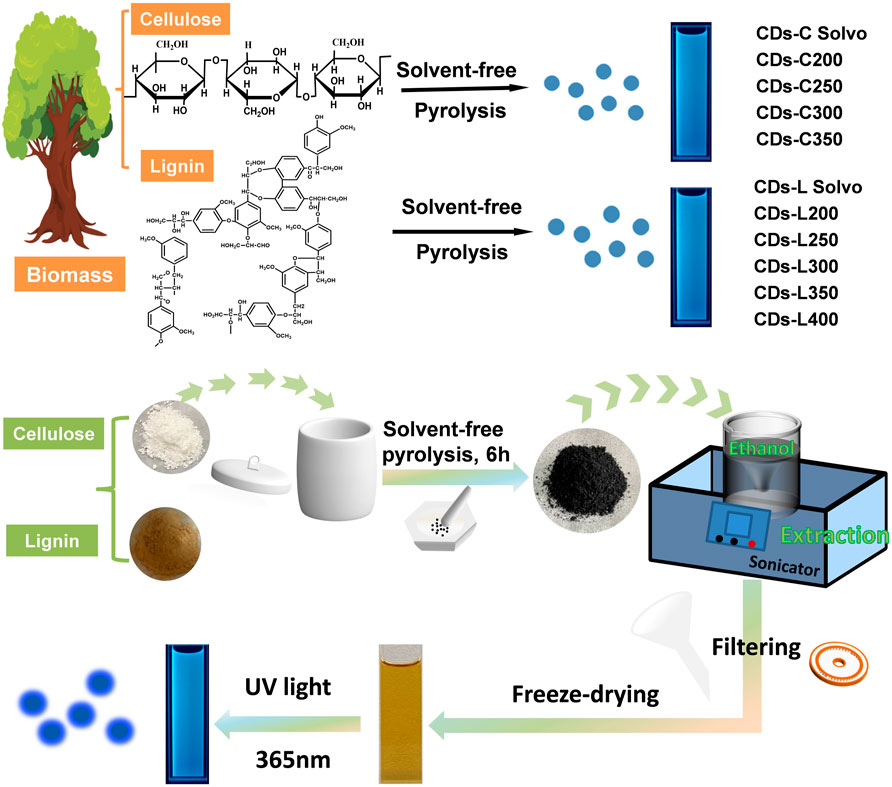
FIGURE 1. The synthesis route of cellulose- and lignin-based CDs by solvent-free pyrolysis.
Materials and Methods
Experimental Materials
Ethanol (99.7%) was provided by Shanghai Titan Science Co., Ltd. (Shanghai, China). Alkali lignin, microcrystalline cellulose were also obtained by Sinopharm Chemical Reagent Co., Ltd. Unless otherwise stated, all reagents used in this study are used as is, without further purification, and deionized (DI) water is used throughout the study.
Preparation Process
Synthesis of CDs
First, 1.0 g of alkali lignin and microcrystalline cellulose were placed in separate 50 ml crucibles, heated in a muffle furnace at different temperatures for 6 h, and then cooled naturally to room temperature. The biomass-derived carbon black was ground and placed in a beaker containing 100 ml of ethanol and sonicated in a sonicator for 15 min to obtain a sample that fluoresced bright blue. This suspension is filtered to remove the carbon residue to give a solution containing carbon dots. The solution was collected carefully and then purified with a silica column chromatography using ethanol as eluents. The process was repeated three times to remove excess impurities. The final products were dried and collected under vacuum environment and dissolved in ethanol. For comparison with the solvothermal method, alkali lignin and microcrystalline cellulose (1.0 g) were dissolved in 10 ml of ethanol, and the solution was transferred to an autoclave lined with polytetrafluoroethylene. Heating in a muffle furnace at various temperatures for 6 h, cooling naturally to room temperature and filtering to remove impurities to obtain a solution containing carbon dots. The solution was collected carefully and then purified with a silica column chromatography using ethanol as eluents. The process was repeated three times to remove excess impurities. The final product was dried and collected under vacuum and dissolved in ethanol to obtain blue carbon dots for the control group.
Fluorescence detection of ten metal ions
In a typical assay, ten metal ion solutions (Al3+, Ca2+, Cu2+, Fe3+, Li+, Mg2+, Mn2+, Zn2+, lr3+, Ni2+) were prepared at a concentration of 1000 µM. To assess the selectivity of CDs for different metal ions, a concentration of 1000 µM of different metal ions (eg., Al3+, Ca2+, Cu2+, Fe3+, Li+, Mg2+, Mn2+, Zn2+, lr3+, Ni2+), 45ul of different metal ion solutions with specific concentrations were added to 5ul of carbon point aqueous solution and sonicated for 15 min and the fluorescence emission spectra were recorded at the same excitation light of 320 nm. A series of metal ion solutions (pH = 7.0) at concentrations of 0, 20, 50, 100, 200, 400, 600, 800, and 1000 µM were prepared in the metal ion solution (pH = 7.0) and added to the carbon dot solution in the same manner and all measurements were carried out three times.
Characterization and Analysis
Transmission electron microscopy (TEM) images by FEI TECANI G2 F20 running at an accelerating voltage of 200 kV. UV-Visible spectra were obtained with a Shimadzu UV-2600 spectrometer. Using a Shimadzu fluorescence spectrophotometer RF-6000, the CDs fluorescence intensity was detected. Fourier transform infrared (FT-IR) spectra obtained by the KBr Pellet technique on the Nicolet iS5 spectrometer (Waltham, MA, United States) at Thermal Sciences in the primary transmission mode, and 8 scans at a resolution of 1 cm−1 were accumulated to obtain one spectrum. X-ray photoelectron spectroscopy (XPS) was characterised primarily by using a K-Alpha spectrometer and a single X-ray source Al Kα excitation (1486.6 eV). Binding energy calibration for C1s at 284.8 eV. Use HORIBA Scientific LabRAM HR Evolutio for Raman analysis. The sample is pyrolyzed by using the model (Japanese Science, thermo plus EV2/thermo mass photo) Thermogravimetry-Mass Spectrometer (TG-MS) Analyze the experiment, cellulose and lignin warming rate of 10°C/min. The quantum yields (QYs) of the CDs obtained were determined using the relative method. In particular, the use of quinine sulphate (QY = 55% in 0.1 M H2SO4) as a calibrator was chosen as a reference for the blue emission in the emission range 400–480 nm. Each experiment was performed three times in parallel to obtain the mean fluorescence measurement of QY was collected with a Shimadzu fluorescence spectrophotometer RF-6000.
Results and Discussion
The pyrolysis reactions of cellulose and lignin were compared and measured by thermogravimetric analysis and mass spectrometry (TGA-MS) (Figure 2). Both samples released weakly physisorbed water at temperatures above 100°C. As shown in Figure 2A, cellulose lose their majority of weight at 280–400°C, and the initial decomposition temperature was 250°C. The decomposition temperature range was much narrower, but the cellulose retained approximately 15% of the solid residue, which was lower than that of lignin. Compared with cellulose, lignin showed a lower initial decomposition temperature (140°C), a wider decomposition temperature range (200–500°C) and more solid residue (65%). Cellulose showed better thermal stability than lignin because it is mainly composed of carbon chain polymers connected by β-1,4 glycosidic bonds; it has regular structures, strong hydrogen bond effects and high crystallinity. Lignin, as an aromatic compound with a complex structure, has a characteristic three-dimensional network of C-C and C-O bonded phenyl propane structural units. In addition, the lignin structure is rich in hydroxyl and methoxy branched chains, their presence makes the bond energy low and prone to bond breakage (Zheng et al., 2022). Lignin has a larger number of chemical groups that require different temperatures for pyrolysis, so it requires a wider temperature range. Due to the influence of temperature, melting cyclization and the coking of aromatic structures easily occur during pyrolysis, this is one of the reasons for the large number of solid residues. The maximum weight loss rates of cellulose and lignin reached 345 and 235°C, respectively (Figure 2B).
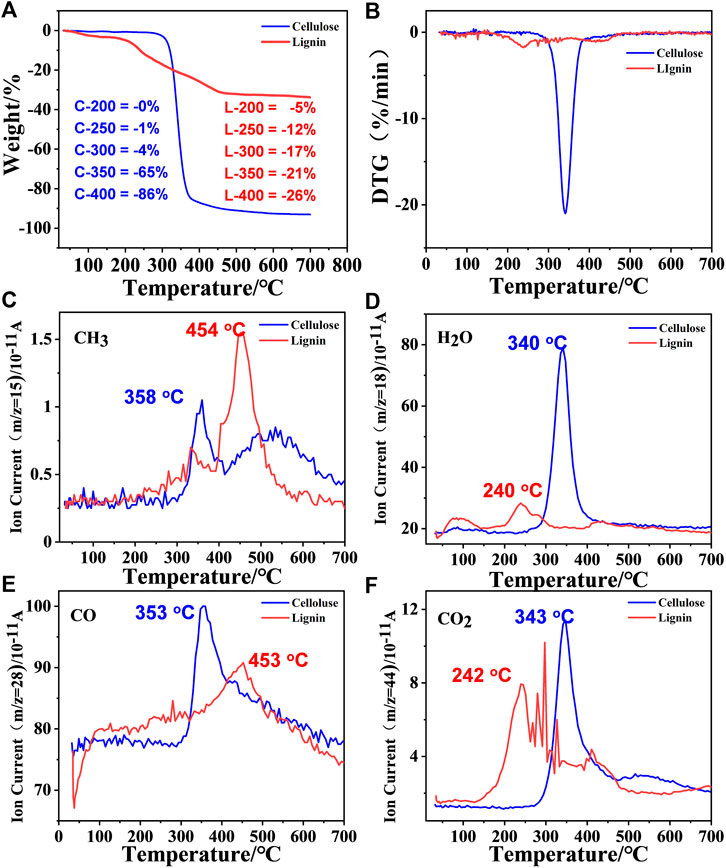
FIGURE 2. (A,B) TG/DTG curve of cellulose and lignin. (C–F) The evolutions of gaseous product for the two components at 10°C min−1.
The volatile fractions were analyzed in real time by mass spectrometry, and the four main small molecule gas products were detected at m/z = 15 (CH3), m/z = 18 (H2O), m/z = 28 (CO) and m/z = 44 (CO2) (m represents the number of protons, and z represents the number of charges) (Zheng et al., 2021). The elimination of the above four small molecules occurs at approximately 345°C in cellulose, which is consistent with the temperature at which the maximum weight loss rate occurs. However, for lignin, the temperatures of the four volatile components are very different. The elimination of H2O and CO2 occurs at approximately 240°C, but the elimination of CH3 and CO occurs at a higher temperature, approximately 450°C, which means that the formation of CDs is closely related to the elimination of H2O and CO2. The elimination of methyl groups indicates the breaking of molecular chains, which may cause the material to be less likely to form carbon dots.
The UV/Vis absorption spectra of the CDs were measured in ethanol, as shown in Figures 3A,B. In the UV spectrum, a more pronounced absorption band is shown near about 270–290 nm, which is mainly a reflection of the π-π* transition in the aromatic carbon and the n-π* transition between the sp2 domains. Different from many reports on CDs (Ding et al., 2017; Pan et al., 2016; Qu et al., 2012), these CDs do not show an absorption band in the UV visible region in the form of a surface defect. After varying the wavelength of the excitation light tested, no significant excitation dependence was found in the fluorescence emission (PL) spectra of the carbon dots, except for those of the CDs-L 400 obtained by carbonization at the highest temperature. The maximum fluorescence wavelength of cellulose-based CDs is approximately 446 nm, which is 16 nm redshifted compared with the CDs prepared by the solvothermal method (Figure 3C). For lignin, the CDs prepared by the two methods do not show much wavelength shift. The emission maxima of CDs-L 200–400 can be observed at λ = 383, 410, and 434 nm (Figure 3D). Different carbonization temperatures have no significant effect on the maximum emission peak of CDs but have a significant effect on the fluorescence quantum yield (QY). With increasing carbonization temperature, the QYs of these CDs first increase and then decrease. The maximum quantum yield appears at 300°C (11.7%) for cellulose and 350 °C (23.4%) for lignin. Comparing the CDs prepared by the above solvothermal method (Ge et al., 2021) revealed, that the difference in maximum fluorescence emission wavelength between the two methods was not significant at the same raw material and temperature, but the QYs of the CDs prepared by solvent-free pyrolysis were generally higher than those of the CDs prepared by solvothermal method (Figure 3E-F, Supplementary Figure S1 and Supplementary Table S1). In general, the fluorescent CDs have been prepared from cellulose and lignin by other methods such as solvothermal methods (Da Silva Souza et al., 2018, Wang et al., 2020, Xu et al., 2020). However, these methods incorporate other toxic reagents as a nitrogen source, making them complex and unsuitable for the large-scale production of carbon dots. The process of preparing biomass CDs by solvent-free pyrolysis is green and simple, and the ethanol solvent can be reused, which can broaden the application of carbon dots. The solvent-free pyrolysis method also applies to other biomass materials such as chitin and chitosan, as well as some cellulose and lignin rich biomasses such as: wood flour, bamboo flour, tree leaves and wheat straw. We found that they all have certain fluorescence properties and that the fluorescence properties varied depending on the composition of the raw material. This shows that solvent-free pyrolysis is widely applicable to most biomass materials (Supplementary Figure S2 and Supplementary Table S2).
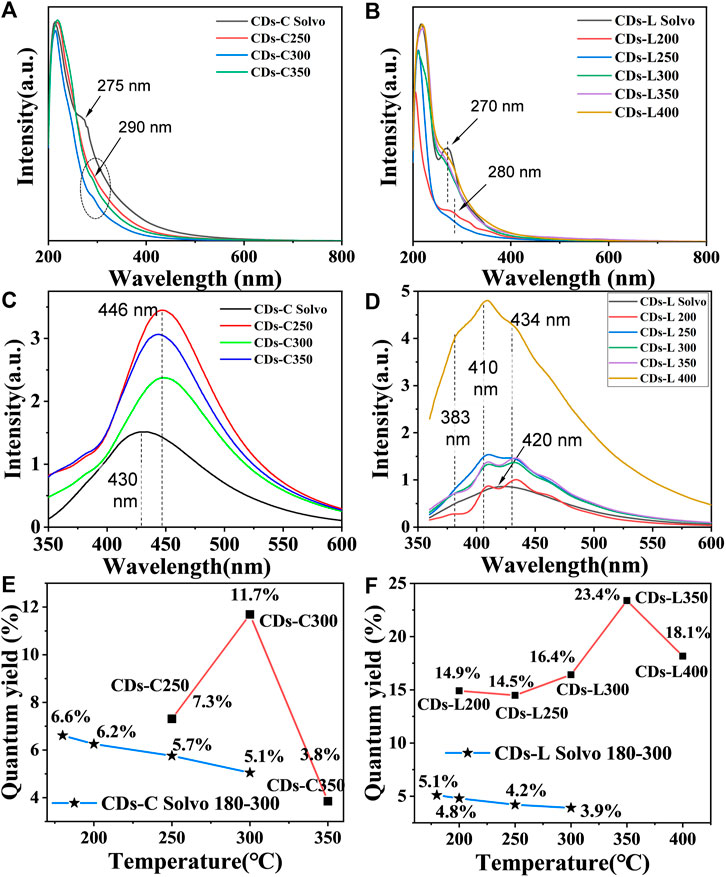
FIGURE 3. (A,B) UV/vis absorption spectra of CDs based on (A) cellulose and (B) lignin in ethanol solution (c = 1.0 mg/ml). (C,D) PL emission spectra of CDs based on (C) cellulose and (D) lignin in ethanol solution (c = 1.0 mg/ml). (E,F) Dotted line plot of CDs quantum yield versus reaction temperature.
Transmission electron microscopy (TEM) is an important characterization tool for examining the morphology of the resulting CDs samples. As shown in Figure 4, the TEM images show that all CDs were dot-like with uniform distribution and no obvious aggregation. The average particle sizes of these CDs in the images were found to be 1.4–2.9 nm. With increasing carbonization temperature, the particle size changed greatly, and the CDs with a high fluorescence quantum yield were the smallest. Moreover, the particle size of the lignin-based CDs was generally larger than that of the cellulose-based carbon dots, which may be related to the benzene ring structure of lignin. As shown in the high-resolution transmission electron microscopy (HR-TEM) images, the lattice stripe spacing was 0.20 nm, corresponding to the (100) crystal plane of graphite (Ge et al., 2021; Nie et al., 2014).
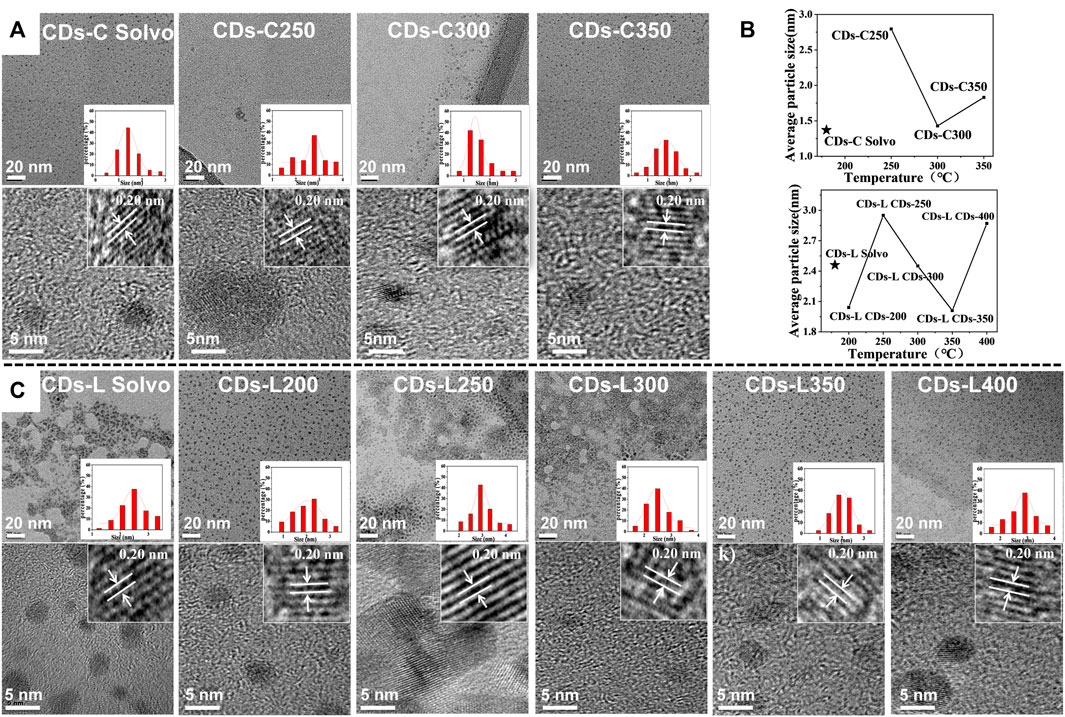
FIGURE 4. (A) TEM images of CDs-C Solvo and CDs-C 250–350 (from left to right), Inset: histograms and Gaussian fittings of particle size distribution, HR-TEM images of CDs-C Solvent and CDs-C 250–350 (from left to right); (B) TEM images of CDs-L Solvo and CDs-L 200–400 (from left to right), Inset: histograms and Gaussian fittings of particle size distribution, HR-TEM images of CDs-L Solvo and CDs-L 200–400 (from left to right); (C) Dotted line plot of average particle size of CDs versus reaction temperature.
Fourier transform infrared spectroscopy (FT-IR) is an important tool for the qualitative analysis of the surface functional groups of CDs. From Figures 5A,B, these CDs show similar infrared peaks, indicating that they have similar surface functional groups and similar chemical compositions. The broad peak near 3447 cm−1 corresponds to the O-H stretching vibration, and it can be inferred that the presence of hydrophilic groups on the surface of CDs makes them well soluble in solvents such as water and ethanol, and that aqueous solutions of CDs are also more stable. This provides the basis for the detection of metal ions in the water column at the carbon dot. Its IR spectrum showed absorptions at 1710, and 1065 cm−1, which were attributed to C=O and C=C functional groups (Jiang et al., 2015). Raman spectroscopic spectra (Figures 5C,D) show two peaks at approximately 1348 and 1590 cm−1. According to general guidelines, the D band appears to be indicative of disordered graphite structures, whereas the G band is indicative of crystalline graphitic carbons (Wang et al., 2016; Reckmeier et al., 2016). The ID/IG ratios of CDs-C Solvo, CDs-C 300, CDs-L Solvo and CDs-L 350 were 2.10, 2.00, 2.15, and 1.92, respectively. According to the ID/IG ratios, when the CDs prepared from the same raw material, the graphitization of the CDs prepared by the solvent-free method was greater than that of the CDs prepared by the solvothermal method (Wang et al., 2019).
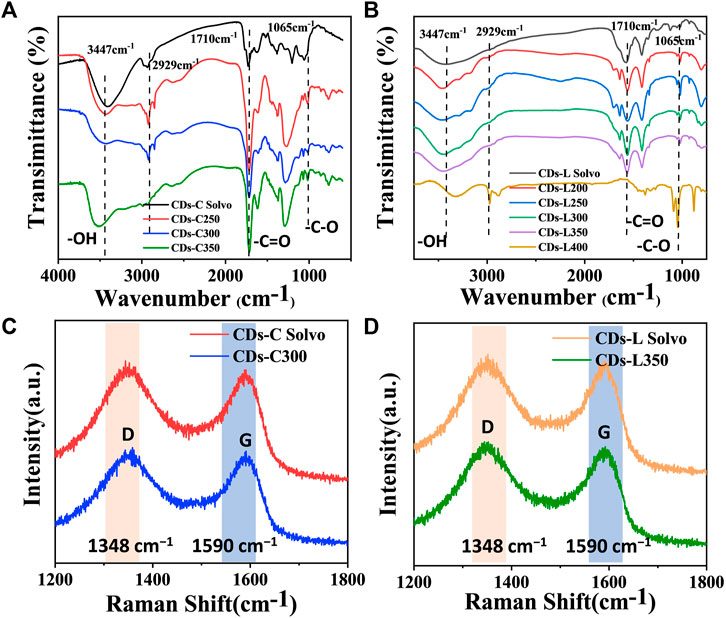
FIGURE 5. (A,B) FT-IR spectra of CDs based on (A) cellulose and (B) lignin. (C,D) Raman spectra of CDs-C Solvo, CDs-C 250, CDs-L Solvo, and CDs-L 250.
Further investigation of CDs surface composition is performed with X-ray photoelectron spectroscopy (XPS). As shown in Figure 6, a similar element composition was observed in all examined CDs. There are typically two intense peaks at 284.8 and 531.2 eV within the XPS spectrum, which correspond respectively to C 1s and O 1s (Sun et al., 2015; Tao et al., 2018; Yue et al., 2021). Further investigation of the surface state of the CDs, and the results are listed in Tables 1, 2. With high-resolution XPS (high-resolution X-ray photoelectron spectroscopy), surface information can be acquired for CDs. The resolved C 1s spectrum contained peaks at 284.8, 286.4, and 288.8 eV, indicating the presence of C=C/C-C (sp2 carbon), C-O (sp3 carbon) and C=O (carbonyl carbon) bonds, respectively (Hola et al., 2014; Nguyen et al., 2020). For the two kinds of CDs based on cellulose and lignin, the CDs prepared by the solvothermal method indicated that more C-O bonds were present than in those prepared by the solvent-free method, which may be attributed to the participation of solvent water in the carbonization reaction. In addition, with increasing carbonization temperature, the carbon content first increased and then decreased, which indicates that high temperatures induce the oxidative degradation of cellulose and lignin. Detailed analysis showed that the sp2 carbon content in CDs-C 300 and CDs-L 350 was the highest, and this was the primary factor for the high fluorescence efficiency.
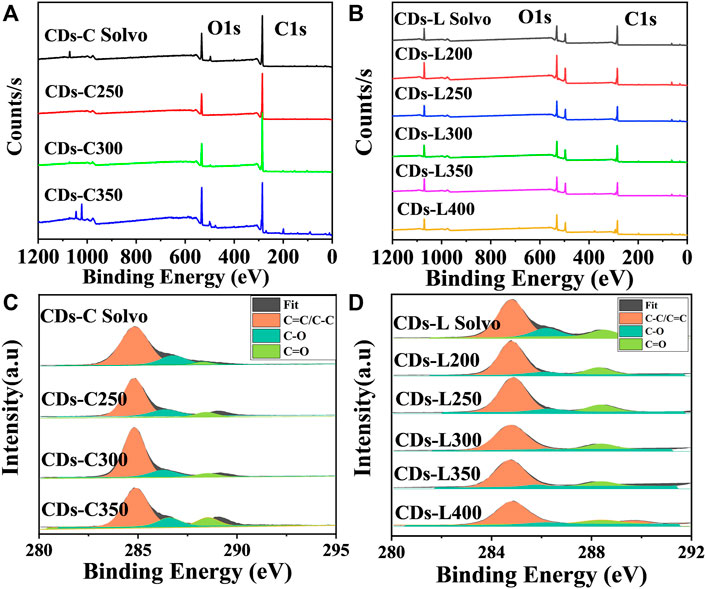
FIGURE 6. (A,B) XPS survey spectra, and (C,D) high-resolution C 1s spectra of CDs-C Solvo, CDs-C 250–350, CDs-L Solvo and CDs-L 200–400.
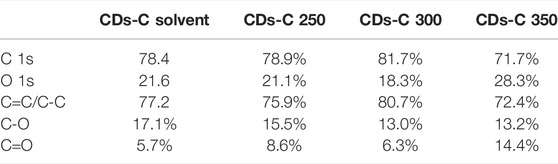
TABLE 1. Elemental proportions and chemical bonds in cellulose based CDs.
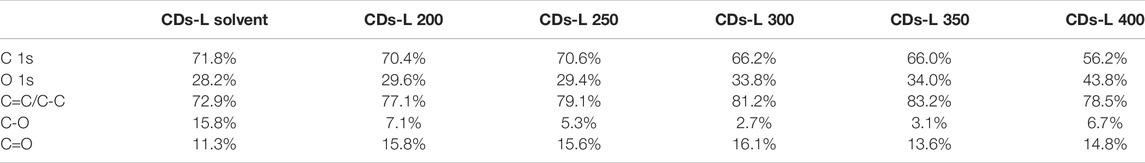
TABLE 2. Elemental proportions and chemical bonds in lignin based CDs.
There are two general mechanisms for the CD photoluminescence phenomenon. One is the band gap transition based on the conjugate structure in the sp2 carbon core, and the other is caused by a surface defect in the CDs (Ding H. et al., 2016; Ai et al., 2021). Because none of our samples indicated the absorption of surface defects, we believe that the band gap transition of the conjugated structure was the main factor controlling the PL in our system. The experimental results of Raman and XPS also support the speculation and discussion of the fluorescence mechanism. With increasing reaction temperature, cellulose and lignin condense together through dehydration and the removal of hydroxyl and other functional groups by carbon dioxide to form a conjugated graphite carbon structure and then emit fluorescence through electronic transitions. According to the experimental results, the CDs prepared by solvent-free pyrolysis have a better conjugated carbon core structure (sp2 carbon) and better fluorescence quantum yield than those prepared by the solvothermal method.
Typically, when CDs are in the excited state, electrons are readily transferred to the metal cation, resulting in a nonradiative complex of excited state electrons and thus fluorescence quenching. Therefore, CDs is used as a fluorescent probe for the detection of metal ions in water. Compared to other common metal ion detection methods, carbon dot fluorescent probes are cost effective, easy to detect and have been extensively investigated (Meng et al., 2021). In this study, CDs-C 300 and CDs-L 350, which had the highest fluorescence efficiencies, were selected for the detection of various metal ions, as shown in Figures 7A,B. The fluorescence intensity of CDs was greatly reduced in the presence of Fe3+, while other ions had a weaker effect on the fluorescence intensity, indicating that CDs have excellent selectivity for Fe3+. We suggest that the hydroxyl group on the surface of CDs interacts with Fe3+, resulting in fluorescence quenching due to changes in the electronic structure of the CDs. Therefore, we further investigated the detailed sensor response of the two CDs to Fe3+ ions. The PL spectrum shows that the fluorescence intensity varied with Fe3+ concentration from 0 to 1000 μM (Figures 7C,D). Generally, the fluorescence quenching behavior of metal ions can be fitted to the Stern-Volmer equation. F0/F = 1 + Ksv [Fe3+], where Ksv denotes the quenching constant, and F0 and F are the fluorescence intensities before and after the addition of Fe3+, respectively (Bai et al., 2018). However, in our system, the plot of F0/F versus Fe3+ concentration does not conform to the conventional Stern-Volmer linear equation (Figures 7E,F). The steep upward curvature indicates that our system may involve dynamic and static quenching mechanisms in our system. Only at low Fe3+ concentrations (0–400 μM for cellulose and 0–200 μM for lignin), does the quenching behavior conform to the Stern-Volmer equation and exhibit a good linear relationship. The calculated Ksv values are 7.1 × 10⁴ M−1 and 9.3 × 10⁴ M−1, respectively, indicating that the two systems result from static quenching at low concentrations. The corresponding limits of detection (LODs) were 42.8 and 19.1 nM, respectively (LOD = 3δ/s, where δ is the standard deviation of 10 blank samples, and s is the slope of the linear relationship). More hydroxyl groups on the surface of the CDs lead to a negatively charged surface and more oxygen-containing groups facilitate the binding of Fe3+ (Figure 8). In addition, the photostability of the CDs was investigated by exposing CDs-C 300 and CDs-L 350 solutions to a 365 nm UV lamp for 7 h and to daylight for 7 days, respectively. Both were observed to be photostable above 80% (Supplementary Figures S3, S4 in the Supporting Information), indicating the long-term photostability of the probes. In addition, this study tested the thermal stability of both CDs in a water bath at 30–80°C for 3 h, and the observations showed that both exhibited good thermal stability (Yarur et al., 2019). The above experimental results indicate that CDs prepared by solvent-free pyrolysis are promising candidates for the detection of Fe3+ in water samples.
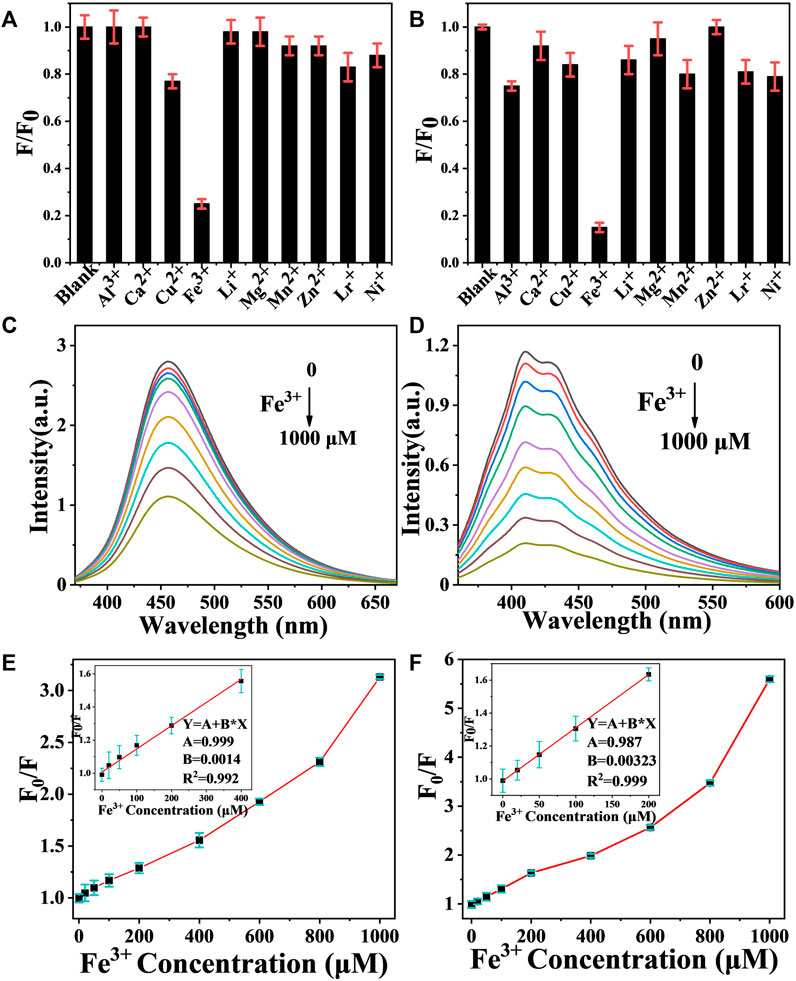
FIGURE 7. (A,B) Fluorescent responses of 1000 μM CDs-C 300 and CDs-L 350 to different metal ions, F0 and F present the fluorescence intensity of CDs before and after adding metal ions. (C,D) Fluorescence emission spectra of CDs-C 300 and CDs-L 350 after the addition of different Fe3+ concentrations. (E,F) Plots of the F0/F with different Fe3+ concentrations.
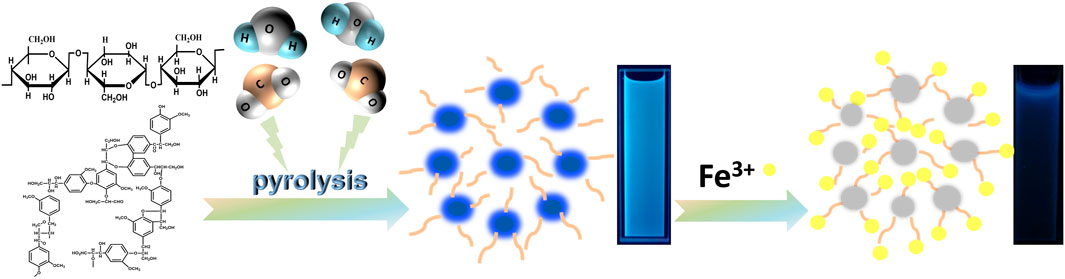
FIGURE 8. Schematic diagram of the mechanism of cellulose and lignin-based CDs synthesised by solvent-free pyrolysis for the detection of Fe3+.
Conclusion
In summary, BCDs were prepared by a solvent-free method using cellulose and lignin as carbon sources, the prepared CDs were uniformly dispersed, and all exhibited bright blue fluorescence. The synthesis temperature affected the QY and surface states of the CDs, with CDs-C300 and CDs-L350 exhibiting higher QYs of 11.7% and 23.4%, respectively, and the higher C=C/C-C content of both CDs suggests that CDs with a higher degree of graphitization can be formed at this temperature. The surface of CDs is rich in oxygen-containing functional groups, which are more conducive to the coordination of Fe3+ and show good sensitivity to Fe3+, making them suitable as fluorescent Fe3+ sensors. The solvent-free method of preparing CDs described in this paper is simple and green, and the reaction solvent can be reused, which not only effectively reduces the production cost of CDs but also provides a new suggestion for the efficient conversion and green development of biomass resources and a new strategy for the detection of Fe3+ in aqueous solutions.
Data Availability Statement
The original contributions presented in the study are included in the article/Supplementary Material, further inquiries can be directed to the corresponding authors.
Author Contributions
MC, CL, and XL conceived the project and contributed to the concept of the manuscript. JZ, LA, YL, and YZ synthesized and characterized biomass carbon dots, and performed experimental works. HT, RS, and XH characterized metal ion detection at CDs.
Funding
This work was partially supported by the National Key Research and Development Program of China (No. 2019YFD1002404, 2021YFD1000202), and National Natural Science Foundation (No. 21961036, No. 31860338), China Agriculture Research System of MOF & MARA (CARS-21-05B), and the Programs of Science and Technology Department of Yunnan Province (202101AT070041, 202204BI090003, 202002AA10007, 202102AE090042), and Key Research and Development Program of Yunnan province (2018BB025), and Major Science and Technology Project of Kunming (2021JH002).
Conflict of Interest
The authors declare that the research was conducted in the absence of any commercial or financial relationships that could be construed as a potential conflict of interest.
Publisher’s Note
All claims expressed in this article are solely those of the authors and do not necessarily represent those of their affiliated organizations, or those of the publisher, the editors and the reviewers. Any product that may be evaluated in this article, or claim that may be made by its manufacturer, is not guaranteed or endorsed by the publisher.
Supplementary Material
The Supplementary Material for this article can be found online at: https://www.frontiersin.org/articles/10.3389/fchem.2022.940398/full#supplementary-material
References
Ai, L., Yang, Y., Wang, B., Chang, J., Tang, Z., Yang, B., et al. (2021). Insights into Photoluminescence Mechanisms of Carbon Dots: Advances and Perspectives. Sci. Bull. 66 (8), 839–856. doi:10.1016/j.scib.2020.12.015
Bai, Z., Yan, F., Xu, J., Zhang, J., Wei, J., Luo, Y., et al. (2018). Dual-channel Fluorescence Detection of Mercuric (II) and Glutathione by Down- and Up-Conversion Fluorescence Carbon Dots. Spectrochimica Acta Part A Mol. Biomol. Spectrosc. 205, 29–39. doi:10.1016/j.saa.2018.07.012
Chang, V. C., Cotterchio, M., and Khoo, E. (2019). Iron Intake, Body Iron Status, and Risk of Breast Cancer: a Systematic Review and Meta-Analysis. BMC Cancer 19, 543. doi:10.1186/s12885-019-5642-0
Chen, Y., Sun, X., Pan, W., Yu, G., and Wang, J. (2020). Fe3+-Sensitive Carbon Dots for Detection of Fe3+ in Aqueous Solution and Intracellular Imaging of Fe3+ inside Fungal Cells. Front. Chem. 7, 911. doi:10.3389/fchem.2019.00911
Da Silva Souza, D. R., Caminhas, L. D., de Mesquita, J. P., and Pereira, F. V. (2018). Luminescent Carbon Dots Obtained from Cellulose. Mater. Chem. Phys. 203, 148–155. doi:10.1016/j.matchemphys.2017.10.001
Ding, C., Zhu, A., and Tian, Y. (2012). Functional Surface Engineering of C-Dots for Fluorescent Biosensing and In Vivo Bioimaging. Acc. Chem. Res. 47, 20–30. doi:10.1021/ar400023s
Ding Y, Y., Wang, S., Li, J., and Chen, L. (2016). Nanomaterial-based Optical Sensors for Mercury Ions. Trends Anal. Chem., 82, 82175–82190. doi:10.1016/j.trac.2016.05.015
Ding H, H., Yu, S.-B., Wei, J.-S., and Xiong, H.-M. (2016). Full-color Light-Emitting Carbon Dots with a Surface-State-Controlled Luminescence Mechanism. ACS Nano 10 (1), 484–491. doi:10.1021/acsnano.5b05406
Ding, H., Ji, Y., Wei, J.-S., Gao, Q.-Y., Zhou, Z.-Y., and Xiong, H.-M. (2017). Facile Synthesis of Red-Emitting Carbon Dots from Pulp-free Lemon Juice for Bioimaging. J. Mat. Chem. B 5, 5272–5277. doi:10.1039/c7tb01130j
Ge, M., Han, S., Ma, Y., Li, J., Liu, S., Chen, Z., et al. (2021). Sensitive Mechanofluorochromic Carbon Dot-Based AIEgens: Promising Reporting Components for Self-Sensing Plastics. Adv. Opt. Mater. 9, 2101092. doi:10.1002/adom.202101092
Gogoi, N., Barooah, M., Majumdar, G., and Chowdhury, D. (2015). Carbon Dots Rooted Agarose Hydrogel Hybrid Platform for Optical Detection and Separation of Heavy Metal Ions. ACS Appl. Mat. Interfaces 7, 3058–3067. doi:10.1021/am506558d
Han, B., Yu, M., Pen, T., Li, Y., Hu, X., Xiang, R., et al. (2017). One-step Extraction of Highly Fluorescent Carbon Quantum Dots by a Physical Method from Carbon Black. New J. Chem. 41, 5267–5270. doi:10.1039/c7nj00858a
Hola, K., Bourlinos, A. B., Kozak, O., Berka, K., Siskova, K. M., Havrdova, M., et al. (2014). Photoluminescence Effects of Graphitic Core Size and Surface Functional Groups in Carbon Dots: COO− Induced Red-Shift Emission. Carbon 70, 279–286. doi:10.1016/j.carbon.2014.01.008
Hu, C., Lin, T.-J., Huang, Y.-C., Chen, Y.-Y., Wang, K.-H., and Andrew Lin, K.-Y. (2021). Photoluminescence Quenching of Thermally Treated Waste-Derived Carbon Dots for Selective Metal Ion Sensing. Environ. Res. 197, 111008. doi:10.1016/j.envres.2021.111008
Jiang, K., Sun, S., Zhang, L., Lu, Y., Wu, A., Cai, C., et al. (2015). Red, Green, and Blue Luminescence by Carbon Dots: Full-Color Emission Tuning and Multicolor Cellular Imaging. Angew. Chem. Int. Ed. 54, 5360–5363. doi:10.1002/anie.201501193
Liu, S., Tian, J., Wang, L., Zhang, Y., Qin, X., Luo, Y., et al. (2012). Hydrothermal Treatment of Grass: A Low-Cost, Green Route to Nitrogen-Doped, Carbon-Rich, Photoluminescent Polymer Nanodots as an Effective Fluorescent Sensing Platform for Label-free Detection of Cu(II) Ions. Adv. Mat. 24, 2037–2041. doi:10.1002/adma.201200164
Lu, S., Sui, L., Liu, J., Zhu, S., Chen, A., Jin, M., et al. (2017). Near-infrared Photoluminescent Polymer-Carbon Nanodots with Two-Photon Fluorescence. Adv. Mat. 29, 1603443. doi:10.1002/adma.201603443
Meng, W., Wang, B., Ai, L., Song, H., and Lu, S. (2021). Engineering White Light-Emitting Diodes with High Color Rendering Index from Biomass Carbonized Polymer Dots. J. Colloid Interface Sci. 598, 274–282. doi:10.1016/j.jcis.2021.04.022
Nguyen, H. A., Srivastava, I., Pan, D., and Gruebele, M. (2020). Unraveling the Fluorescence Mechanism of Carbon Dots with Sub-single-particle Resolution. ACS Nano 14, 6127–6137. doi:10.1021/acsnano.0c01924
Nie, H., Li, M., Li, Q., Liang, S., Tan, Y., Sheng, L., et al. (2014). Carbon Dots with Continuously Tunable Full-Color Emission and Their Application in Ratiometric pH Sensing. Chem. Mat. 26, 3104–3112. doi:10.1021/cm5003669
Pan, L., Sun, S., Zhang, L., Jiang, K., and Lin, H. (2016). Near-infrared Emissive Carbon Dots for Two-Photon Fluorescence Bioimaging. Nanoscale 8, 17350–17356. doi:10.1039/c6nr05878g
Pyle, S. M., Nocerino, J. M., Deming, S. N., Palasota, J. A., Palasota, J. M., Miller, E. L., et al. (1996). Comparison of AAS, ICP-AES, PSA, and XRF in Determining Lead and Cadmium in Soil. Environ. Sci. Technol. 30, 204–213. doi:10.1021/es9502482
Qu, S., Wang, X., Lu, Q., Liu, X., and Wang, L. (2012). A Biocompatible Fluorescent Ink Based on Water-Soluble Luminescent Carbon Nanodots. Angew. Chem. Int. Ed. 51, 12215–12218. doi:10.1002/anie.201206791
Reckmeier, C. J., Schneider, J., Susha, A. S., and Rogach, A. L. (2016). Luminescent Colloidal Carbon Dots: Optical Properties and Effects of Doping. Opt. Express 24, A312–A340. doi:10.1364/oe.24.00a312
Sun, X., and Lei, Y. (2017). Fluorescent Carbon Dots and Their Sensing Applications. TrAC Trends Anal. Chem. 89, 163–180. doi:10.1016/j.trac.2017.02.001
Sun, X., Brückner, C., and Lei, Y. (2015). One-pot and Ultrafast Synthesis of Nitrogen and Phosphorus Co-doped Carbon Dots Possessing Bright Dual Wavelength Fluorescence Emission. Nanoscale 7, 17278–17282. doi:10.1039/c5nr05549k
Tao, S., Lu, S., Geng, Y., Zhu, S., Redfern, S. A. T., Song, Y., et al. (2018). Design of Metal-free Polymer Carbon Dots: a New Class of Room-Temperature Phosphorescent Materials. Angew. Chem. Int. Ed. 57, 2393–2398. doi:10.1002/anie.201712662
Ullah, N., Mansha, M., Khan, I., and Qurashi, A. (2018). Nanomaterial-based Optical Chemical Sensors for the Detection of Heavy Metals in Water: Recent Advances and Challenges. Trends Anal. Chem. 100, 55–166. doi:10.1016/j.trac.2018.01.002
Wang, C., Jiang, K., Wu, Q., Wu, J., and Zhang, C. (2016). Green Synthesis of Red-Emitting Carbon Nanodots as a Novel "Turn-On" Nanothermometer in Living Cells. Chem. Eur. J. 22, 14475–14479. doi:10.1002/chem.201602795
Wang, P., Liu, C., Tang, W., Ren, S., Chen, Z., Guo, Y., et al. (2019). Molecular Glue Strategy: Large-Scale Conversion of Clustering-Induced Emission Luminogen to Carbon Dots. ACS Appl. Mat. Interfaces 11, 19301–19307. doi:10.1021/acsami.8b22605
Wang, J., Wang, J., Xiao, W., Geng, Z., Tan, D., Wei, L., et al. (2020). Lignin-derived Red-Emitting Carbon Dots for Colorimetric and Sensitive Fluorometric Detection of Water in Organic Solvents. Anal. Methods 12, 3218–3224. doi:10.1039/d0ay00485e
Xu, X., Ray, R., Gu, Y., Ploehn, H. J., Gearheart, L., Raker, K., et al. (2004). Electrophoretic Analysis and Purification of Fluorescent Single-Walled Carbon Nanotube Fragments. J. Am. Chem. Soc. 126, 12736–12737. doi:10.1021/ja040082h
Xu, D., Lin, Q., and Chang, H. T. (2020). Recent Advances and Sensing Applications of Carbon Dots. Small Methods 4 (4), 1900387. doi:10.1002/smtd.201900387
Yarur, F., Macairan, J.-R., and Naccache, R. (2019). Ratiometric Detection of Heavy Metal Ions Using Fluorescent Carbon Dots. Environ. Sci. Nano 6, 1121–1130. doi:10.1039/c8en01418c
Yue, J., Yu, L., Li, L., Liu, P., Mei, Q., Dong, W. F., et al. (2021). One-Step Synthesis of Green Fluorescent Carbon Dots for Chloride Detecting and for Bioimaging. Front. Chem. 703. 718856. doi:10.3389/fchem.2021.718856
Zhang, J., and Yu, S.-H. (2016). Carbon Dots: Large-Scale Synthesis, Sensing and Bioimaging. Mater. Today 19, 382–393. doi:10.1016/j.mattod.2015.11.008
Zhang, Z., Zhang, Z., Liu, H., Mao, X., Liu, W., Zhang, S., et al. (2018). Ultratrace and Robust Visual Sensor of Cd 2+ Ions Based on the Size-dependent Optical Properties of Au@g-CNQDs Nanoparticles in Mice Models. Biosens. Bioelectron. 103, 87–93. doi:10.1016/j.bios.2017.12.025
Zheng, Y., Wang, J., Li, D., Liu, C., Lu, Y., Lin, X., et al. (2021). Activity and Selectivity of Ni-Cu Bimetallic Zeolites Catalysts on Biomass Conversion for Bio-Aromatic and Bio-Phenols. J. Energy Inst. 97, 58–72. doi:10.1016/j.joei.2021.04.008
Zheng, Y., Li, D., Wang, J., Chen, Y., Liu, C., Lu, Y., et al. (2022). Ammonia (NH3)/nitrogen (N2) Torrefaction Pretreatment of Waste Biomass for the Production of Renewable Nitrogen-Containing Chemicals via Catalytic Ammonization Pyrolysis: Evolution of Fuel-N under a N2/NH3-rich Atmosphere. J. Energy Inst. 102, 143–159. doi:10.1016/j.joei.2022.03.011
Keywords: solvent-free pyrolysis, lignin, cellulose, biomass carbon dots, metal ion detection
Citation: Chen M, Zhai J, An Y, Li Y, Zheng Y, Tian H, Shi R, He X, Liu C and Lin X (2022) Solvent-Free Pyrolysis Strategy for the Preparation of Biomass Carbon Dots for the Selective Detection of Fe3+ Ions. Front. Chem. 10:940398. doi: 10.3389/fchem.2022.940398
Received: 10 May 2022; Accepted: 20 June 2022;
Published: 06 July 2022.
Edited by:
Christian Julien, Sorbonne Universités, FranceReviewed by:
Yuanqing Sun, China University of Petroleum, ChinaDong Xu, Central South University Forestry and Technology, China
Copyright © 2022 Chen, Zhai, An, Li, Zheng, Tian, Shi, He, Liu and Lin. This is an open-access article distributed under the terms of the Creative Commons Attribution License (CC BY). The use, distribution or reproduction in other forums is permitted, provided the original author(s) and the copyright owner(s) are credited and that the original publication in this journal is cited, in accordance with accepted academic practice. No use, distribution or reproduction is permitted which does not comply with these terms.
*Correspondence: Can Liu, bGl1Y2Fuc3dmdUAxNjMuY29t; Xu Lin, bGlueHVuZWZ1QDEyNi5jb20=