 Gautier Félix1Alena N. Kulakova1,2Saad Sene1Victor N. Khrustalev3,4Miguel A. Hernández-Rodríguez5,6Elena S. Shubina2Tristan Pelluau1
 Luís D. Carlos5Yannick Guari1
 Albano N. Carneiro Neto5*
 Alexey N. Bilyachenko2,3*
 Joulia Larionova1*
- 1CNRS, ENSCM, University Montpellier, Montpellier, France
- 2Nesmeyanov Institute of Organoelement Compounds, Russian Academy of Sciences, Moscow, Russia
- 3Peoples’ Friendship University of Russia (RUDN University), Moscow, Russia
- 4Zelinsky Institute of Organic Chemistry, Russian Academy of Sciences, Moscow, Russia
- 5Phantom-g, Physics Department and CICECO—Aveiro Institute of Materials, University of Aveiro, Aveiro, Portugal
- 6Departamento de Física, Universidad de La Laguna San Cristóbal de La Laguna, Santa Cruz de Tenerife, Spain
We report the synthesis and single-crystal X-ray diffraction, magnetic, and luminescence measurements of a novel family of luminescent cage-like tetranuclear silsesquioxanes (PhSiO1.5)8(LnO1.5)4(O)(C5H8O2)6(EtOH)2(CH3CN)2⋅2CH3CN (where Ln = Tb, 1; Tb/Eu, 2; and Gd, 3), featuring seven-coordinated lanthanide ions arranged in a one-capped trigonal prism geometry. Compounds 1 and 2 exhibit characteristic Tb3+ and Tb3+/Eu3+-related emissions, respectively, sensitized by the chelating antenna acetylacetonate (acac) ligands upon excitation in the UV and visible spectral regions. Compound 3 is used to assess the energies of the triplet states of the acac ligand. For compound 1, theoretical calculations on the intramolecular energy transfer and multiphonon rates indicate a thermal balance between the 5D4 Stark components, while the mixed Tb3+/Eu3+ analog 2, with a Tb:Eu ratio of 3:1, showcases intra-cluster Tb3+-to-Eu3+ energy transfer, calculated theoretically as a function of temperature. By utilizing the intensity ratio between the 5D4→7F5 (Tb3+) and 5D0→7F2 (Eu3+) transitions in the range 11–373 K, we demonstrate the realization of a ratiometric luminescent thermometer with compound 2, operating in the range 11–373 K with a maximum relative sensitivity of 2.0% K−1 at 373 K. These findings highlight the potential of cage-like silsesquioxanes as versatile materials for optical sensing-enabled applications.
1 Introduction
Luminescent coordination complexes containing trivalent lanthanide ions (Ln3+) have attracted significant attention over several decades due to tremendous perspectives in different applications, including bioimaging and biosensing (Eliseeva and Bünzli, 2009; Ning et al., 2019), light-emitting technology (Bünzli, 2019; Costa et al., 2024), smart windows (Choi et al., 2017; Fernandes et al., 2018; Costa et al., 2024), nano-thermometry (Allison, 2019; Brites et al., 2019; Brites et al., 2023), detection of molecules and ions (Eliseeva and Bünzli, 2009; Allison, 2019; Brites et al., 2023), cell labeling (Aulsebrook et al., 2018; Bodman and Butler, 2021). These compounds exhibit distinctive photophysical characteristics, manifesting as prolonged emission with lifetimes extending up to milliseconds. This extended emission attributed to the 4f–4f transitions occurs in the visible and/or near-infrared (NIR) spectral domains depending on the nature of the Ln3+ ion. Moreover, it usually includes narrow emission lines, significant ligand-induced Stokes shifts, and high quantum yields. For these reasons, the coordination chemistry of Ln3+ ions employed in association with various ligands to design mono- and polynuclear compounds of various topologies with optimized optical properties has been the subject of huge development during recent decades (Bünzli, 2010; Bünzli, 2015; SeethaLekshmi et al., 2017; Liu et al., 2020; Monteiro, 2020; Bernot et al., 2021). In particular, extensive effort has been focused on the synthesis of highly luminescent, photo- and thermostable complexes valuable for the above-mentioned applications (Kaczmarek et al., 2019).
However, directly exciting the 4f levels poses a challenge as the majority of the f-f transitions are prohibited by the Laporte rule, resulting in low molar absorption coefficients. This constraint can be surmounted by the tune of organic chromophores as ligands to generate the well-known “antenna effect,” yielding highly emissive complexes. In these systems, chromophore ligands, typically excited in the UV or, less frequently, in the visible spectral domains, allow the energy transfer from the ligand triplet excited state to the emitting level of the Ln3+ ion. Consequently, this process induces a radiative decay in the visible or NIR spectral regions depending on the Ln3+ ion used (Bünzli, 2015). Note that an alternative mechanism has been documented, which entails the energy transfer from the first excited singlet state of the ligand to the 4f levels (Alaoui, 1995; Yang et al., 2004; Kasprzycka et al., 2017; Gregório et al., 2019; Moura Jr. et al., 2021a; Manzur et al., 2023). Hence, achieving efficient energy transfer requires a meticulous alignment of energy levels and adherence to selection rules among various excited states. This optimization can be accomplished through a careful selection of ligands and Ln3+ ions, coupled with the strategic design of the metal center geometry within a suitable ligand environment (Carneiro Neto et al., 2019). Furthermore, note that improved luminescence has been documented in complexes featuring an asymmetric Ln3+ coordination environment, notably in a seven-coordinated geometry (Miyata et al., 2009; Miyata et al., 2012; Yanagisawa et al., 2015; Ferreira da Rosa et al., 2020; Aquino LE do et al., 2021).
A significant breakthrough in Ln3+-based luminescent coordination compounds lies in their application as temperature sensors, enabling remote temperature measurements through emission monitoring. This approach offers temperature sensing with high spatial precision (below 10 µm), temporal (time scale) and thermal resolutions (0.1 K) within short acquisition times (less than 10 µs), and high relative thermal sensitivity (Sr > 1% K−1) (Brites et al., 2012; Jaque and Vetrone, 2012; Brites et al., 2016; Brites et al., 2019; Brites et al., 2023). It shows enormous potential in a wide range of applications ranging from biology and medicine to cryogenics (Cui et al., 2012; Bettinelli et al., 2015; Dramićanin, 2020). Starting from the first example showing the possibility of the real-time observation of thermogenesis in a single HeLa cell using the simple mononuclear Eu(tta)3 complex (where tta− is 3-thenoyltrifluoroacetonate) (Suzuki et al., 2007), numerous Ln3+-based compounds have been investigated for this purpose. A particular emphasis in this field has been placed on the design of ratiometric thermometers, in which a luminescence intensity ratio (LIR) of two constituent Ln3+ ions is used as a signal permitting a self-referencing emissive system (Brites et al., 2010). The most used complexes contain a Tb3+/Eu3+ pair due to the high quantum yield of these ions, for which different parameters can be optimized to increase the performance of the luminescent thermometers (Cui et al., 2012; Rocha et al., 2016; Lyubov et al., 2022). In particular, molecular cluster-aggregates have shown high potential for this purpose, attributed to a rigid metal core of high nuclearity, precise coordination environment, and tunable energy transfer. This is achieved through the precise control of the ratio of the ions and the distance between them, as well as their structural organization, ion environment, and the nature of ligands (Calado et al., 2023; Gálico et al., 2023). A particular family of these molecular cluster-aggregates, luminescent Ln3+-based silsesquioxanes, provides a compelling alternative to coordination complexes, offering high photothermal and chemical stabilities, particularly pertinent with increasing temperature for thermometry applications.
Cage-like Ln3+-based metallasilsesquioxanes are an exciting family of compounds presenting the combination of Ln3+ ions with the silsesquioxane repeating subunits, (RSiO1.5)n (where n = 6, 8, 10, 12, … ). The latter permits the construction of inorganic Si-O-Si skeletons as a basic structural unit, realizing cyclic and polycyclic types of matrixes, which offer these architectures the chemical stability, mechanical robustness, thermal stability, and possibility to form cage-like topology. Moreover, they possess oxygen atoms able to coordinate Ln3+ ions and, therefore, integrate and specially organize them inside the cage-like rigid framework. Moreover, terminal ligands may also be coordinated with the metal ions to complete their coordination environment, bringing additional functionalities. These architectures have mainly been investigated as molecule-based models for catalysis (Herrmann et al., 1994; Shchegolikhina et al., 1996; Annand et al., 1999; Annand and Aspinall H, 2000; Arnold et al., 2001; Lorenz et al., 2002; Lorenz et al., 2004; Wu et al., 2009; Marchesi et al., 2014; Davies et al., 2017; Sheng et al., 2022a; Sheng et al., 2022b), but recently, their magnetic (Sheng et al., 2022b) and optical properties (Sheng et al., 2022a) have also been investigated. Recently, we reported the first examples of luminescent Tb3+, Eu3+, and Dy3+-based metallasilsesquioxanes presenting unusual (for metallasilsesquioxanes) anionic prism-like structures. These structures encompass four Ln3+ ions linked through oxygen atoms and situated between two cyclic tetraphenylcyclotetrasiloxanolate moieties (Kulakova et al., 2020; Kulakova et al., 2021; Nigoghossian et al., 2021; Félix et al., 2023a; Félix et al., 2023b). They present Ln3+ characteristic luminescence and interesting magnetic properties, depending on the nature of the ion, chemical robustness, and thermal stability. Moreover, we demonstrated that anionic cages containing mixed Tb3+/Eu3+ exhibited a tunable thermosensitive Tb3+-to-Eu3+ energy transfer and proposed them as an efficient temperature sensor operating in the range 300–373 K with good linearity and repeatability. Remarkably, these compounds presented an important stability to photobleaching at a relatively high working temperature (100°C) due to the presence of the siloxane matrix, which played a protective role. However, the Ln3+ ions in these structures are not coordinated with antenna ligands, and the excitation was performed directly in the 4f levels, which is not optimal to achieve highly luminescent materials.
A major objective of the present work consists of the sensitization of Ln3+ luminescence in the silsesquioxane cages through the coordination of an antenna ligand. The most popular chelating acetylacetonate (acac) antenna has been used as a terminal ligand for this purpose (de Sá et al., 2000; Arnold et al., 2001; Eliseeva and Bünzli, 2009; Bünzli and Eliseeva, 2013; Gálico et al., 2023). Here, we report the synthesis, crystal structures, magnetic properties, and luminescence investigations of three new tetranuclear complexes (PhSiO1.5)8(LnO1.5)4(O)(C5H8O2)6(EtOH)2(CH3CN)2⋅2CH3CN (where Ln = Tb (1), Tb/Eu (2), and Gd (3)) by introducing a terminal chelating ligand acac coordinated with the Ln3+ ions. Notably, this not only permits to afford an antenna effect and sensitizes the characteristic 4f luminescence but also induces an important change in the geometry of the ions from distorted antiprism (octa-coordinated) to a pentagonal bipyramidal geometry (seven-coordinated), which can positively impact their photophysical properties (Ferreira da Rosa et al., 2020). Complexes 1 and 2 present high Tb3+ or Tb3+/Eu3+ characteristic emissions and paramagnetic properties, while complex 3 has been used to assess the energies of the triplet states of the acac ligand. Theoretical calculations on the intramolecular energy transfer and multiphonon rates for the Tb3+-based compound indicate a thermal balance between Stark components of the 5D4 level. The mixed Tb3+/Eu3+ analog showcases intra-cluster Tb3+-to-Eu3+ energy transfer and may be used for efficient temperature sensing with good stability, sensibility (Sr = 2.0 % K−1 at 373 K), and repeatability after several heating/cooling cycles.
2 Materials and methods
Phenyltrimethoxysilane (98%), Et4NCl (≥98%), Eu(NO3)3⋅6H2O (99.9% trace metal basis), Tb(NO3)3⋅6H2O (99.9% trace metal basis), ethanol, acetylacetonate, and acetonitrile were purchased from Merck and used as received.
2.1 Synthesis
Compounds 1–3 were synthesized in a similar way. A mixture of PhSi(OMe)3 and NaOH was dissolved in 30 mL of ethanol. The resulting solution was heated to reflux for 1.0 h. Afterward, Tb(NO3)3⋅6H2O for compound 1 (or the mixture of Tb(NO3)3⋅6H2O and Eu(NO3)3⋅6H2O, in a 3:1 ratio, for compound 2, or Gd(NO3)3⋅5H2O for compound 3) and sodium acetylacetonate dissolved in 30 mL of CH3CN were added at once. The resulting mixture was heated to reflux for 3.0 h. Filtration of the mixture from the insoluble part provided a non-colored solution. Slow evaporation of solvents (ethanol/CH3CN) provided, in 5–10 days, many crystalline materials. The single crystals suitable for single-crystal X-ray diffraction were collected. The crystal products were dried in a vacuum to perform elemental analysis and calculate the yield.
(PhSiO1.5)8(TbO1.5)4(O)(C5H8O2)6(EtOH)2(CH3CN)2⋅2CH3CN 1. Reactant loadings: PhSi(OMe)3 (0.186 g, 0.8 mmol), NaOH (0.032 g, 0.8 mmol), Tb(NO3)3∙6H2O (0.174 g, 0.4 mmol), and sodium acetylacetonate (0.049 g, 0.4 mmol). Yield = 30% (0.068 g).
Anal. calcd for C78H88Tb4O30Si8: % C 39.60, % H 3.75. Found: % C 39.54, % H 3.71. IR in KBr pellets (cm−1): 3443 (w), 3071 (s), 3048 (s), 1592 (s), 1519 (s), 1384 (w), 1129 (s), 1051 (w), 1027 (w), 952 (s), 945 (w), 835 (s), 745 (s), 700 (s), 676 (s), 576 (s), 547 (s), and 494 (s). (PhSiO1.5)8(TbO1.5)3(EuO1.5)(O)(C5H8O2)6(EtOH)2(CH3CN)2⋅2CH3CN 2. Reactant loadings: PhSi(OMe)3 (0.186 g, 0.8 mmol), NaOH (0.032 g, 0.8 mmol), Tb(NO3)3∙6H2O (0.131 g, 0.3 mmol), Eu(NO3)3∙5H2O (0.043 g, 0.1 mmol), and sodium acetylacetonate (0.049 g, 0.4 mmol). Yield = 25% (0.057 g).
Anal. calcd for C78H88Eu3O30Si8Tb: % C 39.95, % H 3.78. Found: % C 39.89, % H 3.73. EDS analysis: Tb/Eu ratio 22.1/7.4. IR in KBr pellets (cm−1): 3619 (s), 3365 (w), 3071 (s), 3048 (s), 1592 (s), 1518 (s), 1429 (s), 1384 (w), 1266 (s), 1129 (s), 1052 (m), 950 (s), 745 (s), 701 (s), 676 (s), 576 (s), and 494 (s).
(PhSiO1.5)8(GdO1.5)4(O)(C5H8O2)6(EtOH)2(CH3CN)2⋅2CH3CN 3. Reactant loadings: PhSi(OMe)3 (0.186 g, 0.8 mmol), NaOH (0.032 g, 0.8 mmol), Gd(NO3)3•5H2O (0.173 g, 0.4 mmol), and sodium acetylacetonate (0.049 g, 0.4 mmol). Yield = 39% (0.092 g).
Anal. calcd for C78H88Gd4O30Si8: % C 39.71, % H 3.76. Found: % C 39.63, % H 3.72. IR in KBr pellets (cm−1): 3439 (w), 3066 (s), 3045 (s), 1596 (s), 1517 (s), 1390 (w), 1121 (s), 1060 (w), 1025 (w), 950 (s), 940 (w), 833 (s), 741 (s), 690 (s), 674 (s), 579 (s), 544 (s), and 491 (s).
2.2 Characterization
IR spectra (KBr pellets) were recorded using a PerkinElmer Spectrum Two FT-IR spectrometer. The quantification of Eu, Tb, and Si was performed using a scanning electron microscope and energy-dispersive X-ray analysis (SEM-EDX) on a FEI Quanta FEG 200 instrument. The powders were deposited on an adhesive carbon film and analyzed under vacuum. The heavy elements were quantified using INCA software, with a dwell time of 3 µs.
The emission and excitation spectra were at first evaluated at room (298 K) and low (77 K) temperatures using an Edinburgh FLS-920 spectrofluorimeter. The excitation source was a 450-W Xe arc lamp. The spectra were corrected for the detection and optical spectral response of the spectrofluorimeter. In the second step, the emission spectra were measured as a function of the temperature. The temperature setup included a thermal element (Heidolph, MR Hei-Tec [EU], 825 W, plate diameter 145 mm), a thermal camera (Optris PI 450i, accuracy ± 0.01°C), an excitation source, and a detector. The powder sample was placed on a cover glass (14 mm diameter) at the center of the heating source. The thermal camera was positioned at an angle of 30° relative to the sample to work as a temperature standard controller. A UV LED operating at 365 nm (Thorlabs M365L2) was used to excite the samples (I = 0.7A) by irradiating at 15 mm from the sample surface.
The spectrometric detector and the excitation source were coupled using a multimode fiber. The fiber excitation output and detector were located at the top of the sample. A long-pass filter (in-line fiber optic filter mount, Thorlabs, FOFMS/M, 450 nm, 20 µm) was placed in the light path between the sample and detector to avoid artifacts arising from the excitation source. The emission spectra were recorded in the temperature range from 300 to 376 K. At each temperature step, 10 min was provided to allow the temperature to stabilize, and then, 10 emission spectra were recorded from an average of 10 consecutive spectra with an integration time of 100 ms.
The UV–visible–NIR absorption spectrum was measured using a Specord 210 Plus spectrophotometer (Analytik Jena AG, Germany). Magnetic susceptibility data were collected using a Quantum Design MPMS-XL SQUID magnetometer working between 1.8 and 350 K with a magnetic field up to 7 T. The sample was prepared under an ambient condition. The data were corrected for the sample holder, and the diamagnetic contributions were calculated from Pascal’s constants.
2.3 Crystal structure determination
X-ray diffraction data for compounds 1–3 were collected using a three-circle Bruker D8 QUEST PHOTON-III CCD diffractometer (λ(MoKα) radiation, graphite monochromator, and φ and ω scan modes) and corrected for absorption using the SADABS program. The data were indexed and integrated using the SAINT program. Details are given in Supplementary Table S1. The structures were solved by direct methods and refined by the full-matrix least squares technique on F2 with anisotropic displacement parameters for non-hydrogen atoms. The hydrogen atoms of the OH groups were localized in difference Fourier maps and refined isotropically with fixed-displacement parameters [Uiso(H) = 1.5Ueq(O)]. The other hydrogen atoms were placed in calculated positions and refined within the riding model with fixed isotropic displacement parameters [Uiso(H) = 1.5Ueq(C) for the CH3 groups and 1.2Ueq(C) for the other groups]. All calculations were carried out using the SHELXTL program suite.
Crystallographic data have been deposited in the Cambridge Crystallographic Data Center, CCDC 2189837 (1), CCDC 2189838 (2), and CCDC 2189839 (3). Copies of this information may be obtained free of charge from the Director, CCDC, 12 Union Road, Cambridge CB2 1EZ, United Kingdom (Fax: +44 1223 336033; e-mail: ZGVwb3NpdEBjY2RjLmNhbS5hYy51aw== or www.ccdc.cam.ac.uk).
The crystal structure was determined in the Department of Structural Studies of Zelinsky Institute of Organic Chemistry, Moscow, Russia.
3 Results and discussion
3.1 Synthesis and crystal structures
The synthesis of Ln3+-based silsesquioxanes (PhSiO1.5)8(LnO1.5)4(O)(C5H8O2)6(EtOH)2(CH3CN)2⋅2CH3CN (where Ln = Tb 1, Tb/Eu 2, and Gd 3) with an antenna ligand was performed using a two-step approach involving conventional alkaline hydrolysis (Prigyai et al., 2019; Laird et al., 2021) with the in situ formation of phenylsiloxanolate [PhSi(O)ONa]x species, following a self-assembling reaction with the acac ligand and the corresponding Ln3+ salts for compounds 1 (Tb3+) and 3 (Gd3+) or mixed Tb3+ and Eu3+ salts (with a Tb3+/Eu3+ ratio of 3/1) for compound 2. The crystallization from an acetonitrile/ethanol mixture affords the formation of single crystals suitable for crystallographic analysis. Single-crystal X-ray diffraction performed on compounds 1–3 indicates that they are isostructural and crystalize in the P21/n space group (Supplementary Table S1, Electronic Supplementary Material (ESI)). Their crystal packing may be viewed as an assembly of neutral tetranuclear lanthanide-based cages directed almost toward [–1 1–1] (Figure 1A for compound 1; Supplementary Figures S1,S2, ESI for compounds 2–3). In all compounds, the cages form layers parallel to (1 0–1). Within the layers, the cages are arranged perpendicular to each other. Two acetonitrile molecules were also crystalized in the unit cell and situated between the tetranuclear cages. The shortest intermolecular Ln–Ln distances are equal to 10.0765, 10.0709, and 10.0981 Å for compounds 1, 2, and 3, respectively.
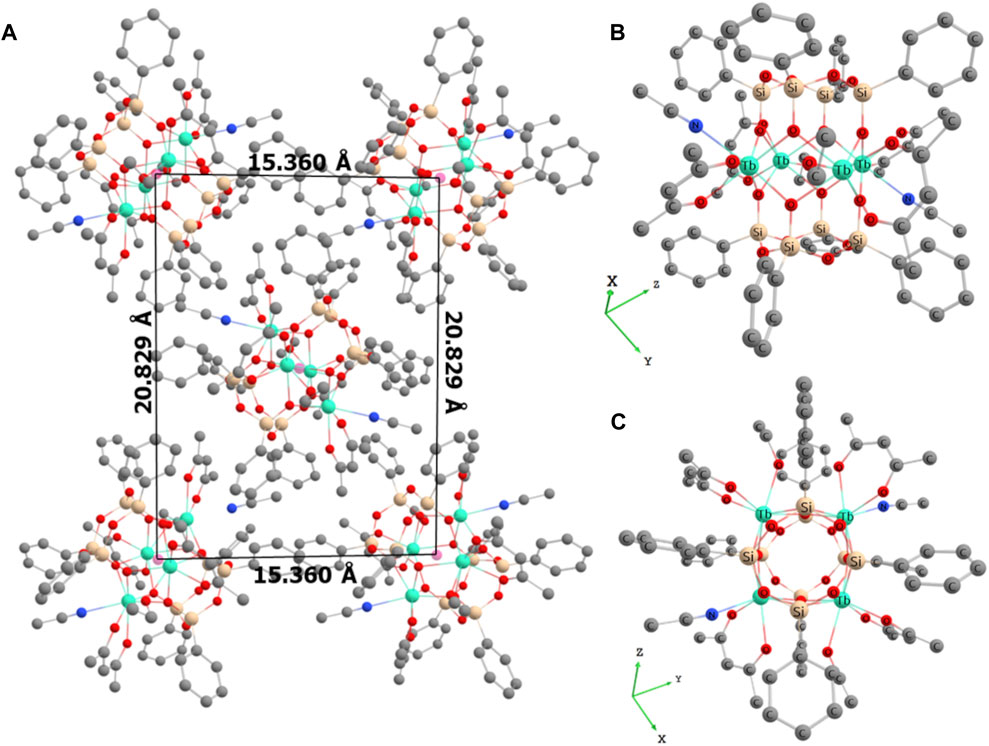
Figure 1. (A) Perspective view of crystal packing for compound 1 along the crystallographic axis a. Hydrogen atoms and crystallized acetonitrile molecules have been omitted for clarity; (B) molecular structure of compound 1 showing the prism-like polyhedron; (C) molecular structure of compound 1 showing the square arrangement of the Tb atoms in the (TbO2)4O core. Color code: green, Tb; beige, Si; red, O; blue, N; and gray, C.
The molecular structure of the neutral tetranuclear lanthanide-based cages of compound 1 may be described as a prism-like polyhedron in the form of a New Year paper lantern. It is formed by a (TbO2)4 core wedged between two tetraphenylcyclotetrasiloxanolate moieties (Figure 1B, C for compound 1).
For compound 2, the prism-like polyhedron is formed by a (Tb1-xEuxO2)4 core, where x = 0.25, with statistically distributed Tb/Eu ions linked through oxygen atoms, forming a distorted square (Supplementary Figure S1, ESI). In both compounds, there are two slightly different seven-coordinated Tb (for compound 1) or Tb/Eu sites (for compound 2), which adopt a one-capped trigonal prism geometry. Each Ln3+ ion is coordinated by four bridging oxygens, two oxygens from terminal acetylacetonate, and one ethanol or acetonitrile molecule. The Tb (or Tb/Eu)-O distances involving bridging oxygens are in the range 2.3121(1)–2.3471(1) Å for compound 1 and 2.3013(2)–2.3789(2) Å for compound 2, while those involving terminal acetylacetonate and ethanol molecules are larger and situated in the range 2.2884(1)–2.3966(1) Å for compound 1 and 2.2822(6)–2.4401(6) Å for compound 2. The Tb (or Tb/Eu)-N distances involving terminal acetonitrile are 2.5358 (2) Å for compound 1 and in the range 2.4564–2.5691 Å for compound 2. The O-Ln-O angles in the square are in the range 70.322(3)–81.654(3)° for compounds 1 and 2. Compound 3 presents crystal structures similar to those of compound 1 (Supplementary Figure S2, ESI). The main distances and angles are given in ESI (Supplementary Table S2). The atomic Tb/Eu ratio in compound 2 determined by SEM-EDX analysis is equal to 3/1, as expected.
3.2 Magnetic properties
The magnetic measurements were determined for all compounds using a SQUID MPMS-XL magnetometer working between 1.8 and 300 K and up to 7 T.
The temperature dependence of the magnetic susceptibility performed in the direct current (dc) mode has been performed under an applied magnetic field of 1,000 Oe. The room temperature χT values of 48.40 and 31.30 cm3∙K∙mol−1 for compounds 1 and 2, respectively, are coherent with the theoretical values of 47.28 and 35.46 cm3∙K∙mol−1 expected for four (compound 1) and three Tb3+ ions (compound 2), using the free-ion approximation (7F6, S = 3, L = 3, g = 3/2, χT = 11.82 cm3∙K∙mol-1) (Long et al., 2011). Upon cooling, the compounds exhibit a typical decrease in χT caused by the thermal depopulation of the Stark sublevels and/or the presence of antiferromagnetic interactions between the Tb3+ centers (Figure 2A). The field dependence of magnetization performed at 1.8 K shows a rapid linear increase in the magnetization with the field for both compounds (Figure 2B). The curves do not reach the saturation and magnetization values of 22.9 and 14.95 Nβ under 7T for compounds 1 and 2, respectively, indicating the presence of significant magnetic anisotropy. This behavior is perfectly coherent with the previously published cage-like compounds containing Tb3+ ions. Note that no slow relaxation of the magnetization has been observed by investigation of the dynamic magnetic behaviors of these compounds by alternating current (ac) magnetic measurements.
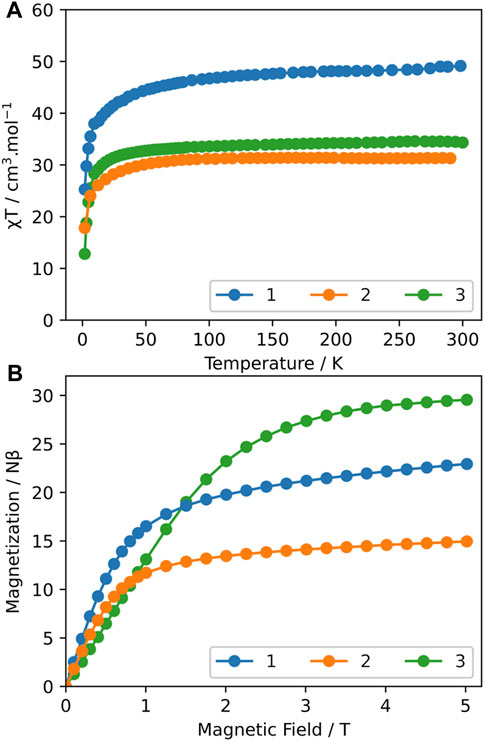
Figure 2. (A) Temperature dependence of χT under a 1,000-Oe dc magnetic field for compounds 1–3; (B) field dependence of the magnetization at 1.8 K for compounds 1–3.
The magnetic behavior of Gd3+-based silsesquioxane 3 is coherent with the presence of four isotrope Gd3+ ions. The room temperature χT value of 34.4 cm3∙K∙mol−1 is in agreement with the expected value (31.52 cm3∙K∙mol−1) calculated for four Gd3+ ions in a free-ion approximation (8S7/2, g = 2) (Long et al., 2011). As the temperature decreases, the χT vs. T curve almost remains constant up to 20 K and then sharply declines at low temperatures, indicating the presence of weak antiferromagnetic interactions between adjacent Gd3+ ions (Figure 2A). The M vs. H curve performed at 1.8 K is coherent with the presence of four Gd3+ ions (28 Nβ) (Figure 2B).
3.3 Experimental and theoretical photoluminescence studies
The excitation and emission spectra of all compounds were investigated in the solid state at different temperatures ranging from 11 to 378 K.
3.3.1 Gd3+ compound 3
The photoluminescence of Gd3+-containing compound 3 has been used to assess the energies of the triplet states located on the terminal acac ligand since Gd3+ has a high energy-accepting electronic level, which prevents any population through the energy transfer from the electronic level of the antenna ligand. Supplementary Figure S3, ESI, shows the emission spectrum of compound 3 obtained upon excitation at 246 nm at 77 K. The energy of the triplet state is 25,316 cm−1 (corresponding to an emission peak at 395 nm).
3.3.2 Tb3+ compound 1
The excitation spectra of Tb3+-containing compound 1 monitored within the main 5D4→7F5 transition (543 nm) in the range 11–300 K exhibit large broadband, with a main component at ca. 330 nm attributed to the acac ligand excited state (Figure 3A). A series of low-intensity narrow lines attributed to transitions between 7F6 and the 5G5, 5G6, and 5D3 excited states indicates that Tb3+ is mainly populated through antenna-assisted sensitization rather than by a direct excitation into the intra-4f8 lines. The emission spectra of compound 1 recorded under excitation at 330 nm in the 11–297-K and 298–378-K intervals (Figures 3B,C) exhibit the classical Tb3+ 5D4→7F6-0 characteristic emission lines. The profile of the emission spectra is similar under direct 4f8 excitation at 485 nm (Supplementary Figures S4A, B, ESI). The most intense emission, centered at 543 nm, corresponds to the 5D4→7F5 transition, displaying a gradual decrease with increasing temperature, as shown in Figure 4 and Supplementary Figures S4C, S5 (ESI). The emission decay curve of compound 1 was monitored at room temperature within 5D4→7F5. The curve is well-reproduced by a single exponential function, yielding a 5D4 lifetime of 0.851 ± 0.002 ms, which is a rather typical value for Tb3+ complexes (Supplementary Figure S6). The presence of two maxima in the 5D4→7F5 transition, I1 and I2 in Figure 4, is associated with two distinct Stark components. Although the maximum number of 5D4 and 7F5 Stark levels can lead to 99 components in the 5D4→7F5 transition, once the majority is degenerate, only a few can be observed (Figure 4). A question can be raised concerning whether some of these transitions between Stark levels could be attributed to vibronic transitions (or sidebands). This can be answered with the emission spectrum recorded at 11 K (Figure 5A), where vibrational modes that could couple in this spectral region can be suppressed. As the emission intensity is directly proportional to the population of the emitting level, the model suggests that emission I1 originates from a Stark component (
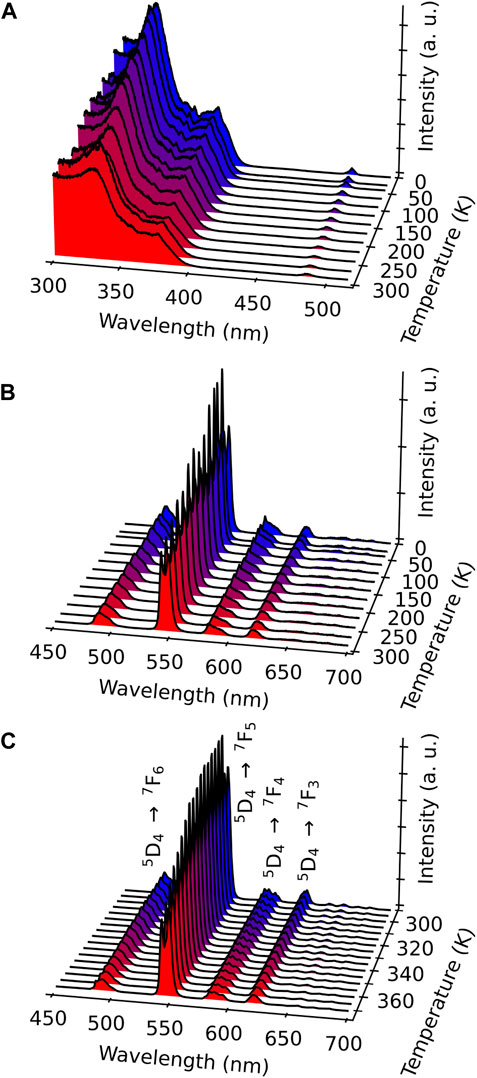
Figure 3. (A) Excitation spectra of compound 1 monitored at 543 nm in the range 11–297 K. Emission spectra of compound 1 performed with excitation at 330 nm measured from 11 to 297 K (B) and from 298 to 378 K (C).
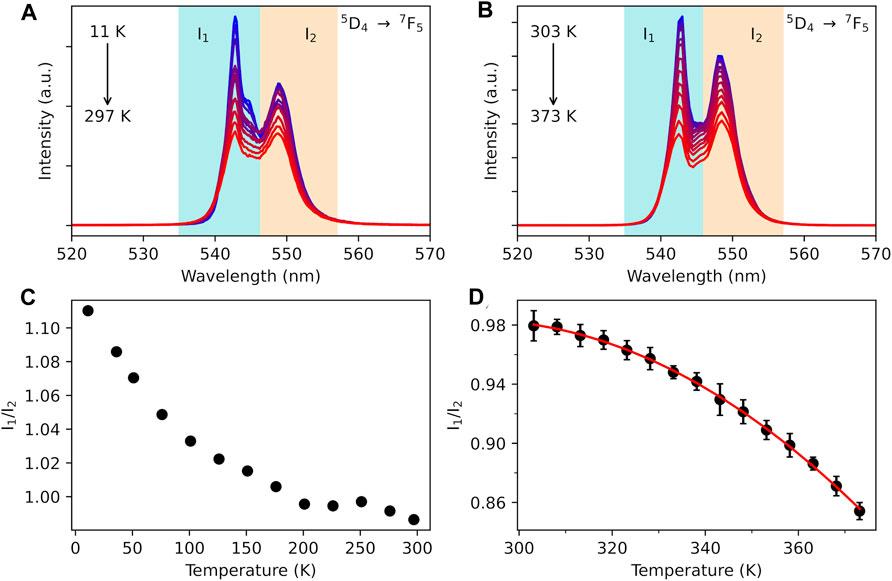
Figure 4. ⁵D4→⁷F5 transition emission band for compound 1 upon the excitation at 330 nm in the ranges 11–297 K (A) and 303–378 K (B). The shadowed blue and orange regions represent the integration ranges for the I1 and I2 Stark components, respectively. Temperature dependence of the I1/I2 ratio in the intervals 11–297 K (C) and 303–378 K (D). The red curves represent a single exponential function as the best fit to the experimental data (r2 > 0.99).
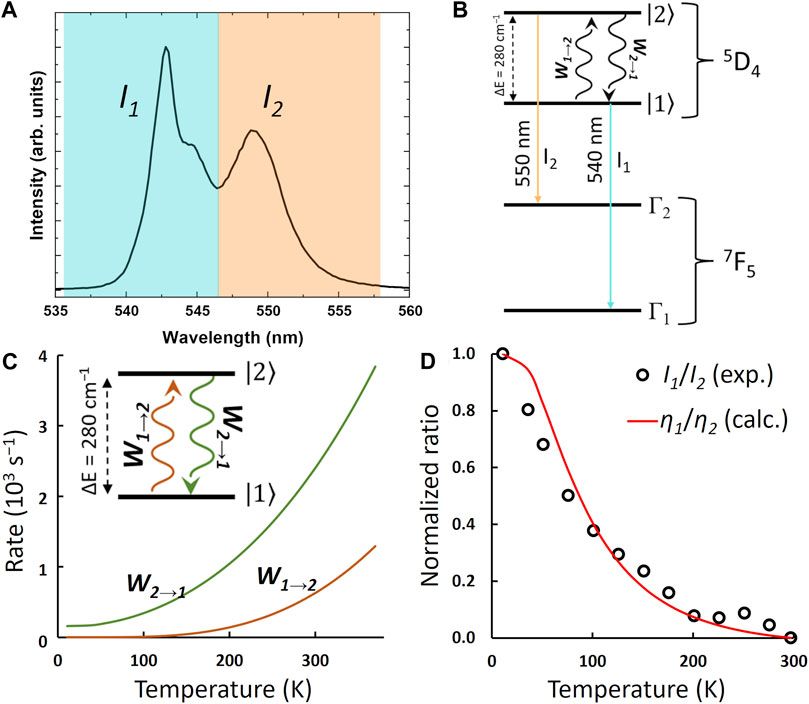
Figure 5. (A) Low-temperature (11 K) emission spectrum, recorded with excitation at 322 nm, showing the two main Stark levels of the 5D4→7F5 transition. (B) Illustration of the emission process between different Stark components of the 5D4 level to different Stark components of the 7F5 level. (C) Calculated multiphonon rates, as a function of temperature, exchanged by 5D4 Stark levels
The model assumes that the high-energy emission stems from a lower-energy Stark component of 5D4. This assumption is relevant because, at 11 K, there would be no thermal population arising from
Based on the obtained IET and multiphonon rates (Figure 5C; Supplementary Table S3), together with the energy level diagram shown in Figures 5A,B, a three-level rate equation model can be considered as follows:
where
One premise of the present model is that the
Although the energy transfer from the S1 state has been a recent topic of debate in the literature (Alaoui, 1995; Rodríguez-Cortiñas et al., 2002; Yang et al., 2004; Kasprzycka et al., 2017; Moura Jr. et al., 2021a; Aquino LE do et al., 2021; Manzur et al., 2023), as certain levels of Tb3+ may serve as better acceptors due to the high values of matrix elements involved in the IET process (e.g., 7F6→5G6 and 7F5→5G6) (Moura Jr. et al., 2021a), the population in the upper levels essentially decays not as quickly to the 5D4 level compared to the rising of the population from the 7F6 and 7F5 to the 5D4 level in the direct energy transfer process. Thus, this premise can be justified by the subsequent multiphonon decay between adjacent levels of Tb3+, forming a ladder-like decay process. These decays are generally slower than direct energy transfer, and consequently, decay steps like 5G6→5D3→5D4 can be neglected in the present model.
For comparison, the decay from 5D3→5D4 involves a large energy gap of Δ(5D3→5D4) ≈ 5,792 cm−1 (Carnall et al., 1978), leading to a decay rate of
The rate equation model (Supplementary Eqs S1–S3) was numerically propagated using the Radau method, a numerical approach belonging to the class of fully implicit Runge–Kutta methods (Hairer et al., 2015), over a time span of 0–10 ms with a step size of 10 ns. This implies that 1,000,000 points were calculated for each temperature, ranging from 11 to 297 K in steps of 2 K.
As the intensity is directly proportional to the population of the emitting level, the experimental intensity ratio (
Suta and Meijerink (2020) reported that there is potential temperature dependence in the use of crystal field splitting (Stark levels) for trivalent lanthanides at low temperatures. However, at higher temperatures, where the product kBT is significantly greater than the crystal splitting energy, a thermodynamic equilibrium among Stark levels could be established, allowing for their treatment as an effectively thermally averaged single level with an average radiative decay rate. In our model, this implies that the non-radiative decays and absorptions between two Stark levels are approximately equal, rendering the model inapplicable. In other words, Boltzmann statistics between Stark levels become ineffective at higher temperatures, resulting in a shift in the trend for temperatures exceeding 250 K, as shown in Supplementary Figure S5A (ESI), and consistent with the behavior shown in Supplementary Figure S5B (ESI).
3.3.3 Mixed Eu3+/Tb3+ compound 2
To provide a self-calibrated ratiometric luminescent thermometer, the Eu3+ ion was introduced in the structure to obtain compound 2, as previously demonstrated in different MOF materials and Ln3+-based complexes (Brites et al., 2019). The excitation spectra at different temperatures were recorded by monitoring the main emissions of both Eu3+ at 615 nm (5D0→7F2) and Tb3+ at 543 nm (5D4→7F5) (Figures 6A,B). The spectra are relatively similar and, as in the case of compound 1, present main broadband (at 330 nm) attributed to the acac ligand excited states, confirming the excitation through antenna sensitization. Low-intensity intra-4f transitions of both Ln3+ ions can also be visible in the spectra, e.g., 7F0,1→5D2 (Figure 6A) and 7F6→5D4 (Figures 6A,B). The observation of this latter Tb3+ line when monitoring Eu3+ emission at 615 nm points out the occurrence of Tb3+-to-Eu3+ energy transfer.
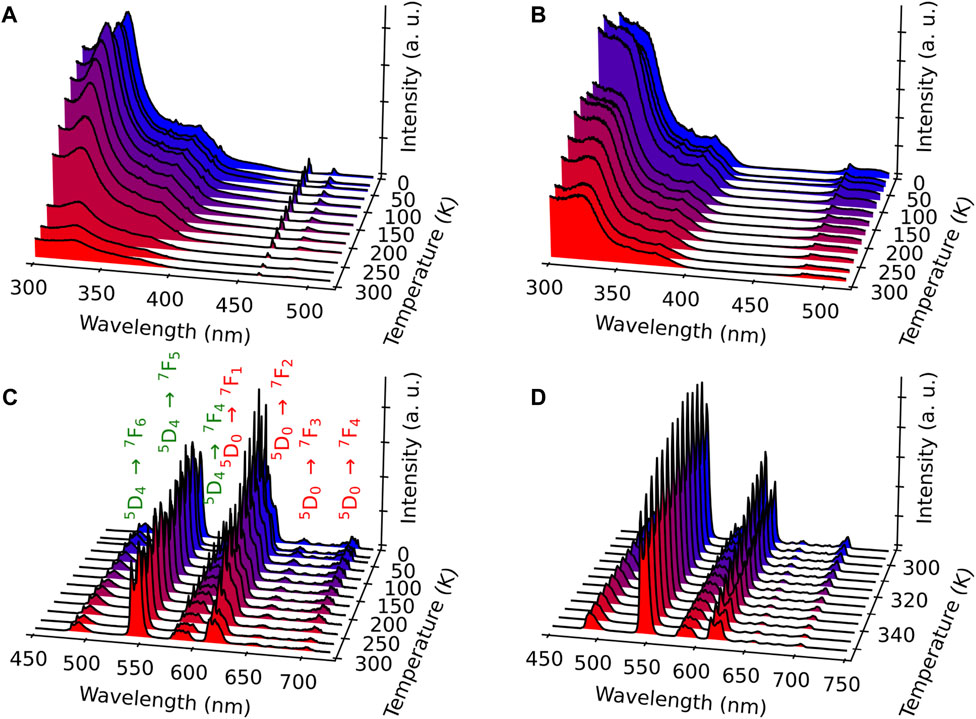
Figure 6. Excitation spectra of compound 2 monitored at 615 nm (Eu3+) (A) and 543 nm (Tb3+) (B) in the range 11–297 K. Emission spectra of compound 2 excited at 330 nm in the ranges 11–297 K (C) and 298–378 K (D). The transitions ascribed to Eu3+ and Tb3+ are indicated in red and green, respectively.
The emission spectra were measured upon excitation at 330 nm, which is operational for both Ln3+ ions, in the ranges 11–297 K (Figure 6C) and 298–378 K (Figure 6D). Compared with the emission spectra of compound 1, the Eu3+-characteristic transitions from 5D0 to 7FJ (J = 0–4) appear besides the Tb3+ transitions. Note that the emission spectra obtained under a direct excitation at 484 nm (Tb3+ 7F6→5D4 transition) show, besides the main Tb3+ transition 5D4→7F5 (indicated in green), a series of the Eu3+-related transitions 5D0→7F1,2,3,4 (indicated in red, Supplementary Figure S7, ESI). This fact points out the presence of the Tb3+-to-Eu3+ energy transfer, as already inferred from the excitation spectra shown in Figure 6B. This is not surprising considering that the shortest Ln3+–Ln3+ distance in compound 2 is equal to 3.728 Å. As expected, the emission spectra performed with direct excitation in the Eu3+-related band at 464 nm display only the Eu3+ transitions (Supplementary Figure S8, ESI).
To estimate the energy transfer rates, in addition to the calculations of pairwise interactions (Malta, 2008; Carneiro Neto et al., 2020), the distribution of donor–acceptor distances, where Tb3+ is the donor and Eu3+ is the acceptor, was calculated from the crystallographic structure using a custom program written in C. The simulations of the Tb3+/Eu3+ ratio (3:1) in the structure of an expanded 20 × 20 × 20 crystal, consisting of 64,000 Ln3+ sites, were conducted. The sites could be occupied by either Tb3+ or Eu3+ ions. The program performed 100 simulations while maintaining the 3:1 ratio to provide statistically reliable donor–acceptor distance results. Thus, the occurrence of the formation of a Tb-Eu pair with a given distance is given by (Trannoy et al., 2021)
where
Figure 1A and Supplementary Figure S1, ESI, show that the shortest distance between two {Ln4} clusters of Ln3+ is in the order of 15 Å. This results in a weak interaction concerning Tb-Eu energy transfer between different {Ln4} clusters. Thus, the Tb-Eu interaction is restricted to intra-cluster energy transfer, which can lead to highly effective energy transfer rates, as discussed in the literature (Wang et al., 2014; Calado et al., 2023; Gálico et al., 2023; Pelluau et al., 2023).
Using the calculated Tb-Eu pairwise energy transfer rates (see Supplementary Table S4 and the theoretical section in the ESI for further details) and the
where
Supplementary Figure S9 illustrates the temperature behavior of
To demonstrate the possibility of using compound 2 as a self-referenced luminescent thermometer, temperature dependence of the normalized integrated intensity area related with the two main transitions Tb3+ 5D4→7F5 (in green) and Eu3+ 5D0→7F2 (in red) was extracted for both emission spectra obtained upon excitations at 330 nm (antenna) and 484 nm (intra-4f8). The temperature-dependent variation in the corresponding thermometric parameter (I5D4→7F5/I5D0→7F2, LIR) in the ranges 11–297 K (Figure 7A) and 298–378 K (Figure 7B) shows exponential correlations, which can be used for temperature measurements. The relative thermal sensitivity (Sr) is the main parameter, allowing the comparison of the performance among different types of thermometers (Bednarkiewicz et al., 2020). The Sr value represents the variation in the experimental thermometric parameter (LIR in the present case) per degree of temperature, which is expressed as
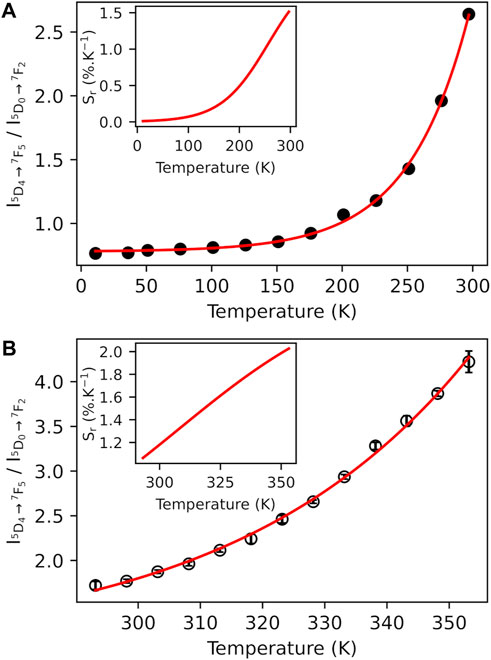
Figure 7. Temperature dependence of the normalized luminescence intensity (I5D4→7F5/I5D0→7F2) performed for the emission spectra of compound 2 under the excitation at 330 nm in the ranges 11–297 K (A) and 298–378 K (B) with several experimental cycles (circles) and the associated fit (red curve) with a single exponential function (full line) (r2 > 0.99). Inset: Sr, temperature dependence.
The temperature dependences of Sr are shown in the insets of Figures 7A,B. The maximum Sr value is equal to 1.5%·K−1 at 297 K, for 11–297 K, and 2.0%·K−1 at 373 K, for 298–378 K. Both values are close to a frequently considered high relative thermal sensitivity (∼1%·K−1) (Brites et al., 2019) and are close to the best Sr values reported for mixed Eu3+/Tb3+ compounds (Trannoy et al., 2021). Temperature uncertainty (or thermal resolution, δT) is the smallest temperature change that can be detected (Brites et al., 2016). This value is related to Sr as follows:
where δLIR(T) is the standard deviation in the LIR(T) obtained upon several temperature cycles. According to this, the minimal thermal resolution is 0.2 K. Note that the use of emission spectra upon excitation at 484 nm for thermometry is also possible. Supplementary Figures S10A, B, ESI show the corresponding temperature dependences of LIR and the maximal value of Sr of 1.3%·K−1 at 297 K. Therefore, the temperature sensor 2 proposed here works reliably in the operating range 11─378 K.
The emission decay curves of compound 2 were monitored at room temperature upon excitation at 330 nm within the 5D4→7F6 (Tb3+) and ⁵D0→⁷F4 (Eu3+) transitions (Supplementary Figure S11, ESI). The curves are well-reproduced by double-exponential functions as the best fits to the experimental data (r2 > 0.99), yielding lifetimes of 0.126 ± 0.002 and 0.668 ± 0.002 ms for the former and 0.110 ± 0.002 and 0.406 ± 0.002 ms for the latter transitions. The occurrence of two lifetimes is under investigation and will be addressed later.
4 Conclusion
In summary, here, we reported three new luminescent cage-like silsesquioxanes containing a tetranuclear Tb3+, Tb3+/Eu3+, or Gd3+ core, where each Ln3+ ion is coordinated by an antenna acetylacetonate ligand. The crystal structures indicate that the introduction of chelating acetylacetonate changes the coordination environment of the Ln3+ ions conducting to seven-coordination geometry close to the one-capped trigonal prism.
Lanthanide-based silsesquioxanes 1 and 2 present solid-state characteristic Tb3+ and Tb3+/Eu3+-related emissions between 11 and 373 K sensitized by acetylacetonate antenna upon excitation in the UV region, while the direct excitation in the visible domain is also possible.
Theoretical calculations were conducted to elucidate the primary characteristics of the thermal behavior between the Stark levels of the 5D4 level in compound 1. The results demonstrated good agreement between experiment and theory, enabling the extraction of the main effect, which is the balance between multiphonon decays and absorptions between these two Stark levels as a function of temperature.
For compound 2, where intra-cluster energy transfer can be highly efficient and even surpass the ligand-to-Ln3+ transfer, simulations were performed to obtain the average Tb3+-to-Eu3+ energy transfer rates within the {Ln4} cluster structure. The analysis revealed that the average energy transfer increases with temperature, consistent with the low quenching observed for Tb3+ emissions. Conversely, the abrupt quenching of Eu3+ emissions with increasing temperature suggests a strong electron–phonon coupling for this ion.
Mixed Tb3+/Eu3+ (Tb/Eu ration 3/1) compound 2 exhibits a tunable thermosensitive Tb3+-to-Eu3+ energy transfer driven by Tb3+ and Eu3+ emissions. The corresponding temperature dependence allows the verification of the use of this compound for a ratiometric self-reference luminescent thermometer. It was realized by using a fluorescence intensity ratio between the two main components of the spectra (Tb3+ 5D4→7F5 and Eu3+ 5D0→7F2 transitions) in the range 11–373 K, demonstrating the maximum relative thermal sensitivity referred above 2.0 % K−1 at 373 K.
Data availability statement
The original contributions presented in the study are included in the article/Supplementary Material; further inquiries can be directed to the corresponding authors.
Author contributions
GF: data curation, investigation, methodology, supervision, validation, and writing–original draft. AK: data curation, formal analysis, investigation, methodology, and writing–original draft. SS: data curation, formal analysis, investigation, supervision, validation, and writing–original draft. VK: data curation, formal analysis, investigation, software, and writing–original draft. MH-R: data curation, formal analysis, investigation, and writing–original draft. ES: supervision, writing–original draft, and funding acquisition. TP: writing–original draft, data curation, formal analysis, and investigation. LC: conceptualization, funding acquisition, project administration, resources, supervision, validation, writing–original draft, and writing–review and editing. YG: conceptualization, funding acquisition, supervision, validation, writing–original draft, writing–review and editing, and investigation. AC: investigation, validation, writing–original draft, writing–review and editing, data curation, formal analysis, software, and visualization. AB: validation, writing–original draft, writing–review and editing, conceptualization, funding acquisition, methodology, and supervision. JL: conceptualization, methodology, supervision, validation, writing–original draft, writing–review and editing, funding acquisition, project administration, and visualization.
Funding
The author(s) declare that financial support was received for the research, authorship, and/or publication of this article. This work was financially supported by the Russian Science Foundation (project No. 22-13-00250, synthetic and luminescent studies), the University of Montpellier and CNRS, and the project PRC2287 Premium 2019–2021. Elemental analysis data were collected using the equipment of the Center for Molecular Composition Studies of INEOS RAS with support from the Ministry of Science and Higher Education of the Russian Federation. JL acknowledges the Vernadsky program of the Embassy of France in the Russian Federation (2019–2021). This project was developed within the scope of the national program ANR (Project Hotspot), France. MAHR acknowledges the Beatriz Galindo Fellowship (BG22/00061). This work was also developed within the scope of the projects CICECO, Aveiro Institute of Materials, UIDB/50011/2020, UIDP/50011/2020, and LA/P/0006/2020 financed by Portuguese funds through the FCT/MCTES (PIDDAC).
Acknowledgments
The authors acknowledge the Platform of Analysis and Characterization (PAC) of ICGM for providing magnetic and X-ray diffraction measurements.
Conflict of interest
The authors declare that the research was conducted in the absence of any commercial or financial relationships that could be construed as a potential conflict of interest.
The author(s) declared that they were an editorial board member of Frontiers, at the time of submission. This had no impact on the peer review process and the final decision.
Publisher’s note
All claims expressed in this article are solely those of the authors and do not necessarily represent those of their affiliated organizations, or those of the publisher, the editors, and the reviewers. Any product that may be evaluated in this article, or claim that may be made by its manufacturer, is not guaranteed or endorsed by the publisher.
Supplementary material
The Supplementary Material for this article can be found online at: https://www.frontiersin.org/articles/10.3389/fchem.2024.1379587/full#supplementary-material
References
Alaoui, I. M. (1995). Nonparticipation of the ligand’s first triplet state in intramolecular energy transfer in Eu3+ and Tb3+ ruhemann’s purple complexes. J. Phys. Chem. 99 (35), 13280–13282. doi:10.1021/j100035a036
Allison, S. W. (2019). A brief history of phosphor thermometry. Meas. Sci. Technol. 30 (7), 072001. doi:10.1088/1361-6501/ab1d02
Annand, J., Aspinall, H. C., and Steiner, A. (1999). Novel heterometallic lanthanide silsesquioxane. Inorg. Chem. 38 (17), 3941–3943. doi:10.1021/ic990208p
Annand, J., and Aspinall H, C. (2000). Lanthanide silasesquioxanes: monomeric and functionalised complexes. J. Chem. Soc. Dalton Trans. 0 (12), 1867–1871. doi:10.1039/b000659i
Aquino Le do, N., Barbosa, G. A., Ramos, J. de L., Giese S, O. K., Santana, F. S., Hughes, D. L., et al. (2021). Seven-coordinate Tb3+ complexes with 90% quantum yields: high-performance examples of combined singlet- and triplet-to-Tb3+ energy-transfer pathways. Inorg. Chem. 60 (2), 892–907. doi:10.1021/acs.inorgchem.0c03020
Arnold, P. L., Blake, A. J., Hall, S. N., Ward, B. D., and Wilson, C. (2001). A functional model for lanthanide doped silicate materials: synthesis of an apically substituted samarium silsesquioxane complex. J. Chem. Soc. Dalton Trans. 0 (4), 488–491. doi:10.1039/b009123p
Aulsebrook, M. L., Graham, B., Grace, M. R., and Tuck, K. L. (2018). Lanthanide complexes for luminescence-based sensing of low molecular weight analytes. Coord. Chem. Rev. 375, 191–220. doi:10.1016/j.ccr.2017.11.018
Bednarkiewicz, A., Marciniak, L., Carlos, L. D., and Jaque, D. (2020). Standardizing luminescence nanothermometry for biomedical applications. Nanoscale. 12 (27), 14405–14421. doi:10.1039/d0nr03568h
Bernot, K., Daiguebonne, C., Calvez, G., Suffren, Y., and Guillou, O. (2021). A journey in lanthanide coordination chemistry: from evaporable dimers to magnetic materials and luminescent devices. Acc. Chem. Res. 54 (2), 427–440. doi:10.1021/acs.accounts.0c00684
Bettinelli, M., Carlos, L., and Liu, X. (2015). Lanthanide-doped upconversion nanoparticles. Phys. Today. 68 (9), 38–44. doi:10.1063/pt.3.2913
Bodman, S. E., and Butler, S. J. (2021). Advances in anion binding and sensing using luminescent lanthanide complexes. Chem. Sci. 12 (8), 2716–2734. doi:10.1039/d0sc05419d
Brites, C. D. S., Balabhadra, S., and Carlos, L. D. (2019). Lanthanide-based thermometers: at the cutting-edge of luminescence thermometry. Adv. Opt. Mater. 7 (5), 1801239. doi:10.1002/adom.201801239
Brites, C. D. S., Lima, P. P., Silva, N. J. O., Millán, A., Amaral, V. S., Palacio, F., et al. (2010). A luminescent molecular thermometer for long-term absolute temperature measurements at the nanoscale. Adv. Mater. 22 (40), 4499–4504. doi:10.1002/adma.201001780
Brites, C. D. S., Lima, P. P., Silva, N. J. O., Millán, A., Amaral, V. S., Palacio, F., et al. (2012). Thermometry at the nanoscale. Nanoscale 4 (16), 4799–4829. doi:10.1039/c2nr30663h
Brites, C. D. S., Marin, R., Suta, M., Carneiro Neto, A. N., Ximendes, E., Jaque, D., et al. (2023). Spotlight on luminescence thermometry: basics, challenges, and cutting-edge applications. Adv. Mater. 35, 2302749. doi:10.1002/adma.202302749
Brites, C. D. S., Millán, A., and Carlos, L. D. (2016). “Chapter 281 - lanthanides in luminescent thermometry,” in Handbook on the physics and chemistry of rare earths. Editors B. Jean-Claude, and K. P. Vitalij (Elsevier), 339–427. doi:10.1016/bs.hpcre.2016.03.005
Bünzli, J. C. G. (2010). Lanthanide luminescence for biomedical analyses and imaging. Chem. Rev. 110 (5), 2729–2755. doi:10.1021/cr900362e
Bünzli, J. C. G. (2015). On the design of highly luminescent lanthanide complexes. Coord. Chem. Rev. 293-294, 19–47. doi:10.1016/j.ccr.2014.10.013
Bünzli, J. C. G. (2019). Lanthanide photonics: shaping the nanoworld. TRECHEM. 1 (8), 751–762. doi:10.1016/j.trechm.2019.05.012
Bünzli, J. C. G., and Eliseeva, S. V. (2013). Intriguing aspects of lanthanide luminescence. Chem. Sci. 4 (5), 1939–1949. doi:10.1039/c3sc22126a
Calado, C. M. S., Gálico, D. A., and Murugesu, M. (2023). Intra-cluster energy transfer editing in a dual-emitting system to tap into lifetime thermometry. Chem. Commun. 59 (92), 13715–13718. doi:10.1039/d3cc03658h
Carnall, W. T., Crosswhite, H., and Crosswhite, H. M. (1978). “Energy level structure and transition probabilities in the spectra of the trivalent lanthanides in LaF3,”. Report No.: ANL-78-XX-95. Available at: https://www.osti.gov/biblio/6417825 (Accessed December 12, 2023).
Carneiro Neto, A. N., Kasprzycka, E., Souza, A. S., Gawryszewska, P., Suta, M., Carlos, L. D., et al. (2022). On the long decay time of the 7F5 level of Tb3+. J. Luminescence. 248, 118933. doi:10.1016/j.jlumin.2022.118933
Carneiro Neto, A. N., Moura, R. T., Shyichuk, A., Paterlini, V., Piccinelli, F., Bettinelli, M., et al. (2020). Theoretical and experimental investigation of the Tb3+ → Eu3+ energy transfer mechanisms in cubic A3Tb0.90Eu0.10(PO4)3 (A = Sr, Ba) materials. J. Phys. Chem. C 124 (18), 10105–10116. doi:10.1021/acs.jpcc.0c00759
Carneiro Neto, A. N., Teotonio, E. E. S., de Sá, G. F., Brito, H. F., Legendziewicz, J., Carlos, L. D., et al. (2019). “Chapter 310 - modeling intramolecular energy transfer in lanthanide chelates: a critical review and recent advances,” in Handbook on the physics and chemistry of rare earths. Editors J. C. G. Bünzli, and V. K. Pecharsky (Elsevier), 55–162.
Choi, S. H., Duzik, A. J., Kim, H. J., Park, Y., Kim, J., Ko, H. U., et al. (2017). Perspective and potential of smart optical materials. Smart Mater Struct. août 26 (9), 093001. doi:10.1088/1361-665x/aa7c32
Costa, I. F., Blois, L., Paolini, T. B., Assunção, I. P., Teotonio, E. E. S., Felinto, MCFC, et al. (2024). Luminescence properties of lanthanide tetrakis complexes as molecular light emitters. Coord. Chem. Rev. 502, 215590. doi:10.1016/j.ccr.2023.215590
Cui, Y., Xu, H., Yue, Y., Guo, Z., Yu, J., Chen, Z., et al. (2012). A luminescent mixed-lanthanide metal–organic framework thermometer. J. Am. Chem. Soc. 134 (9), 3979–3982. doi:10.1021/ja2108036
Davies, G. L., O’Brien, J., and Gun’ko, Y. K. (2017). Rare earth doped silica nanoparticles via thermolysis of a single source metallasilsesquioxane precursor. Sci. Rep. 7 (1), 45862. doi:10.1038/srep45862
de Sá, G. F., Malta, O. L., de Mello Donegá, C., Simas, A. M., Longo, R. L., Santa-Cruz, P. A., et al. (2000). Spectroscopic properties and design of highly luminescent lanthanide coordination complexes. Coord. Chem. Rev. 196 (1), 165–195. doi:10.1016/s0010-8545(99)00054-5
Dramićanin, M. D. (2020). Trends in luminescence thermometry. J. Appl. Phys. 128 (4), 040902. doi:10.1063/5.0014825
Eliseeva, S. V., and Bünzli, J. C. G. (2009). Lanthanide luminescence for functional materials and bio-sciences. Chem. Soc. Rev. 39 (1), 189–227. doi:10.1039/b905604c
Félix, G., Kulakova, A., Sene, S., Charlot, C., Bilyachenko, A. N., Korlyukov, A. A., et al. (2023b). New family of luminescent tetranuclear lanthanide-based germsesquioxanes: luminescence and temperature sensing. Organometallics 42 (18), 2613–2622. doi:10.1021/acs.organomet.3c00009
Félix, G., Sene, S., Kulakova, A., Bilyachenko A, N., Khrustalev V, N., Shubina E, S., et al. (2023a). Tetranuclear lanthanide-based silsesquioxanes: towards a combination of a slow relaxation of the magnetization and a luminescent thermometry. RSC Adv. 13 (37), 26302–26312. doi:10.1039/d3ra04901a
Fernandes, M., Freitas, V., Pereira, S., Leones, R., Silva, M. M., Carlos, L. D., et al. (2018). Luminescent electrochromic devices for smart windows of energy-efficient buildings. Energies. 11 (12), 3513. doi:10.3390/en11123513
Ferreira da Rosa, P. P., Kitagawa, Y., and Hasegawa, Y. (2020). Luminescent lanthanide complex with seven-coordination geometry. Coord. Chem. Rev. 406, 213153. doi:10.1016/j.ccr.2019.213153
Gálico, D. A., Calado, C. M. S., and Murugesu, M. (2023). Lanthanide molecular cluster-aggregates as the next generation of optical materials. Chem. Sci. 14 (22), 5827–5841. doi:10.1039/d3sc01088k
Gregório, T., Leão, J. D. M., Barbosa, G. A., Ramos, J. de L., Kumar Giese, O. S., Briganti, M., et al. (2019). Promoting a significant increase in the photoluminescence quantum yield of terbium(III) complexes by ligand modification. Inorg. Chem. 58 (18), 12099–12111. doi:10.1021/acs.inorgchem.9b01397
Hairer, E., and Wanner, G. (2015). “Radau methods,” in Encyclopedia of applied and computational mathematics. Editor B. Engquist (Berlin, Heidelberg: Springer), 1213–1216. doi:10.1007/978-3-540-70529-1_139
Herrmann, W. A., Anwander, R., Dufaud, V., and Scherer, W. (1994). Molecular siloxane complexes of rare earth metals—model systems for silicate-supported catalysts? Angewandte Chemie Int. Ed. Engl. 33 (12), 1285–1286. doi:10.1002/anie.199412851
Jaque, D., and Vetrone, F. (2012). Luminescence nanothermometry. Nanoscale. 4 (15), 4301–4326. doi:10.1039/c2nr30764b
Kaczmarek, A. M., Deun, R. V., and Voort, P. V. D. (2019). Nanothermometers based on lanthanide incorporated periodic mesoporous organosilica. J. Mater Chem. C 7 (14), 4222–4229. doi:10.1039/c8tc06353b
Kasprzycka, E., Carneiro Neto, A. N., Trush, V. A., Jerzykiewicz, L., Amirkhanov, V. M., Malta, O. L., et al. (2020). How minor structural changes generate major consequences in photophysical properties of RE coordination compounds; resonance effect, LMCT state. J. Rare Earths. 38 (5), 552–563. doi:10.1016/j.jre.2020.02.001
Kasprzycka, E., Trush, V. A., Amirkhanov, V. M., Jerzykiewicz, L., Malta, O. L., Legendziewicz, J., et al. (2017). Contribution of energy transfer from the singlet state to the sensitization of Eu3+ and Tb3+ luminescence by sulfonylamidophosphates. Chem. – A Eur. J. 23 (6), 1318–1330. doi:10.1002/chem.201603767
Kulakova, A. N., Bilyachenko, A. N., Levitsky, M. M., Khrustalev, V. N., Shubina, E. S., Felix, G., et al. (2020). New luminescent tetranuclear lanthanide-based silsesquioxane cage-like architectures. Chem. – A Eur. J. 26 (70), 16567–16568. doi:10.1002/chem.202004207
Kulakova, A. N., Nigoghossian, K., Félix, G., Khrustalev, V. N., Shubina, E. S., Long, J., et al. (2021). New magnetic and luminescent Dy(III) and Dy(III)/Y(III) based tetranuclear silsesquioxane cages. Eur. J. Inorg. Chem. 2021 (27), 2696–2701. doi:10.1002/ejic.202100308
Laird, M., Totée, C., Gaveau, P., Silly, G., Lee, A. V. D., Carcel, C., et al. (2021). Functionalised polyhedral oligomeric silsesquioxane with encapsulated fluoride – first observation of fluxional Si⋯F interactions in POSS. Dalton Trans. 50 (1), 81–89. doi:10.1039/d0dt03057k
Liu, J. Q., Luo, Z. D., Pan, Y., Kumar Singh, A., Trivedi, M., and Kumar, A. (2020). Recent developments in luminescent coordination polymers: designing strategies, sensing application and theoretical evidences. Coord. Chem. Rev. 406, 213145. doi:10.1016/j.ccr.2019.213145
Long, J., Habib, F., Lin, P. H., Korobkov, I., Enright, G., Ungur, L., et al. (2011). Single-molecule magnet behavior for an antiferromagnetically superexchange-coupled dinuclear dysprosium(III) complex. J. Am. Chem. Soc. 133 (14), 5319–5328. doi:10.1021/ja109706y
Lorenz, V., Fischer, A., and Edelmann, F. T. (2002). Silsesquioxane chemistry.: Part 10. Silsesquioxane silanolate complexes of samarium and scandium. J. Organomet. Chem. 647 (1), 245–249. doi:10.1016/s0022-328x(01)01434-6
Lorenz, V., Gießmann, S., Gun’ko, Y. K., Fischer, A. K., Gilje, J. W., and Edelmann, F. T. (2004). Fully metalated silsesquioxanes: building blocks for the construction of catalyst models. Angew. Chem. Int. Ed. 43 (35), 4603–4606. doi:10.1002/anie.200454094
Lyubov, D. M., Neto, A. N. C., Fayoumi, A., Lyssenko, K. A., Korshunov, V. M., Taydakov, I. V., et al. (2022). Employing three-blade propeller lanthanide complexes as molecular luminescent thermometers: study of temperature sensing through a concerted experimental/theory approach. J. Mater Chem. C 10 (18), 7176–7188. doi:10.1039/d2tc01289h
Malkin, B. Z. (2005). “Ion-phonon interactions,” in Spectroscopic properties of rare earths in optical materials. Editors R. Hull, J. Parisi, R. M. Osgood, H. Warlimont, G. Liu, and B. Jacquier (Berlin, Heidelberg: Springer), 130–190. doi:10.1007/3-540-28209-2_3
Malta, O. L. (2008). Mechanisms of non-radiative energy transfer involving lanthanide ions revisited. J. Non-Crystalline Solids 354 (42), 4770–4776. doi:10.1016/j.jnoncrysol.2008.04.023
Manzur, J., Fuentealba, P., Gil, Y., Pérez-Obando, J., Morales Alfaro, J., Vega Carvallo, A. I., et al. (2023). Tuning the emission of homometallic DyIII, TbIII, and EuIII 1-D coordination polymers with 2,6-di(1H-1,2,4-triazole-1-yl-methyl)-4-R-phenoxo ligands: sensitization through the singlet state. Inorg. Chem. 62 (47), 19195–19207. doi:10.1021/acs.inorgchem.3c02201
Marchesi, S., Carniato, F., and Boccaleri, E. (2014). Synthesis and characterisation of a novel europium(iii)-containing heptaisobutyl-POSS. New J. Chem. 38 (6), 2480–2485. doi:10.1039/c4nj00157e
Miyakawa, T., and Dexter, D. L. (1970). Phonon sidebands, multiphonon relaxation of excited states, and phonon-assisted energy transfer between ions in solids. Phys. Rev. B 1 (7), 2961–2969. doi:10.1103/physrevb.1.2961
Miyata, K., Hasegawa, Y., Kuramochi, Y., Nakagawa, T., Yokoo, T., and Kawai, T. (2009). Characteristic structures and photophysical properties of nine-coordinate europium(III) complexes with tandem-connected tridentate phosphane oxide ligands. Eur. J. Inorg. Chem. 2009 (32), 4777–4785. doi:10.1002/ejic.200900598
Miyata, K., Nakanishi, T., Fushimi, K., and Hasegawa, Y. (2012). Solvent-dependent luminescence of eight-coordinated Eu(III) complexes with bidentate phosphine oxide. J. Photochem. Photobiol. A Chem. 235, 35–39. doi:10.1016/j.jphotochem.2012.03.005
Monteiro, JHSK (2020). Recent advances in luminescence imaging of biological systems using lanthanide(III) luminescent complexes. Molecules. 25 (9), 2089. doi:10.3390/molecules25092089
Moos, H. W. (1970). Spectroscopic relaxation processes of rare earth ions in crystals. J. Luminescence. 1-2, 106–121. doi:10.1016/0022-2313(70)90027-x
Moura Jr., R. T., Carneiro Neto, A. N., Aguiar, E. C., Santos-Jr., C. V., de Lima, E. M., Faustino, W. M., et al. (2021b). (INVITED) JOYSpectra: a web platform for luminescence of lanthanides. Opt. Mater. X. 11, 100080. doi:10.1016/j.omx.2021.100080
Moura Jr., R. T., Oliveira, J. A., Santos, I. A., de Lima, E. M., Carlos, L. D., Aguiar, E. C., et al. (2021a). Theoretical evidence of the singlet predominance in the intramolecular energy transfer in Ruhemann’s purple Tb(III) complexes. Adv. Theory Simulations 4 (3), 2000304. doi:10.1002/adts.202000304
Nigoghossian, K., Kulakova, A. N., Félix, G., Khrustalev, V. N., Shubina, E. S., Long, J., et al. (2021). Temperature sensing in Tb3+/Eu3+-based tetranuclear silsesquioxane cages with tunable emission. RSC Adv. 11 (55), 34735–34741. doi:10.1039/d1ra06755a
Ning, Y., Zhu, M., and Zhang, J. L. (2019). Near-infrared (NIR) lanthanide molecular probes for bioimaging and biosensing. Coord. Chem. Rev. 399, 213028. doi:10.1016/j.ccr.2019.213028
Pelluau, T., Sene, S., Ali, L. M. A., Félix, G., Neto, A. N. C., Carlos, L. D., et al. (2023). Hybrid multifunctionalized mesostructured stellate silica nanoparticles loaded with β-diketonate Tb3+/Eu3+ complexes as efficient ratiometric emissive thermometers working in water. Nanoscale 15, 14409–14422. doi:10.1039/d3nr01851b
Prigyai, N., Chanmungkalakul, S., Ervithayasuporn, V., Yodsin, N., Jungsuttiwong, S., Takeda, N., et al. (2019). Lithium-templated formation of polyhedral oligomeric silsesquioxanes (POSS). Inorg. Chem. 58 (22), 15110–15117. doi:10.1021/acs.inorgchem.9b01836
Reisfeld, R., and Jørgensen, C. K. (1977). “Lasers and excited states of rare earths,” in Inorganic chemistry concepts. Editors M. Becke, M. F. Lappert, J. L. Margrave, R. W. Parry, C. K. Jørgensen, S. J. Lippardet al. (Berlin, Heidelberg: Springer). doi:10.1007/978-3-642-66696-4
Riseberg, L. A., and Weber, M. J. (1977). “Relaxation phenomena in rare-earth luminescence,” in Progress in optics. Editor E. Wolf (Elsevier).
Rocha, J., Brites, C. D. S., and Carlos, L. D. (2016). Lanthanide organic framework luminescent thermometers. Chem. – A Eur. J. 22 (42), 14782–14795. doi:10.1002/chem.201600860
Rodríguez-Cortiñas, R., Avecilla, F., Platas-Iglesias, C., Imbert, D., Bünzli, J. C. G., de Blas, A., et al. (2002). Structural and photophysical properties of heterobimetallic 4f-Zn iminophenolate cryptates. Inorg. Chem. 41 (21), 5336–5349. doi:10.1021/ic025587s
SeethaLekshmi, S., Ramya, A. R., Reddy, M. L. P., and Varughese, S. (2017). Lanthanide complex-derived white-light emitting solids: a survey on design strategies. J. Photochem. Photobiol. C Photochem. Rev. 33, 109–131. doi:10.1016/j.jphotochemrev.2017.11.001
Shchegolikhina, O. I., Pozdniakova, Y. A., Lindeman, S. V., Zhdanov, A. A., Psaro, R., Ugo, R., et al. (1996). Cyclosiloxane sandwich complexes of a lanthanide metal: Na6{[(C6H5SiO2)8]2Nd4(μ4-O)}. J. Organomet. Chem. 514 (1), 29–35. doi:10.1016/0022-328x(95)06005-h
Sheng, K., Si, W. D., Wang, R., Wang, W. Z., Dou, J., Gao, Z. Y., et al. (2022a). Keggin-type tridecanuclear europium-oxo nanocluster protected by silsesquioxanes. Chem. Mater. 34 (9), 4186–4194. doi:10.1021/acs.chemmater.2c00627
Sheng, K., Wang, R., Bilyachenko, A., Khrustalev, V., Jagodič, M., Jagličić, Z., et al. (2022b). Tridecanuclear Gd(III)-silsesquioxane: synthesis, structure, and magnetic property. Chem. Phys. Mater 1 (4), 247–251. doi:10.1016/j.chphma.2022.04.008
Suta, M., and Meijerink, A. (2020). A theoretical framework for ratiometric single ion luminescent thermometers—thermodynamic and kinetic guidelines for optimized performance. Adv. Theory Simulations 3 (12), 2000176. doi:10.1002/adts.202000176
Suzuki, M., Tseeb, V., Oyama, K., and Ishiwata, S. (2007). Microscopic detection of thermogenesis in a single HeLa cell. Biophysical J. 92 (6), L46–L48. doi:10.1529/biophysj.106.098673
Trannoy, V., Carneiro Neto, A. N., Brites, C. D. S., Carlos, L. D., and Serier-Brault, H. (2021). Engineering of mixed Eu3+/Tb3+ metal-organic frameworks luminescent thermometers with tunable sensitivity. Adv. Opt. Mater. 9 (6), 2001938. doi:10.1002/adom.202001938
Wang, J., Deng, R., MacDonald, M. A., Chen, B., Yuan, J., Wang, F., et al. (2014). Enhancing multiphoton upconversion through energy clustering at sublattice level. Nat. Mater. févr 13 (2), 157–162. doi:10.1038/nmat3804
Wu, G., Chen, Y., Xu, D. J., Liu, J. C., Sun, W., and Shen, Z. (2009). Synthesis and molecular structure of a tetrameric neodymium-silsesquioxane cage complex: {[(i-C4H9)7(Si7O12) Nd]4NaCl}. J. Organomet. Chem. 694 (9), 1571–1574. doi:10.1016/j.jorganchem.2009.01.042
Yanagisawa, K., Nakanishi, T., Kitagawa, Y., Seki, T., Akama, T., Kobayashi, M., et al. (2015). Seven-coordinate luminophores: brilliant luminescence of lanthanide complexes with C3v geometrical structures. Eur. J. Inorg. Chem. 2015 (28), 4769–4774. doi:10.1002/ejic.201500820
Keywords: thermometry, silsesquioxanes, lanthanides, luminescence, magnetism, energy transfer
Citation: Félix G, Kulakova AN, Sene S, Khrustalev VN, Hernández-Rodríguez MA, Shubina ES, Pelluau T, Carlos LD, Guari Y, Carneiro Neto AN, Bilyachenko AN and Larionova J (2024) Luminescent Ln3+-based silsesquioxanes with a β-diketonate antenna ligand: toward the design of efficient temperature sensors. Front. Chem. 12:1379587. doi: 10.3389/fchem.2024.1379587
Received: 31 January 2024; Accepted: 07 March 2024;
Published: 03 April 2024.
Edited by:
Steve Suib, University of Connecticut, United StatesReviewed by:
Yuichi Kitagawa, Hokkaido University, JapanAshis K. Patra, Indian Institute of Technology Kanpur, India
Copyright © 2024 Félix, Kulakova, Sene, Khrustalev, Hernández-Rodríguez, Shubina, Pelluau, Carlos, Guari, Carneiro Neto, Bilyachenko and Larionova. This is an open-access article distributed under the terms of the Creative Commons Attribution License (CC BY). The use, distribution or reproduction in other forums is permitted, provided the original author(s) and the copyright owner(s) are credited and that the original publication in this journal is cited, in accordance with accepted academic practice. No use, distribution or reproduction is permitted which does not comply with these terms.
*Correspondence: Joulia Larionova, am91bGlhLmxhcmlvbm92YUB1bW9udHBlbGxpZXIuZnI=; Alexey N. Bilyachenko, YmlseWFjaGVua29AaW5lb3MuYWMucnU=; Albano N. Carneiro Neto, YWxiYW5vbmV0b0B1YS5wdA==