 Xin-Ru Zhang1
 Yue-Hua Chen1*Jia-Nuo Zhang1Wen-Yu Wang1Rui-Bo Sun1Zi-Xuan Ding1
 Hui Zhang1Ming Xie1Ting-Guo Kang1
 Hui-Peng Song1,2*
- 1Key Laboratory for Identification and Quality Evaluation of Traditional Chinese Medicine of Liaoning Province, Liaoning University of Traditional Chinese Medicine, Dalian, China
- 2Key Laboratory of Ministry of Education for TCM Viscera-State Theory and Applications, Liaoning University of Traditional Chinese Medicine, Shenyang, China
Introduction: The similarity in appearance of poisonous and medicinal plants, such as Asarum heterotropoides (AH) and Cynanchum paniculatum (CP), poses safety risks due to frequent confusion. Since AH contains toxic ingredients, the traditional methods of olfactory and gustatory identification cannot be used to distinguish AH from CP.
Methods: To differentiate them systematically, we proposed a novel strategy based on dual electronic sensors (DES) and dual fingerprint spectra (DFS). The DES included two intelligent sensors, namely the E-nose and E-tongue, which differentiated AH and CP based on odor and taste, respectively. DFS comprised chemical fingerprint spectra obtained through LC-HR-Q-TOF-MS/MS and electrochemical fingerprint spectra derived from the Belousov-Zhabotinsky reaction, differentiating AH and CP by their specific and overall compositions, respectively. To our knowledge, this was the first time that the E-nose, E-tongue, LC-HR-Q-TOF-MS/MS, and the Belousov-Zhabotinsky reaction were combined to identify AH and CP.
Results and discussion: With the E-nose, we identified 25 major odor components in AH and 12 odor components in CP in a single run of 140 s. Using the E-tongue, bitterness and astringency were identified as their primary taste differences. Furthermore, 91 compounds in AH and 90 compounds in CP were identified through LC-HR-Q-TOF-MS/MS. Both AH and CP shared nitrogenous compounds, volatile oils, organic acids, and lignans. However, AH uniquely contained coumarins and flavonoids, while CP contained steroidal compounds and saccharides. Notably, AH also possessed distinct toxic components, specifically aristolactam I, aristolochic acid D, and safrole. Based on the Belousov-Zhabotinsky reaction, we obtained the electrochemical fingerprint spectra of AH and CP, thereby facilitating further distinction between these two herbs. Through the combination of electrochemical fingerprint spectra with principal component analysis (PCA) or orthogonal partial least squares-discriminant analysis (OPLS-DA), the accuracy of this method reached 100%. Through the fusion strategy, the odors, tastes, components, and electrochemical properties of AH and CP have been systematically analyzed.
1 Introduction
Confusion and misuse frequently occur among medicinal plants with highly similar appearances (Xin et al., 2022). This phenomenon not only impacts the efficacy of medications but also poses potential threats to patients’ health. The underground parts of Asarum heterotropoides (AH) and Cynanchum paniculatum (CP), as two herbal medicines with remarkable medicinal value and highly similar appearances, serve as typical examples of such issues. AH is widely used to treat symptoms such as colds, rhinitis, and coughs, while CP can effectively alleviate stomachaches and toothaches (Zhang et al., 2021). Given their significant differences in pharmacological functions, misusing one for the other can lead to severe consequences. Notably, AH contains poisonous components such as aristolochic acid-like ingredients which has been classified as a Group I cancer-causing agent by the World Health Organization. Its misuse or overdosage can trigger a series of adverse reactions or even lead to life-threatening conditions. Additionally, due to AH’s significantly higher market price compared to CP, some unethical merchants may intentionally adulterate AH with CP for sale. This further poses challenges to the authentication of these two medicinal plants. To effectively prevent the confusion and misuse, there is an urgent need to adopt modern technologies and establish reliable strategies to discriminate them from multiple angles.
Electronic sensory technologies have demonstrated unique advantages in the identification of medicinal plants. Electronic nose (E-nose) and electronic tongue (E-tongue) are two representative electronic sensory technologies (Tibaduiza et al., 2024; Wang S. et al., 2022). The E-nose perceives and analyzes volatile odors by simulating the human olfactory system. Using E-nose, Zhang et al. differentiated raw Magnolia officinalis and ginger-processed M. officinalis and identified 16 possible odor components (Zhang et al., 2022). Lu et al. employed E-nose combined with gas chromatography-mass spectrometry to identify 40 aroma components from chamomile (Lu et al., 2024). In another example, the adulterants and geographical origins of Ziziphi Spinosae were successfully identified by E-nose and headspace gas chromatography-mass spectrometry (Zhang et al., 2023). Similarly, as an intelligent taste recognition tool, the E-tongue has also been widely applied in the field of medicinal plants. For example, Lei et al. conducted comprehensive evaluations of the aroma and taste of bear bile powder and its common counterfeit by E-nose and E-tongue technologies (Lei et al., 2023). Xing et al. determined the taste characteristics of Polygonum multiflorum using E-tongue and revealed the relationship between tastes and components (Xing et al., 2021). Wang et al. studied the correlation between the fragrance, taste, and effective components of Gastrodiae Rhizoma by E-nose and E-tongue (Wang B. et al., 2022). In summary, the rapid development of E-nose and E-tongue technologies provides a new approach for the identification of morphologically similar medicinal plants.
Chemical fingerprint spectra based on liquid chromatography-mass spectrometry (LC-MS) is one of the effective strategies for the analysis of chemical components in medicinal plants (Chen et al., 2021; Liang et al., 2022). In recent years, this technique has been increasingly and widely applied in this field. For instance, Bao et al. revealed at least 18 different chemical components in Coptidis Rhizoma by using UPLC-Q/TOF-MS (Bao et al., 2024). Mei et al. identified 50 components in Spatholobi Caulis by LC-Triple TOF-MS (Mei et al., 2021). Batsukh et al. utilized LC-IT-TOF-MS/MS in conjunction with multivariate statistical analysis to identify 30 compounds from Divaricate Saposhnikoviae (Batsukh et al., 2020). With this method, researchers can obtain detailed fingerprint spectra and abundant information on chemical components. Although LC-MS is effective in the identification of medicinal plants, it comes with drawbacks like expensive equipment and lengthy data analysis. In recent years, electrochemical fingerprint spectra has emerged and developed rapidly (Lan et al., 2023). Compared to LC-MS, electrochemical fingerprint spectra offers advantages including cheap instrumentation, simple sample treatment and short detection time, making it an effective complement to LC-MS. Furthermore, it can intuitively reflect the overall characteristic information of medicinal plants. The principle indicates that during the electrochemical reaction process, the chemical components in different medicinal plants will elicit unique changes, leading to characteristic fingerprint spectra. Zeng et al. utilized fingerprint spectra on the basis of three-electrode system to differentiate Coptidis Rhizoma from its adulterants (Zeng and Jiang, 2022). Tarighat et al. used fingerprint spectra based on cyclic voltammetry to classify and identify Lamiaceae herbs such as mint and lavender (Tarighat et al., 2023). Liu et al. discovered significant differences in the fingerprint spectra of Astragali Radix from various provinces through differential pulse voltammetry (Liu and Yan, 2023). However, electrochemical fingerprint spectra commonly identify medicinal plants from the overall components, lacking specificity for individual components. It seems that the combination of LC-MS and electrochemical fingerprint spectra is an ideal method for the analysis of medicinal plants. Currently, there are few reports on the combination of the two methods.
In this study, a novel strategy combining dual electronic sensors (DES) and dual fingerprint spectra (DFS) was proposed for differentiating AH and CP. This strategy emphasized the integration of electronic sensory technology and fingerprint spectra analysis. On the one hand, E-nose and E-tongue were utilized to differentiate AH and CP from the perspectives of odor and taste, respectively. On the other hand, chemical fingerprint spectra obtained through LC-HR-Q-TOF-MS/MS and electrochemical fingerprint spectra derived from the Belousov-Zhabotinsky reaction were employed to differentiate AH and CP, focusing on specific chemical components and overall characteristic information, respectively. Furthermore, the electrochemical fingerprint spectra was combined with PCA and OPLS-DA to ensure a 100% accurate differentiation between AH and CP. Through the implementation of the DES and DFS strategy, a comprehensive and systematic differentiation of AH and CP from multiple angles was achieved.
2 Materials and methods
2.1 Reagents and materials
Seven different batches of AH were purchased from the regional medicinal herb trading center of Anguo City, Hebei Province (batches: 07230307, 07230401, 07230504, 07230604, 07230702, 07230801, 07230905). Seven different batches of CP were purchased from the regional medicinal herb trading center of Lu’an City, Anhui Province (batches: 23060201, 23070304, 23080302, 23090203, 23100402, 23110501, 23120204). The chemical standards including asarinin (PS010871), methyl eugenol (PS001191), (1R)-(+)-α-pinene (PS230925-10), (+)-3-carene (PS230926-01), eucalyptol (PS020906), carvacrol (PS230925-13), α-terpineol (PS020226), paeonol (PS000281), hesperidin (PS010632), chlorogenic acid (PS010694), o-hydroxyacetophenone (PS230925-14), p-hydroxyacetophenone (PS020038), palmitic acid (PS020930), and oleic acid (PS020507) were all purchased from Chengdu Push Bio-technology Co., Ltd. Vanillic acid (MUST-23012113), caffeic acid (MUST-23061118), and (−)-β-pinene (MUST-2392216) were purchased from Chengdu Must Biotechnology Co., Ltd. The purity of all the above compounds was above 98%. Purified water was purchased from Wahaha Group Co., Ltd. (Hangzhou, China). H2SO4 (20111014) was purchased from Sinopharm Chemical Reagent Co., Ltd. CH2(COOH)2 (M813041) was purchased from Macklin Co., Ltd. (NH4)2SO4·Ce(SO4)2 (20230601) was purchased from Tianjin Damao Chemical Reagent Co., Ltd. KBrO3 (20160107) and LC-grade methanol (20241101) were purchased from Tianjin Kermel Chemical Reagent Co., Ltd. LC-grade acetonitrile (JB145430) and MS-grade formic acid (20171008) were purchased from Merck (Darmstadt, Germany).
2.2 Sample preparation
The roots and rhizomes of AH and CP were powdered and passed through a sieve. Then 0.5 g of sample was weighed and mixed with 10 mL of methanol for a 40-min ultrasonic extraction (F-050 type, Fuyang ultrasonic cleaner). After centrifugation (LC-LX-H185C type, Lichen Co., Ltd.) at 14,000 rpm for 5 min, the supernatant was used for LC-HR-Q-TOF-MS/MS analysis. Another 0.5 g of sample powder was weighed and mixed with 10 mL of deionized water for a 30-min ultrasonic extraction. The extract was filtered and diluted tenfold for E-tongue analysis. The powders of medicinal plants were directly used for electrochemical analysis. Prior to E-nose analysis, both dried AH and CP samples were processed into uniform small segments (1 cm in length) to ensure morphological standardization. Each headspace vial was filled with 1.0 g of the processed sample material. This standardization procedure aimed to unify both morphology and mass, thereby reducing variations in the detection of volatile components.
2.3 Setup and conditions of E-nose
The E-nose (Alpha MOS SA Heracles NEO) was employed for analysis, equipped with an automatic sampling device, an ultra-fast gas chromatography (GC) unit, two flame ionization detectors (FID), and two columns of different polarities (MXT-5 and MXT-1701). The volume of a headspace vial was 20 mL and the sample weight was 1.0 g. Seven batches of samples were prepared and each sample was subjected to three replicate measurements. The injection volume was set at 4,000 μL, with an incubation temperature of 60°C and an incubation time of 20 min. The injection speed was 125 μL/s, lasting for 45 s. The inlet temperature was maintained at 200°C, while the trap temperature was set at 40 °C. Hydrogen was used as the carrier gas at a flow rate of 1.0 mL/min. The trap time was 50 s, and the final temperature of the trap was 240°C. The initial column temperature was 50°C. The temperature was programmed to ramp up from 0.5°C/s to 90°C, followed by an increase of 4°C/s to 250°C, where it was held for 15 s. The acquisition time was 137 s, and the FID gain was set at 12. A mixture of n-alkanes (C6–C16) was used as the chemical reference.
2.4 Setup and conditions of E-tongue
The sensors (AAE, CT0, CA0, C00, AE1) and reference electrodes of the E-tongue (INSET Intelligent Sensor Technology, Inc. Taste Sensing System SA402B) were separately immersed in the reference solution (30 mmol/L potassium chloride and 0.3 mmol/L tartaric acid) and 3.33 mol/L potassium chloride solution for 24 h for activation. Calibration was performed using the reference solution, followed by the measurement of the umami, saltiness, sourness, bitterness, astringency, and richness of seven batches of samples at a room temperature of 25°C. After a brief rinse with the reference solution, sensors C00 and AE1 were used to determine residual tastes (bitter and astringent aftertaste). The data acquisition time was 30 s, with a total of 4 cycles collected. Due to significant fluctuations in the data from the first cycle, this cycle’s data was excluded from the analysis. Data from the second to fourth cycles were retained. Each batch was analyzed in triplicate, and the mean of triplicate measurements was adopted for subsequent analysis.
2.5 Conditions of LC-HR-Q-TOF-MS/MS
The chemical compositions of AH and CP were analyzed using an Agilent LC-6500 series Q-TOF liquid chromatography-mass spectrometry system. The separation column was an Agilent Phenyl-Hexyl column (4.6 × 50 mm, 3.5 μm). The mobile phase consisted of 0.1% formic acid in water (A) and acetonitrile (B). The flow rate was set at 0.5 mL/min. The injection volume was 1 μL. Gradient elution was performed as follows: 0–8 min, 5%–5% B; 8–20 min, 5%–20% B; 20–40 min, 20%–60% B; 40–45 min, 60%–95% B; 45–50 min, 95%–95% B. The Q-TOF-MS/MS system was used for analysis in positive or negative ion mode. The operational parameters were set as follows: drying gas temperature at 200°C, drying gas flow rate at 11 L/min, nebulizer gas pressure at 35 psi, sheath gas temperature at 350°C, sheath gas flow rate at 8 L/min, capillary voltage at 4,000 V, m/z range from 100 to 1,000, nozzle voltage at 1,000 V, fragmentation voltage at 120 V, and collision energy at 30 eV. Auto MS/MS was used for data acquisition. Compounds with available chemical reference standards could be accurately identified by comparing their retention times, molecular ions, and secondary fragment ions with those of the reference standards. For unknown compounds, a combined approach that utilized both self-built compound libraries and public compound databases was employed for structural elucidation. On one hand, a mass spectrometry database for AH and CP was compiled from relevant literature, encompassing chemical formulas, molecular ions, fragment ions, and other related parameters (Wang et al., 2023; Wen et al., 2014; Zhang et al., 2021; Mao et al., 2017; Gao et al., 2019; Chen et al., 2023; Hu et al., 2025; Yu et al., 2016). On the other hand, public databases such as PubChem, METLIN, ChemSpider, and mzCloud spectral library were used for the structural comparison of the compounds.
2.6 Setup and conditions of electrochemical fingerprint spectra
The Belousov-Zhabotinsky reaction was conducted in a continuously stirred reactor (85–2 type, Changzhou Yuexin Instrument Manufacturing Co., Ltd.). A graphite electrode was used as the reference electrode, and a platinum electrode was used as the indicator electrode. To the reactor, 0.4 g of sample powder, 24 mL of H2SO4 solution (3 mol/L), 12 mL of CH2(COOH)2 solution (1 mol/L), and 6 mL of (NH4)2SO4·Ce(SO4)2 solution (0.1 mol/L) were added. The temperature of the reaction system was controlled at 310 K. After stirring at a constant speed of 600 r/min for 5 min, 6 mL of KBrO3 solution (0.2 mol/L) was rapidly injected through a syringe to initiate the reaction. Immediately, the data acquisition program was started to record the electrochemical fingerprint spectrum until the oscillation of electric potential disappeared.
2.7 Statistical analysis
To analyze Q-TOF data, Agilent MassHunter was employed. The Heracles NEO E-nose was controlled via Alpha Soft, wherein principal component analysis (PCA) and discriminant factor analysis (DFA) were implemented for data processing. The AroChemBase database was used to identify volatile compounds and obtain sensory description. Origin 2021 was utilized to generate fingerprint spectra for E-nose, radar charts for E-tongue, and electrochemical fingerprint spectra for Belousov-Zhabotinsky reaction. GraphPad Prism 6 was applied to generate box plots. SIMCA was utilized to perform PCA and orthogonal partial least squares discriminant analysis (OPLS-DA).
3 Result and discussion
3.1 Technical route
AH and CP are commonly used but easily confused medicinal plants due to their highly similar appearance. Due to the presence of toxic ingredients in AH, the conventional methods of identification through smell and taste cannot be employed to differentiate AH from CP. To achieve this, a four-step technical route utilizing dual electronic sensors (DES) and dual fingerprint spectra (DFS) was proposed for the first time (Figure 1). Firstly, an E-nose was applied to capture characteristic gas information, with PCA and DFA adopted to distinguish them further. Secondly, an E-tongue was utilized to obtain characteristic tastes, with radar charts and box plots used to analyze their taste differences. The strategy of DES could overcome the shortcomings of the traditional methods of olfactory and gustatory identification which could not be used for the identification of toxic medicinal plants. Thirdly, LC-HR-Q-TOF-MS/MS was employed to analyze the differences in chemical compositions between AH and CP, yielding their chemical fingerprint spectra. Fourthly, the Belousov-Zhabotinsky reaction was utilized to acquire electrochemical fingerprint spectra, differentiating them from the perspective of electrochemical properties. By integrating E-nose, E-tongue, chemical fingerprint spectra, and electrochemical fingerprint spectra, a systematic and multi-angled differentiation between AH and CP was achieved.
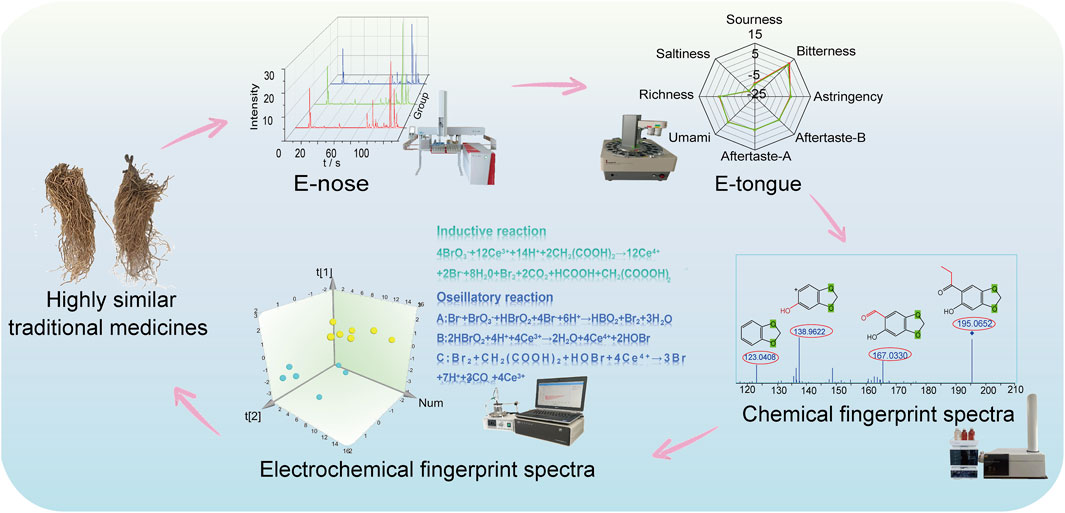
Figure 1. A four-step technical route for differentiation of AH and CP.
3.2 E-nose analysis
Using the Heracles NEO ultra-fast gas-phase E-nose, odor chromatograms for AH and CP were established on two types of chromatographic columns: MXT-5 and MXT-1701 (Figure 2). It was evident that each sample could be analyzed within 140 s, demonstrating remarkable efficiency. Through comparison with the Arochembase database, 25 odor components were identified in AH and 12 odor components in CP. Table 1 provides detailed information on the compounds and their odor descriptions. Five compounds, including camphene, tridecane, 2,2,4-trimethylpentane, limonene, and acetaldehyde, were found to be shared by AH and CP. These compounds were associated with a range of odor descriptions, such as freshly cut grass, fruity, aromatic, spicy, alkane-like, acidic, and petrol-like notes. The unique components in AH, such as pyridine, butylbutanoate, o-chlorotoluene, pentadecane, and butan-2-one, were primarily characterized by notes of freshly cut grass, alkane-like qualities, and spicy aromas. CP contained unique components like gamma-decalactone, hexane, (Z)-3-hexenal, alpha-ionone, and cymen-8-ol, which exhibited petrol-like, greasy, and sweet odors. While there were similarities in the odor descriptions of AH and CP, they also possessed distinct characteristics that set them apart.
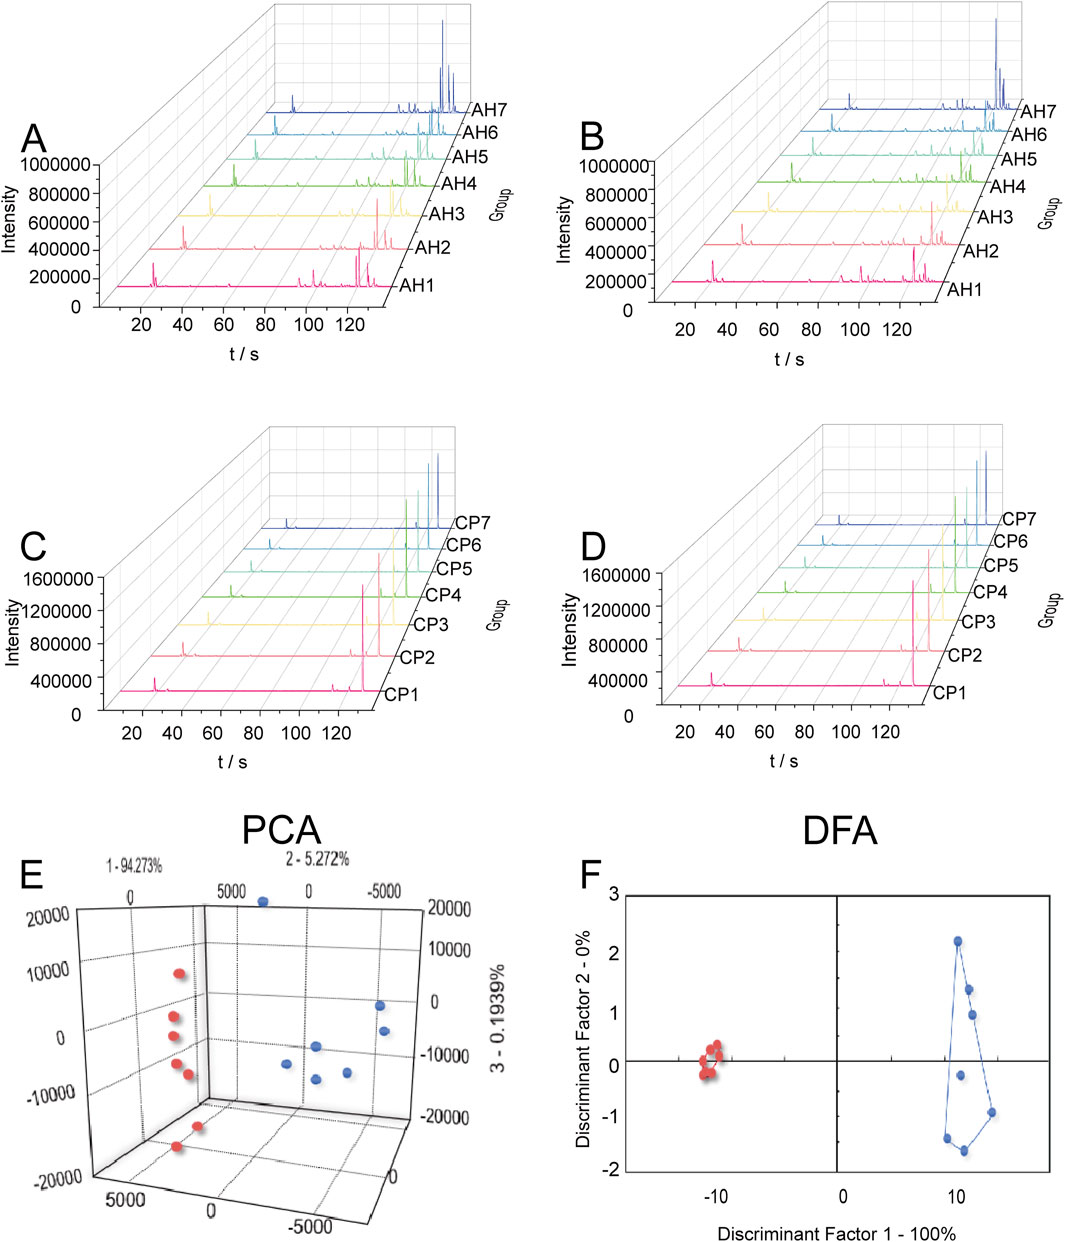
Figure 2. Odor chromatograms of AH on MXT-5 (A) and MXT-1701 (B). Odor chromatograms of CP on MXT-5 (C) and MXT-1701 (D). PCA (E) and DFA (F) for distinguishing between AH and CP based on E-nose.
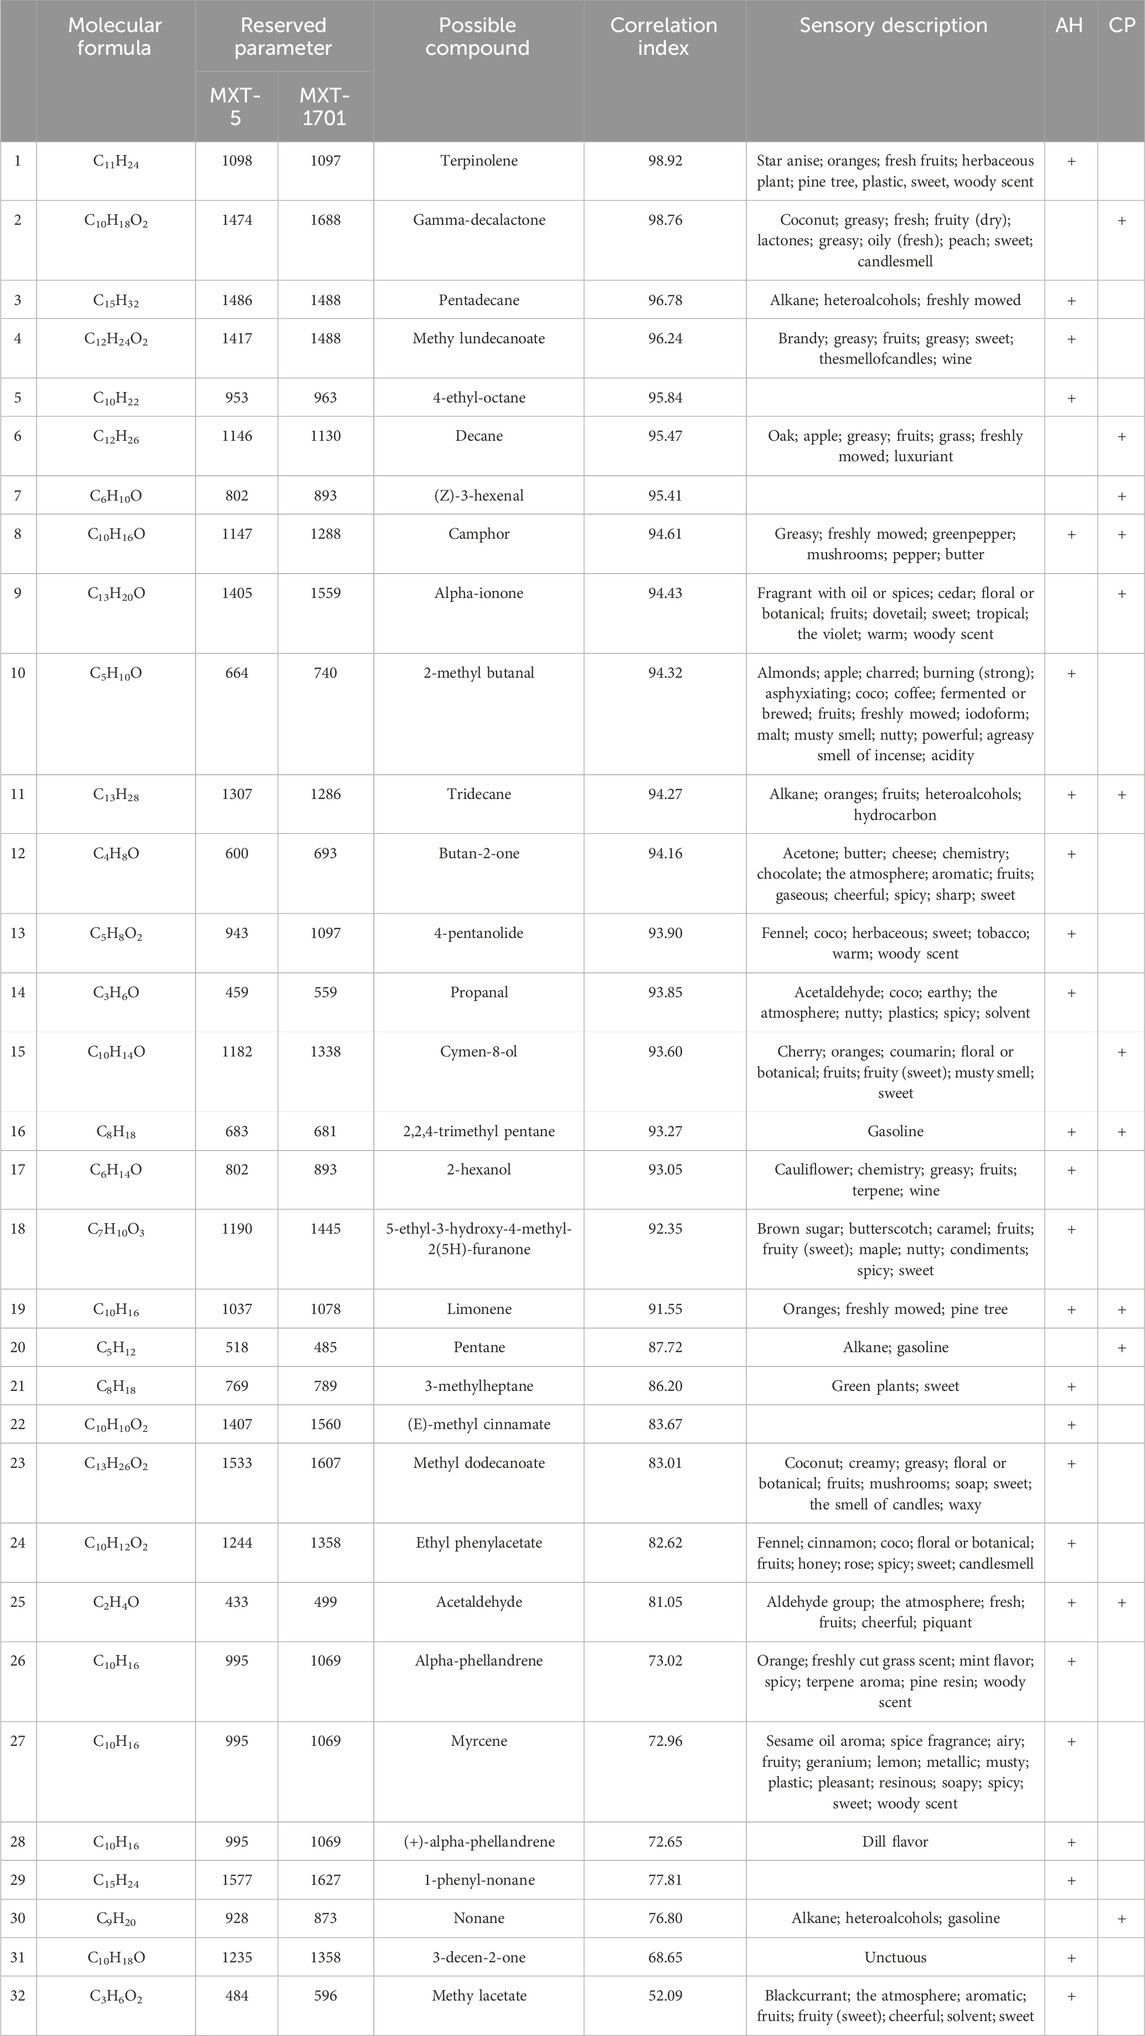
Table 1. Possible compounds and sensory descriptions of AH and CP.
To further distinguish AH from CP, the chromatographic peaks obtained by the E-nose were used as influencing factors for PCA (Figure 2E) and DFA (Figure 2F). In the PCA model, the first principal component (PC1) contributed 94.183%, while the second principal component (PC2) contributed 4.729%. The cumulative contribution rate of the principal components reached 98.912%, indicating that AH and CP could be well distinguished. In the DFA model, the horizontal and vertical coordinates represented the first discriminant factor (DF1) and the second discriminant factor (DF2), respectively. The DF1 in Figure 2F was 100%, suggesting that DFA could better distinguish AH and CP samples based on odor characteristics. The result demonstrated that the E-nose combined with DFA was effective to distinguish AH from CP from the perspective of odor. The efficiency of this method was demonstrated in two aspects. On the one hand, plant samples used for E-nose analysis did not require grinding and extraction, thus offering significant advantages in sample pretreatment. On the other hand, the single analysis time for each plant sample was 140 s, which significantly shortened the analysis time compared to traditional methods.
3.3 E-tongue analysis
The taste values of AH and CP samples were measured using an E-tongue, and radar charts were constructed based on the signals collected by the sensors (Figures 3A,B). While an initial observation suggested a similar overall shape in the radar charts, a closer analysis revealed significant differences (P < 0.05) between AH and CP in terms of bitterness, astringency, sourness, aftertaste-A, and richness, as shown in Figures 3C,D and Supplementary Figure S1. The taste response range of the E-tongue encompasses the following: sourness (−13 to 12), bitterness (0–25), astringency (0–25), and saltiness (−6–19). Importantly, only values falling within these ranges could reflect the corresponding taste. Notably, the bitterness and astringency of AH were significantly higher than those of CP, suggesting that these two tastes could serve as key discriminators between the two samples.
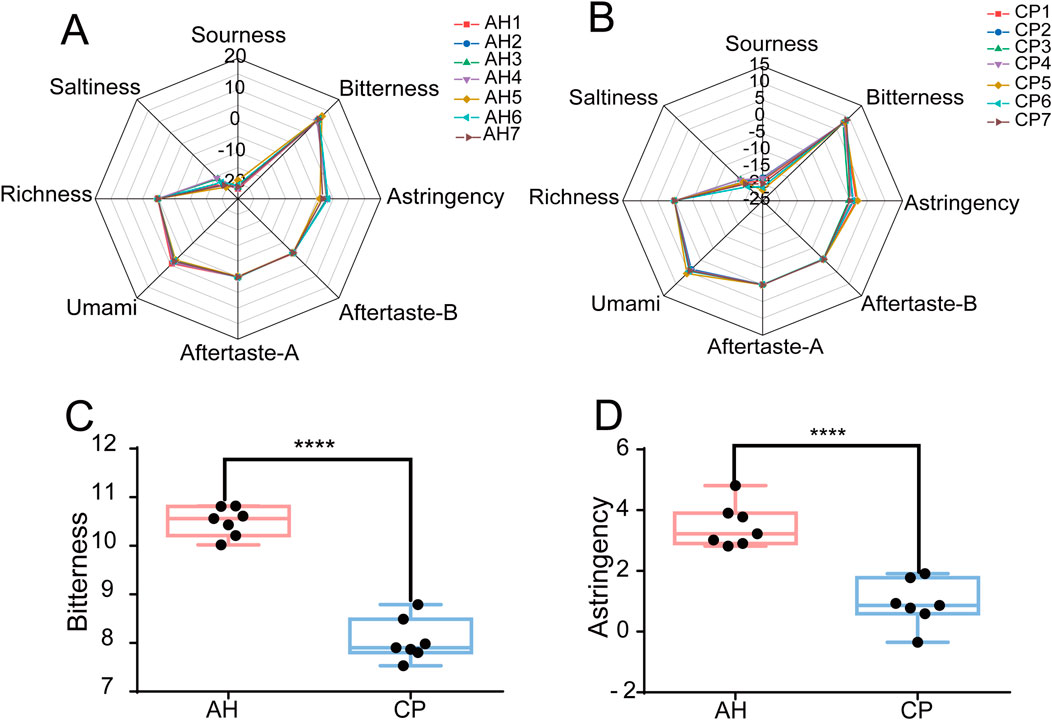
Figure 3. Electronic tastes of AH (A) and CP (B). Comparison of bitterness (C) and astringency (D) between AH and CP.
PCA and OPLS-DA were employed to further differentiate between AH and CP. As shown in Figures 4A,B, the samples of AH and CP could be clearly separated from each other. The PCA model achieved R2 and Q2 values of 0.869 and 0.607, respectively. Furthermore, the OPLS-DA model demonstrated R2X, R2Y, and Q2 values of 0.93, 0.936, and 0.895, respectively. These parameters confirm the reliability of the results. To further validate the credibility of the model, a permutation test was performed (Figure 4C). Ideally, the R2Y intercept and Q2Y intercept of a valid model should not have exceeded 0.4 and 0.05, respectively (Wang et al., 2024). In this case, the R2Y intercept and Q2Y intercept were 0.113 and −0.666 respectively, indicating the results were credible. A VIP value greater than 1 was considered a criterion for differential variables (Wang et al., 2024). As shown in Figure 4D, the VIP values for bitterness and astringency exceeded this threshold, which was consistent with the previous findings. Consequently, the results suggested that the E-tongue could effectively differentiate between AH and CP from the perspective of tastes. The necessity of employing E-tongue analysis was underscored by two aspects: (1) AH contained toxic components such as aristolochic acid-like ingredients, thus traditional taste-testing methods could lead to poisoning; (2) The taste of CP was unpleasant and nauseating, making taste-testing methods unsuitable as well.
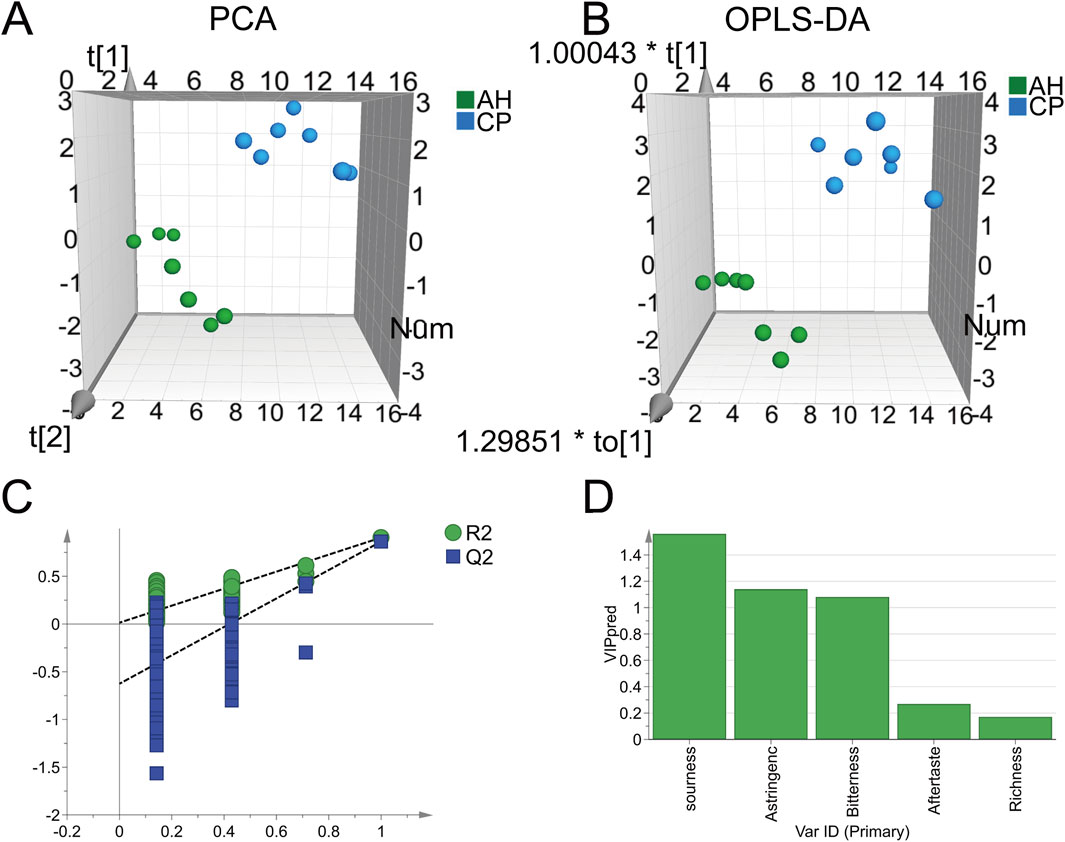
Figure 4. PCA (A) and OPLS-DA (B) of AH and CP based on electronic tastes. The permutation test (C) and VIP values (D) of OPLS-DA.
3.4 Chemical fingerprint spectra based on LC-HR-Q-TOF-MS/MS
3.4.1 Identification of chemical compositions
The chemical compositions of AH and CP were analyzed using LC-HR-Q-TOF-MS/MS. As a result, 91 compounds were identified in AH, comprising 32 nitrogen-containing compounds, 28 volatile oils, 11 organic acids, 6 coumarins, 5 flavonoids, 3 lignans, and 6 other compounds. Notably, ortho-hydroxyacetophenone, 4-hydroxyacetophenone, vanillic acid, and asarinin were confirmed by comparison with their respective chemical standards. The total ion chromatogram (TIC) of AH in positive ion mode is presented in Figure 5A, with detailed compound information listed in Table 2. For negative ion mode, the TIC and compound information are shown in Supplementary Figure S2 and Supplementary Table S1, respectively. Similarly, 90 compounds were identified from CP, including 22 steroidal compounds, 24 nitrogen-containing compounds, 14 volatile oils, 10 organic acids, 8 saccharides, 2 lignans, and 10 other compounds. Among these, paeonol was positively identified by comparison with its chemical standard. The TIC of CP extract in positive ion mode is depicted in Figure 5B, and the corresponding compound information is presented in Table 3. For negative ion mode, the TIC and compound information are shown in Supplementary Figure S3 and Supplementary Table S2, respectively. The discussion on the MS/MS fragmentation patterns of compounds in AH and CP is as follows.
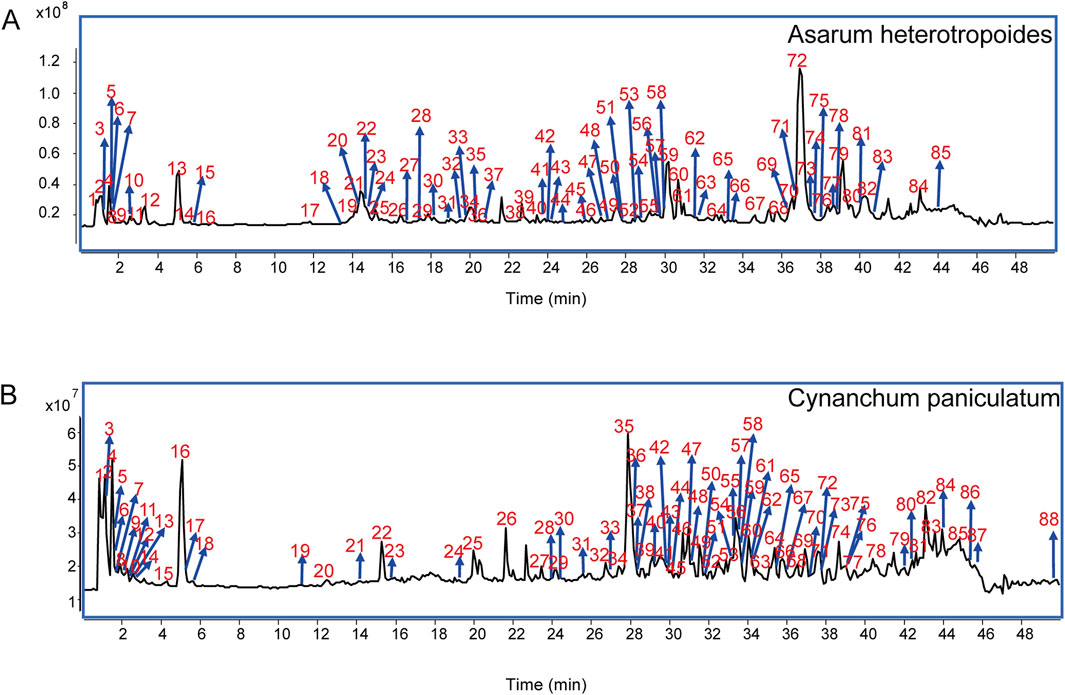
Figure 5. Total ion chromatograms of AH (A) and CP (B) in positive ion mode.
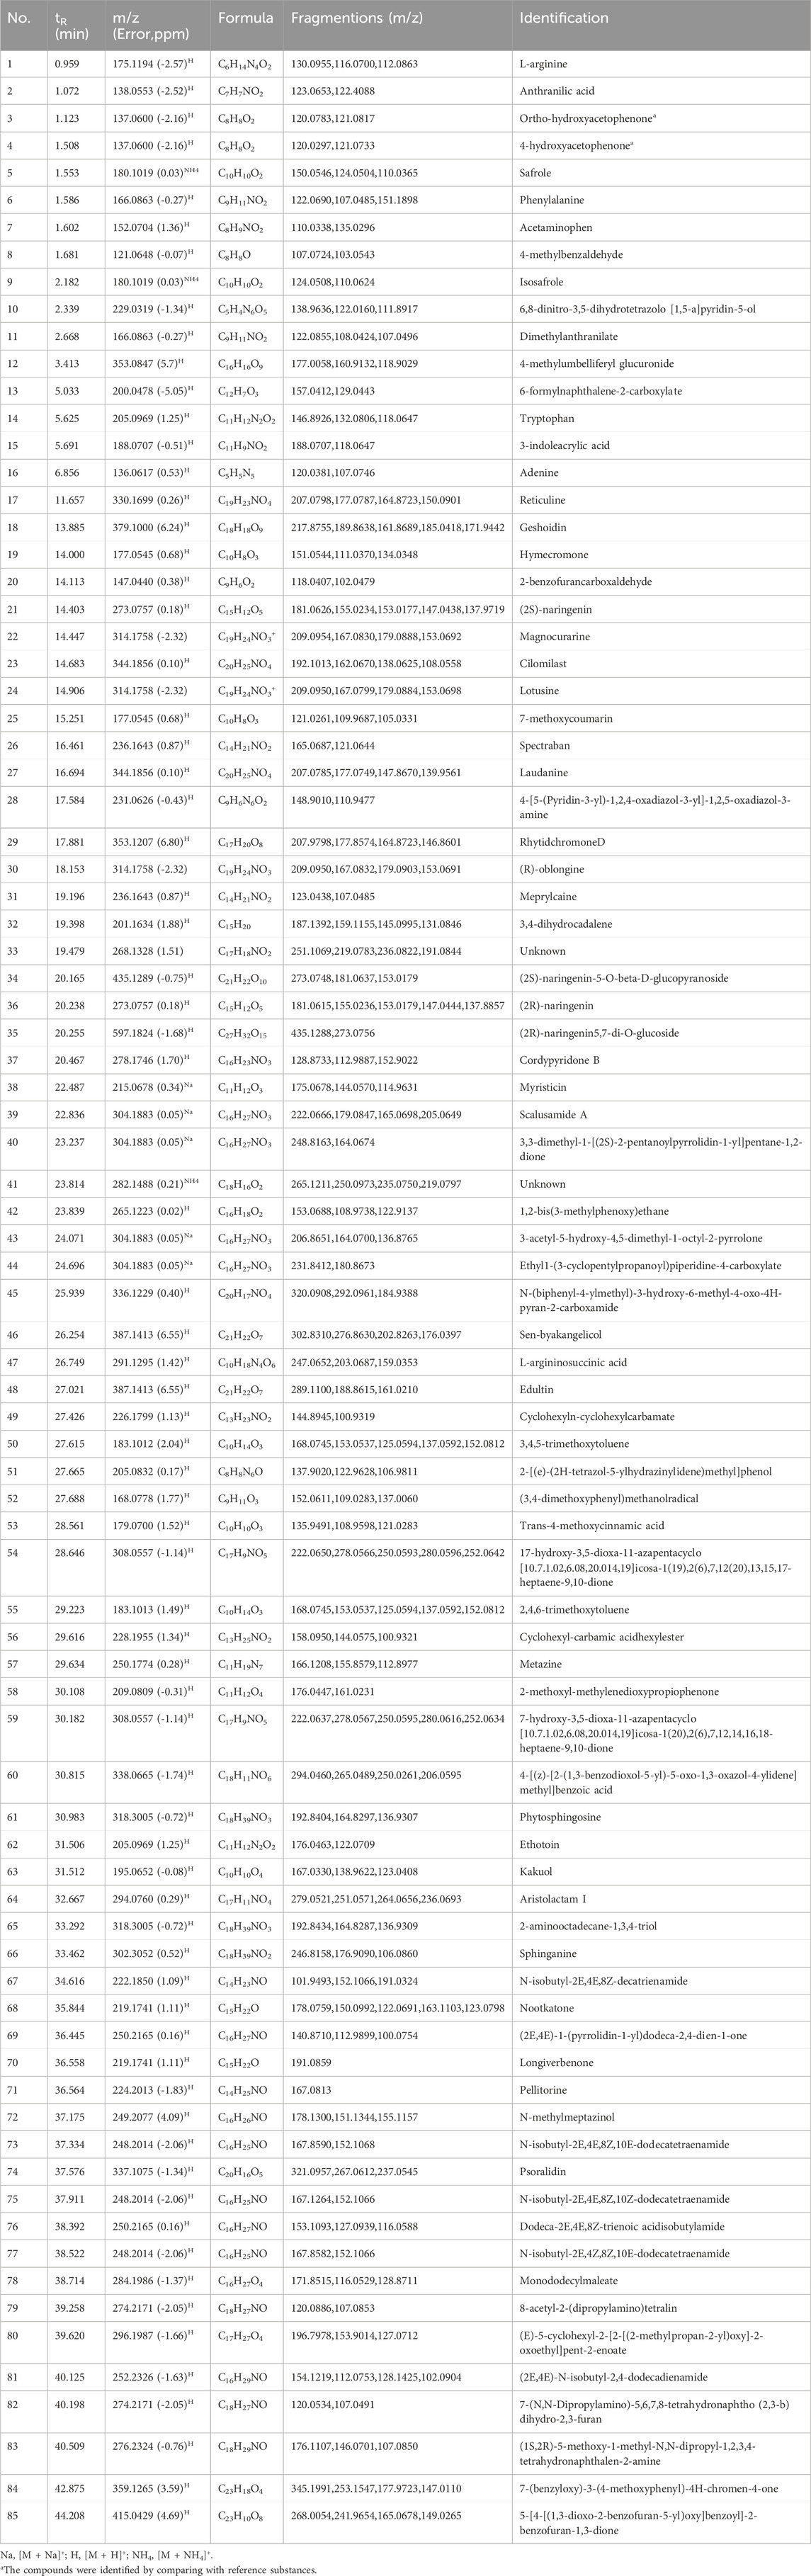
Table 2. Identification of compounds in AH by LC-HR-Q-TOF-MS/MS.
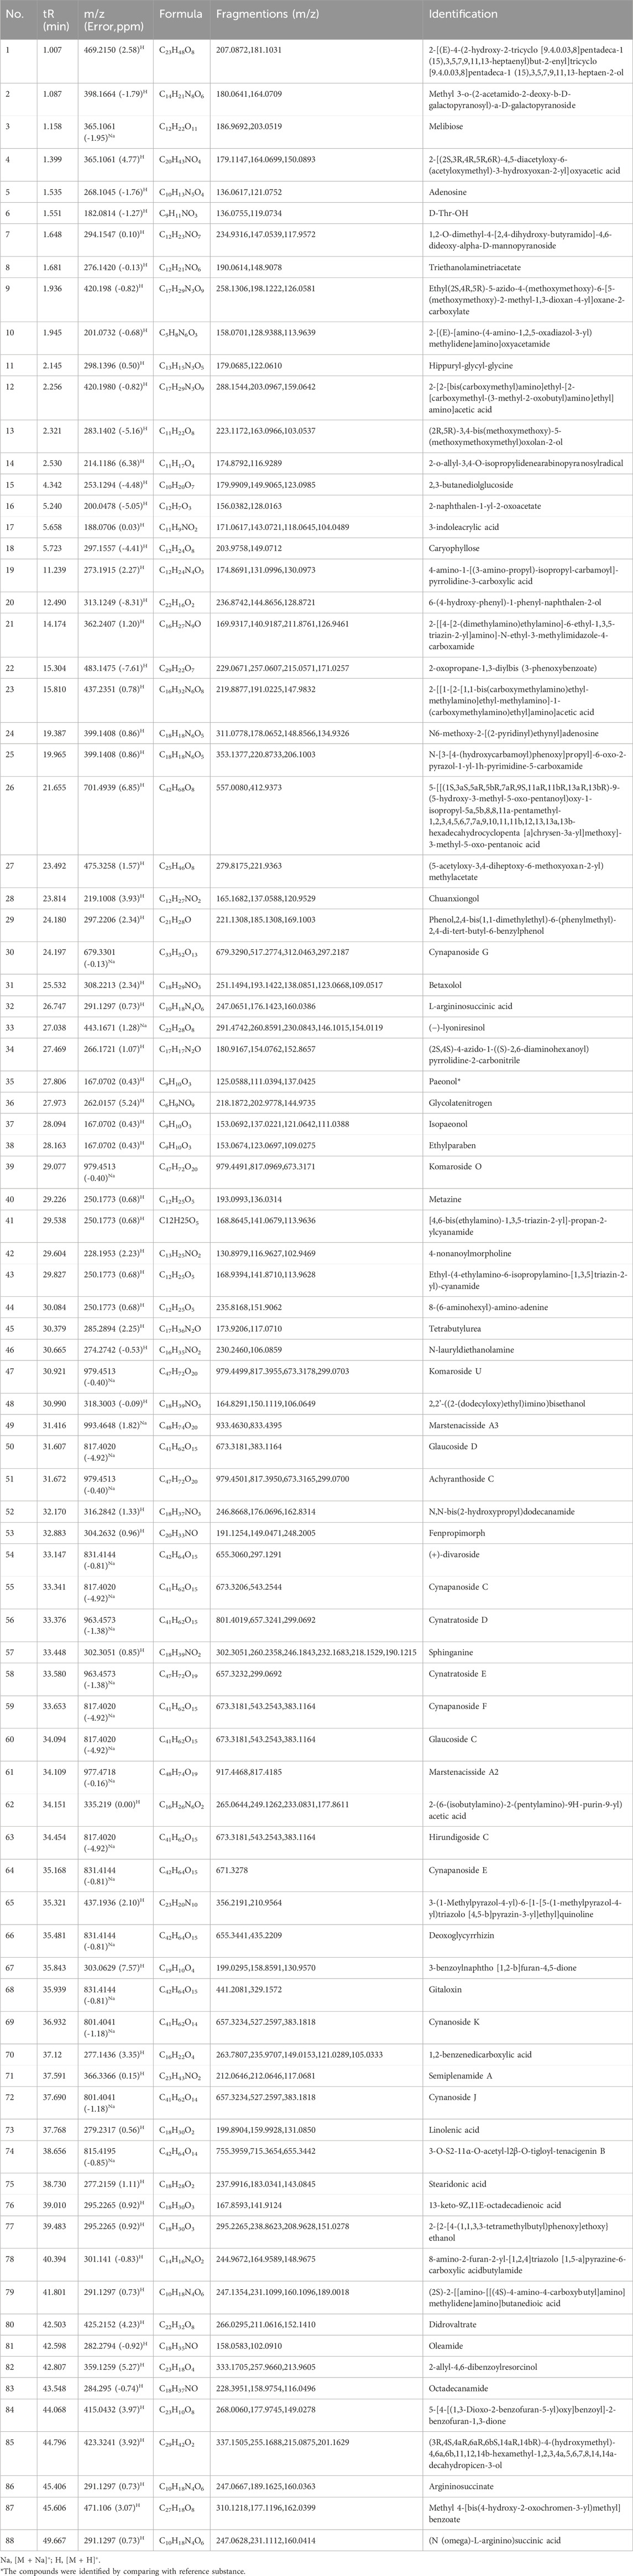
Table 3. Identification of compounds in CP by LC-HR-Q-TOF-MS/MS.
3.4.2 Fragmentation patterns of main compositions in AH
Safrole (Figure 6A) was taken as an example of volatile oils for illustration. The quasi-molecular ion at m/z 180 initially underwent methoxy group cleavage to eliminate a molecule of CH2O, generating an ion at m/z 150. This process might have involved the formation of an allylic carbocation intermediate. Subsequently, the ion at m/z 150 underwent rearrangement within the conjugated double bond system, eliminating C2H2 to yield an ion at m/z 124. Finally, this fragment underwent either cleavage of the aromatic ring side-chain CH2 group or exocyclic rearrangement to form the stable terminal product ion at m/z 110. This fragmentation pathway revealed the stepwise dissociation characteristics of the methoxy group, conjugated double bonds, and aromatic ring structure in the safrole molecule.
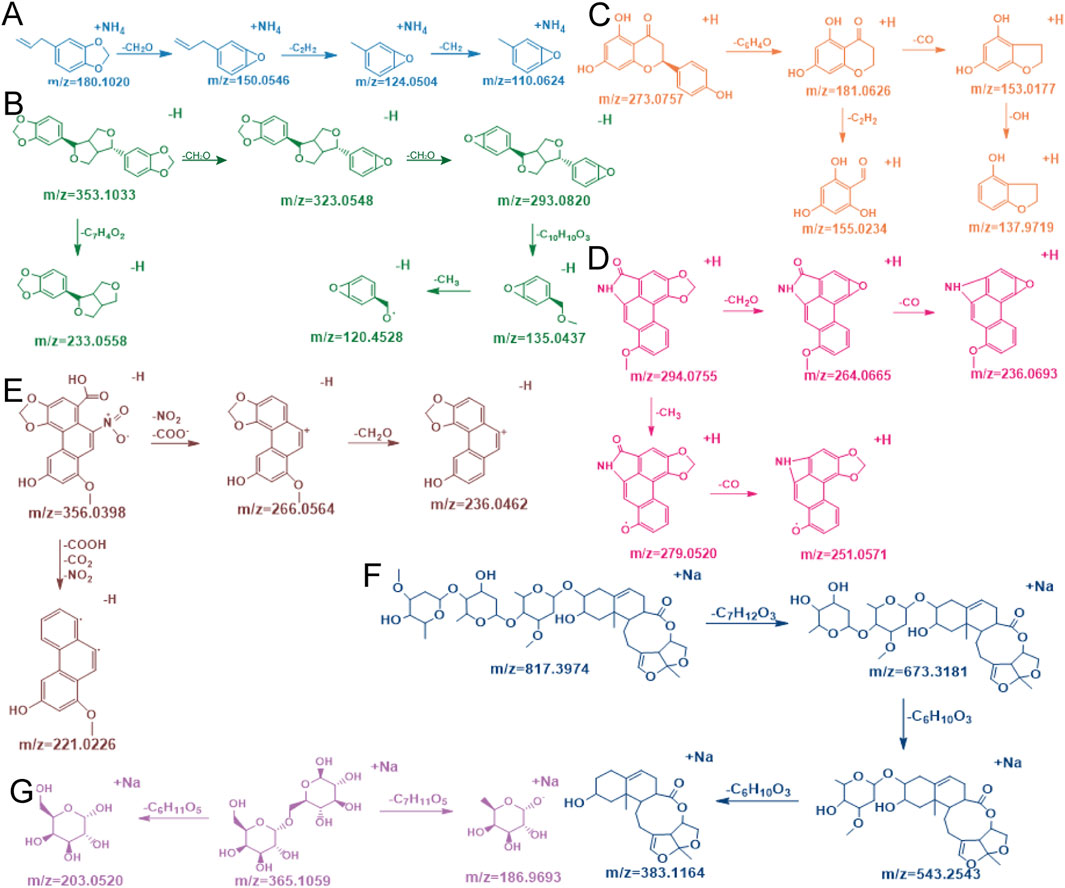
Figure 6. Compound cracking pathways for safrole (A) asarinin (B) (2S)-naringenin (C) aristolactam I (D) aristolochic acid (E) glaucoside C (F) and melibiose (G).
Asarinin (Figure 6B) was taken as an example of lignans for illustration. Initially, it started from its quasi-molecular ion at m/z 353 and lost a molecule of CH2O, generating an ion at m/z 323. It then lost another molecule of CH2O, forming an ion at m/z 293. Subsequently, the ion at m/z 293 lost a molecule of C10H6O2, producing an ion at m/z 135. Ultimately, the ion at m/z 135 underwent another fragmentation, resulting in the loss of a molecule of CH3 and yielding an ion at m/z 120. In addition, there was another fragmentation pathway that started from the quasi-molecular ion at m/z 353, where it lost a molecule of C7H4O2, generating an ion at m/z 233 (Hu et al., 2025).
(2S)-naringenin (Figure 6C) was taken as an example of flavonoids for illustration. It started from its quasi-molecular ion at m/z 273. By losing a molecule of C6H4O, this ion transformed into a fragment ion at m/z 181. Subsequently, this fragment ion further fragmented and lost a molecule of CO, generating an ion at m/z 153. Immediately thereafter, the ion at m/z 153 lost an OH group, forming an ion at m/z 137. Additionally, there was another fragmentation pathway that started from the fragment ion at m/z 181, where it directly lost a molecule of C2H2, producing an ion at m/z 155 (Wen et al., 2014).
Aristolactam I (Figure 6D) was taken as an example of amides for illustration. It started from its quasi-molecular ion at m/z 294. By losing a molecule of CH3, it generated an ion at m/z 279. Subsequently, it lost a molecule of CO, resulting in an ion at m/z 251. In addition, there was another fragmentation pathway that started from the quasi-molecular ion at m/z 294. In this pathway, the ion lost a molecule of CH2O, producing an ion at m/z 264. Finally, this ion at m/z 264 lost a molecule of CO, yielding an ion at m/z 236 (Mao et al., 2017).
Aristolochic acid (Figure 6E) was taken as an example of phenanthrenes for illustration. It began with the quasi-molecular ion at m/z 356. By losing a molecule of NO2 and a molecule of COO−, it generated an ion at m/z 266. Subsequently, this ion at m/z 266 further fragmented and lost a molecule of CH2O, forming an ion at m/z 236. Additionally, there was another fragmentation pathway that began with the quasi-molecular ion at m/z 356. In this pathway, the ion lost a molecule of COOH, a molecule of CO2, and a molecule of NO2, producing an ion at m/z 221 (Yu et al., 2016).
3.4.3 Fragmentation patterns of major types of compounds in CP
Glaucoside C (Figure 6F) was taken as an example of steroids for illustration. The initial quasi-molecular ion at m/z 817 underwent cleavage by losing a molecule of C7H12O3, generating an ion at m/z 673. This likely corresponded to the rupture of a glycosidic bond or an ester bond in the molecule, resulting in the detachment of a saccharide or ester group containing 7 carbon atoms, 12 hydrogen atoms, and 3 oxygen atoms. Subsequently, the ion at m/z 673 underwent further fragmentation by eliminating a molecule of C6H10O3, producing an ion at m/z 543. This step might similarly have involved the cleavage of another saccharide unit or related functional group. Following this, the ion at m/z 543 underwent additional fragmentation through the loss of another C6H10O3 molecule, yielding a terminal ion at m/z 383. The fragments lost at each step were structural glycosyl units, and these fragmentation processes gradually revealed the structural information of the molecule.
Melibiose (Figure 6G) was taken as an example of saccharides for illustration. The quasi-molecular ion at m/z 365 underwent cleavage at the α-1,6-glycosidic bond, primarily through two distinct fragmentation pathways. In the first pathway, glycosidic bond cleavage was accompanied by elimination of a hexose unit (C6H11O6), resulting in a dehydrated monosaccharide fragment at m/z 185. In the second pathway, direct elimination of the C6H11O6 moiety occurred without hydroxyl group removal, yielding a hydroxyl-retained monosaccharide fragment at m/z 202. These observations suggested that heterolytic cleavage of hydrogen bonds played a critical role in differentiating the fragmentation pathways. Additionally, the intermediate ion observed at m/z 349 (formed via deoxygenation) indicated the loss of a hydroxyl oxygen atom from the sugar ring, generating an unsaturated structure. This structural rearrangement likely facilitated fragmentation pathway branching through intracyclic double bond reorganization.
3.4.4 Component comparison of AH and CP
By comparing the chemical compositions of AH and CP, we could observe significant differences as well as shared components between them. AH primarily comprised nitrogenous compounds, volatile oils, organic acids, coumarins, flavonoids, and lignans. Notably, AH contained unique coumarins and flavonoids that were rare in CP, which exhibited a broad spectrum of pharmacological activities. For example, 7-methoxycoumarin ameliorated hepatotoxicity in rats induced by carbon tetrachloride and spatial memory impairment in ovariectomized Wistar rats induced by scopolamine (Sancheti et al., 2013; Zingue et al., 2018). Naringenin alleviated non-alcoholic fatty liver disease by suppressing the NLRP3/NF-κB pathway and prevented cardiomyopathy through targeting HIF-1α in mice (Wang et al., 2020; Pan et al., 2024). Furthermore, some components in AH exhibited potent toxicity, including aristolactam I, aristolochic acid D, and safrole. Studies demonstrated that aristolactam I accumulated extensively in renal cells and induced nephrotoxicity (Au et al., 2023), while aristolochic acid D triggered lymphocyte infiltration and renal fibroproliferation (Xian et al., 2021). Additionally, safrole exerted hepatotoxicity through the cytochrome P450 enzyme CYP1A2 (Hu et al., 2019). In contrast, the chemical composition of CP mainly included steroidal compounds, nitrogenous compounds, volatile oils, organic acids, saccharides, and lignans. Among them, CP contained unique steroidal compounds and saccharides that were absent in AH, exemplified by glaucoside C and melibiose. Glaucoside C alleviated atopic dermatitis by inhibiting the mitogen-activated protein kinase (Fleitas et al., 2022), while melibiose ameliorated cerebral ischemia/reperfusion injury through regulating autophagic flux (Wu et al., 2021). Despite the chemical differences between AH and CP, they shared common components, such as L-argininosuccinic acid and sphinganine. The results indicated that LC-HR-Q-TOF-MS/MS could differentiate AH and CP from the perspective of chemical compositions.
3.5 Electrochemical fingerprint spectra based on Belousov-Zhabotinsky reaction
Although LC-HR-Q-TOF-MS/MS was utilized for analyzing the components of medicinal plants, it also had limitations. On the one hand, it was impossible to identify all the components in medicinal plants. On the other hand, complex data analysis required a considerable amount of time. Therefore, it was necessary to establish a simpler method from the perspective of holistic chemistry, namely, electrochemical fingerprint spectra based on the Belousov-Zhabotinsky reaction. The principle, influencing factors, and model accuracy of this method were as follows.
3.5.1 Principle of electrochemical reactions
Electrochemical fingerprint spectra, as a part of nonlinear chemistry, was capable of characterizing the overall chemical properties of medicinal plants. It arose from oscillations in autocatalytic reactions, revealing fluctuations in the concentrations of certain substances. The principle of this reaction encompassed the consumption of bromide ions (Br−), the oxidation of cerium ions (Ce3+), and the regeneration of bromide ions (Br−). The cycle of bromide ion consumption and regeneration drove the oscillatory system (Wang et al., 2024). The whole components in medicinal plants influenced these reactions, offering novel representations of their chemical properties. For instance, the distinct redox-active components in AH and CP (e.g., ortho-hydroxyacetophenone and paeonol) could influence the oxidation process of Ce3+. To ensure the integrity of the phytochemical components, the plant powder was directly involved in the reaction without prior extraction.
3.5.2 Factors influencing Belousov-Zhabotinsky reaction
The effects of sample mass, rotation speed, and temperature on the Belousov-Zhabotinsky oscillation reaction were investigated. In Figure 7A, the electrochemical fingerprint spectra of AH powder with varying masses (0.2g, 0.3g, 0.4g, 0.5g, 0.6g) are presented. The characteristic parameters of these spectra were summarized in Supplementary Table S3. Notably, as the mass of the AH powder increased, a discernible trend emerged: the oscillation time gradually decreased, accompanied by a reduction in amplitude. The electrochemical fingerprint spectra of AH powder at stirring speeds ranging from 200 to 1200 r/min (in increments of 200 r/min) are shown in Figure 7B. The characteristic parameters of these spectra were summarized in Supplementary Table S4. As the stirring speed increased, the oscillation time shortened progressively, while the amplitude decreased correspondingly. In Figure 7C, the electrochemical fingerprint spectra of AH at experimental temperatures ranging from 302 to 318 K (in increments of 4 K) were illustrated. The characteristic parameters of these spectra are listed in Supplementary Table S5. As the experimental temperature increased, the oscillation time shortened progressively, while the amplitude decreased correspondingly. It could be seen that the AH powder caused regular changes in the Belousov-Zhabotinsky oscillation reaction. The rotation speed and temperature had a significant influence on this reaction, which should be strictly controlled during the experiment.
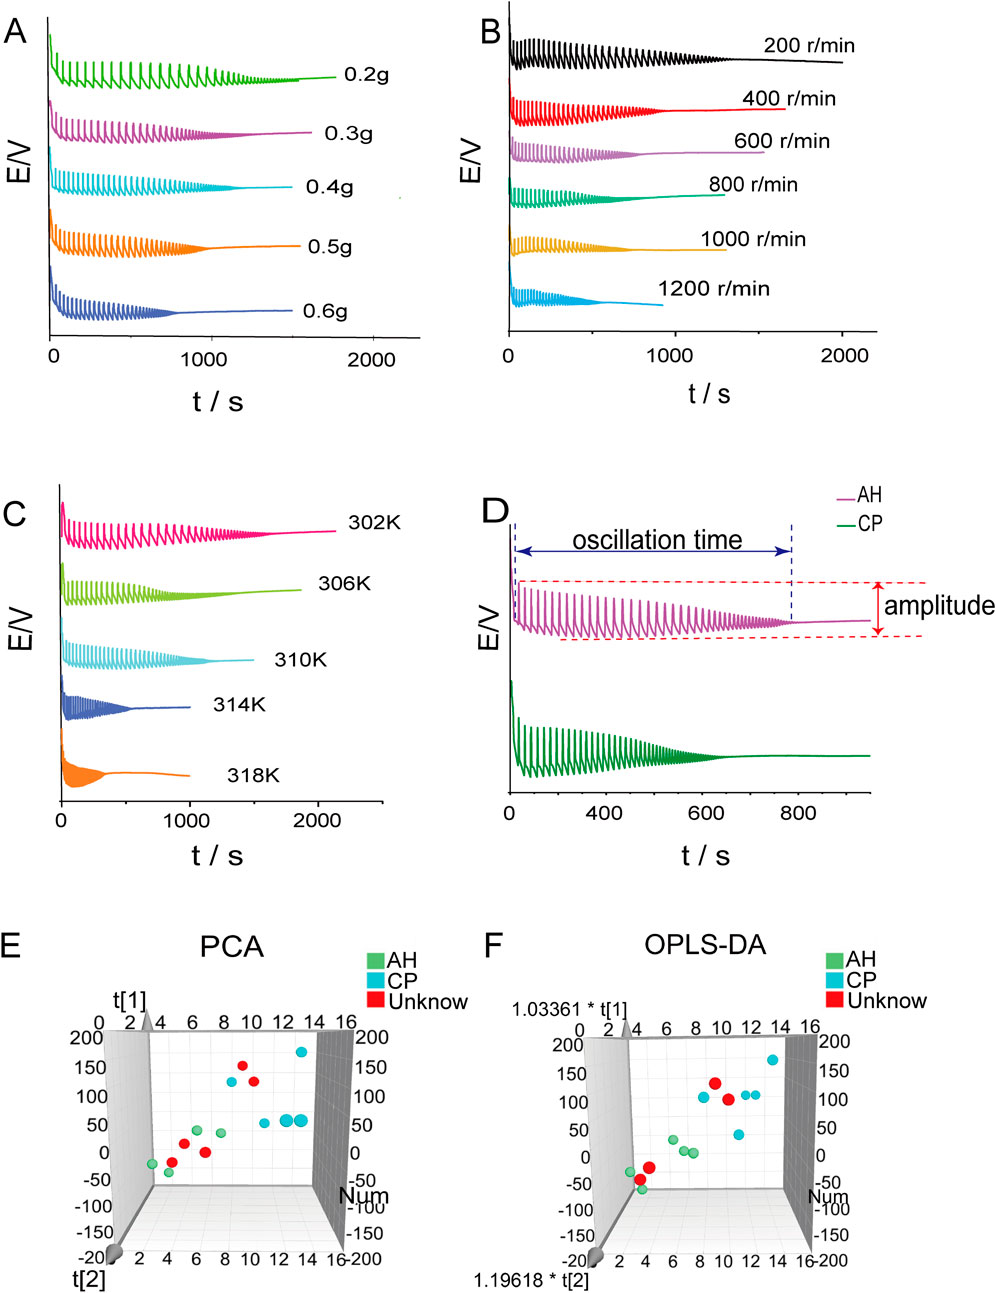
Figure 7. The effects of sample mass (A) rotation speed (B) and temperature (C) on the Belousov-Zhabotinsky oscillation reaction. Electrochemical fingerprint spectra of AH and CP under the same condition (D). Principal component analysis (E) and orthogonal partial least squares discriminant analysis (F) of AH and CP.
3.5.3 Electrochemical fingerprint spectra of AH and CP
The comparison between the electrochemical fingerprint spectra of AH and CP is illustrated in Figure 7D. It could be observed that the oscillation time of AH was significantly longer than that of CP, whereas the maximum amplitude of CP was notably larger than that of AH. To further differentiate the two medicinal plants, the PCA method was employed. The scatter plot is presented in Figure 7E, which shows the separation of AH and CP. The R2X and Q2 values of this model, at 0.687 and 0.591 respectively, indicated the reliability of the model. Furthermore, the OPLS-DA method was utilized to differentiate between these two medicinal plants (Figure 7F). The result was consistent with that obtained from PCA. The R2X, R2Y, and Q2 values of this model, standing at 0.568, 0.924, and 0.751 respectively, demonstrated the reliability of the outcomes. To assess the accuracy of the model, four unknown samples were analyzed, including two distinct AH samples and two distinct CP samples that had each been independently prepared. The results showed that the unknown samples could be accurately classified into their designated areas, demonstrating a 100% accuracy rate. Compared to LC-HR-Q-TOF-MS/MS, electrochemical fingerprint spectra exhibited the following significant advantages: (1) it allowed for direct analysis of plant powder without extraction, thus simplifying the operation; (2) the analysis time was short, and the data processing was simple. Therefore, it can be concluded that electrochemical fingerprint spectra can be effectively utilized to distinguish between AH and CP.
3.6 Integrated analysis of data and methods
AH and CP had very similar appearances, and they were often confused in the market. Given that AH contained toxic ingredients, and both AH and CP had irritating odors and tastes, traditional sensory identification methods, such as nose-sniffing and mouth-tasting, could not accurately distinguish between them. Furthermore, these methods might cause discomfort to the human body. Therefore, we used E-nose and E-tongue to distinguish between the two poisonous and medicinal plants. The E-nose provided the shortest analysis time among all technologies, enabling it to rapidly complete sample testing within 140 s. More importantly, it did not require extraction of samples and the plants could be directly used for analysis, greatly simplifying the operation process. In the PCA and DFA models, the reliability of the E-nose reached 98.912% and 100%, respectively, fully demonstrating its accuracy. The E-nose further disclosed that both AH and CP contained unpleasant ingredients. Specifically, AH included terpinolene, alpha-phellandrene, and camphor, which imparted flavors of anise, plastic, spiciness, and pepper. These ingredients might induce headaches and discomfort. On the other hand, CP contained camphor with a distinct, stimulating peppery taste that could also cause discomfort. At the same time, the E-tongue also revealed that the tastes of components in these two plants were bitter and astringent. In the PCA model, the R2 and Q2 values of the E-tongue were 0.869 and 0.607, respectively, indicating that the model had good predictive ability and stability. The R2X, R2Y, and Q2 values of the OPLS-DA model were 0.93, 0.936, and 0.895, respectively, further confirming the reliability of the results. Through LC-Q-TOF MS, we found that the bitter and astringent components in AH might be asarinin, N-isobutyl-2E,4E,8Z,10E-dodecatetraenamide, etc., while the bitter and astringent components in CP might be paeonol, etc. Due to the different components of AH and CP, their effects on the Belousov-Zhabotinsky reaction were also different. Based on the electrochemical fingerprint of the reaction, we achieved 100% accurate differentiation between AH and CP. By integrating data from E-nose, E-tongue, LC-HR-Q-TOF-MS/MS, and electrochemical fingerprint spectra, this study provided a diverse perspective based on odor, taste, and chemical composition, thereby providing powerful technical support for accurately distinguishing between AH and CP. It should be noted that the current study focused specifically on AH samples from Anguo City and CP samples from Lu’an City, which represented the mainstream sources of these medicinal plants in the Chinese herbal market. This study was based on a market survey revealing an adulteration practice in which AH (Anguo City) was adulterated with CP (Lu’an City) for illicit profit. Given that the quality of medicinal plants is influenced by geographical origins, growth stages, and plant parts, the impacts of these factors on the current methodology require further systematic and in-depth investigation.
In the field of medicinal plant identification, current techniques such as microscopic identification, DNA barcoding, and near-infrared spectroscopy exhibited distinct characteristics and inherent limitations when applied individually. Microscopic identification enabled rapid and cost-effective differentiation, but some microscopic characteristics lacked sufficient specificity to support accurate identification (Xu et al., 2015). Although DNA barcoding provided specific genetic information, it suffered from low resolution in distinguishing closely related species (Zhu et al., 2022). Near-infrared spectroscopy required minimal sample preparation, but its accuracy was susceptible to interference from factors such as moisture content and particle size (Yin et al., 2019). These limitations highlighted the inadequacy of a single method to address the complex demands of medicinal plant identification. In this study, E-nose, E-tongue, LC-HR-Q-TOF-MS/MS, and electrochemical fingerprint spectra were combined to distinguish the visually similar plants AH and CP. Actually, each method possessed distinct strengths and limitations. E-nose analysis required no sample extraction and could be completed within 3 minutes. However, its detectable targets were restricted to volatile compounds. E-tongue could substitute for human sensory evaluation in detecting the taste of toxic plants, but it was unable to distinguish specific taste components. LC-HR-Q-TOF-MS/MS could resolve chemical components, but data processing required a considerable amount of time. Electrochemical fingerprint spectra offered simple data processing with high accuracy. However, it could only reflect the plant’s electrochemical properties from a holistic perspective. Therefore, through complementary integration of these technologies, the limitations of individual methods were mitigated, and their strengths synergistically enhanced.
4 Conclusion
A novel strategy, incorporating dual electronic sensors (DES) and dual fingerprint spectra (DFS), was proposed for the authentication and differentiation of the highly similar poisonous and medicinal plants, AH and CP. The E-nose was utilized to identify 25 odor components in AH and 12 in CP within 140 s, effectively distinguishing the aroma profiles of the two plants. The E-tongue, combined with chemometrics, revealed that bitterness and astringency were the key differentiating tastes. Through the use of LC-HR-Q-TOF-MS/MS for chemical fingerprint spectra, 91 compounds in AH and 90 compounds in CP were identified. To further differentiate AH and CP, electrochemical fingerprint spectra based on the Belousov-Zhabotinsky reaction were established, achieving a 100% accuracy rate. In summary, this study represented the first instance of integrating E-nose, E-tongue, LC-HR-Q-TOF-MS/MS, and Belousov-Zhabotinsky reaction for the authentication and differentiation of highly similar poisonous and medicinal plants.
Data availability statement
The original contributions presented in the study are included in the article/Supplementary Material, further inquiries can be directed to the corresponding authors.
Ethics statement
Written informed consent was obtained from the individual(s) for the publication of any potentially identifiable images or data included in this article.
Author contributions
X-RZ: Methodology, Software, Writing – original draft, Writing – review and editing. Y-HC: Funding acquisition, Methodology, Supervision, Writing – original draft. J-NZ: Validation, Writing – review and editing. W-YW: Formal Analysis, Writing – review and editing. R-BS: Validation, Writing – review and editing. Z-XD: Writing – review and editing, Software. HZ: Writing – review and editing, Funding acquisition, Methodology. MX: Supervision, Writing – review and editing. T-GK: Writing – review and editing, Supervision. H-PS: Conceptualization, Supervision, Funding acquisition, Investigation, Writing – original draft.
Funding
The author(s) declare that financial support was received for the research and/or publication of this article. This study was supported by National Natural Science Foundation of China (82173935), Liaoning Natural Science Foundation (2024-MSLH-297), Shenyang Youth Science and Technology Innovation Talent Cultivation Project - U35 Top Youth Project (RC230846), Liaoning Provincial Education Department project (JYTMS20231826 and JYTQN2023455), and Youth Scientific and Technological Innovation Team Project (2024-JYTCB-080).
Conflict of interest
The authors declare that the research was conducted in the absence of any commercial or financial relationships that could be construed as a potential conflict of interest.
Generative AI statement
The author(s) declare that no Generative AI was used in the creation of this manuscript.
Publisher’s note
All claims expressed in this article are solely those of the authors and do not necessarily represent those of their affiliated organizations, or those of the publisher, the editors and the reviewers. Any product that may be evaluated in this article, or claim that may be made by its manufacturer, is not guaranteed or endorsed by the publisher.
Supplementary material
The Supplementary Material for this article can be found online at: https://www.frontiersin.org/articles/10.3389/fchem.2025.1578126/full#supplementary-material
References
Au, C.-K., Ham, Y.-H., and Chan, W. (2023). Bioaccumulation and DNA adduct formation of aristolactam I: unmasking a toxicological mechanism in the pathophysiology of aristolochic acid nephropathy. Chem. Res. Toxicol. 36 (2), 322–329. doi:10.1021/acs.chemrestox.2c00415
Bao, M., Bu, Q., Pan, M., Xu, R., Chen, Y., Yang, Y., et al. (2024). Coptidis rhizoma extract alleviates oropharyngeal candidiasis by gC1qR-EGFR/ERK/c-fos axis-induced endocytosis of oral epithelial cells. J. Ethnopharmacol. 331, 118305. doi:10.1016/j.jep.2024.118305
Batsukh, Z., Toume, K., Javzan, B., Kazuma, K., Cai, S., Hayashi, S., et al. (2020). Metabolomic profiling of Saposhnikoviae Radix from Mongolia by LC-IT-TOF-MS/MS and multivariate statistical analysis. J. Nat. Med. 74 (1), 170–188. doi:10.1007/s11418-019-01361-0
Chen, Y., Bi, J., Xie, M., Zhang, H., Shi, Z., Guo, H., et al. (2021). Classification-based strategies to simplify complex traditional Chinese medicine (TCM) researches through liquid chromatography-mass spectrometry in the last decade (2011–2020): theory, technical route and difficulty. J. Chromatogr. A 1651, 462307. doi:10.1016/j.chroma.2021.462307
Chen, Y., Li, S., Wang, D., Yuan, W., Xu, K., Wang, J., et al. (2023). Combinatorics-based chemical characterization and bioactivity comparison of different parts of traditional Chinese medicinal plants through LC-Q-TOF-MS/MS, multivariate statistical analysis and bioassay: Marsdenia tenacissima as an example. J. Chromatogr. B 1228, 123850. doi:10.1016/j.jchromb.2023.123850
Fleitas, M. M. D., Kim, S. S., Kim, N. K., and Seo, S. R. (2022). Cynanoside F controls skin inflammation by suppressing mitogen-activated protein kinase activation. Antioxidants 11 (9), 1740. doi:10.3390/antiox11091740
Gao, M., Jia, X., Huang, X., Wang, W., Yao, G., Chang, Y., et al. (2019). Correlation between quality and geographical origins of Cortex Periplocae, based on the qualitative and quantitative determination of chemical markers combined with chemical pattern recognition. Molecules 24 (19), 3621. doi:10.3390/molecules24193621
Hu, L., Wu, F., He, J., Zhong, L., Song, Y., and Shao, H. (2019). Cytotoxicity of safrole in HepaRG cells: studies on the role of CYP1A2-mediated ortho-quinone metabolic activation. Xenobiotica 49 (12), 1504–1515. doi:10.1080/00498254.2019.1590882
Hu, Y., Zhang, J., Yang, H., Liu, C., Li, Y., Bi, Q., et al. (2025). Chemical profiling and comparative analysis of different parts of Asarum heterotropoides using SPME-GC-QTOF-MS and LC-Orbitrap-MS. J. Pharm. Biomed. Anal. 252, 116502. doi:10.1016/j.jpba.2024.116502
Lan, L., Yang, T., Fan, J., Sun, G., and Zhang, H. (2023). Anti-inflammation activity of Zhizi Jinhua Pills and overall quality consistency evaluation based on integrated HPLC, DSC and electrochemistry fingerprints. J. Ethnopharmacol. 311, 116442. doi:10.1016/j.jep.2023.116442
Lei, K., Yuan, M., Li, S., Zhou, Q., Li, M., Zeng, D., et al. (2023). Performance evaluation of E-nose and E-tongue combined with machine learning for qualitative and quantitative assessment of bear bile powder. Anal. Bioanal. Chem. 415, 3503–3513. doi:10.1007/s00216-023-04740-5
Liang, C., Yao, Y., Ding, H., Li, X., Li, Y., and Cai, T. (2022). Rapid classification and identification of chemical components of Astragali radix by UPLC-Q-TOF-MS. Phytochem. Anal. 33 (6), 943–960. doi:10.1002/pca.3150
Liu, X., and Yan, Z. (2023). Identification of geographical origins of Astragalus membranaceus in China using electrochemical fingerprinting. Int. J. Electrochem. Sci. 18, 100183. doi:10.1016/j.ijoes.2023.100183
Lu, J., Jiang, Z., Dang, J., Li, D., Yu, D., Qu, C., et al. (2024). GC-MS combined with fast GC E-nose for the analysis of volatile components of chamomile (Matricaria chamomilla L.). Foods 13 (12), 1865. doi:10.3390/foods13121865
Mao, W., Gao, W., Liang, Z., Li, P., Zhao, Z., and Li, H. (2017). Characterization and quantitation of aristolochic acid analogs in different parts of Aristolochiae Fructus, using UHPLC-Q/TOF-MS and UHPLC-QqQ-MS. Chin. J. Nat. Med. 15 (5), 392–400. doi:10.1016/S1875-5364(17)30060-2
Mei, Y., Wei, L., Tan, M., Wang, C., Zou, L., Chen, J., et al. (2021). Qualitative and quantitative analysis of the major constituents in Spatholobi Caulis by UFLC-Triple TOF-MS/MS and UFLC-QTRAP-MS/MS. J. Pharm. Biomed. Anal. 194, 113803. doi:10.1016/j.jpba.2020.113803
Pan, J., Meng, L., Li, R., Wang, Z., Yuan, W., Li, Y., et al. (2024). Naringenin protects against septic cardiomyopathy in mice by targeting HIF-1α. Biochem. Biophys. Res. Commun. 704, 149613. doi:10.1016/j.bbrc.2024.149613
Sancheti, S., Sancheti, S., and Seo, S.-Y. (2013). Ameliorative effects of 7-methylcoumarin and 7-methoxycoumarin against CCl4-induced hepatotoxicity in rats. Drug Chem. Toxicol. 36 (1), 42–47. doi:10.3109/01480545.2011.648329
Tarighat, M. A., Abdi, G., Tarighat, F. A., and Bayatiyani, K. S. (2023). Authentication and identification of Lamiaceae family with cyclic voltammetry fingerprint-PCA-LDA and determination of the used phenolic contents for classification using chromatographic analyses. Talanta 265, 124894. doi:10.1016/j.talanta.2023.124894
Tibaduiza, D., Anaya, M., Gómez, J., Sarmiento, J., Perez, M., Lara, C., et al. (2024). Electronic tongues and noses: a general overview. Biosensors 14 (4), 190. doi:10.3390/bios14040190
Wang, B., Sun, Y., Pei, W., Zhang, H., and Kang, T. (2022b). A new method for studying the mechanism of “Feature Identification based quality assessment” of Traditional Chinese Medicine, taking Gastrodiae Rhizoma as an example. Heliyon 8, e10354. doi:10.1016/j.heliyon.2022.e10354
Wang, M., Zhang, S., Guo, N., Xv, H., Wang, A., Li, X., et al. (2023). Quality evaluation of standard decoction prepared from powder of Asari Radix et Rhizoma. World J. Tradit. Chin. Med. 18, 2121–2127.
Wang, Q., Ou, Y., Hu, G., Wen, C., Yue, S., Chen, C., et al. (2020). Naringenin attenuates non-alcoholic fatty liver disease by down-regulating the NLRP3/NF-κB pathway in mice. Br. J. Pharmacol. 177 (8), 1806–1821. doi:10.1111/bph.14938
Wang, S., Lin, Z., Zhang, B., Du, J., Li, W., and Wang, Z. (2022a). Data fusion of electronic noses and electronic tongues aids in botanical origin identification on imbalanced Codonopsis Radix samples. Sci. Rep. 12, 19120. doi:10.1038/s41598-022-23857-8
Wang, S., Yang, T., Guo, P., Lan, L., and Sun, G. (2024). A new method to comprehensively evaluate the quality of Tianma Toutong tablets by multiple fingerprints combined with quantitative analysis and prescription analysis. J. Pharm. Biomed. Anal. 242, 116008. doi:10.1016/j.jpba.2024.116008
Wen, H., Gao, H., Qi, W., Xiao, F., Wang, L., Wang, D., et al. (2014). Simultaneous determination of twenty-two components in Asari Radix et Rhizoma by ultra performance liquid chromatography coupled with quadrupole time-of-flight mass spectrometry. Planta Med. 80 (18), 1753–1762. doi:10.1055/s-0034-1383296
Wu, Z., Zhang, Y., Liu, Y., Chen, X., Huang, Z., Zhao, X., et al. (2021). Melibiose confers a neuroprotection against cerebral ischemia/reperfusion injury by ameliorating autophagy flux via facilitation of TFEB nuclear translocation in neurons. Life 11 (9), 948. doi:10.3390/life11090948
Xian, Z., Tian, J., Zhang, Y., Meng, J., Zhao, Y., Li, C., et al. (2021). Study on the potential nephrotoxicity and mutagenicity of aristolochic acid IVa and its mechanism. Biomed. Pharmacother. 142 112081. doi:10.1016/j.biopha.2021.112081
Xin, T., Li, R., Lou, Q., Lin, Y., Liao, H., Sun, W., et al. (2022). Application of DNA barcoding to the entire traditional Chinese medicine industrial chain: A case study of Rhei Radix et Rhizoma. Phytomedicine 105, 154375. doi:10.1016/j.phymed.2022.154375
Xing, Y., Yan, Z., Li, Y., Teka, T., Pan, G., Dou, Z., et al. (2021). An effective strategy for distinguishing the processing degree of Polygonum multiflorum based on the analysis of substance and taste by LC-MS, ICP-OES and electronic tongue. J. Pharm. Biomed. Anal. 205, 114328. doi:10.1016/j.jpba.2021.114328
Xu, Y., Song, W., Zhou, P., Li, P., and Li, H. (2015). Morphological and microscopic characterization of five commonly-used testacean traditional Chinese medicines. Acta Pharm. Sin. B 5 (4), 358–366. doi:10.1016/j.apsb.2015.03.014
Yin, L., Zhou, J., Chen, D., Han, T., Zheng, B., Younis, A., et al. (2019). A review of the application of near-infrared spectroscopy to rare traditional Chinese medicine. Spectrochim. Acta A Mol. Biomol. Spectrosc. 221, 117208. doi:10.1016/j.saa.2019.117208
Yu, J., Ma, C., Wang, X., Shang, M., Hattori, M., Xu, F., et al. (2016). Analysis of aristolochic acids, aristololactams and their analogues using liquid chromatography tandem mass spectrometry. Chin. J. Nat. Med. 14 (8), 626–640. doi:10.1016/S1875-5364(16)30074-7
Zeng, J., and Jiang, Y. (2022). Identification of coptis chinensis and its counterfeits via electroanalysis-based fingerprint. Int. J. Electrochem. Sci. 17, 221262. doi:10.20964/2022.12.90
Zhang, J., Li, M., Zhang, Y., Qin, Y., Li, Y., Su, L., et al. (2023). E-eye, flash GC E-nose and HS-GC-MS combined with chemometrics to identify the adulterants and geographical origins of Ziziphi Spinosae Semen. Food Chem. 424, 136270. doi:10.1016/j.foodchem.2023.136270
Zhang, K., Wang, J., Fan, X., Zhu, G., Lu, T., and Xue, R. (2022). Discrimination between raw and ginger juice processed Magnoliae officinalis cortex based on HPLC and Heracles NEO ultra-fast gas phase electronic nose. Phytochem. Anal. 33 (5), 722–734. doi:10.1002/pca.3123
Zhang, Y., Li, S., Liang, Y., Liu, R., Lv, X., Zhang, Q., et al. (2021). A systematic strategy for uncovering quality marker of Asari Radix et Rhizoma on alleviating inflammation based chemometrics analysis of components. J. Chromatogr. A 1642, 461960. doi:10.1016/j.chroma.2021.461960
Zhong, X., Tian, J., Zhang, Y., Meng, J., Zhao, Y., Li, C., et al. (2021). Study on the potential nephrotoxicity and mutagenicity of aristolochic acid IVa and its mechanism. Biomed. Pharmacother. 142, 112081. doi:10.1016/j.biopha.2021.112081
Zhu, S., Liu, Q., Qiu, S., Dai, J., and Gao, X. (2022). DNA barcoding: an efficient technology to authenticate plant species of traditional Chinese medicine and recent advances. Chin. Med. 17 (1), 112. doi:10.1186/s13020-022-00655-y
Zingue, S., Foyet, H. S., Djiogue, S., Ezo’o, Y. E., Abaïssou, H. H. N., Fachagbo, P., et al. (2018). Effects of Ficus umbellata (Moraceae) aqueous extract and 7-methoxycoumarin on scopolamine-induced spatial memory impairment in ovariectomized Wistar rats. Behav. Neurol. 2018, 1–14. doi:10.1155/2018/5751864
Keywords: medicinal plants, electronic nose, electronic tongue, mass spectrometry, Belousov-Zhabotinsky reaction
Citation: Zhang X-R, Chen Y-H, Zhang J-N, Wang W-Y, Sun R-B, Ding Z-X, Zhang H, Xie M, Kang T-G and Song H-P (2025) Discrimination of poisonous and medicinal plants with similar appearance (Asarum heterotropoides vs. Cynanchum paniculatum) via a fusion method of E-nose, E-tongue, LC-HR-Q-TOF-MS/MS, and electrochemical fingerprint spectra. Front. Chem. 13:1578126. doi: 10.3389/fchem.2025.1578126
Received: 17 February 2025; Accepted: 10 April 2025;
Published: 29 April 2025.
Edited by:
Anna Borioni, National Institute of Health (ISS), ItalyReviewed by:
Yulong Zhu, Anhui University of Chinese Medicine, ChinaMaria Cristina Gaudiano, National Institute of Health (ISS), Italy
Copyright © 2025 Zhang, Chen, Zhang, Wang, Sun, Ding, Zhang, Xie, Kang and Song. This is an open-access article distributed under the terms of the Creative Commons Attribution License (CC BY). The use, distribution or reproduction in other forums is permitted, provided the original author(s) and the copyright owner(s) are credited and that the original publication in this journal is cited, in accordance with accepted academic practice. No use, distribution or reproduction is permitted which does not comply with these terms.
*Correspondence: Yue-Hua Chen, Y2hlbnl1ZWh1YTUyN0AxMjYuY29t; Hui-Peng Song, c29uZ2h1aXBlbmcxNUAxNjMuY29t