 Melisa A. Diaz1,2*
 Jianghanyang Li3Greg Michalski3,4
 Thomas H. Darrah1,5
 Byron J. Adams6
 Diana H. Wall7
 Ian D. Hogg8,9
 Noah Fierer10
 Susan A. Welch1,2Christopher B. Gardner1,2
 W. Berry Lyons1,2
- 1School of Earth Sciences, The Ohio State University, Columbus, OH, United States
- 2Byrd Polar and Climate Research Center, The Ohio State University, Columbus, OH, United States
- 3Department of Earth, Atmospheric, and Planetary Sciences, Purdue University, West Lafayette, IN, United States
- 4Department of Chemistry, Purdue University, West Lafayette, IN, United States
- 5Global Water Institute, The Ohio State University, Columbus, OH, United States
- 6Department of Biology, Evolutionary Ecology Laboratories and Monte L. Bean Museum, Brigham Young University, Provo, UT, United States
- 7Department of Biology and School of Global Environmental Sustainability, Colorado State University, Fort Collins, CO, United States
- 8Canadian High Arctic Research Station, Polar Knowledge Canada, Cambridge Bay, NU, Canada
- 9School of Science, University of Waikato, Hamilton, New Zealand
- 10Department of Ecology and Evolutionary Biology and Cooperative Institute for Research in Environmental Science, University of Colorado Boulder, Boulder, CO, United States
Soils in ice-free areas in Antarctica are recognized for their high salt concentrations and persistent arid conditions. While previous studies have investigated the distribution of salts and potential sources in the McMurdo Dry Valleys, logistical constraints have limited our investigation and understanding of salt dynamics within the Transantarctic Mountains. We focused on the Shackleton Glacier (85° S, 176° W), a major outlet glacier of the East Antarctic Ice Sheet located in the Central Transantarctic Mountains (CTAM), and collected surface soil samples from 10 ice-free areas. Concentrations of water-soluble nitrate (NO3–) and sulfate (SO42–) ranged from <0.2 to ∼150 μmol g–1 and <0.02 to ∼450 μmol g–1, respectively. In general, salt concentrations increased with distance inland and with elevation. However, concentrations also increased with distance from current glacial ice position. To understand the source and formation of these salts, we measured the stable isotopes of dissolved water-soluble NO3– and SO42–, and soil carbonate (HCO3 + CO3). δ15N-NO3 values ranged from −47.8 to 20.4‰ and, while all Δ17O-NO3 values are positive, they ranged from 15.7 to 45.9‰. δ34S-SO4 and δ18O-SO4 values ranged from 12.5 and 17.9‰ and −14.5 to −7.1‰, respectively. Total inorganic carbon isotopes in bulk soil samples ranged from 0.2 to 8.5‰ for δ13C and −38.8 to −9.6‰ for δ18O. A simple mixing model indicates that NO3– is primarily derived from the troposphere (0–70%) and stratosphere (30–100%). SO42– is primarily derived from secondary atmospheric sulfate (SAS) by the oxidation of reduced sulfur gases and compounds in the atmosphere by H2O2, carbonyl sulfide (COS), and ozone. Calcite and perhaps nahcolite (NaHCO3) are formed through both slow and rapid freezing and/or the evaporation/sublimation of HCO3 + CO3-rich fluids. Our results indicate that the origins of salts from ice-free areas within the CTAM represent a complex interplay of atmospheric deposition, chemical weathering, and post-depositional processes related to glacial history and persistent arid conditions. These findings have important implications for the use of these salts in deciphering past climate and atmospheric conditions, biological habitat suitability, glacial history, and can possibly aid in our future collective understanding of salt dynamics on Mars.
Introduction
Ice-free areas within the Transantarctic Mountains (TAM) have been of scientific interest throughout the 20th and 21st centuries due in part to their unique polar desert soil environments. They are characterized by average annual temperatures below freezing, low amounts of precipitation, and low biomass. Throughout the mid to late Cenozoic, much of the currently exposed areas along the TAM were re-worked by the advance and retreat of the East Antarctic Ice sheet (EAIS), but some soils are believed to have remained primarily ice-free for possibly millions of years (Mayewski and Goldthwait, 1985; Anderson et al., 2002). As a result of persistent arid conditions since at least the Miocene, salts have accumulated in some Antarctic soils (Marchant and Denton, 1996).
Early geochemical work in the McMurdo Dry Valleys (MDV) (77° S, 162° E), the largest ice-free area in Antarctica, showed that the soil environments in Antarctica are among the most saline systems on Earth (Jones and Faure, 1967; Keys and Williams, 1981). The binary salts, which are primarily nitrate-, sulfate-, chloride-, and carbonate- bearing, have been used for determining relative chronology, and have important implications for habitat suitability and hence soil biodiversity (Claridge and Campbell, 1977; Keys and Williams, 1981; Magalhães et al., 2012; Bockheim and McLeod, 2013; Sun et al., 2015; Lyons et al., 2016). Antarctic ice-free environments are often utilized as Martian analogs, and salt formation processes in Antarctica may aid in our understanding of salt sources and the current and past availability of water on Mars (Wynn-Williams and Edwards, 2000; Vaniman et al., 2004; Bishop et al., 2015).
By interpreting the relationship between the types of salts in the soils, the pH, and the distribution of calcite crusts, Claridge and Campbell (1977) and Keys and Williams (1981) proposed that the majority of MDV salts were derived from marine sources, however, in situ chemical weathering and deposition of oxidized atmospheric compounds are also important. While Cl– salts are generally derived from marine aerosols, and HCO3– salts from lacustrine deposits and chemical weathering, the origins of NO3– and SO42– salts are more complex (Claridge and Campbell, 1977; Nezat et al., 2001; Bisson et al., 2015). Additionally, when liquid water is present, the dissolution of salts and ion exchange in soils can alter the original salt geochemistry (Toner and Sletten, 2013; Toner et al., 2013).
The measurement of stable isotopes of NO3–, and SO42– has greatly improved our understanding of the sources and transport of these salts in Antarctica. Potential sources of NO3– include deposition from polar stratospheric clouds, tropospheric oxidation of HNO3 emitted from ice, nitrification and denitrification of nitrogen species by organisms, and oxidation of oceanic organic matter (Savarino et al., 2007; Frey et al., 2009; Campbell et al., 2013; Erbland et al., 2015), while potential sources of SO42– include pyrite weathering, marine biogenic sulfate, sea-salt sulfate, and S from volcanic eruptions (Legrand and Delmas, 1984; Patris et al., 2000; Rech et al., 2003; Shaheen et al., 2013). Additional work has used 17O isotopes to attribute NO3– and SO42– salt abundances to the deposition of atmospheric oxidized compounds, particularly in old, high elevation, and hyper-arid environments in Antarctic ice-free areas (Bao et al., 2000; Michalski et al., 2005; Bao and Marchant, 2006).
The majority of isotopic measurements of NO3– and SO42– in Antarctic terrestrial systems have been made on soils from the MDV (e.g., Nakai et al., 1975; Bao et al., 2000; Michalski et al., 2005; Bao and Marchant, 2006; Jackson et al., 2016). Few studies have investigated the geochemistry, distribution, and source of salts from the Central Transantarctic Mountains (CTAM), which are believed to contain some of the most saline soils on Earth (Sun et al., 2015; Lyons et al., 2016). We measured the concentrations and isotopic composition of NO3–, SO42–, and HCO3 + CO3 in samples collected from the Shackleton Glacier region, located in the CTAM, to identify potential salt sources. We show that salt composition varies throughout the region, likely related to differences in the availability of water, and atmospheric deposition is the primary source of both NO3– and SO4–, while carbonate minerals are formed from the freezing and evaporation/sublimation of water. These data provide insights into the processes that lead to salt formation and accumulation in CTAM soils.
Materials and Methods
Study Site
During the 2017–2018 austral summer, a multi-disciplinary field camp was established at the Shackleton Glacier (∼84.5°S), a major outlet glacier of the EAIS in the CTAM. The Shackleton Glacier flows between several exposed peaks of the Queen Maud Mountains, which are the basis of this study (Figure 1). Though climate data for the region are sparse, winter temperatures are well below freezing and summer months are closer to 0°C (LaPrade, 1984). Elevations of the ice-free areas range from ∼150 m.a.s.l. toward the Ross Ice Shelf to >3,500 m.a.s.l. further inland. The soils in this study were collected between ∼300 m.a.s.l. and 2,100 m.a.s.l. (Table 1). The geologic basement consists of gneiss, schist, slate, and quartzite formed from sedimentary and igneous strata which were intruded by granitoid batholiths in the Ross Orogeny. Devonian to Triassic rocks of the Beacon Supergroup overlie the basement, which have been cut by dolerite/basaltic sills (Elliot and Fanning, 2008). Near the Ross Ice Shelf, the exposed surfaces are primarily comprised of metamorphic and igneous rocks, while the Beacon Supergroup and Ferrar Dolerite are more abundant toward the Polar Plateau along with sediments from the Sirius Group. These rocks serve as primary sources of weathering products for salt formation (e.g., carbonates and cations).
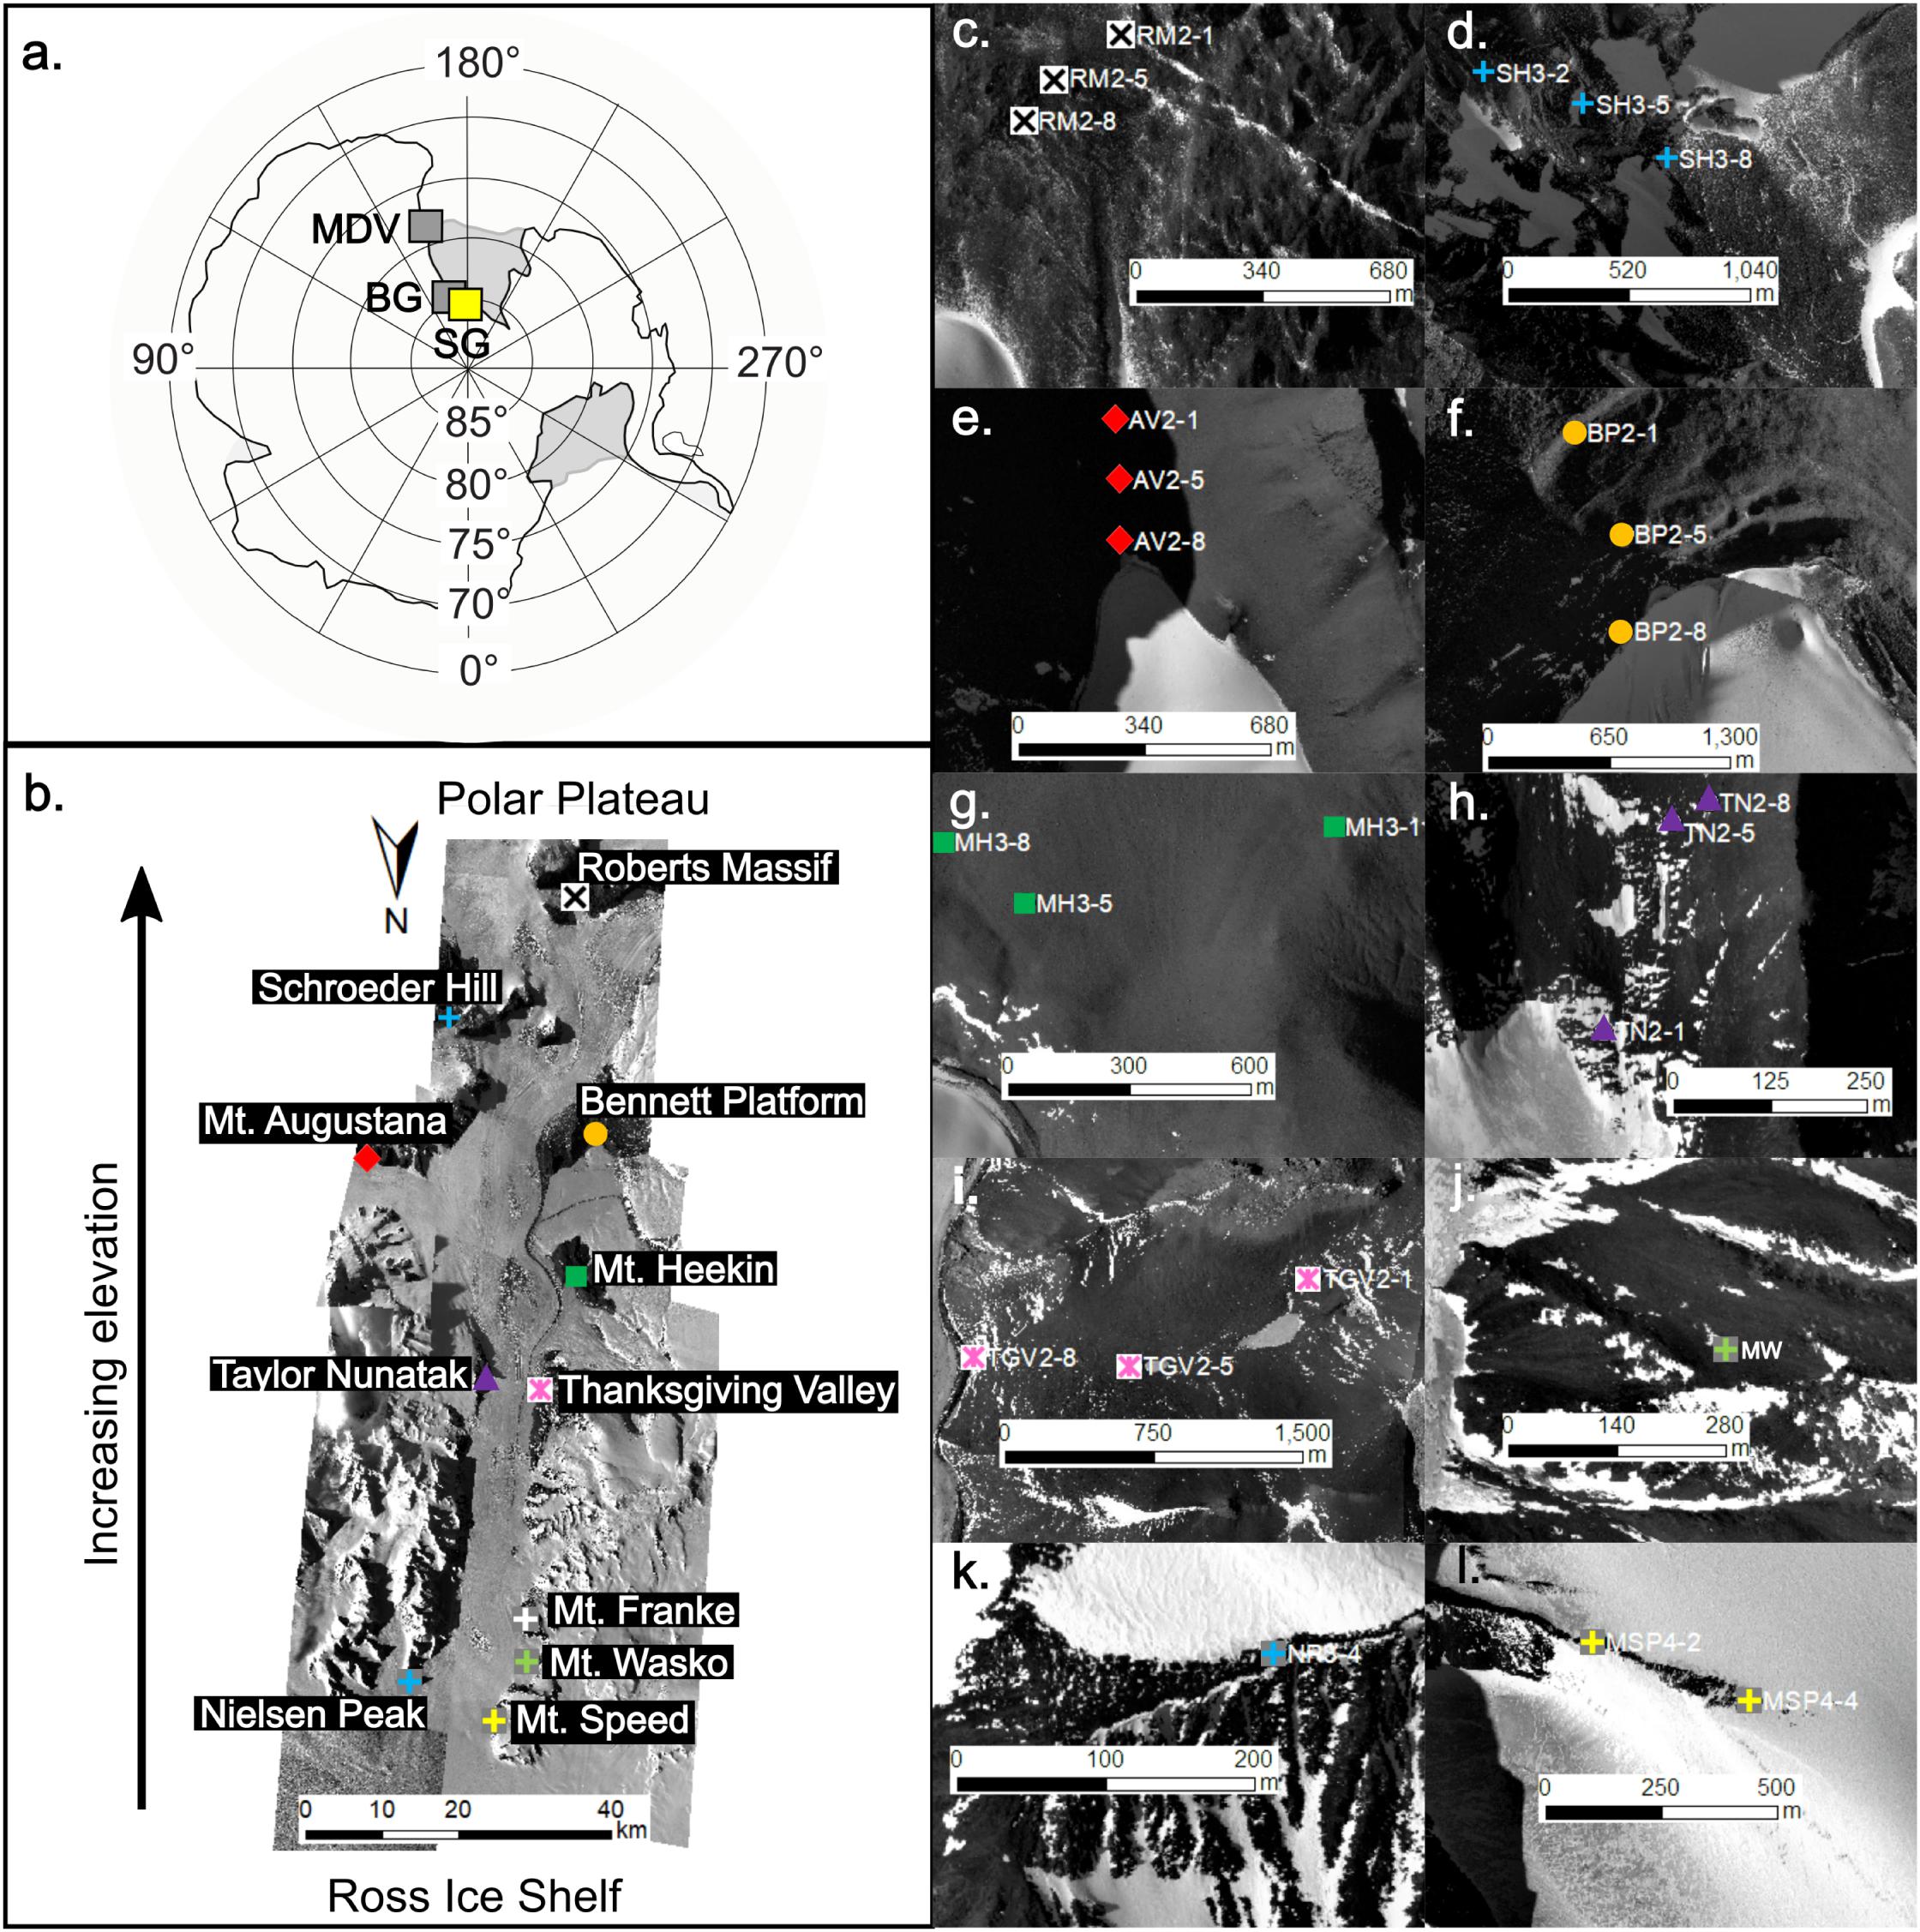
Figure 1. Map of Antarctica highlighting the Shackleton Glacier (SG; yellow box) in relation to the McMurdo Dry Valleys (MDV) and Beardmore Glacier (BG) (gray boxes) (a). The Shackleton Glacier is the focus of this study and flows from the Polar Plateau to the Ross Ice Shelf (b). Soil samples were collected from 11 features along the glacier: Roberts Massif (c), Schroeder Hill (d), Mt. Augustana (e), Bennett Platform (f), Mt. Heekin (g), Taylor Nunatak (h), Thanksgiving Valley (i), Mt. Wasko (j), Nilsen Peak (k), Mt. Speed (l), and Mt. Franke (not shown). The symbols represent sampling locations, though no accurate GPS coordinate could be recorded from Mt. Wasko. Images of the Shackleton Glacier were acquired from the Polar Geospatial Center (PGC).
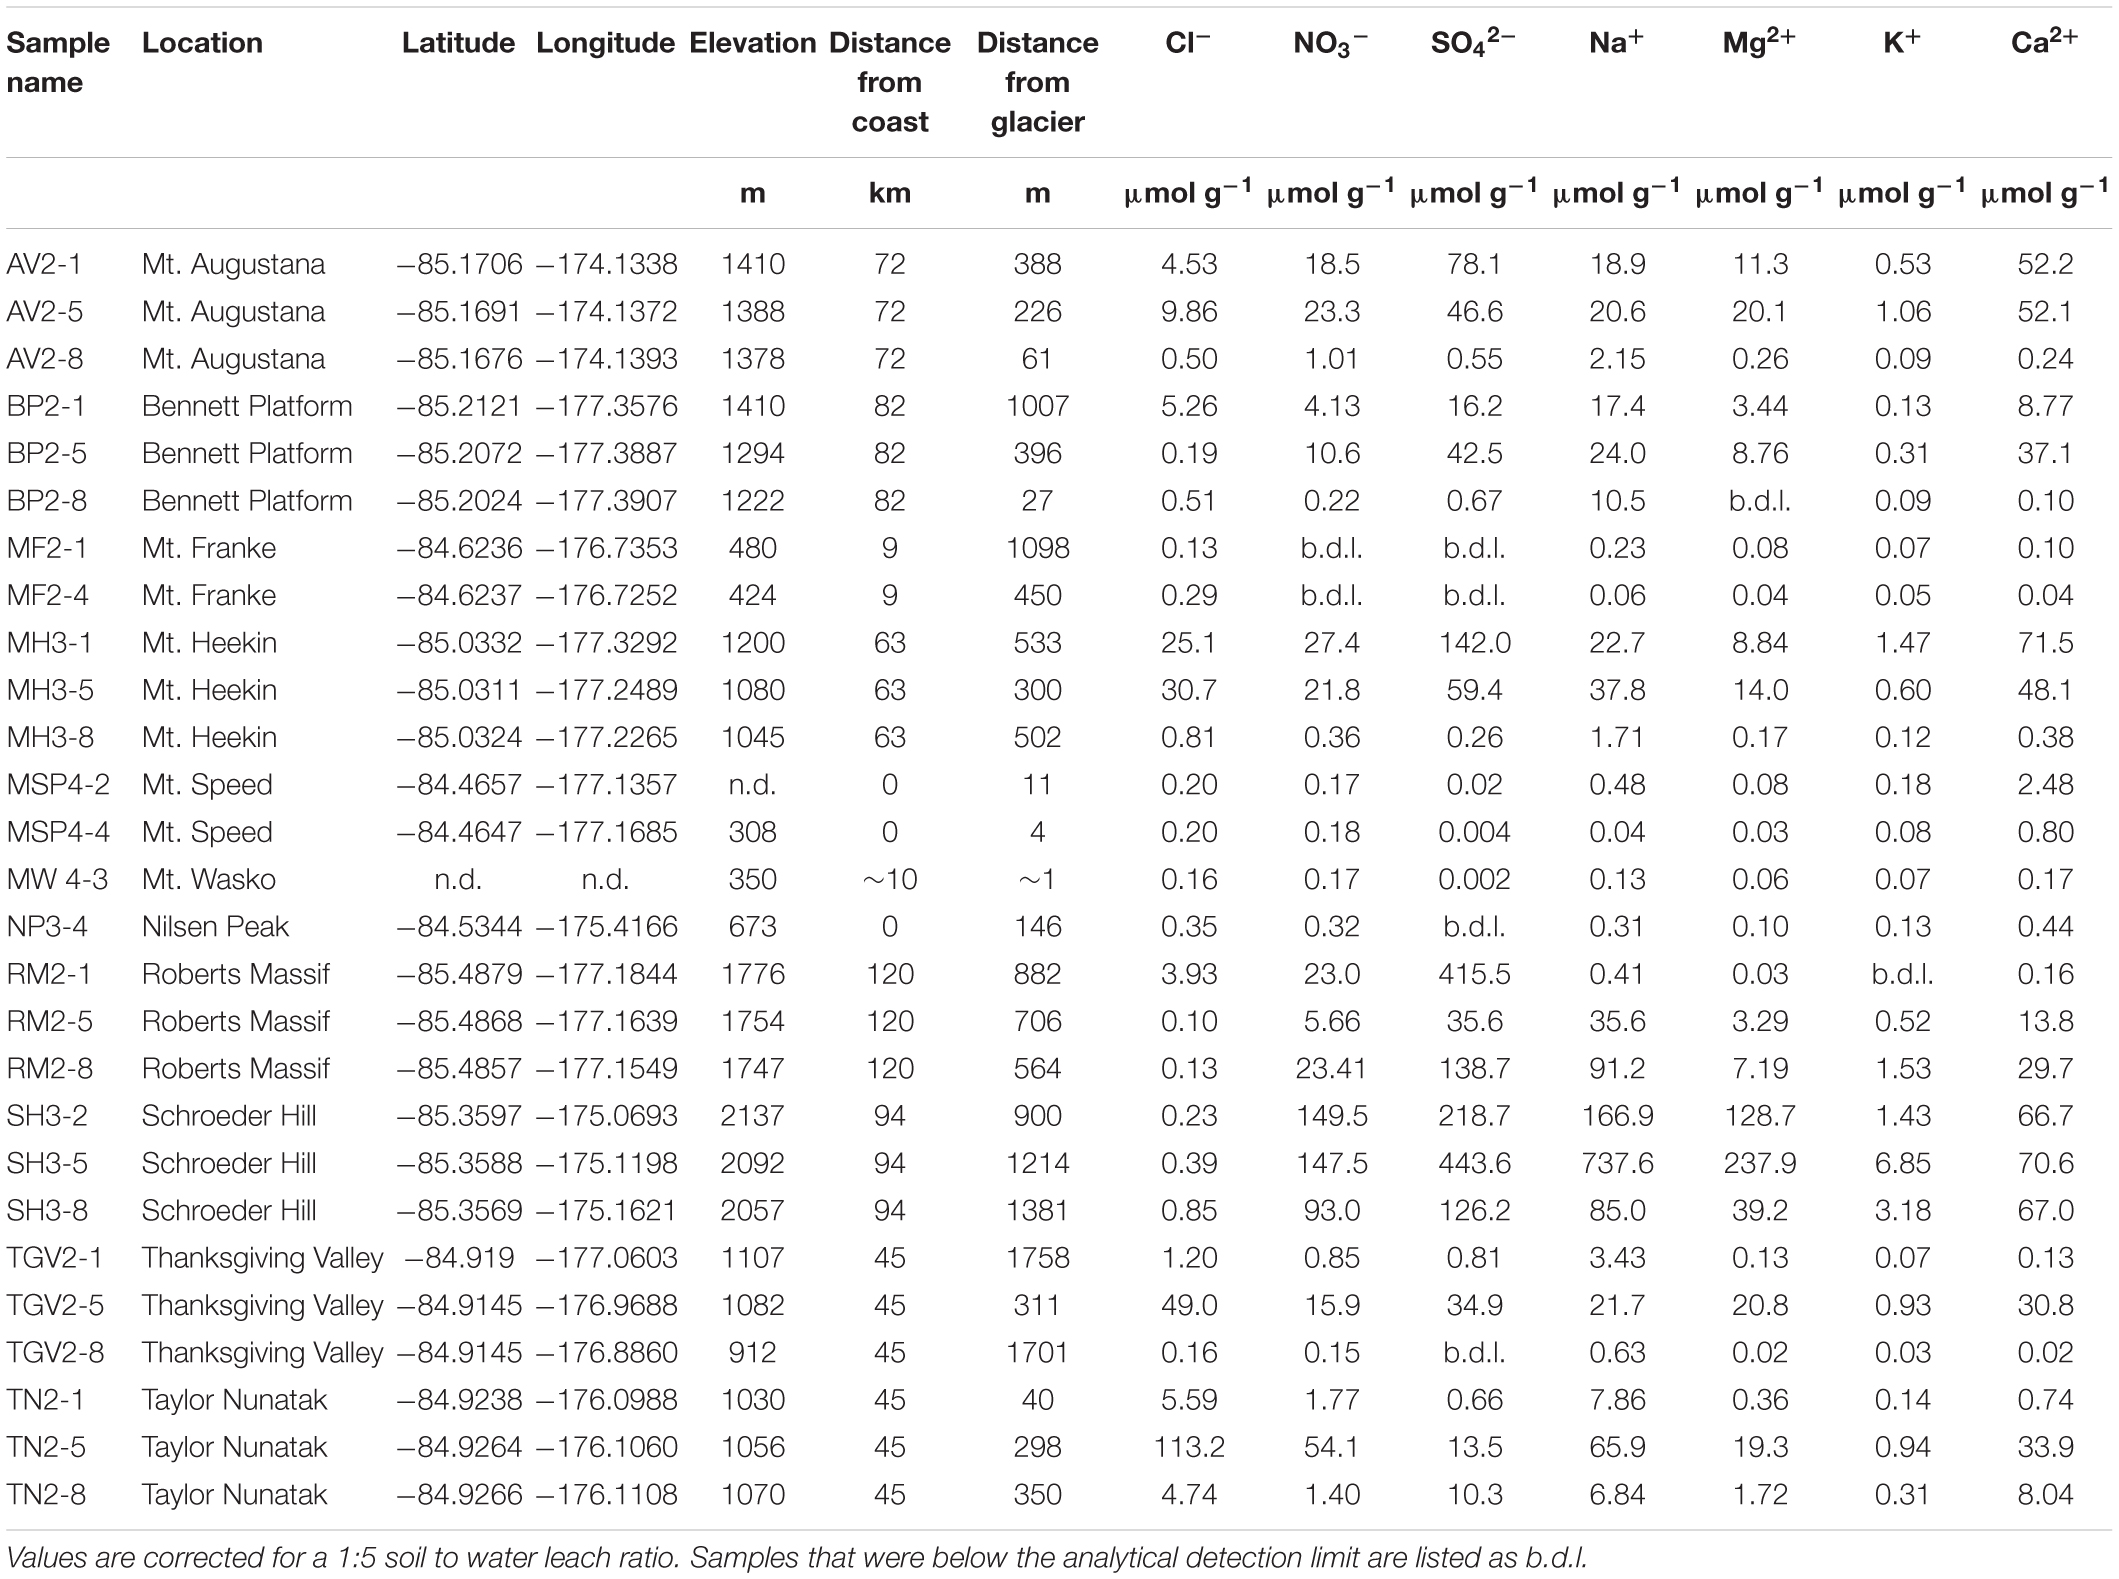
Table 1. Sample geographic information and concentrations of water-soluble ions in soil leaches determined by ion chromatography and nutrient analysis in μmol g–1.
Sample Collection
The top 5 cm of soil was collected from 11 locations along the Shackleton Glacier (total of 27 samples) using a clean plastic scoop, stored in Whirlpak bags, and shipped at −20°C to The Ohio State University (Figure 1). We attempted to collect three samples in transects perpendicular to the Shackleton Glacier or local tributary/alpine glaciers at each of the 11 locations. One sample was collected near the glacier, one near our estimate of the glacier’s trim line during the Last Glacial Maximum (LGM), and the third further inland to represent long-term exposure. The soil ages are not known, but samples from the southern portion of the region, such as Roberts Massif, are likely at least 4 Myr due to the presence of Sirius Group sediments (Hambrey et al., 2003). The sample locations represent the variable ambient summer temperatures, elevations, rock types and landscape features characteristic of the Shackleton Glacier region, and include soils from low elevation sites near the Ross Ice Shelf to high elevation sites near the Polar Plateau.
GPS coordinates and elevation were recorded in the field and used to estimate the aerial distance to the Ross Ice Shelf (“distance to coast”) and the distance to the nearest glacier (Table 1). In the latter measurement, the term “glacier” was used to represent any glacier, including the Shackleton Glacier, tributary glaciers, alpine glaciers, etc. While this distance does not account for topography, it can be used as an estimate of potential modern and past hydrologic influence and impact on salt formation and mobility.
Water-Soluble Leaches
The soil samples were leached at a 1:5 soil to water ratio for 24 h, following procedures previously described (Nkem et al., 2006; Diaz et al., 2018). The leachate was filtered through 0.4 μm Nucleopore membrane filters using a polyether sulfone (PES) filter funnel that was thoroughly cleaned with deionized (DI) water between samples. The leachate was stored in the dark at +4°C until sample analysis. Filter blanks were collected and analyzed to account for any possible contamination from the filtration and storage process.
Major Ions
Concentrations of water-soluble Cl– and SO42– were measured using a Dionex ICS-2100 ion chromatograph and an AS-DV automated sampler, as originally described by Welch et al. (2010). Water-soluble cations (K+, Na+, Ca2+, Mg2+) were measured on a PerkinElmer Optima 8300 Inductively Coupled Plasma-Optical Emission Spectrometer (ICP-OES) at The Ohio State University Trace Element Research Laboratory (TERL). Nitrate (NO3– + NO2–) concentrations were measured on a Skalar San++ Automated Wet Chemistry Analyzer with an SA 1050 Random Access Auto-sampler. The precision of replicated check standards and samples was better than 10% for all anions, cations and nutrients. Accuracy was better than 5% for all analytes, as determined by the NIST1643e external reference standard and the 2015 USGS interlaboratory calibration standard (M-216).
Nitrogen and Oxygen Isotope Analysis of Nitrate
Aliquots of the sample leachates were analyzed for Δ17O and δ15N of nitrate at Purdue University following procedures described by Michalski et al. (2005). Dissolved nitrate solutions were first injected into air-tight vials and the headspace was flushed with Ar. The nitrate in the solutions were reduced to N2O using TiCl3 (Altabet et al., 2019), then the isotopic composition of N2O was analyzed on a Finnigan-Mat 251 isotope ratio mass spectrometer (IRMS). Mass independent fractionation of oxygen isotopes, calculated by Δ17O = δ17O – 0.52∗ δ18O (Δ17O ± 1.0‰), are reported in units of per mille (‰) with respect to Vienna Standard Mean Ocean Water (VSMOW) and nitrogen isotopes (δ15N ± 0.3‰) are reported with respect to N2. Nitrate concentrations were high enough for isotopic analysis on 21 of 27 samples attempted. Though the relationship between δ18O and δ17O was used in the Δ17O calculation, the absolute values of these isotopes could not be determined.
Sulfur and Oxygen Isotope Analysis of Sulfate
The same samples that were analyzed for Δ17O and δ15N of nitrate were analyzed for δ18O and δ34S of sulfate at the University of Tennessee Knoxville. The leachates were acidified with HCl to pH ∼2 to remove any dissolved carbonate/bicarbonate ions. Sulfate was then precipitated as BaSO4, after the addition of BaCl2 (∼10% wt./vol). The precipitate was rinsed several times with DI water and dried at 80°C. The δ34S and δ18O values of BaSO4 were determined using a Costech Elemental Analyzer and a Thermo Finnigan TC/EA, respectively, coupled to a Thermo Finnigan Delta Plus XL mass spectrometer at the Stable Isotope Laboratory at University of Tennessee (e.g., Szynkiewicz et al., 2020). Isotopic values are reported in units of ‰ with respect to Vienna Canyon Diablo Troilite (VCDT) for δ34S and VSMOW for δ18O with analytical precision < 0.4‰ based on replicate measurements. Sulfur sequential extractions for δ34S of sedimentary sulfur were performed on seven dried, bulk soils from seven locations following methods from Szynkiewicz et al. (2009). The samples were ground and treated with 30 ml of 6 N HCl to measure acid-soluble SO42–. Then the samples were treated with 20 mL of 12 N HCl and 20 mL of 1 M CrCl2 ⋅ 6H2O under N2 to dissolve disulfide to measure Cr-reducible sulfide.
Of the 27 initially prepared for δ34S and 18O analysis, eight samples had sulfate concentrations too low for sufficient precipitation of BaSO4. Therefore, in these samples, δ34S was analyzed using a Nu Instruments multi-collector inductively coupled plasma mass spectrometer (MC-ICP-MS) at the US Geological Survey High Resolution ICP-MS laboratory, Denver with analytical precision < 0.3‰ (Pribil et al., 2015).
Carbon and Oxygen Isotope Analysis of Carbonate
Between 5 and 10 g of bulk soil from five locations (Roberts Massif, Bennett Platform, Mt. Heekin, Taylor Nunatak, and Nilsen Peak) were dried and ground to fine powder using a ceramic mortar and pestle for carbonate isotope analysis at the Stable Isotope Laboratory at Southern Methodist University. Total inorganic carbon (TIC) was measured by adding phosphoric acid kept at 90°C to the sample, liberating the carbonate as CO2. The 13C and 18O composition of the CO2 was measured using a dual-inlet Finnigan MAT 252 mass spectrometer. δ13C and δ18O are reported in units of ‰ with respect to Peedee belemnite (PDB) with an overall analytical precision of ±0.2‰ or better.
Scanning Electron Microscopy
One sample from Schroeder Hill (SH3-2) was analyzed using a FEI Quanta FEG 250 Field Emission scanning electron microscope (SEM) equipped with a backscattered electron detector for imaging and a Bruker energy dispersive x-ray (EDX) detector for spot chemical analysis. The sample was allowed to air dry and was then affixed to an aluminum stub with carbon tape. The stub was coated using Au-Pd with a Denton Desk V precious metal coater before analysis by SEM.
Results
Major Ion Concentrations
The concentrations of all measured water-soluble ions are variable across the sampling locations and span up to six orders of magnitude for SO42– (Table 1). In general, the most abundant anion is SO42–, however Cl– is the more dominant species in samples closest to the Ross Ice Shelf, such as those at Mt. Speed and Mt. Wasko (Table 1 and Figure 2). NO3– concentrations vary with distance from the coast, but also within individual sample locations (Table 1). For example, concentrations at Mt. Augustana vary from ∼1 to 23 μmol g–1. The most abundant cation is Ca2+ for nearly all soils, except for the Schroeder Hill samples, where Na+ is the most abundant and concentrations approach 700 μmol g–1. Additionally, the two Schroeder Hill samples furthest from the glacier have the lowest Ca: Mg molar ratios (0.52–0.30), indicating an enrichment of Mg2+ compared to Ca2+, while most other samples are dominated by Ca2+. Concentrations of K+ range from <0.03 μmol g–1 at Thanksgiving Valley to 6.85 μmol g–1 at Schroeder Hill (Table 1).
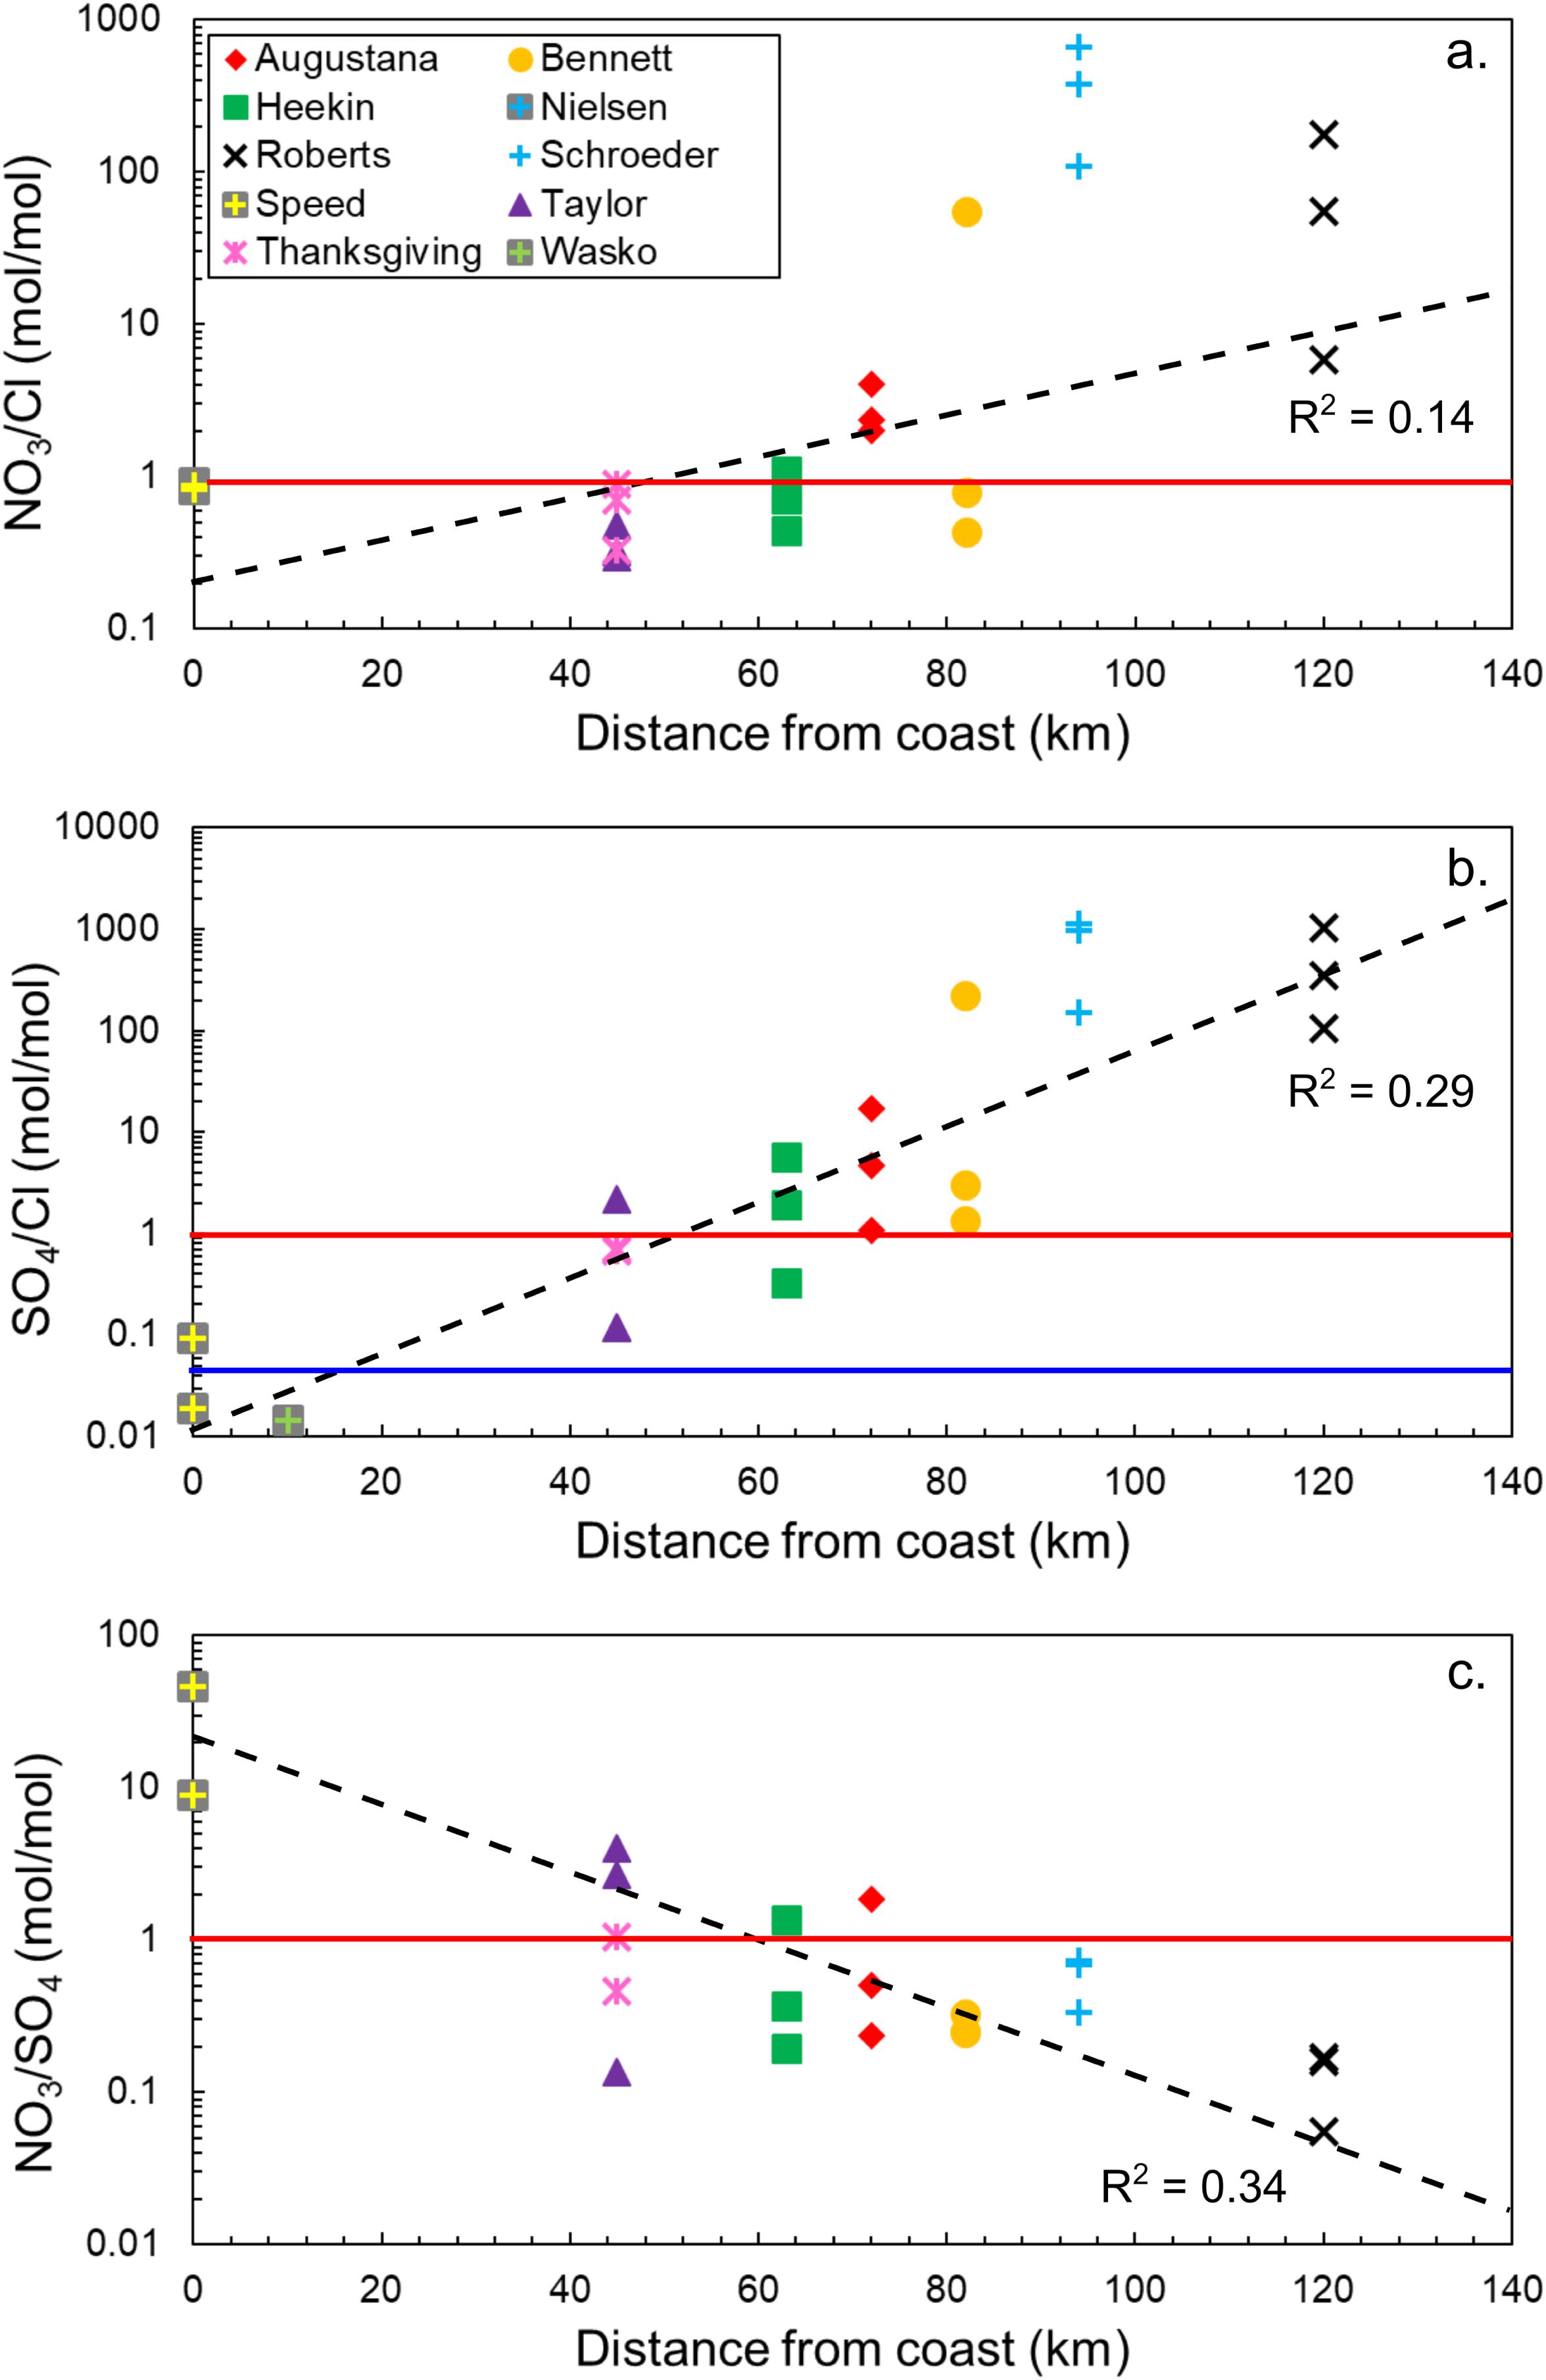
Figure 2. Molar ratios of major anion species typically associated with salts in high latitude, polar desert soils [(a) NO3– /Cl–, (b) SO42– /Cl–, and (c) NO3– /SO42– ] compared to distance from the coast of the Ross Ice Shelf. The black dotted lines represent general trends in the data, while the red solid line represents equal molar proportions of the anions and the blue line represents the SO4:Cl molar ratio in seawater.
Trends in Salt Distributions
Molar ratios of NO3–/Cl–, SO42–/Cl–, and NO3–/SO42– with distance from the Ross Ice Shelf are compared for the different locations in Figure 2. Between the coast and approximately halfway up the Shackleton Glacier, NO3– and Cl– are in approximately equal proportions, but nitrate-bearing salts become more dominant closer to the Polar Plateau (Figure 2a). The trend for sulfate-bearing salts is similar. Near the coast, chloride is about two orders of magnitude higher in concentration than sulfate. However, SO42– becomes the dominant species for most locations beyond 50 km inland, and concentrations increase to nearly four orders of magnitude higher than Cl– (Figure 2b). The molar ratio of NO3–/SO42– with distance from the coast exhibits an inverse trend compared to the species normalized to Cl– (Figure 2c), where the ratio is highest near the coast. As observed with the SO42–/Cl– ratio, approximately 50 km inland, sulfate becomes dominant. The relative enrichment of SO42– increases further away from the coast and closer to the Polar Plateau. In general, both nitrate and sulfate have a positive relationship with distance from the Ross Ice Shelf. These results show that, contrary to trends observed in the MDV and the Beardmore Glacier region (83°4′ S, 171°0′ E) where NO3– was the dominant salt for inland and high elevation locations, sulfate is instead the most abundant in the Shackleton Glacier region (Keys and Williams, 1981; Lyons et al., 2016).
δ15N and Δ17O of Nitrate
Values of δ15N and Δ17O are widely variable within and between the different locations. δ15N values range from −47.8 to 20.4‰ and while all Δ17O values are positive, they range from 15.7 to 45.9‰ (Table 2). The highest Δ17O and δ15N values were at Mt. Augustana and Thanksgiving Valley, respectively. The isotopic composition of NO3– does not appear directly related to elevation and distance from the coast, though there is a slight (R2 = 0.20, p-value = 0.05) positive relationship between δ15N and distance from the glacier (Figures 3a–c).
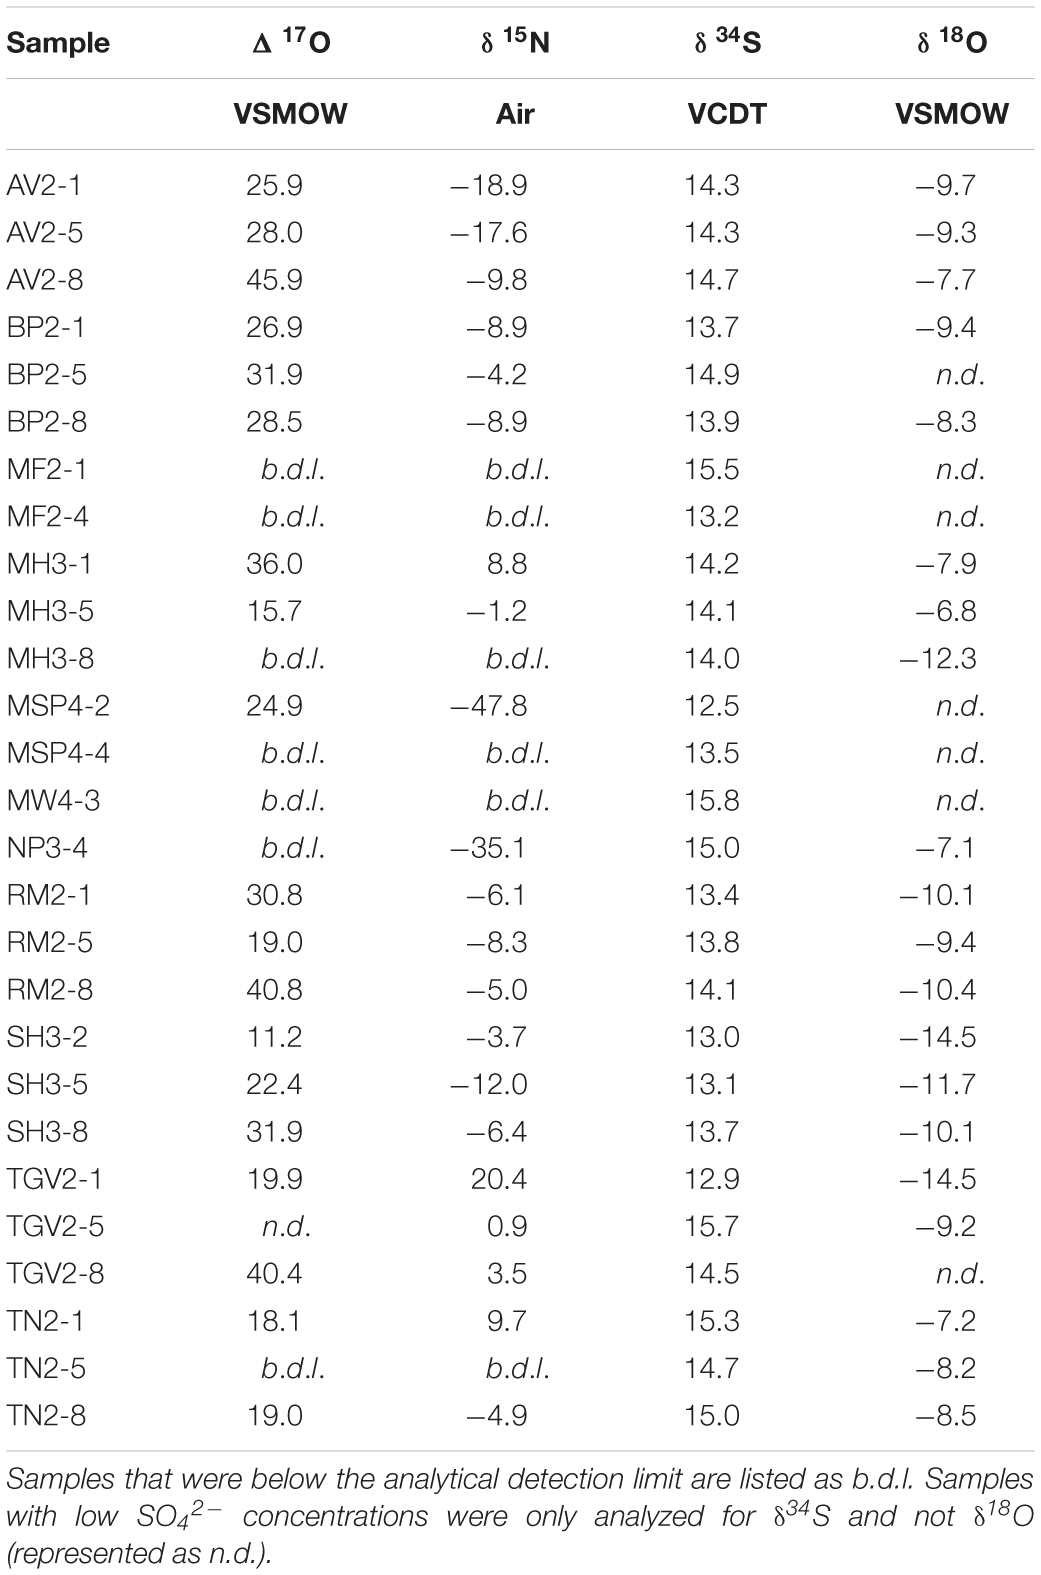
Table 2. δ15N and Δ17O of NO3– and δ34S and δ18O of SO42–.
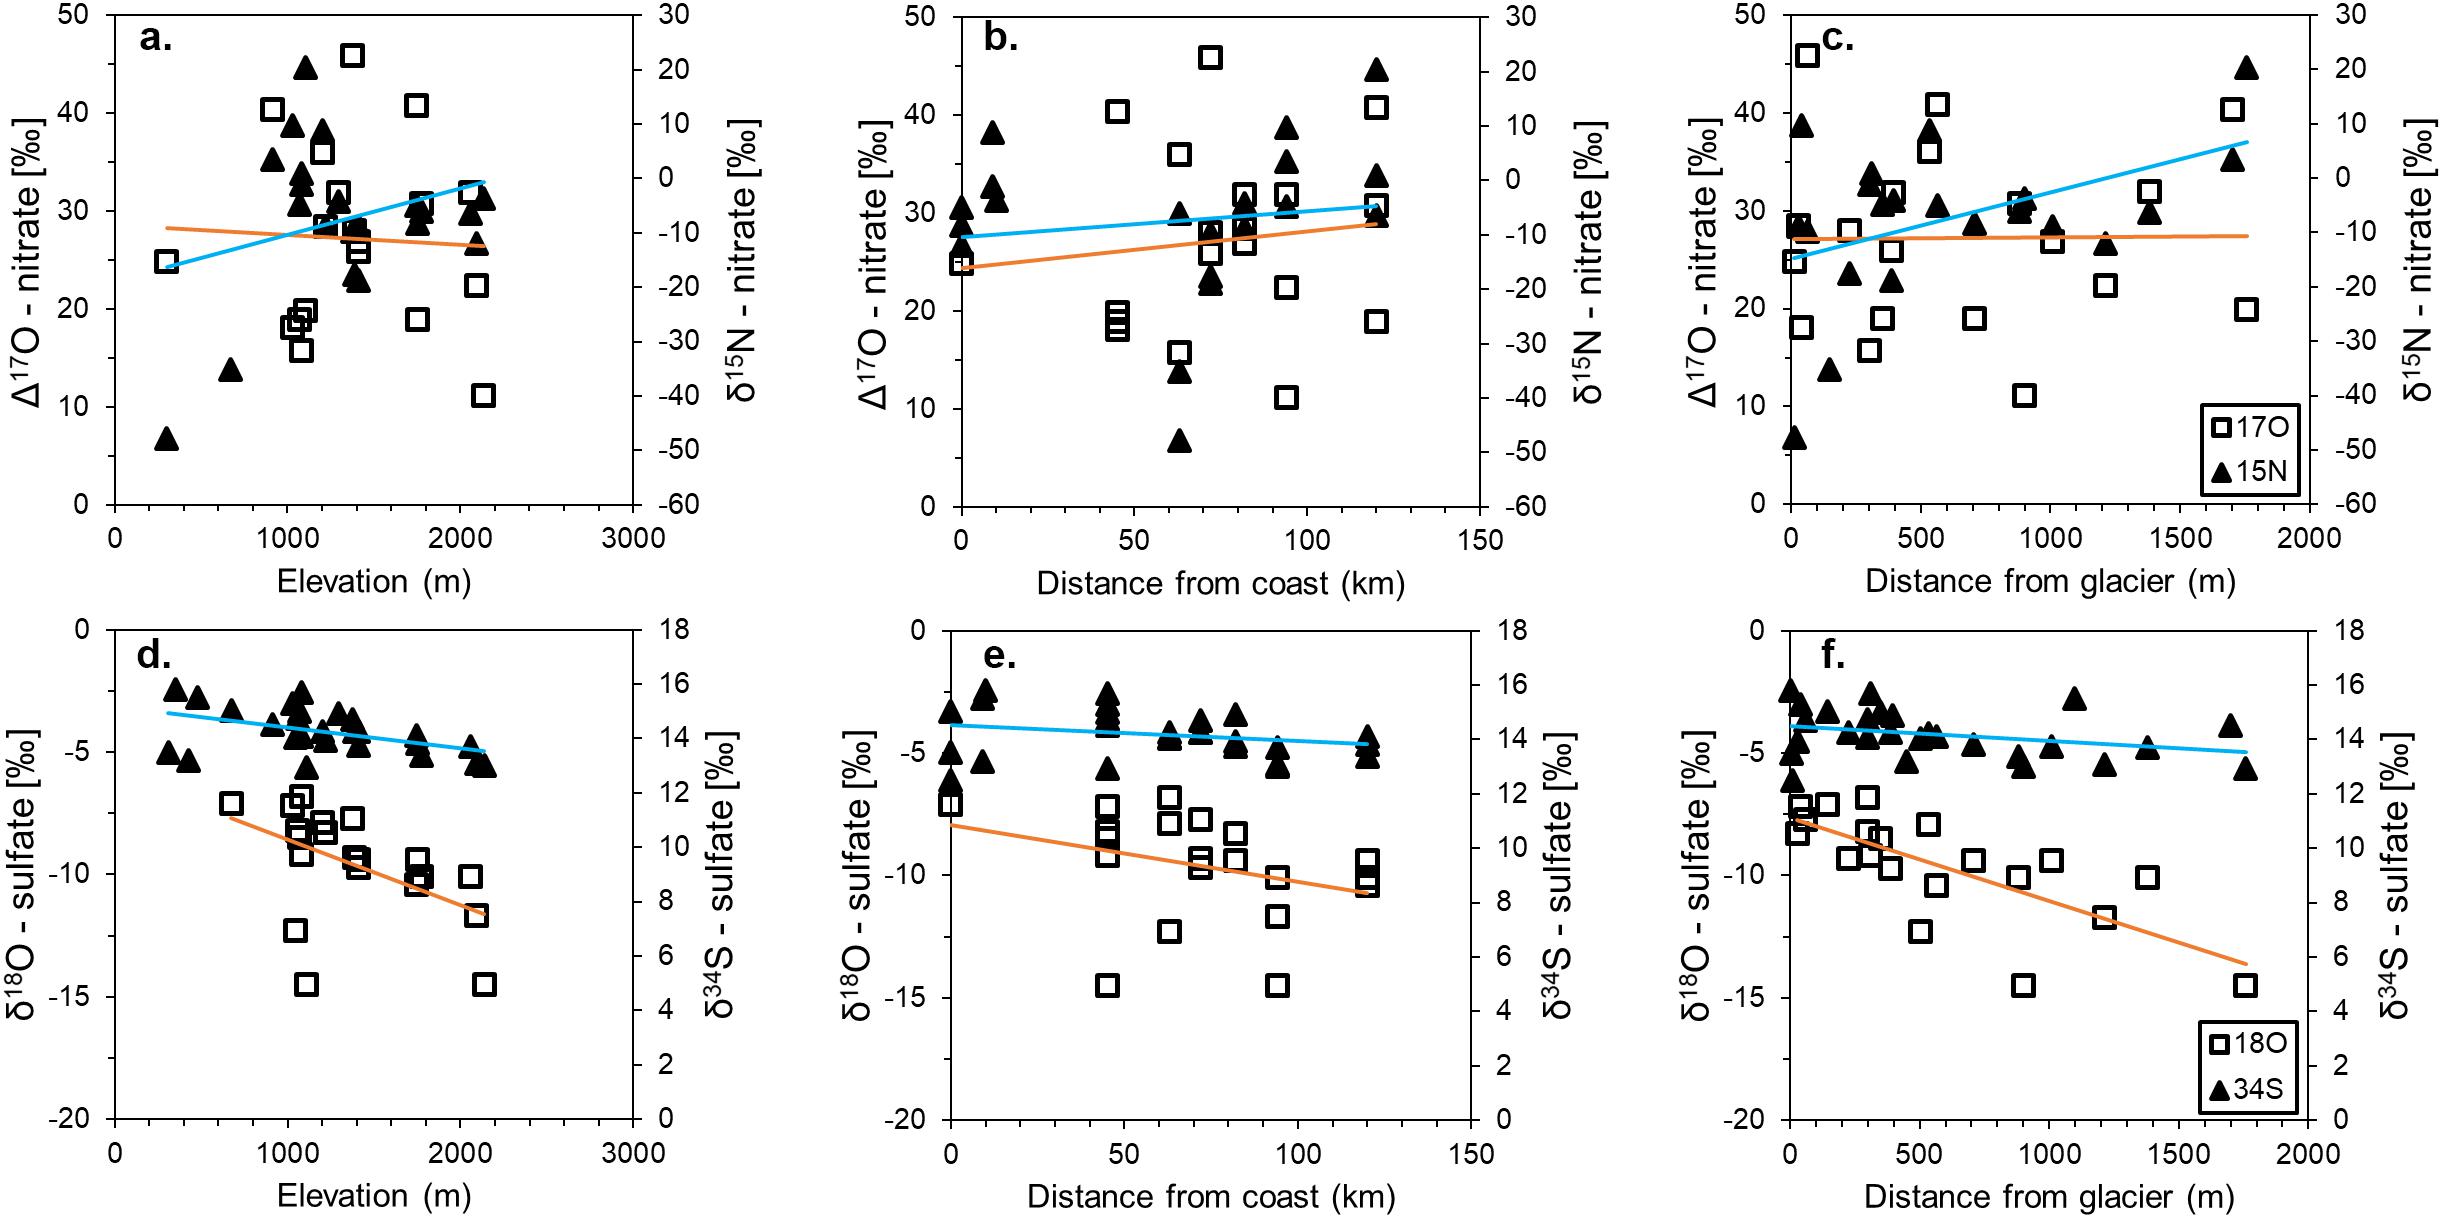
Figure 3. Stable isotope values of δ15N and Δ17O in nitrate (a–c) and δ34S and δ18O in sulfate (d–f) with elevation, distance from the coast of the Ross Ice Shelf, and distance from the nearest glacier. Blue lines are trend lines for δ15N and δ34S, while orange lines are trend lines for Δ17O and δ18O.
δ34S and δ18O of Sulfate
Despite a wide range of SO42– concentrations, δ34S values are well constrained between 12.5 and 15.8‰, even for the low SO42– concentration samples that were analyzed by MC-ICP-MS (Table 2). δ18O values are slightly more variable, though all values are negative and range from −14.5 to −6.8‰. The highest δ34S value is from Mt. Heekin and the most negative δ18O value is from Schroeder Hill. Values of δ34S do not vary significantly with geography, however δ18O exhibits negative trends with elevation and distance from the glacier (Figures 3d–f).
Inorganic δ13C and δ18O of Carbonate
Although dissolved inorganic carbon species were not directly measured for the soil extracts in this work, carbonate and bicarbonate minerals have been identified throughout the MDV, and therefore, these minerals are assumed to also be present in CTAM soils (Bisson et al., 2015; Lyons et al., 2020). The amount of carbonate in the nine bulk soil samples analyzed ranges from 0.07% at Roberts Massif near the Polar Plateau to 2.5% at Taylor Nunatak further North (Table 3). δ13C values are positive for all samples, ranging from 0.2 to 8.5‰, with the exception of Bennett Platform, which has a value of −13.0‰. All δ18O values are negative and range from −38.8 to −9.6‰. One sample from Taylor Nunatak (TN1-6), noted in Table 3, yielded NO gas which froze out of the system and interfered with the δ18O analysis.
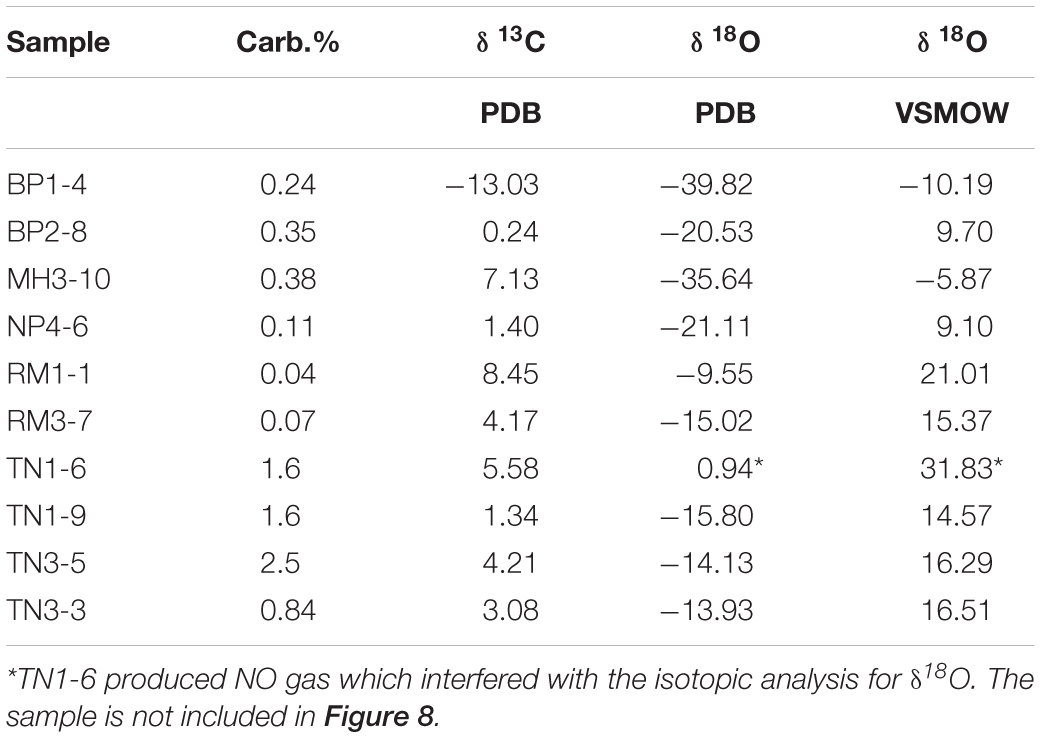
Table 3. δ 13C and δ 18O of total inorganic carbon (TIC).
Discussion
These Shackleton Glacier region data represent the highest southern latitude δ15N and Δ17O of NO3–, δ34S and δ18O of SO42–, and δ13C and δ18O of HCO3 + CO3 measurements made on soils and soil leaches. We evaluate water-soluble ion concentrations and compare the isotopic compositions to potential source reservoirs to understand the types of salts, sources of salts, and possible post-deposition alteration in remote, hyper-arid Antarctic terrestrial environments.
Water-Soluble Salt Compositions
Molar ratios of water-soluble ions and SEM images suggest that a variety of salts exist within the soils of the Shackleton Glacier region. Salt dissolution diagrams indicate that the major nitrate salt is Na(K)NO3, though some samples, such as those from the high elevation and distant locations of Roberts Massif and Schroeder Hill, have Na+ + K+ concentrations that are higher than the 1:1 dissolution line (Figure 4a). These samples likely have some Na+(K+) associated with HCO3 (forming nahcolite, trona, thermonatrite and/or sodium bicarbonate), as observed in MDV and Beardmore Glacier region (Bisson et al., 2015; Sun et al., 2015), or possibly bloedite [Na2Mg(SO4)2⋅4H2O] in addition to Na(K)-NO3, which is observed in the SEM images of Schroeder Hill (Figure 5).
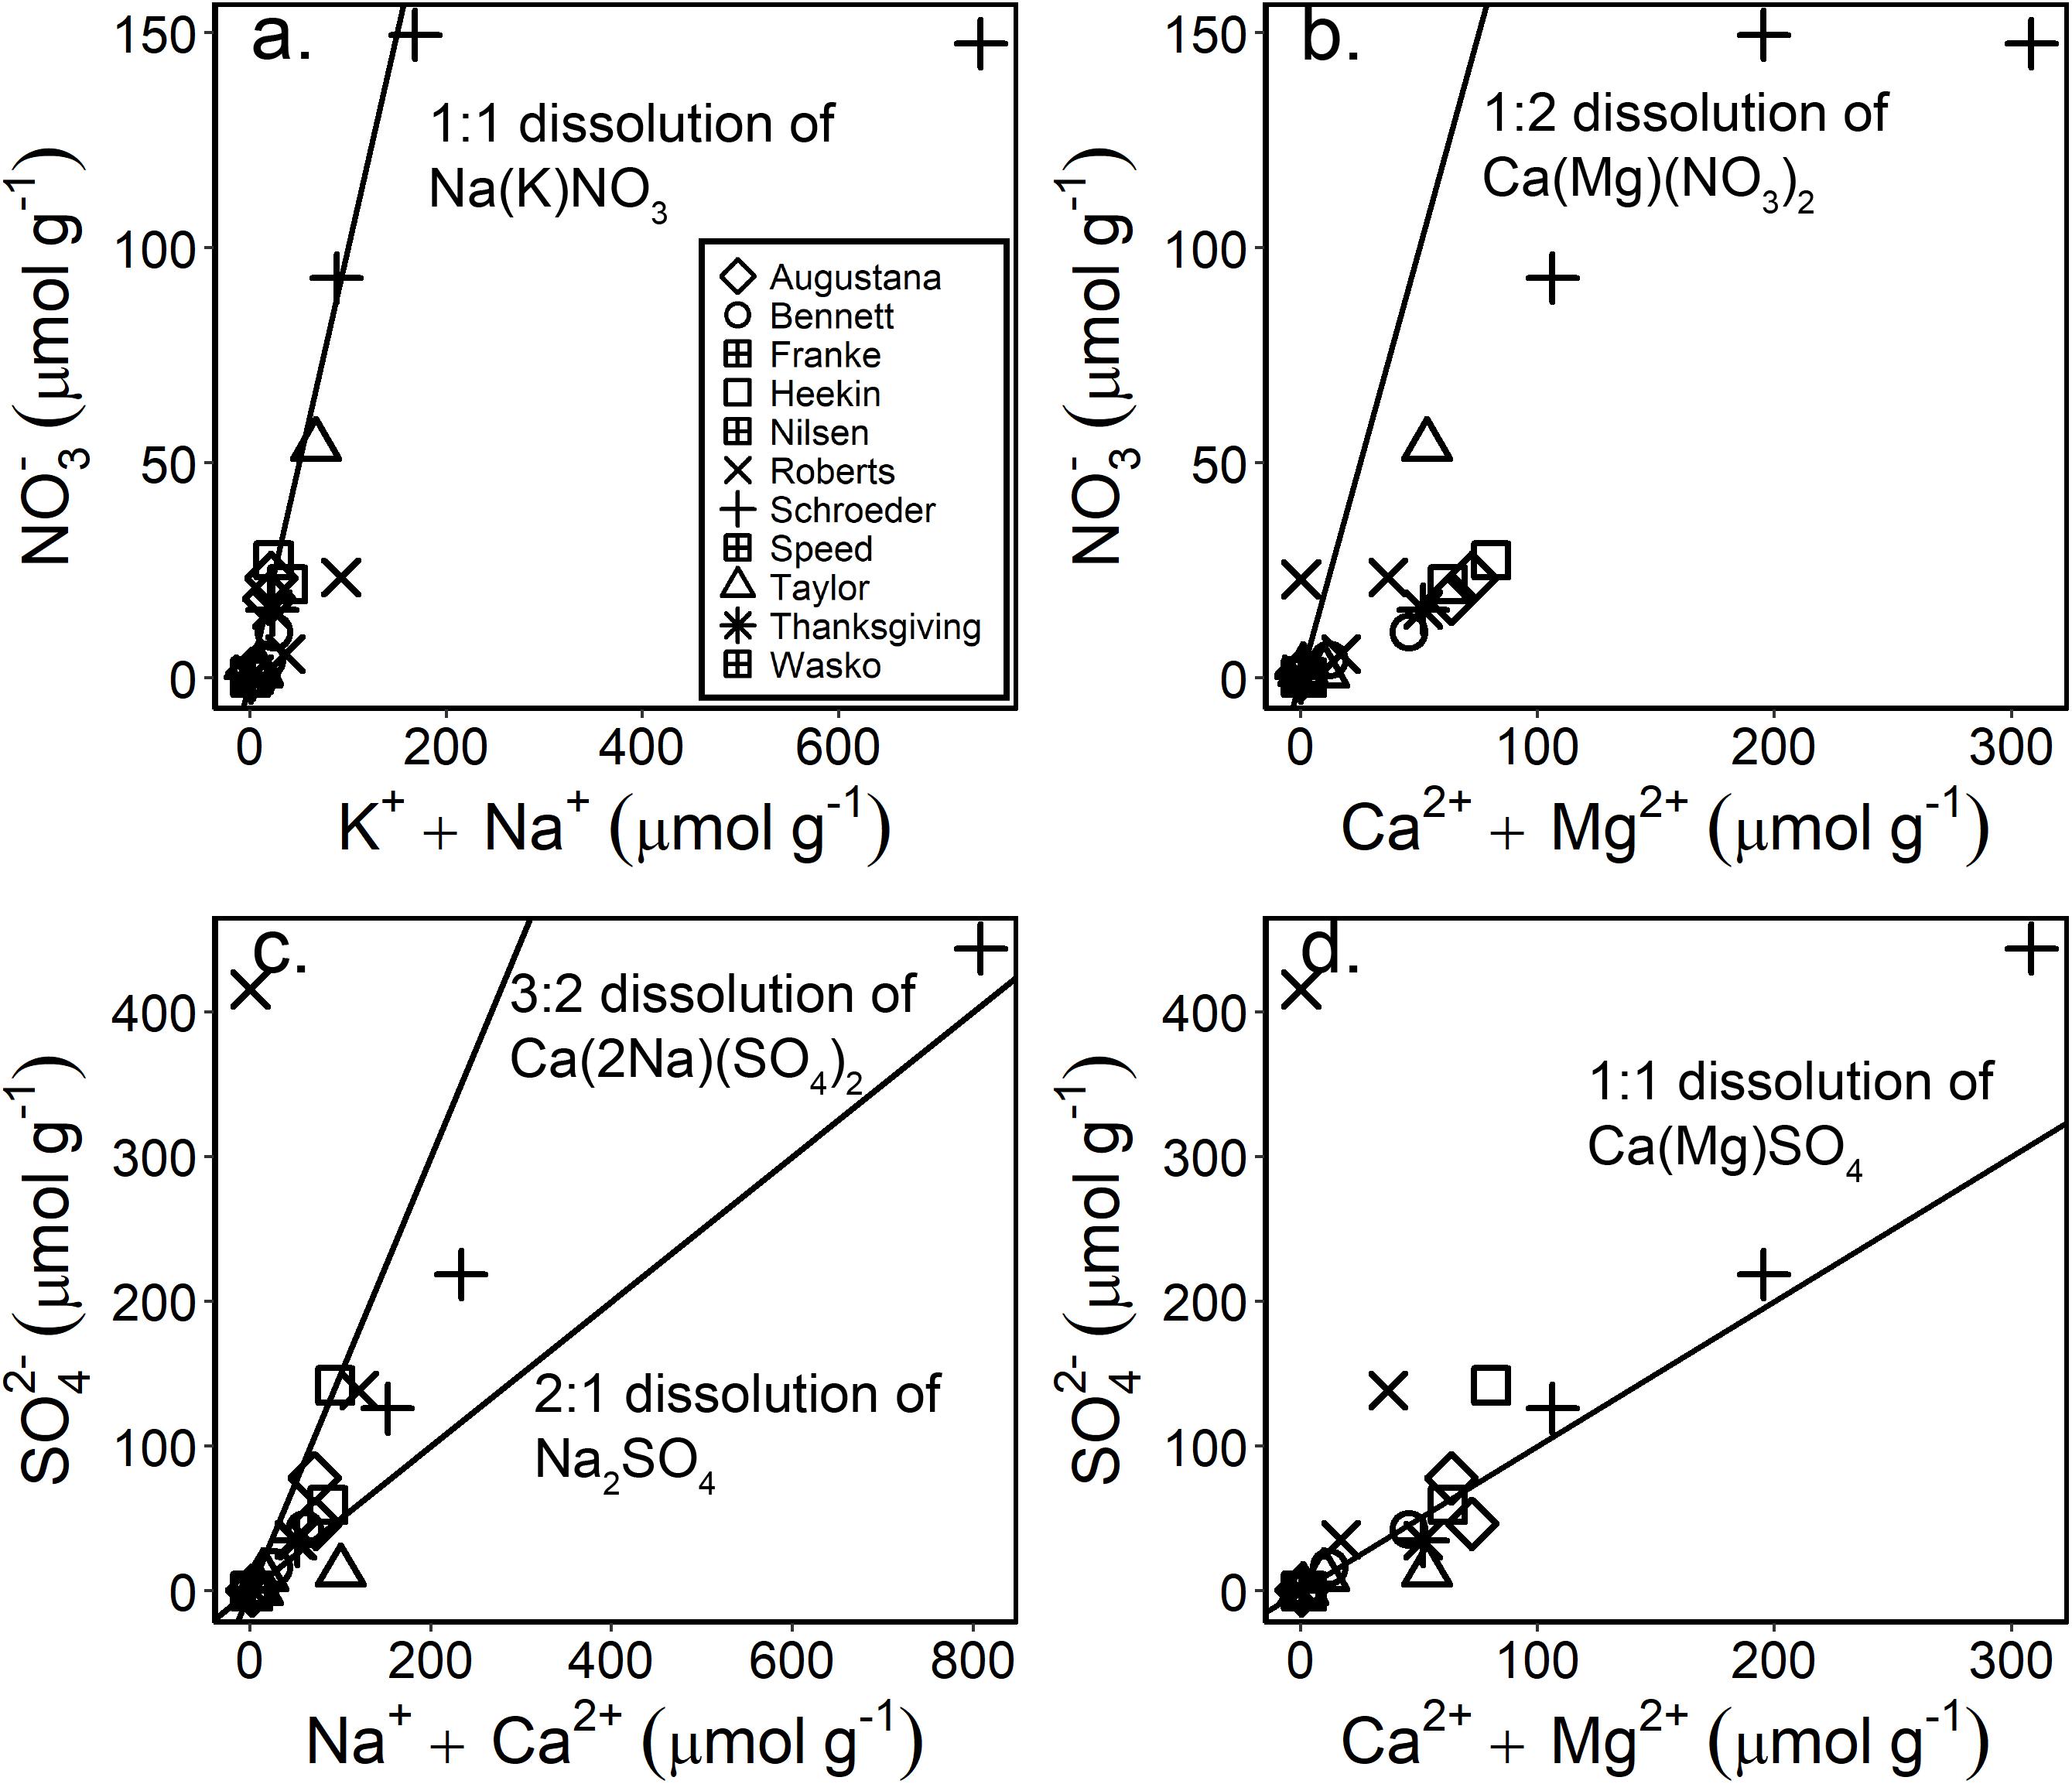
Figure 4. Salt dissolution diagrams for the major NO3– (a,b) and SO42– (c,d) salts typically observed in high latitude polar desert soils. The solid black lines are dissolution lines, suggesting that samples which fall on the lines likely have salts derived from the ions represented on the x and y axes.
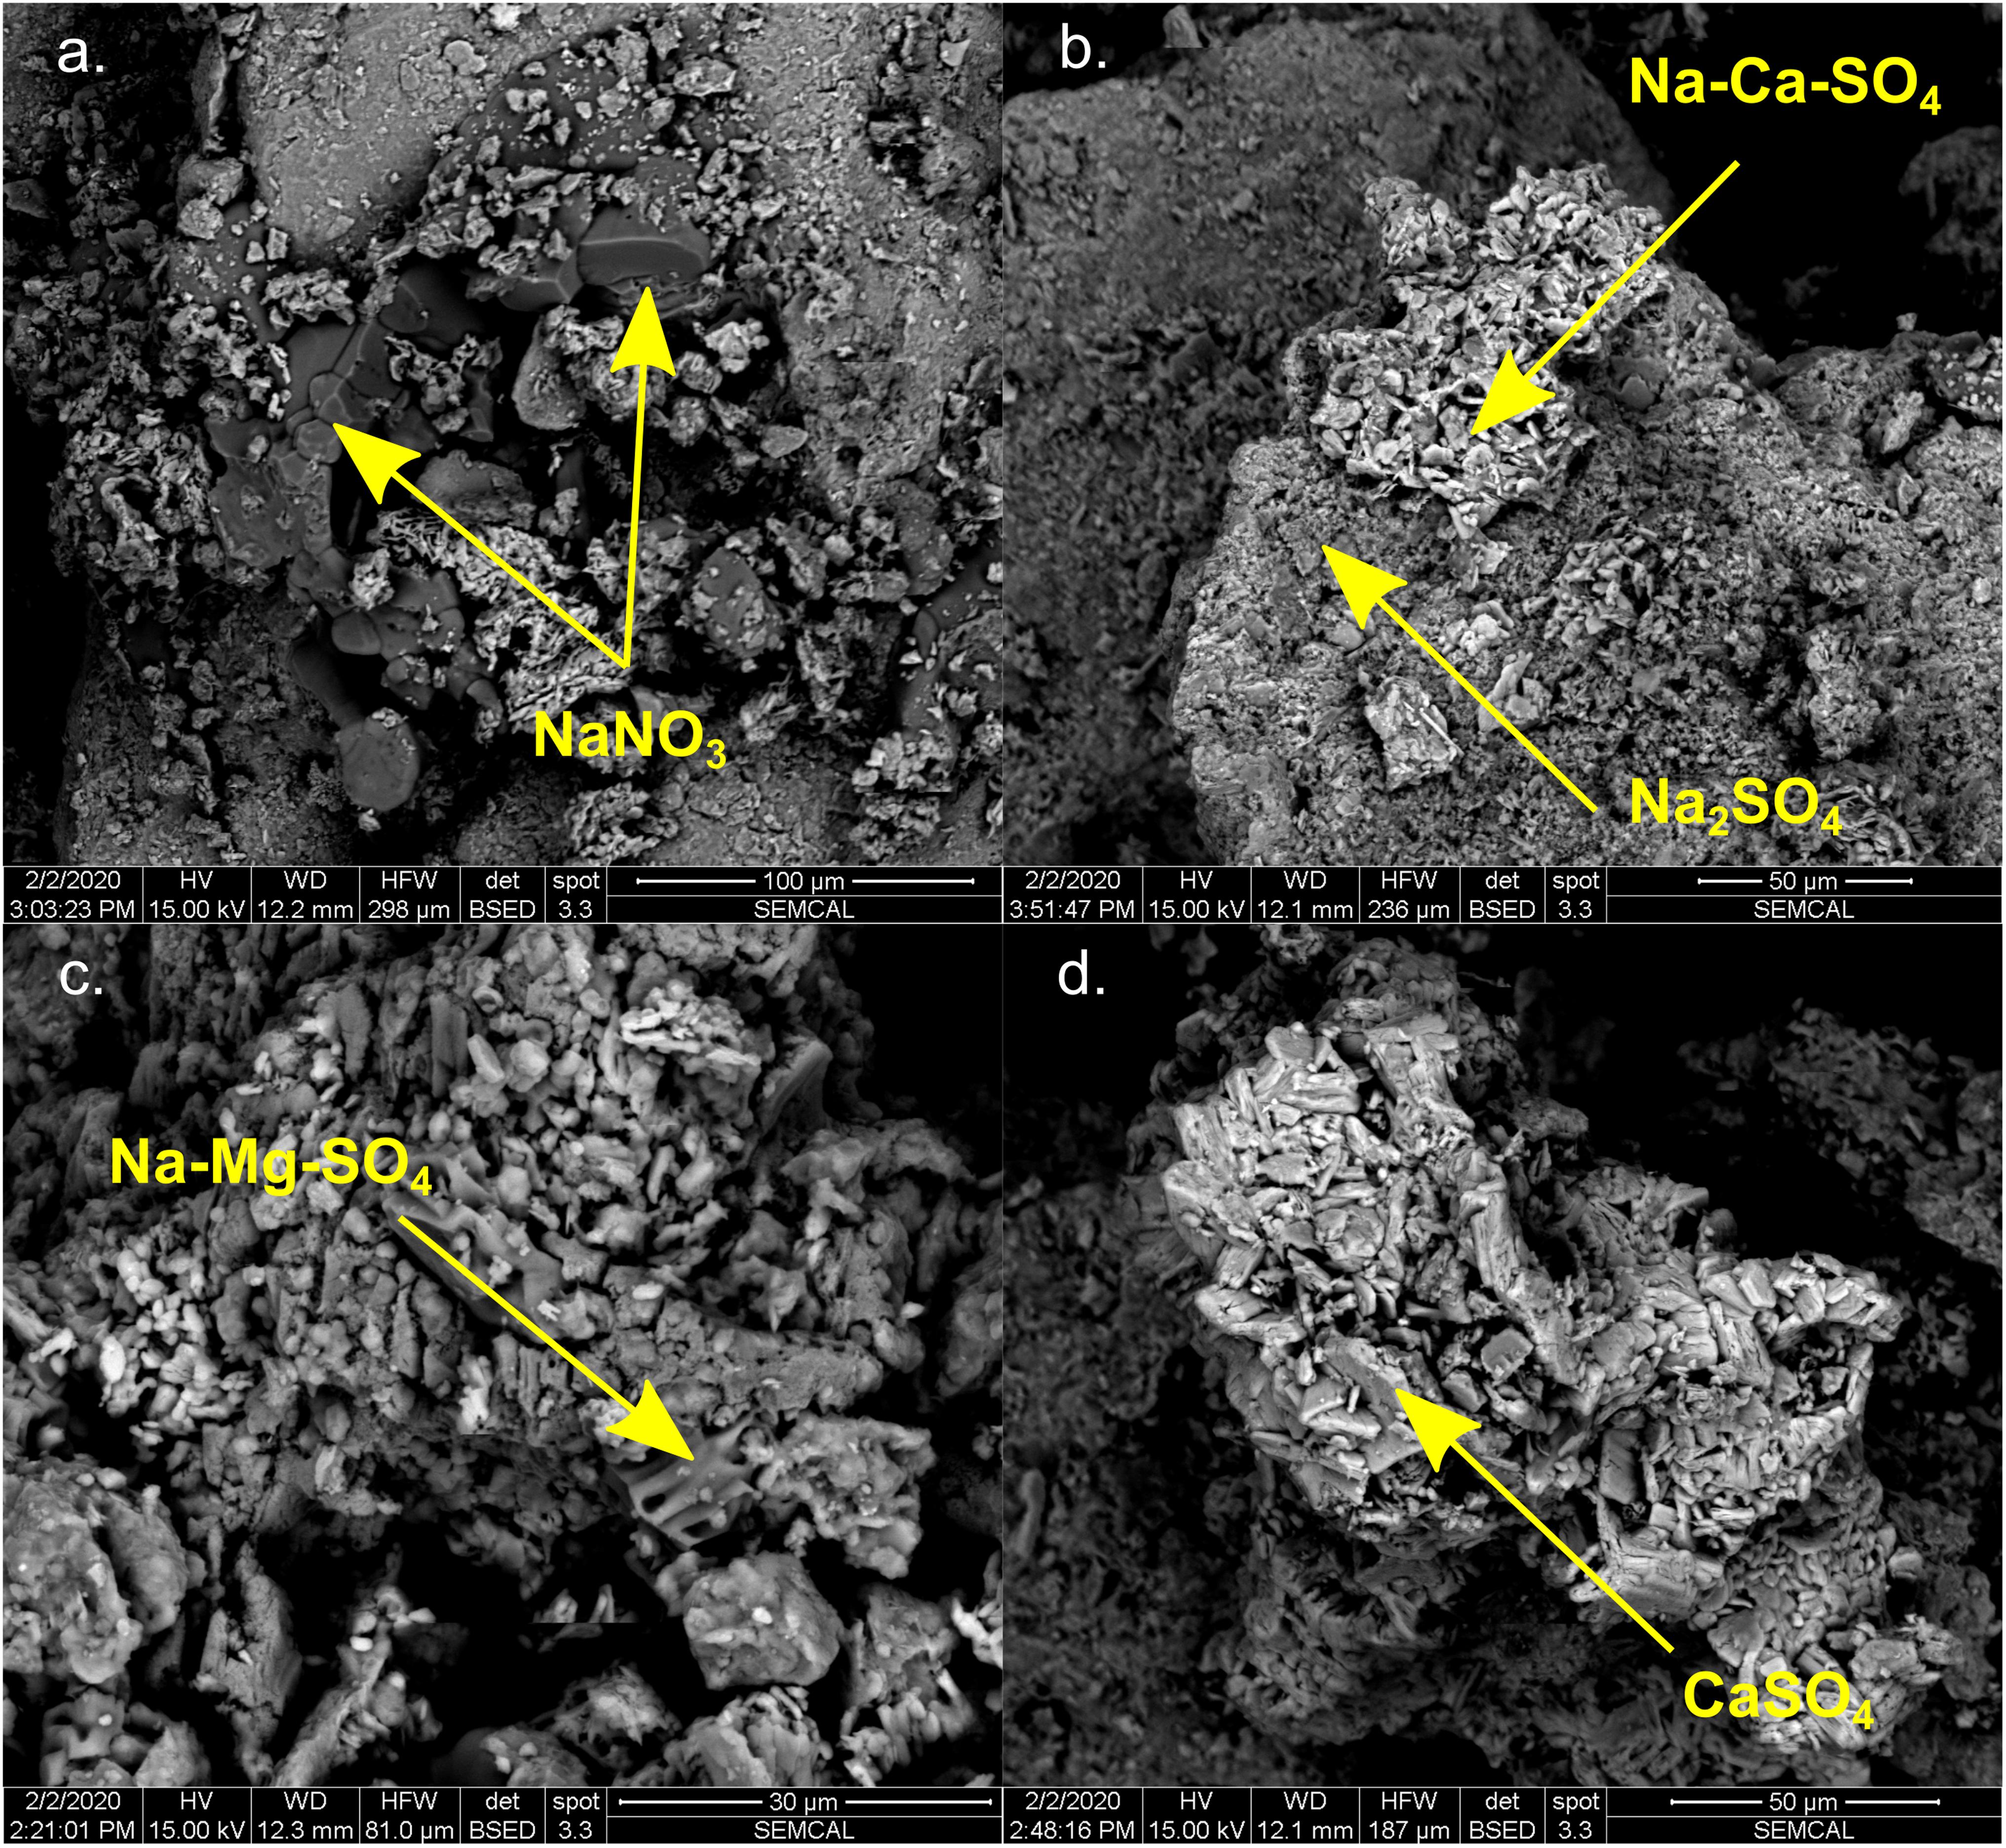
Figure 5. Scanning electron microscopy (SEM) backscatter emission (BSE) images of salt encrustations from Schroeder Hill. The salts include soda nitre (NaNO3) (a), and a variety of sodium, magnesium, and calcium sulfate salts (b–d). The chemical composition of the salts was determined by energy dispersive x-ray spectroscopy (EDX).
There appear to be a range of possible sulfate salts across the region and within individual samples. Anhydrite and/or gypsum (CaSO4 or CaSO4 ⋅ 2H2O) have been previously identified in MDV soils (Keys and Williams, 1981; Bisson et al., 2015) and some of the Shackleton samples plot on the salt dissolution line, consistent with the dissolution of Ca-SO4 salts. Mirabilite (Na2SO4⋅10H2O) and thenardite (Na2SO4), however, have also been identified in soils and aeolian material in the MDV (Keys and Williams, 1981; Bisson et al., 2015; Diaz et al., 2018) and high Na+ and SO42– concentrations which are outside the stoichiometric lines for gypsum/anhydrite are likely due to the dissolution of these salts (Figures 5c,d). The Schroeder Hill SEM images and EDX spot analysis show that SO42– from this location is likely from the dissolution of gypsum or anhydrite, epsomite (MgSO4 ⋅ 7H2O), thenardite or mirabilite, and/or glauberite [Na2Ca(SO4)2]. Mg-SO4 salts are also suggested to be abundant in Martian soils and may reflect the water content potential of the soils (Clark and Van Hart, 1981; Vaniman et al., 2004). We also identify an unusually abundant Na–Mg–SO4 salt, possibly bloedite (Na2Mg(SO4)2⋅4H2O), which, along with the other salts observed at Schroeder Hill, was previously described at Roberts Massif (Claridge and Campbell, 1968) (Figure 5). We did not observe any HCO3 and CO3 salts in the Schroeder Hill SEM images. The variability in the salt concentrations and compositions is likely due to the heterogeneous lithology of the Shackleton Glacier region, and differences in salt solubilities. While sulfate salts, such as gypsum do not readily solubilize even with multiple wetting events, nitrate salts, such as soda niter (NaNO3), are highly soluble and only form in hyper-arid soils (Toner et al., 2013). The presence of NaNO3 and Na2SO4 salts in the high elevation and inland samples indicates that these soils likely have had prolonged arid conditions.
Stratospheric and Photochemical Processes as Sources of NO3–
The δ15N and Δ17O composition of NO3– in our samples suggests that NO3– is derived primarily from the atmosphere, with a component derived from photolysis in snowpack or another post-deposition alteration process. Atmospheric NO3– has a distinct isotopic signature, with a δ15N value of 0‰ if derived from N2, or ∼−6 to 7‰, if derived from multiple N species, and Δ17O values > 15‰ (Moore, 1977; Michalski et al., 2003). However, upon deposition to the surface, δ15N values of NO3– can be altered by photolysis (the breakdown of molecules due to intense and prolonged UV radiation) and volatilization in the absence of biologic activity, which could cause δ15N to either increase or decrease depending on HNO3 equilibrium between the aqueous solution and vapor (Walters and Michalski, 2015). The range of our δ15N values suggests that the NO3– is not simply from oxidized N2.
All of the Shackleton Glacier region samples have Δ17O values > 15‰, indicating an atmospheric source (Figure 6). Positive Δ17O values are an indicator of NO3– derived from ozone and ozone-derived oxygen in the atmosphere, which has a high non-mass dependent 17O enrichment. The 17O signal is preserved in NO3– and is believed to only be altered by denitrification (Reich and Bao, 2018). However, because biological denitrification is thought to be a minor process in Antarctic soils (Cary et al., 2010), the Δ17O compositions are likely minimally altered.
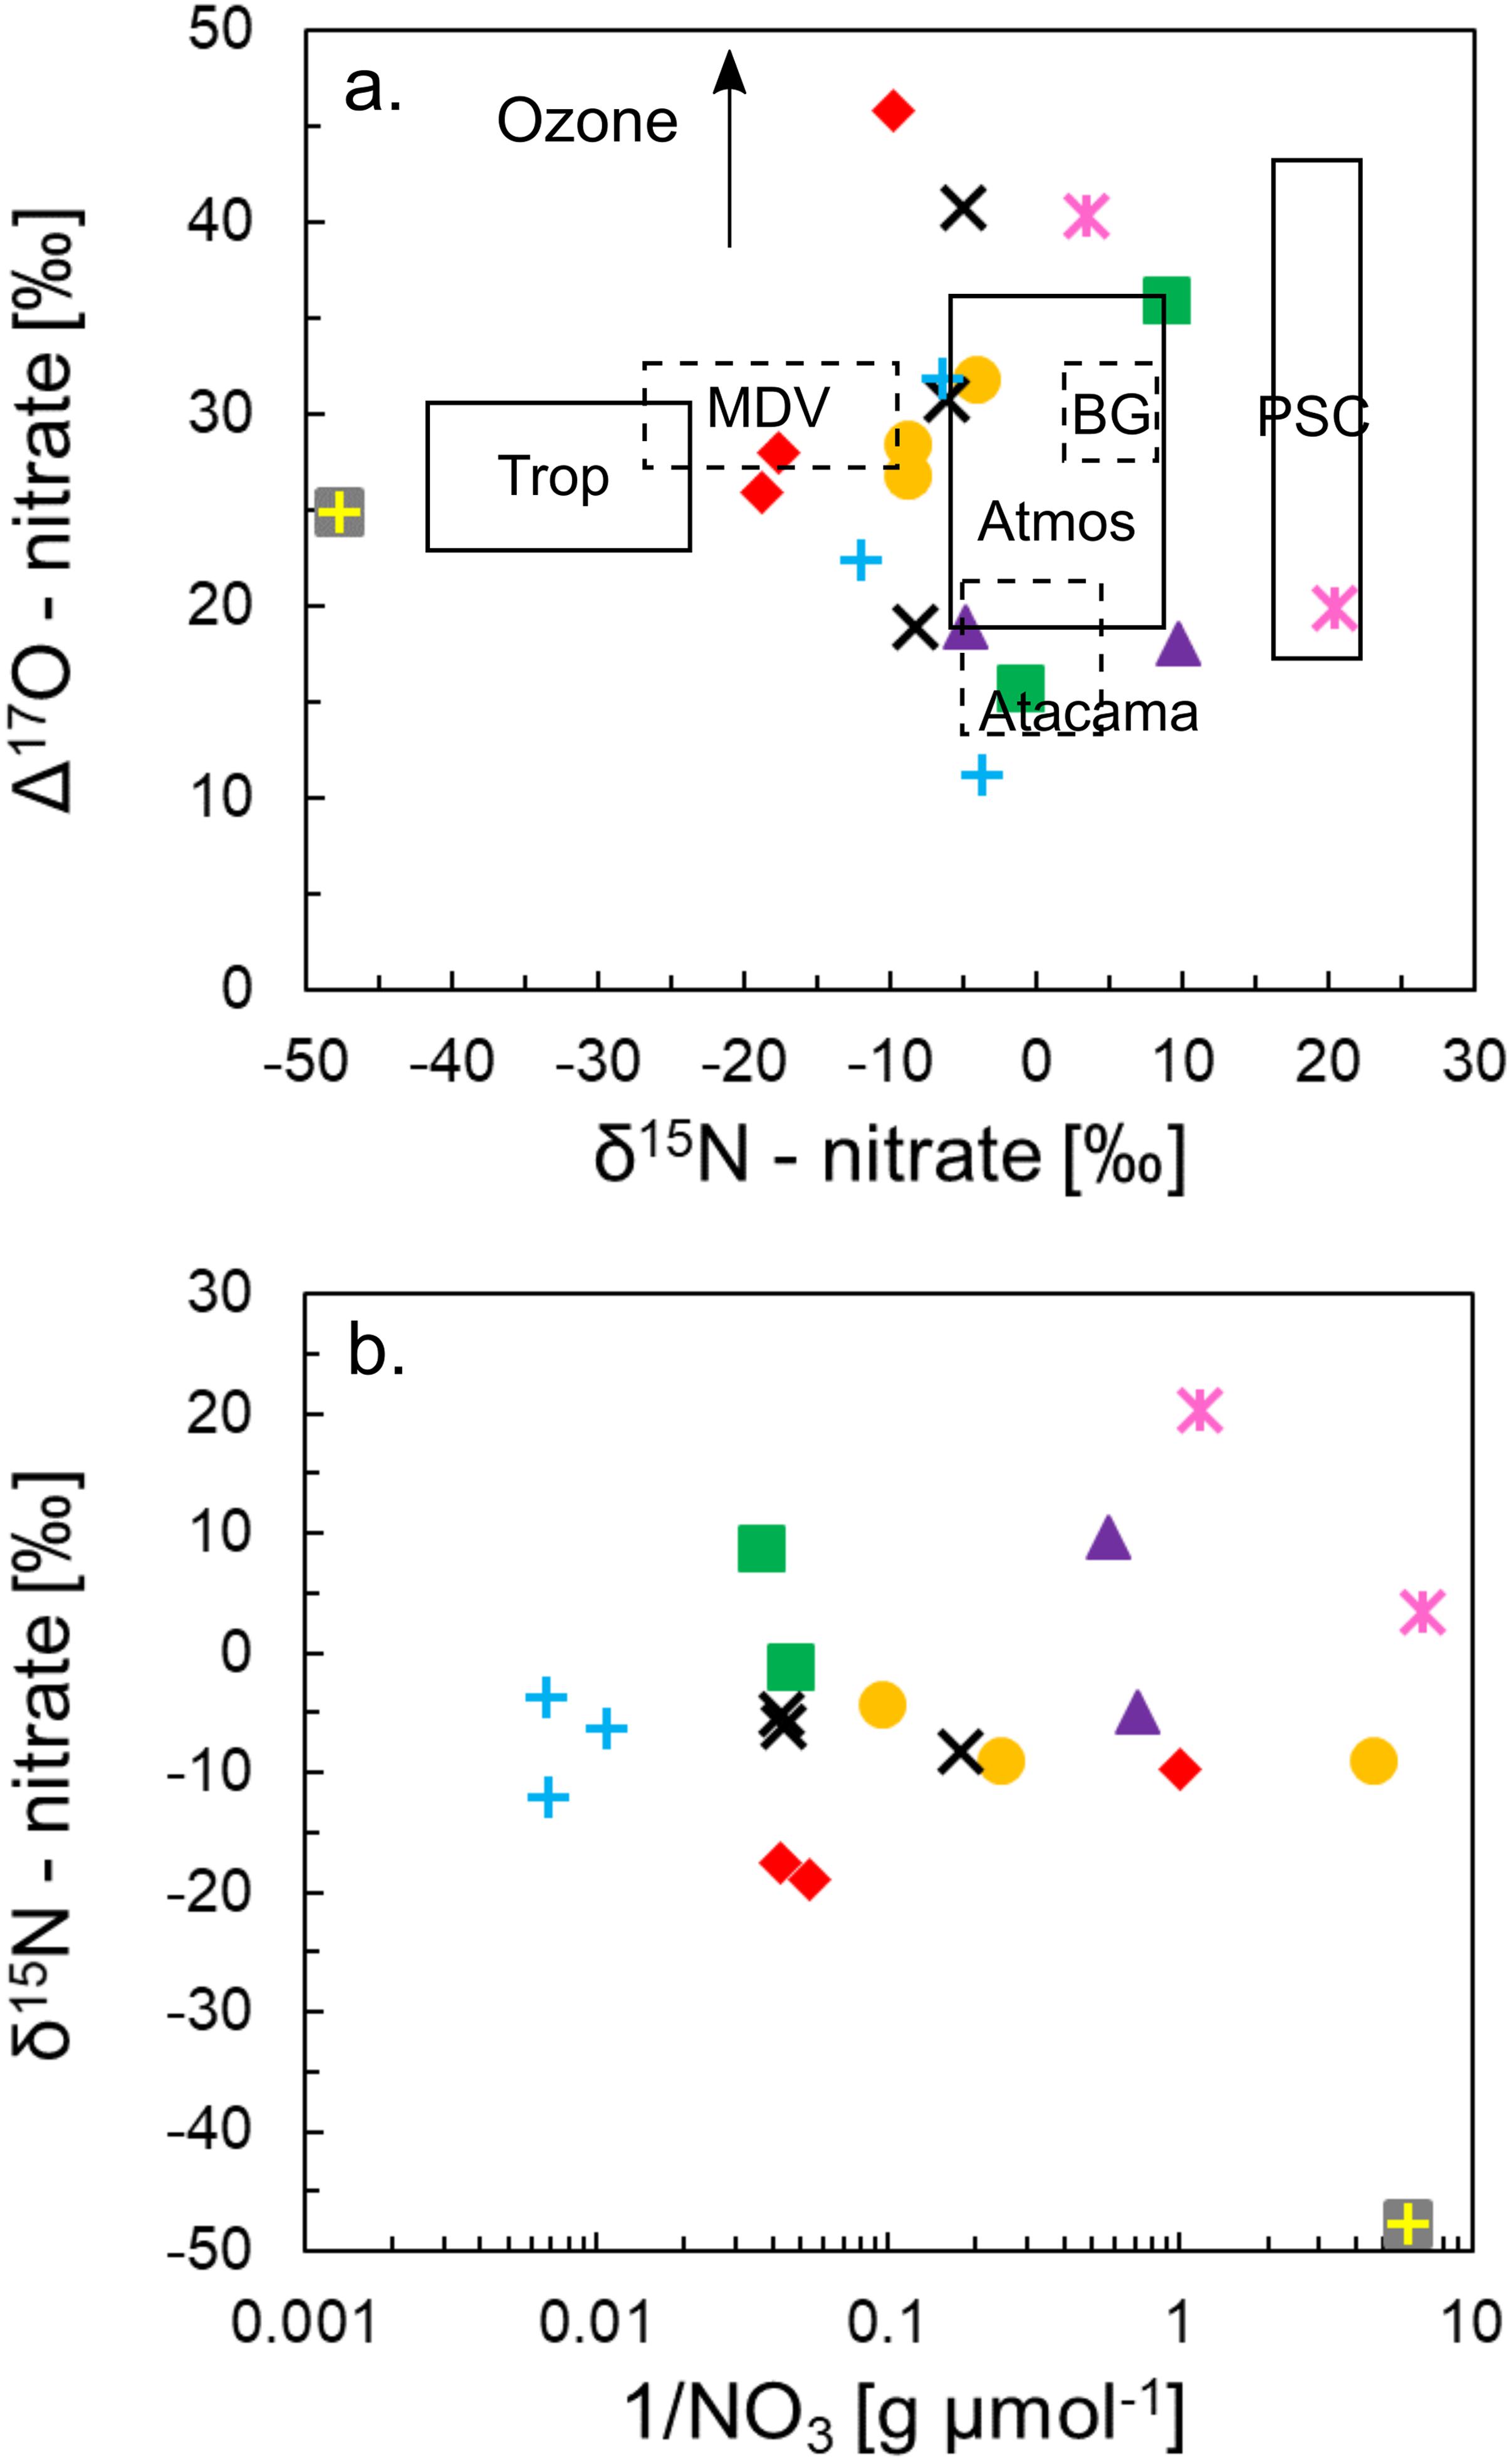
Figure 6. Isotopic composition of NO3– for Shackleton Glacier soils (a) and the variation of δ15N with inverse nitrate concentrations (b). The shapes and colors representing the different sampling locations correlate with the key in Figure 2. The solid black boxes represent the isotopic composition of NO3– from the mixed atmosphere, stratosphere [polar stratospheric clouds (PSC)], and troposphere (re-emission from snowpack) (Moore, 1977; Michalski et al., 2003; Savarino et al., 2007). The dashed boxes represent the Beardmore Glacier region (BG), McMurdo Dry Valleys (MDV), and Atacama Desert for comparison (Michalski et al., 2004, 2005; Jackson et al., 2015, 2016; Lyons et al., 2016). The black arrow indicates a potential NO3– formation pathway with higher Δ17O values from ozone.
Isotopic variations of N and O in NO3– have been previously measured in exposed sediments from the MDV and the Beardmore Glacier region to elucidate the source of NO3– to these systems. We compared the Shackleton Glacier region samples to these data, and while our isotopic values are not as well constrained, they generally plot near the MDV and Beardmore samples (Figure 6). These variations are also independent of NO3– concentration (Figure 6b). In the MDV, δ15N values ranged from −9.5 to −26.2‰ and Δ17O ranged from 28.9 to 32.7‰ (Michalski et al., 2005; Jackson et al., 2015, 2016). Further south, isotopic compositions of NO3– along the Beardmore Glacier ranged from 1.8 to 8.8‰ and 28.4 to 33.5‰ for δ15N and Δ17O, respectively (Lyons et al., 2016). Between the two locations, Δ17O values are identical, but δ15N values are not similar. The δ15N and Δ17O range for the Beardmore overlaps with measured values of atmospheric NO3– (Moore, 1977; Michalski et al., 2003) (Figure 6), and Lyons et al. (2016) suggested that approximately 50% of the NO3– was produced in the troposphere and 50% in the stratosphere based on the high Δ17O values. In other words, the NO3– in Beardmore Glacier region soils, as in the Shackleton Glacier region, is entirely atmospheric in origin and has preserved the atmosphere isotopic signature.
Post-depositional Alteration and Snowpack Emission of NO3– in Antarctica
Though the Shackleton Glacier samples are likely initially derived from the atmosphere, the δ15N values differ from the δ15N range of atmospheric NO3– (Figure 4). While not measured in this study, our data suggest that post-depositional alteration of NO3– likely occurs in CTAM soils, potentially due to photolysis or local oxidation of N species (either modern or ancient). Previous studies have used both direct measurements and theoretical models to argue that the isotopic composition of NO3– at the Antarctic surface can be affected by post-depositional fractionation processes, particularly re-emission of NOx (NO + NO2) from snowpack due to photolysis and evaporation of HNO3 (Savarino et al., 2007; Frey et al., 2009; Morin et al., 2009). Photolysis has been previously documented in glacial environments in both Greenland and Antarctica where snow accumulation rates are low (Honrath et al., 1999; Jones et al., 2001), and in photochemical experiments using snow and NO3– which show direct production of NOx when exposed to sunlight (Honrath et al., 2000). Savarino et al. (2007) estimated the emission flux of NOy [NO + NO2 + HNO3 + HONO + 2 x (N2O5), etc.] from oxidized NOx species to be ΔN = 1.2 × 10⁷ kg yr–1, which is similar to the flux from polar stratospheric clouds at ΔN = 6.3 × 10⁷ kg yr–1 (Muscari et al., 2003). In other words, photolysis and NOx emission is an important source of NO3– to the Antarctic N cycle.
Spatial and temporal variations in the δ15N composition of Antarctic snow are similar to the variability in the Shackleton Glacier soils, reflecting both stratospheric and tropospheric production of NO3–. Savarino et al. (2007) found that the composition of NO3– in coastal Antarctic snowpack was dependent on the season, where winter was dominated by deposition of NO3– from polar stratospheric clouds (δ15N ≈ 19‰) and the summer and late-spring composition was influenced by snow reemissions of NOx and HNO3 from further inland (δ15N ≈−34‰). Frey et al. (2009) measured the spatial distribution of NO3– concentrations and δ15N and Δ17O values of NO3– between the Antarctic coast and the interior. They found that δ15N values were highly positive in the interior, with values > 200‰, and highly negative on the coast, with values as low as −15‰. Frey et al. (2009) and Erbland et al. (2013) show that the δ15N-NO3– of snowpack in the interior of the continent is positive and argue that subsequent photolysis and evaporation cause gaseous loss of that NO3– as NOx. This process results in enriched δ15N in the remaining snow, and a lighter δ15N of NOx released to the atmosphere, which is later re-deposited elsewhere on the continent, including soils, as HNO3–.
It should be noted that no studies have directly investigated or measured post-depositional fractionation of δ15N and Δ17O in NO3– in Antarctic soils. Jackson et al. (2016) argued that the isotopic signature of NO3– in MDV soils is preserved and more resistant to post-depositional alteration, likely due to acid neutralization by soil carbonate minerals and limited light penetration into soils. These authors assumed that NO3– which was deposited directly on soil surfaces from the atmosphere was not influenced by volatilization, photolysis, or water exchange. Instead, they suggested that the soil δ15N values of NO3– were affected by post-depositional alteration when overlain by ephemeral snow and near glaciers due to photolysis in the snowpack, as supported by decreasing δ15N values further from the glacier. We do not observe a trend of decreasing δ15N values further from snow and ice in our samples. However, considering the range of δ15N values and positive Δ17O values along the Shackleton Glacier, we hypothesize that our samples contain a mixture of NO3– produced in the stratosphere (sedimentation from polar stratospheric clouds, oxidation of NOx by ozone) and the troposphere (oxidation of HNO3 by ozone, snowpack remission, and long range transport of gases and aerosols), both of which could be affected by evaporation and photolysis upon deposition on soils.
Estimating the Atmospheric Contribution of NO3– to Shackleton Glacier Region Soils
Production, transport and alteration of NO3– in soils requires further investigation to effectively determine the relative fraction of NO3– derived from both stratospheric and tropospheric sources. However, we estimate the fluxes from the two reservoirs following conceptual and theoretical models from Savarino et al. (2007), Frey et al. (2009), and Erbland et al. (2015). Our data suggest that for inland locations in Antarctica, NO3– is deposited from the stratosphere onto the surface of the EAIS and soils of the TAM, and initially maintains a stratospheric signal (typically δ15N near 0‰ and δ17O > 15‰). Intense UV radiation induces photolysis and mobilization of HNO3 plus other reduced N species, especially in snow, which are later re-oxidized by tropospheric ozone and re-introduced to the surface through wet and dry deposition. This mechanism is further supported by results from Jackson et al. (2016), who found that δ15N values in soils from the MDV were similar to values from aerosols near Dumont d’Urville in the coastal Antarctic (Savarino et al., 2007).
A simple mixing model using Equations 1 and 2 can be solved to determine the relative fractions of the different atmospheric sources to the Shackleton soils. In Equation 1, the δ15N composition of NO3– is derived from the fractions (f) of δ15N from the stratosphere (strat), photolytic emission from snowpack to the troposphere [trop(emit)], and post-depositional processes (post-dep). Post-depositional alteration of NO3– is still poorly understood in soils, but over prolonged periods of exposure, we anticipate that the modern influence on isotopic composition would be minimal. Therefore, we simplify the Equation 1 and assume that stratospheric deposition and emission to the troposphere (followed by redeposition) are the primary sources of NO3– in Equation 2. We use end-member values of δ15N ≈ 19‰ for deposition from polar stratospheric clouds to represent the stratospheric deposition and δ15N ≈−34‰ for NO3– species liberated by photolysis to represent tropospheric deposition (Savarino et al., 2007). Solving these equations, we estimate between 30 and 100% of NO3– is from the stratosphere and up to 70% is from the troposphere, with the exception of one sample from Nilsen Peak which appears entirely derived from the troposphere (Table 4). Slightly negative fraction values for Nilsen Peak and Thanksgiving Valley are likely due to minor variations in the source isotopic compositions. However, Mt. Speed has an anomalously low δ15N value of −47.8‰, which cannot be explained by our simple model.
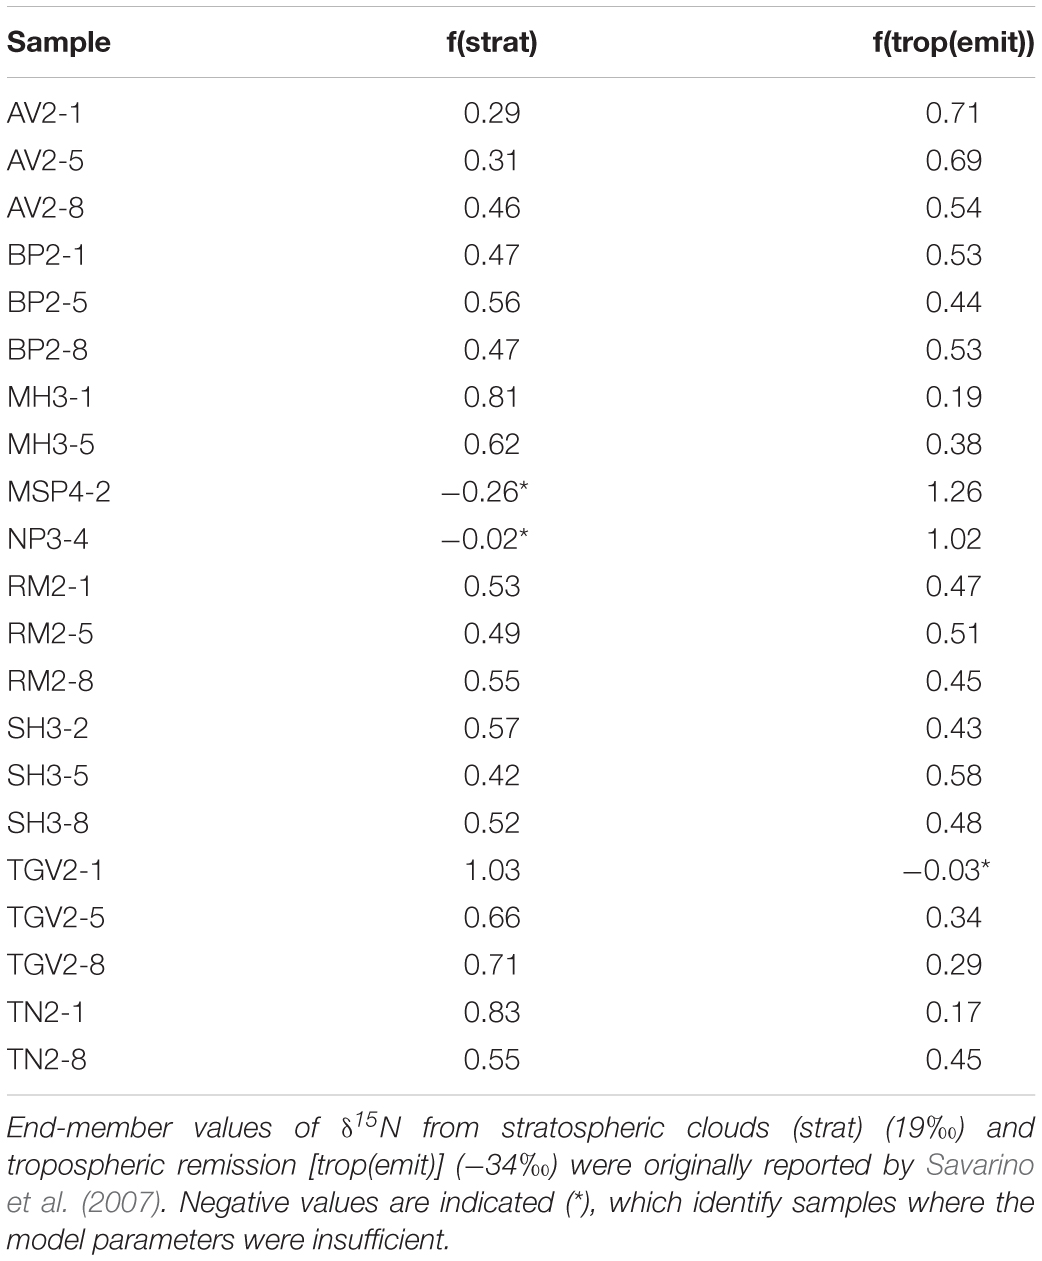
Table 4. Two-component mixing model to determine relative contributions of different sources of NO3–.
Primary and Secondary Atmospheric, and Chemical Weathering Derived SO4–
Sulfide Weathering as a Source of SO42–
The δ34S and δ18O isotopic values of SO42– indicate that sulfide weathering is likely a minor source of SO42– to the Shackleton Glacier region compared to other sources, such as atmospheric deposition. Though the δ18O values are similar between the sulfide end-member and the Shackleton soil leaches, the Shackleton δ34S values are greater (Figure 7). This is probably due to the low abundance of sulfide minerals in the local lithology since the δ34S signature is preserved during sulfide weathering (Balci et al., 2007).
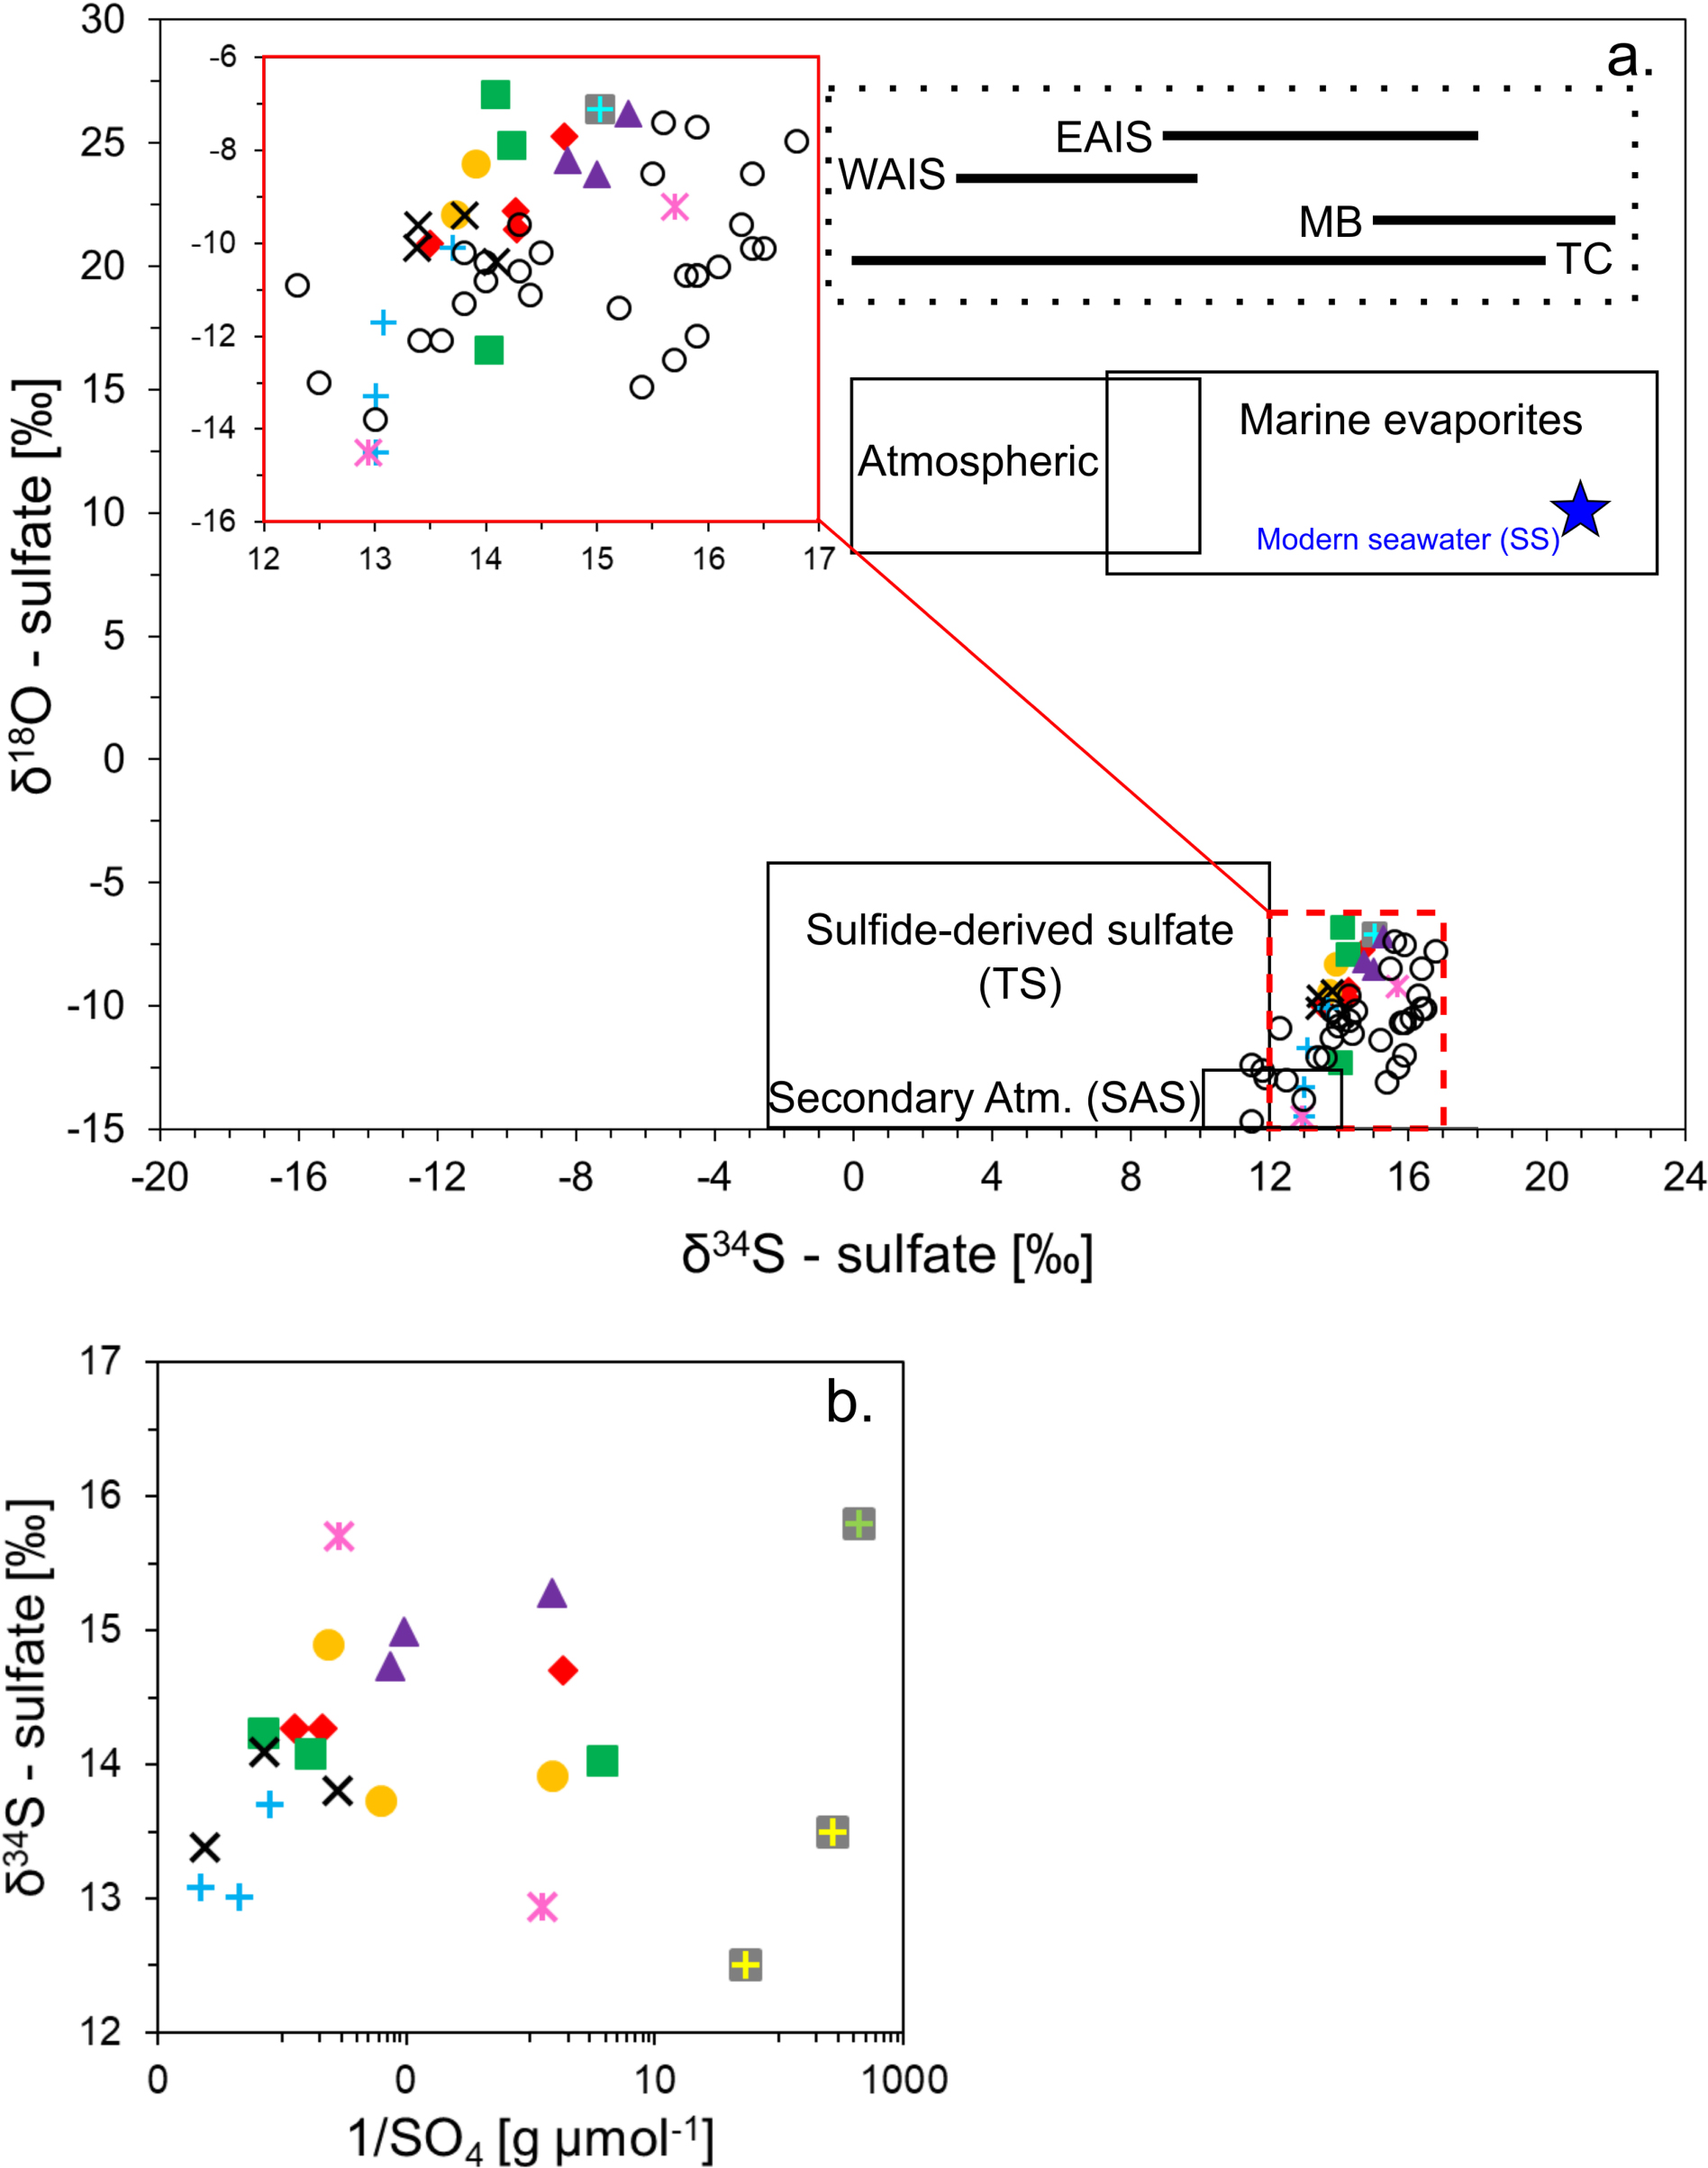
Figure 7. Isotopic composition of SO42– (a) and the variation of δ34S with inverse sulfate concentrations (b). The shapes and colors representing the different sampling locations correlate with the key in Figure 2. The clear circles represent MB11 samples (Asgard Tills) from the McMurdo Dry Valleys (Bao and Marchant, 2006). The solid red box shows the distribution of the samples at a higher resolution. The solid and dotted black boxes represent potential SO42– sources and the blue star is the SO42– isotopic composition of modern seawater (Holser and Kaplan, 1966; Faure and Felder, 1981; Calhoun and Chadson, 1991; Legrand et al., 1991; Alexander et al., 2003; Pruett et al., 2004; Jonsell et al., 2005; Bao and Marchant, 2006; Baroni et al., 2008; Tostevin et al., 2014).
In sedimentary rocks, sulfide is almost exclusively found as the mineral pyrite (FeS2). Pyrite has been observed and characterized in the metasandstone of both Bowers Terrane (Molar Formation and Pyrite Pass) and Robertson Bay Terrane near the MDV. Further South, till found on Mt. Sirius in the Beardmore Glacier region contained detrital pyrite, which is likely the major source of pyrite for the TAM (Hagen et al., 1990). Tills of the Sirius Group can be found throughout much of the TAM at high and low elevations, but along the Shackleton Glacier the till was most abundant at Roberts Massif and Bennett Platform, with smaller outcrops observed at Schroeder Hill (Hambrey et al., 2003). Pyrite-bearing tills have been identified in these regions, but their distributions and isotopic compositions are variable (Holser and Kaplan, 1966; Balci et al., 2007; Pisapia et al., 2007; Bao, 2015).
The SO42– isotopic composition of the Shackleton soils is not reflective of a predominately pyrite source. Sulfur sequential extractions were performed on seven samples representing the range of elevations, local lithology, and glacial histories found along the Shackleton Glacier to investigate pyrite weathering as a potential source of S. Percentages of acid-soluble sulfate and Cr-reducible sulfide (i.e., pyrite) were generally low for nearly all samples with less than 0.5 and 0.003% (∼150 to 1 μmol-S g–1), respectively (Table 5). Concentrations of acid-soluble sulfate were of sufficient mass for δ34S analysis only for the high elevation and further inland locations of Roberts Massif, Mt. Augustana and Schroeder Hill. Interestingly, the acid-soluble δ34S values are only 0.2–0.3‰ higher than the water-soluble δ34S values, which is within our analytical error. We suggest that this extractable phase may be primarily from gypsum/anhydrite dissolution in acid and therefore is of a common source with the water-soluble SO42– since the acid extraction solubilizes both the water and acid soluble constituents. For the Cr-reducible phase, S concentrations were sufficient for δ34S analysis for two samples, Mt. Heekin and Nilsen Peak. These δ34S values are more negative than both the water-soluble and acid-soluble values at −2.3 and 12.1‰. As a comparison, Sirius Group tills had δ34S values ranging from −1.4 to +3.1‰, representing an isotopic composition similar to elemental sulfur (S0), though it is well-known that sedimentary sulfides are isotopically variable (Hagen et al., 1990).
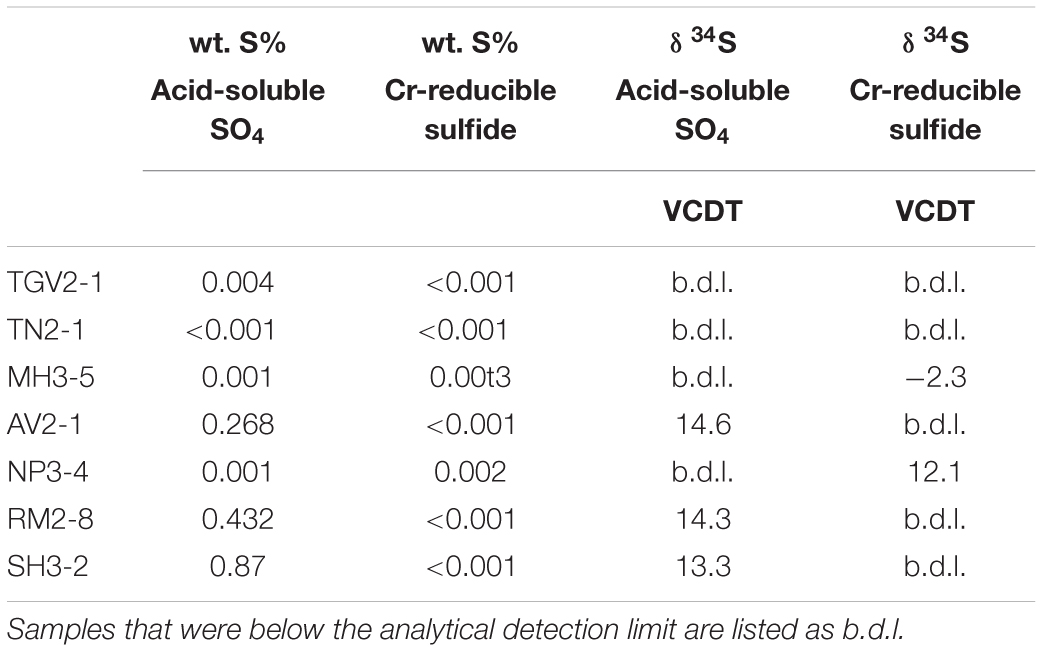
Table 5. Sulfur sequential extractions on bulk sediment and δ34S values associated with each fraction.
Our data show that some Shackleton Glacier region soils contain sulfide (likely as pyrite), however, sulfide weathering is unlikely to be a major source of SO42–. The concentrations of water-soluble SO42– in our samples are as high as 450 μmol g–1, while most samples had sulfide concentrations too low for analysis (<0.001% or 0.3 μmol-S g–1). Though Mt. Heekin had quantifiable sulfide, the concentration was only 0.003% (∼1 μmol-S g–1), compared to 0.19% (∼50 μmol-S g–1) for water-soluble S. Unless the sulfide reservoirs were at least 100x greater in the past and experienced complete oxidation, the majority of our SO42– was derived from another source, likely the atmosphere as we proposed previously. Additionally, the distinct trends between SO42– concentrations and isotopic composition with elevation, distance from the coast, and distance from the nearest glacier suggest that similar processes are controlling SO42– formation throughout the region. Finally, the δ34S values of the Cr-reducible sulfide from Mt. Heekin and Nilsen Peak are too negative to explain the isotopic composition of the water-soluble SO42–. All the available information suggest that chemical weathering of pyrite may occur in some Shackleton Glacier region soils, but it is a minor process and is overwhelmed by an atmospheric source.
Atmospheric Sulfate as the Primary Source of SO42–
We used end-member values of δ34S and δ18O for non-sea salt secondary atmospheric sulfate (SAS) (δ34S = 12.0‰, δ18O = −16.0‰), sea salt sulfate (SS) (δ34S = 22‰, δ18O = 10‰), and terrestrial sulfate from sulfides (TS) (δ34S = 5‰, δ34S = −20‰) reported by Bao and Marchant (2006) to estimate the contributions of each source to the Shackleton Glacier region soils. We solved a three-component mixing model (Equations 3–5) for the fractions of SAS, SS, and TS comprising the observed SO42– isotopic composition. With the exception of one sample from Mt. Heekin, the SO42– in our samples appears predominately derived from an SAS source, followed by SS, and lastly TS (Table 6). In particular, the higher elevation and furthest inland locations, such as Schroeder Hill and Roberts Massif, have the highest contributions from SAS (>70%). These results are similar to those from high and inland locations in the MDV (Bao and Marchant, 2006). Though the isotopic composition of most samples can be explained by a combination of the three end members, our simple model was not sufficient for two Thanksgiving Valley samples and three additional samples from Mt. Heekin, Taylor Nunatak, and Schroeder Hill, probably due to unaccounted variability in the values for the SAS and TS end-members. As stated in section “Sulfide Weathering as a Source of SO42–,” the sulfide isotopic composition in terrestrial systems is highly variable, but the least constrained end-member is likely SAS.
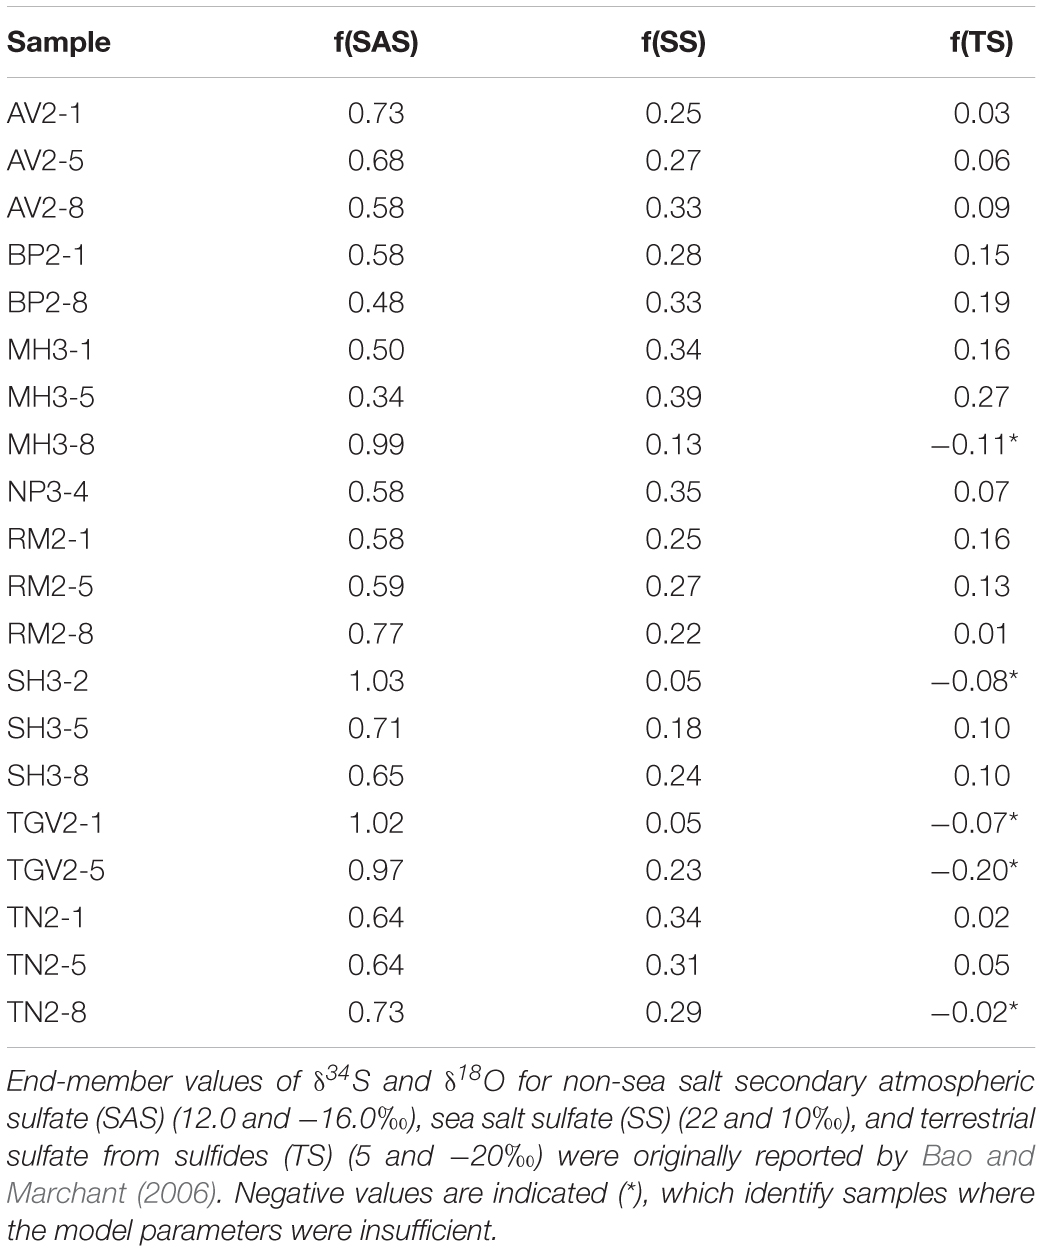
Table 6. Three-component mixing model to determine relative contributions of different sources of SO42–.
SAS can have a large range of δ34S, δ18O, and Δ17O values due to differences in the initial source of S and the chemical composition of the oxidizing compounds. Sulfur gases in the atmosphere (SO2) are derived from volcanic emissions, DMS oxidation from the ocean, and anthropogenic emissions. The latter is thought to comprise the least important source for Antarctica. SO2 can be oxidized by both ozone and H2O2 to form SAS in the troposphere and stratosphere, where the oxygenic isotopic transfer is one oxygen (0.25) and two oxygen (0.5) of the total four oxygen atoms in SO42– for ozone and H2O2, respectively, which produces a positive Δ17O anomaly in SO42– and a wide range of δ 18O values (Savarino et al., 2000; Uemura et al., 2010; Bao, 2015). Additionally, SAS can be produced in the stratosphere by photolysis of carbonyl sulfide (COS), the most abundant sulfur gas in the atmosphere, and by SO2 oxidation by OH radicals, which also produce positive Δ17O anomalies (Kunasek et al., 2010; Brühl et al., 2012). Though we could not determine the Δ17O composition of the Shackleton Glacier region SO42–, we suspect Δ17O would be positive and similar to the MDV and Beardmore Glacier region (Bao et al., 2000; Bao and Marchant, 2006; Sun et al., 2015). Future measurements of Δ17O in SO42– would provide additional evidence for SAS accumulation in CTAM soils.
Accumulation of Secondary Atmospheric Sulfate (SAS) and Wetting History
The relatively small variability in δ34S values indicates that the SO42– in the Shackleton Glacier region is derived from a common, large-scale source, such as the atmosphere. Additionally, when compared to the concentrations of SO42– in the water leaches, δ34S does not vary systematically indicating that the variability is not due to differences in source, but instead from varying accumulation periods (Figure 7b).
Though exposure ages have yet to be determined for these areas in the Shackleton Glacier region, modeling studies have shown that the height of the Shackleton Glacier was probably higher than current levels during the LGM (MacKintosh et al., 2011; Golledge et al., 2013), and likely inundated much of the currently ice-free areas near the Ross Ice Shelf. While these surfaces were inundated, some soils closer to the Polar Plateau may have been ice-free and would have accumulated salts from the atmospheric deposition of SAS. When the EAIS retreated in the late Pleistocene/early Holocene, the recently exposed soils could begin accumulating salts again. The small variations in δ34S values likely reflect isotopic changes of SAS through time due to changes in volcanic activity and DMS and/or MSA production, and changes in the concentrations of ozone, OH, COS, and H2O2 in the atmosphere, as reflected in the wide-range of values for Antarctic background sources in Figure 7a (Legrand et al., 1991; Bao, 2015). The variability in δ18O values is possibly due to the removal of 18O during atmospheric transport, changes in temperature, changes in the ocean isotopic composition during glacial and interglacial periods, and/or differences in the relative abundance of oxidizing atmospheric compounds. However, without the ability to decipher the difference between contemporary and paleo SO42– deposits, these mechanisms remain speculative.
Cryogenic Carbonate Mineral Formation and Isotope Equilibrium
Pedogenic carbonates in Antarctic soils are thought to be formed by authigenesis in the presence of liquid water. It is assumed that Ca2+ ions for carbonate formation are derived from the weathering of Ca-rich aluminosilicate minerals, the dissolution of primary calcite within the soils, and/or calcium associated with aeolian dust (Lyons et al., 2020). In solution, carbonate minerals are precipitated during dissolved Ca-HCO3/CO3 saturation when the ion activity product is greater than the solubility product. In polar region soils, this typically occurs during evaporation/sublimation or cryoconcentration due to freezing of soil solutions or films (Courty et al., 1994; Vogt and Corte, 1996; Burgener et al., 2018).
The isotopic composition of HCO3 + CO3 in the Shackleton Glacier region bulk soil samples suggests that the carbonate is originally formed by cryogenic processes, such as rapid freezing and evaporation/sublimation, with possible kinetic isotope effects (KIE) (Figure 8). Previous studies have shown that the formation of authigenic calcite deposits is controlled by dissolved CO2 concentrations and carbonate alkalinity of Ca-HCO3 solutions (Nezat et al., 2001; Neumann et al., 2004; Lacelle et al., 2006; Lacelle, 2007; Burgener et al., 2018). The δ13C and δ18O isotopic composition of carbonate minerals is dependent on the isotopic composition and temperature of the formation fluid when in equilibrium with both the fluid and atmosphere (Lacelle, 2007). Further, the δ18O isotopic composition of the fluid is influenced by evaporation/sublimation, which depletes the fluid of the lighter oxygen isotope, and freezing, which incorporates the heavier isotope in ice (Jouzel and Souchez, 1982). However, during rapid dehydration, freezing, and carbonate dissolution, KIE can result in temperature-independent fractionation and isotopically variable carbonate species (Clark and Lauriol, 1992; Skidmore et al., 2004; Burgener et al., 2018).
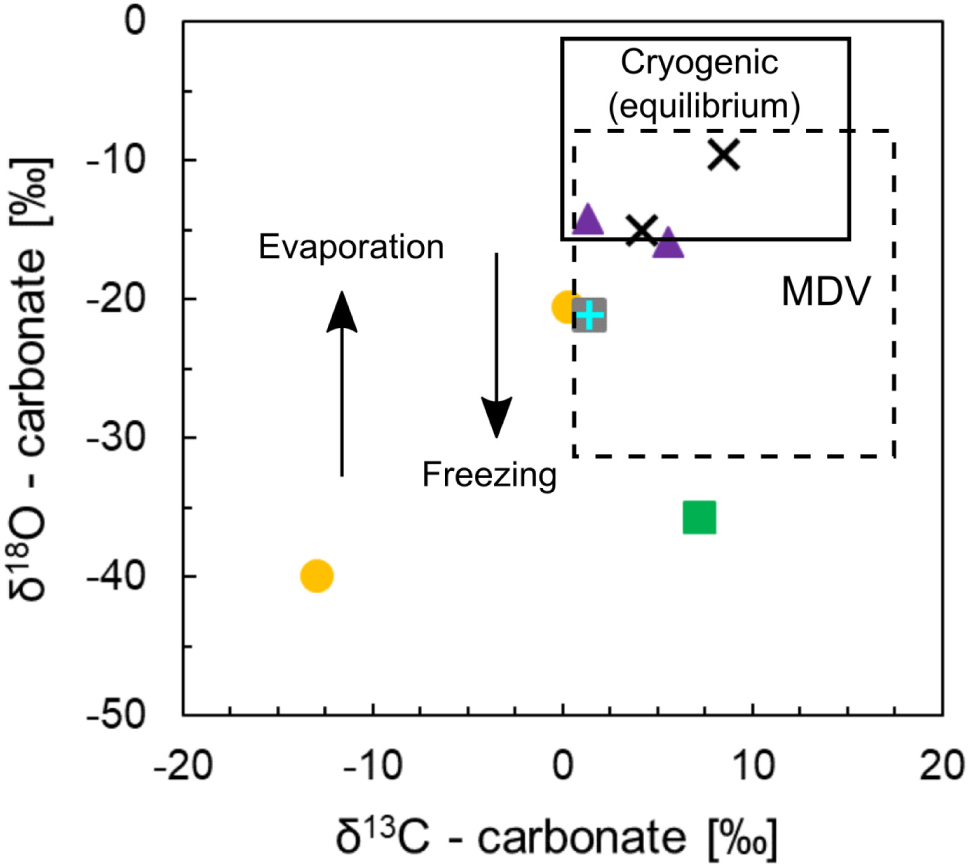
Figure 8. Isotopic composition of total inorganic carbon (HCO3 + CO3) for Shackleton Glacier soils. δ13C and δ18O are reported in terms of VPDB. The shapes and colors representing the different sampling locations correlate with the key in Figure 2. The solid black box represents the composition of cryogenic carbonates formed in equilibrium with the source fluid and atmosphere (slow process). The arrows represent the direction of δ18O fractionation with rapid freezing and evaporation/sublimation, and the dashed box represents samples from the McMurdo Dry Valleys (MDV) for comparison (Nakai et al., 1975; Lacelle et al., 2006; Lacelle, 2007; Burgener et al., 2018; Lyons et al., 2020).
Previous studies have measured the isotopic composition of soil carbonate minerals from the MDV and have elucidated the formation mechanisms for cryogenic carbonates (see Lacelle, 2007). In summary, isotopic values of soil carbonate in Taylor and Victoria Valleys in the MDV ranged from 6.73 to 11.02‰ for δ13C and −8.13 to −20.34‰ for δ18O (VPDB) (Burgener et al., 2018; Lyons et al., 2020). Nakai et al. (1975) measured δ13C and δ18O of carbonate coatings on rocks in the Lake Vanda Basin, MDV, and their δ13C values ranged from 1.5 to 17.6‰ while their δ18O ranged from −9.2 to −31.2‰ (VPDB). Lacelle (2007) argued that the Lake Vanda basin carbonates were cryogenic in origin, forming from bicarbonate dehydration and subsequent CO2 degassing in isotopic disequilibrium. Disequilibrium during rapid evaporation/sublimation or freezing results in more positive δ13C and δ18O values relative to equilibrium carbonate formation (Clark and Lauriol, 1992; Lacelle et al., 2007). Using a clumped isotope method, Burgener et al. (2018) arrived at similar conclusions regarding disequilibrium during carbonate formation. The authors suggested that negative Δ47 (notation from clumped isotopes of mass 47) with positive δ18O anomalies, and positive δ13C values with respect to equilibrium were consistent with cryogenic calcite formation and KIE from CO2 degassing during bicarbonate dehydration. Additionally, δ13C values from Taylor Valley carbonates, which were sampled as mineral coatings on rocks, were near 7.4‰ indicating an atmospheric origin of CO2 (Lyons et al., 2020), and were similar to the values reported by Burgener et al. (2018).
The Shackleton samples are generally within the range of δ13C for cryogenic carbonate in equilibrium with the atmosphere (Figure 8) (Lacelle et al., 2006; Lacelle, 2007). Since we collected surface samples (up to 5 cm at depth), the carbonates were formed under conditions allowing for rapid exchange of CO2. However, some samples have lower δ18O values, possibly due to KIE, and rapid freezing and evaporation/sublimation. As stated previously, the formation of carbonate minerals in soils from rapid evaporation/sublimation of glacial meltwater results in a relatively heavier δ18O signature compared to the ice isotopic composition (Lacelle et al., 2006; Lyons et al., 2020). While the isotopic composition of ice in the Shackleton Glacier region is unknown, due to its distance inland, we expect δ18O values ∼ -45‰ (Mayewski et al., 1990; Gooseff et al., 2006). Evaporation/sublimation carbonate formation from this water may explain the relatively more positive δ18O values in the Shackleton soils compared to glacial ice. Most of our data can be explained by these mechanisms, but one sample from Bennett Platform and a second from Mt. Heekin have highly negative δ18O values, and the Bennett Platform sample is the only sample we measured with a negative δ13C value (Figure 8). These outliers demonstrate the need for more geochemical data from CTAM ice-free areas to definitively elucidate carbonate formation and kinetics in ice-free Antarctic environments.
Conclusion
Ice-free areas from the Shackleton Glacier region, Antarctica represent polar desert environments that have been modified throughout the Cenozoic, which is reflected in the variable salt geochemistry. Along a transect moving inland and up in elevation along the Shackleton Glacier toward the Polar Plateau, water-soluble salt concentrations increased, and the dominant salt species also changed. Near the Ross Ice Shelf, Cl– was the dominant salt, while NO3– and SO42– were more abundant further inland. High NO3– and SO42– concentrations are likely associated with soda niter (NaNO3), anhydrite or gypsum (CaSO4 or CaSO4 ⋅ 2H2O), epsomite (MgSO4 ⋅ 7H2O), thenardite or mirabilite (Na2SO4 or Na2SO4 ⋅ 10H2O) and glauberite (Na2Ca(SO4)2). We also identified abundant Na–Mg–SO4 salts at Schroeder Hill, potentially bloedite.
The δ15N and Δ17O isotopic composition of NO3– indicated that NO3– is primarily derived from the atmosphere, with varying contributions from the troposphere (0–70%) and stratosphere (30–100%). Neither δ15N nor Δ17O exhibited trends with elevation, distance from the coast of the Ross Ice Shelf, or distance from the glacier. We argue that post-depositional alteration of NO3–, potentially due to photolysis or volatilization, likely occurs in CTAM soils and possibly explains the variability in the NO3– isotopic composition. However, the occurrence and degree of soil photolysis of NO3– is unknown and requires further investigation.
Results from a three-component mixing model suggested that SO42– in Shackleton Glacier region soils was predominately deposited as secondary atmospheric sulfate (SAS) and derived from the oxidation of SO2, H2S, and/or dimethyl sulfide by H2O2, COS, and ozone in the atmosphere. While there is evidence to suggest that some SO42– was produced by the weathering of pyrite and other sulfide minerals, the atmospheric source was likely much more important, especially in soils which have been exposed for prolonged periods at higher elevations and near the Polar Plateau.
While SO42– and NO3– were primarily derived from atmospheric deposition, carbonate minerals were formed at the surface as cryogenic carbonate. Based on the δ13C and δ18O values of soil total inorganic carbon (TIC), we conclude that both equilibrium and disequilibrium occur through slow and rapid evaporation/sublimation or freezing of fluids. Disequilibrium between the fluid and the precipitated carbonate resulted in the negative δ18O values observed due to bicarbonate dehydration.
Our analysis and interpretation of the isotopic composition of NO3–, SO42–, and HCO3 + CO3 show that atmospheric deposition and chemical weathering at the soil surface are important for salt formation in Antarctica. While NO3– and SO42– are both oxyanions and thought to maintain their isotopic composition post-formation, post-depositional processes, such as volatilization and photolysis, may alter both N and O in NO3–, while SO42– appears less affected by these processes. As a result, the isotopic composition of NO3– can potentially be used to constrain NO3– recycling in soils, SO42– can be used as an indicator of past atmospheric oxidation processes, and carbonate can be used to understand current and past availability of water. We suggest that similar processes likely occur(ed) for other hyper-arid environments in the CTAM and Mars.
Data Availability Statement
All datasets generated for this study are included in the article/Supplementary Material.
Author Contributions
BA, DW, IH, NF, and WL designed and funded the project. BA, DW, IH, NF, and MD conducted the fieldwork. JL, GM, and MD analyzed the samples for N and O isotope ratios in nitrate. MD prepared the samples for S and O isotopic analysis in sulfate. TD and MD analyzed the samples for C and O isotope ratios in carbonate. SW, CG, and MD analyzed the samples for water-soluble ions. MD wrote the manuscript with contributions and edits from all authors. All authors contributed to the article and approved the submitted version.
Funding
This work was funded by NSF OPP grants (1341631, 1341618, 1341629, and 1341736) awarded to WL, DW, NF, and BA, the NSF GRFP fellowship (60041697) awarded to MD, the International Association of Geochemistry (IAGC) Student Research Grant awarded to MD, and the Geological Society of America (GSA) Student Research Grant awarded to MD.
Conflict of Interest
The authors declare that the research was conducted in the absence of any commercial or financial relationships that could be construed as a potential conflict of interest.
Acknowledgments
Many thanks to the United States Antarctic Program (USAP), the Antarctic Science Contractors (ASC), the Petroleum Helicopters Inc. (PHI), and Dr. Marci Shaver-Adams for logistical and field support. We especially thank Dr. Anna Szynkiewicz at The University of Tennessee, Knoxville for her generous time, resources, and assistance with the sulfate isotope analysis. Additionally, we gratefully acknowledge Daniel Gilbert for help with initial laboratory analyses at The Ohio State University, the Stable Isotope Lab directed by Dr. Robert Gregory and John Robbins at Southern Methodist University for assistance in the carbonate analysis, and the Subsurface Energy Materials Characterization & Analysis Laboratory (SEMCAL) and Dr. David Cole at The Ohio State University for the usage of the SEM. Geospatial support for this work provided by the Polar Geospatial Center under NSF-OPP awards 1043681 and 1559691. We appreciate the thoughtful comments and suggests from two reviewers, which have improved this manuscript.
Supplementary Material
The Supplementary Material for this article can be found online at: https://www.frontiersin.org/articles/10.3389/feart.2020.00341/full#supplementary-material
References
Alexander, B., Thiemens, M. H., Farquhar, J., Kaufman, A. J., Savarino, J., and Delmas, R. J. (2003). East Antarctic ice core sulfur isotope measurements over a complete glacial-interglacial cycle. J. Geophys. Res. Atmos. 108:4786. doi: 10.1029/2003jd003513
Altabet, M. A., Wassenaar, L. I., Douence, C., and Roy, R. (2019). A Ti(III) reduction method for one-step conversion of seawater and freshwater nitrate into N 2 O for stable isotopic analysis of 15 N/14 N, 18 O/16 O and 17 O/16 O. Rapid Commun. Mass Spectrom. 33, 1227–1239. doi: 10.1002/rcm.8454
Anderson, J. B., Shipp, S. S., Lowe, A. L., Wellner, J. S., and Mosola, A. B. (2002). The Antarctic ice sheet during the last glacial maximum and its subsequent retreat history: a review. Quat. Sci. Rev. 21, 49–70. doi: 10.1016/S0277-3791(01)00083-X
Balci, N., Shanks, W. C., Mayer, B., and Mandernack, K. W. (2007). Oxygen and sulfur isotope systematics of sulfate produced by bacterial and abiotic oxidation of pyrite. Geochim. Cosmochim. Acta 71, 3796–3811. doi: 10.1016/j.gca.2007.04.017
Bao, H. (2015). Sulfate: a time capsule for Earth’s O. Chem. Geol. 395, 108–118. doi: 10.1016/j.chemgeo.2014.11.025
Bao, H., Campbell, D. A., Bockheim, J. G., and Thiemens, M. H. (2000). Origins of sulphate in Antarctic dry-valley soils as deduced from anomalous 17O compositions. Nature 407, 499–502. doi: 10.1038/35035054
Bao, H., and Marchant, D. R. (2006). Quantifying sulfate components and their variations in soils of the McMurdo Dry valleys. Antarctica. J. Geophys. Res. 111:D16301. doi: 10.1029/2005JD006669
Baroni, M., Savarino, J., Cole-dai, J., Rai, V. K., and Thiemens, M. H. (2008). Anomalous sulfur isotope compositions of volcanic sulfate over the last millennium in Antarctic ice cores. J. Geophys. Res. 113, 1–12. doi: 10.1029/2008JD010185
Bishop, J. L., Englert, P. A. J., Patel, S., Tirsch, D., Roy, A. J., Koeberl, C., et al. (2015). Mineralogical analyses of surface sediments in the Antarctic dry valleys: coordinated analyses of raman spectra, reflectance spectra and elemental abundances. Philos. Trans. R. Soc. 372:20140198. doi: 10.1098/rsta.2014.0198
Bisson, K. M., Welch, K. A., Welch, S. A., Sheets, J. M., Lyons, W. B., and Levy, A. (2015). Patterns and processes of salt efflorescences in the McMurdo region, Arctic, Antarct. Alp. Res. 47, 407–425. doi: 10.1657/AAAR0014-024
Bockheim, J. G., and McLeod, M. (2013). Glacial geomorphology of the Victoria valley system, ross sea region, Antarctica. Geomorphology 193, 14–24. doi: 10.1016/j.geomorph.2013.03.020
Brühl, C., Lelieveld, J., Crutzen, P. J., and Tost, H. (2012). The role of carbonyl sulphide as a source of stratospheric sulphate aerosol and its impact on climate. Atmos. Chem. Phys. 12, 1239–1253. doi: 10.5194/acp-12-1239-2012
Burgener, L. K., Huntington, K. W., Sletten, R., Watkins, J. M., Quade, J., and Hallet, B. (2018). Clumped isotope constraints on equilibrium carbonate formation and kinetic isotope effects in freezing soils. Geochim. Cosmochim. Acta 235, 402–430. doi: 10.1016/j.gca.2018.06.006
Calhoun, J. A., and Chadson, R. J. (1991). Sulfur isotope measurements of submicrometer sulfate aerosol particles over the Pacific Ocean. Geophys. Res. Lett. 18, 1877–1880. doi: 10.1029/91gl02304
Campbell, I. B., Claridge, G. G. C., Campbell, D. I., and Balks, M. R. (2013). “The Soil Environment of the Mcmurdo Dry valleys, Antarctica,” in Ecosystem dynamics in a polar desert; the McMurdo Dry Valleys, Antarctica, ed. J. C. Priscu (Cham: Springer), 297–322. doi: 10.1029/ar072p0297
Cary, S. C., McDonald, I. R., Barrett, J. E., and Cowan, D. A. (2010). On the rocks: the microbiology of Antarctic dry valley soils. Nat. Rev. Microbiol. 8, 129–138. doi: 10.1038/nrmicro2281
Claridge, G. G. C., and Campbell, I. B. (1968). Soils of the shackleton glacier region, queen maud range, Antarctica, New Zealand. J. Sci. 11, 171–218.
Claridge, G. G. C., and Campbell, I. B. (1977). Salts in Antarctic soils, their distribution and relationship to soil processes. Soil Sci. 123, 377–384. doi: 10.1097/00010694-197706000-00006
Clark, B. C., and Van Hart, D. C. (1981). The salts of Mars. Icarus 45, 370–378. doi: 10.1016/0019-1035(81)90041-90045
Clark, I. D., and Lauriol, B. (1992). Kinetic enrichment of stable isotopes in cryogenic calcites. Chem. Geol. 102, 217–228. doi: 10.1016/0009-2541(92)90157-Z
Courty, M. A., Marlin, C., Dever, L., Tremblay, P., and Vachier, P. (1994). The properties, genesis and environmental significance of calcitic pendents from the High Arctic (Spitsbergen). Geoderma 61, 71–102. doi: 10.1016/0016-7061(94)90012-90014
Diaz, M. A., Adams, B. J., Welch, K. A., Welch, S. A., Opiyo, S. O., Khan, A. L., et al. (2018). Aeolian material transport and its role in landscape connectivity in the McMurdo Dry Valleys, Antarctica. J. Geophys. Res. Earth Surf. 123, 3323–3337. doi: 10.1029/2017JF004589
Elliot, D. H., and Fanning, C. M. (2008). Detrital zircons from upper permian and lower triassic victoria group sandstones, Shackleton Glacier region, Antarctica: evidence for multiple sources along the Gondwana plate margin. Gondwana Res. 13, 259–274. doi: 10.1016/j.gr.2007.05.003
Erbland, J., Savarino, J., Morin, S., France, J. L., Frey, M. M., and King, M. D. (2015). Air-snow transfer of nitrate on the East Antarctic Plateau-Part 2: an isotopic model for the interpretation of deep ice-core records. Atmos. Chem. Phys 15, 12079–12113. doi: 10.5194/acp-15-12079-12015
Erbland, J., Vicars, W. C., Savarino, J., Morin, S., Frey, M. M., Frosini, D., et al. (2013). Air-snow transfer of nitrate on the East Antarctic Plateau – Part 1: isotopic evidence for a photolytically driven dynamic equilibrium in summer. Atmos. Chem. Phys. 13, 6403–6419. doi: 10.5194/acp-13-6403-2013
Faure, G., and Felder, R. P. (1981). Isotopic composition of stronium and sulfur in secondary gypsum crystals, Brown Hills, Transantarctic Mountains. J. Geochemical Explor. 14, 265–270. doi: 10.1038/201599b0
Frey, M. M., Savarino, J., Morin, S., Erbland, J., and Martins, J. M. F. (2009). Photolysis imprint in the nitrate stable isotope signal in snow and atmosphere of East Antarctica and implications for reactive nitrogen cycling. Atmos. Chem. Phys. Atmos. Chem. Phys. 9, 8681–8696. doi: 10.5194/acp-9-8681-2009
Golledge, N. R., Levy, R. H., McKay, R. M., Fogwill, C. J., White, D. A., Graham, A. G. C., et al. (2013). Glaciology and geological signature of the Last glacial maximum Antarctic ice sheet. Quat. Sci. Rev. 78, 225–247. doi: 10.1016/j.quascirev.2013.08.011
Gooseff, M. N., Berry Lyons, W., McKnight, D. M., Vaughn, B. H., Fountain, A. G., and Dowling, C. (2006). A stable isotopic investigation of a polar desert hydrologic system, McMurdo Dry Valleys, Antarctica, Arctic, Antarct. Alp. Res. 38, 60–71. doi: 10.1657/1523-0430(2006)038[0060:asiioa]2.0.co;2
Hagen, E. H., Koeberl, C., and Faure, G. (1990). “extraterrestrial spherules in glacial sediment, beardmore glacier area, transantarctic mountains,” in Contributions to Antarctic Research I, Antarctic Research Series, ed. D. H. Elliot (Washington, DC: American Geophysical Union), 19–24. doi: 10.1029/ar050p0019
Hambrey, M. J., Webb, P. N., Harwood, D. M., and Krissek, L. A. (2003). Neogene glacial record from the Sirius group of the shackleton glacier region, central Transantarctic Mountains, Antarctica. GSA Bull. 115, 994–1015. doi: 10.1130/B25183.1
Holser, W. T., and Kaplan, I. R. (1966). Isotope geochemistry of sedimentary sulfates. Chem. Geol. 1, 93–135. doi: 10.1016/0009-2541(66)90011-8
Honrath, R. E., Guo, S., Peterson, M. C., Dziobak, M. P., Dibb, J. E., and Arsenault, M. A. (2000). Photochemical production of gas phase NOx from ice crystal NO3. J. Geophys. Res. Atmos. 105, 24183–24190. doi: 10.1029/2000JD900361
Honrath, R. E., Peterson, M. C., Guo, S., Dibb, J. E., Shepson, P. B., and Campbell, B. (1999). Evidence of NOx production within or upon ice particles in the Greenland snowpack. Geophys. Res. Lett. 26, 695–698. doi: 10.1029/1999gl900077
Jackson, A., Davila, A. F., Böhlke, J. K., Sturchio, N. C., Sevanthi, R., Estrada, N., et al. (2016). Deposition, accumulation, and alteration of Cl-, NO3-, ClO4- and ClO3- salts in a hyper-arid polar environment: mass balance and isotopic constraints. Geochim. Cosmochim. Acta 182, 197–215. doi: 10.1016/j.gca.2016.03.012
Jackson, W. A., Böhlke, J. K., Andraski, B. J., Fahlquist, L., Bexfield, L., Eckardt, F. D., et al. (2015). Global patterns and environmental controls of perchlorate and nitrate co-occurrence in arid and semi-arid environments. Geochim. Cosmochim. Acta 164, 502–522. doi: 10.1016/J.GCA.2015.05.016
Jones, A. E., Weller, R., Anderson, P. S., Jacobi, H. W., Wolff, E. W., Schrems, O., et al. (2001). Measurements of NOx emissions from the Antarctic snowpack. Geophys. Res. Lett. 28, 1499–1502. doi: 10.1029/2000GL011956
Jones, L. M., and Faure, G. (1967). Origin of the salts in Lake Vanda, Wright Valley, Southern Victoria Land, Antarctica. Earth Planet. Sci. Lett. 3, 101–106. doi: 10.1016/0012-821x(67)90019-90012
Jonsell, U., Hansson, M. E., Mörth, C.-M., and Torssander, P. (2005). Sulfur isotopic signals in two shallow ice cores from Dronning Maud Land, Antarctica. Tellus B Chem. Phys. Meteorol. 57, 341–350. doi: 10.3402/tellusb.v57i4.16558
Jouzel, J., and Souchez, R. A. (1982). Melting- refreezing at the glacier sole and the isotopic composition of the ice. J. Glaciol. 28:98.
Keys, J. R., and Williams, K. (1981). Origin of crystalline, cold desert salts in the McMurdo region, Antarctica. Geochim. Cosmochim. Acta 45, 2299–2309. doi: 10.1016/0016-7037(81)90084-90083
Kunasek, S. A., Alexander, B., Steig, E. J., Sofen, E. D., Jackson, T. L., Thiemens, M. H., et al. (2010). Sulfate sources and oxidation chemistry over the past 230 years from sulfur and oxygen isotopes of sulfate in a West Antarctic ice core. J. Geophys. Res. 115:D18313. doi: 10.1029/2010JD013846
Lacelle, D. (2007). Environmental setting, (micro) morphologies and stable C-O isotope composition of cold climate carbonate precipitates — a review and evaluation of their potential as paleoclimatic proxies. Quat. Sci. Rev. 26, 1670–1689. doi: 10.1016/j.quascirev.2007.03.011
Lacelle, D., Lauriol, B., and Clark, I. D. (2006). Effect of chemical composition of water on the oxygen-18 and carbon-13 signature preserved in cryogenic carbonates, Arctic Canada: implications in paleoclimatic studies. Chem. Geol. 234, 1–16. doi: 10.1016/j.chemgeo.2006.04.001
Lacelle, D., Lauriol, B., and Clark, I. D. (2007). Origin, age, and palaeoenvironmental significance of carbonate precipitates from a granitic environment, Akshayuk Pass, southern Baffin Island, Canada. Can. J. Earth Sci. 44, 61–79. doi: 10.1139/E06-088
LaPrade, K. E. (1984). Climate, geomorphology, and glaciology of the Shackleton Glacier area, Queen Maud Mountains, Transantarctic Mountains, Antarctica. Antarct. Res. Ser. 36, 163–196. doi: 10.1029/ar036p0163
Legrand, M., Feniet-Saigne, C., and Saltzmant, E. S. (1991). Ice-core record of oceanic emissions of dimethylsulphide during the last climate cycle. Nature 350, 144–146. doi: 10.1038/350144a0
Legrand, M. R., and Delmas, R. J. (1984). The ionic balance of Antarctic snow: a 10-year detailed record. Atmos. Environ. 18, 1867–1874. doi: 10.1016/0004-6981(84)90363-90369
Lyons, W. B., Deuerling, K., Welch, K. A., Welch, S. A., Michalski, G., Walters, W. W., et al. (2016). The soil geochemistry in the beardmore glacier region, antarctica: implications for terrestrial ecosystem history. Sci. Rep. 6:26189. doi: 10.1038/srep26189
Lyons, W. B., Foley, K. K., Carey, A. E., Diaz, M. A., Bowen, G. J., and Cerling, T. (2020). The isotopic geochemistry of CaCO3 encrustations in Taylor Valley, Antarctica: implications for their origin. Acta Geogr. Slov. 60, 105–119.
MacKintosh, A., Golledge, N., Domack, E., Dunbar, R., Leventer, A., White, D., et al. (2011). Retreat of the East Antarctic ice sheet during the last glacial termination. Nat. Geosci. 4, 195–202. doi: 10.1038/ngeo1061
Magalhães, C., Stevens, M. I., Cary, S. C., Ball, B. A., Storey, B. C., Wall, D. H., et al. (2012). At limits of life: multidisciplinary insights reveal environmental constraints on biotic diversity in continental Antarctica, edited by F. de Bello. PLoS One 7:e44578. doi: 10.1371/journal.pone.0044578
Marchant, D. R., and Denton, G. H. (1996). Miocene and pliocene paleoclimate of the Dry Valleys region, Southern Victoria land: a geomorphological approach. Mar. Micropaleontol. Micropaleontol. 27:253. doi: 10.1016/0377-8398(95)00065-68
Mayewski, P. A., and Goldthwait, R. P. (1985). Glacial events in the Transantarctic mountains: a record of the East Antarctic ice sheet. Antarct. Res. Ser. 36, 275–324. doi: 10.1029/ar036p0275
Mayewski, P. A., Twickler, M. S., Lyons, W. B., Spencer, M. J., Meese, D. A., Gow, A. J., et al. (1990). The dominion range ice core, Queen Maud Mountains, Antarctica - general site and core characteristics with implications. J. Glaciol. 36, 11–16. doi: 10.1017/S0022143000005499
Michalski, G., Bockheim, J. G., Kendall, C., and Thiemens, M. (2005). Isotopic composition of Antarctic Dry Valley nitrate: implications for NOy sources and cycling in Antarctica. Geophys. Res. Lett. 32, 1–4. doi: 10.1029/2004GL022121
Michalski, G., Böhlke, J. K., and Thiemens, M. (2004). Long term atmospheric deposition as the source of nitrate and other salts in the Atacama Desert, Chile: new evidence from mass-independent oxygen isotopic compositions. Geochim. Cosmochim. Acta 68, 4023–4038. doi: 10.1016/j.gca.2004.04.009
Michalski, G., Scott, Z., Kabiling, M., and Thiemens, M. H. (2003). First measurements and modeling of Δ17O in atmospheric nitrate. Geophys. Res. Lett. 30:1870. doi: 10.1029/2003GL017015
Moore, H. (1977). The isotopic composition of ammonia, nitrogen dioxide and nitrate in the atmosphere. Atmos. Environ. 11, 1239–1243. doi: 10.1016/0004-6981(77)90102-90100
Morin, S., Savarino, J., Frey, M. M., Domine, F., Jacobi, H. W., Kaleschke, L., et al. (2009). Comprehensive isotopic composition of atmospheric nitrate in the Atlantic Ocean boundary layer from 65°S to 79°N. J. Geophys. Res. Atmos. 114, 1–19. doi: 10.1029/2008JD010696
Muscari, G., de Zafra, R. L., and Smyshlyaev, S. (2003). Evolution of the NOy-N2O correlation in the Antarctic stratosphere during 1993 and 1995. J. Geophys. Res. D Atmos. 108:2871. doi: 10.1029/2002jd002871
Nakai, N., Wada, H., Kiyosu, Y., and Takimoto, M. (1975). Stable isotope of water and studies on the origin and geological history salts in the Lake Vanda area, Antarctica. Geochem. J. 9, 7–24. doi: 10.2343/geochemj.9.7
Neumann, K., Lyons, W. B., Priscu, J. C., Desmarais, D. J., and Welch, K. A. (2004). The carbon isotopic composition of dissolved inorganic carbon in perennially ice-covered Antarctic lakes: searching for a biogenic signature. Ann. Glaciol. 39, 1–7. doi: 10.3189/172756404781814465
Nezat, C. A., Lyons, W. B., and Welch, K. A. (2001). Chemical weathering in streams of a polar desert (Taylor Valley, Antarctica). Geol. Soc. Am. Bull. 113, 1401–1408. doi: 10.1130/0016-7606(2001)113<1401:cwisoa>2.0.co;2
Nkem, J. N., Virginia, A. R. A., Barrett, A. J. E., Wall, D. H., and Li, A. G. (2006). Salt tolerance and survival thresholds for two species of Antarctic soil nematodes. Polar Biol. 29, 643–651. doi: 10.1007/s00300-005-0101-106
Patris, N., Delmas, R. J., and Jouzel, J. (2000). Isotopic signatures of sulfur in shallow Antarctic ice cores. J. Geophys. Res. 105, 7071–7078. doi: 10.1029/1999JD900974
Pisapia, C., Chaussidon, M., Mustin, C., and Humbert, B. (2007). O and S isotopic composition of dissolved and attached oxidation products of pyrite by Acidithiobacillus ferrooxidans: comparison with abiotic oxidations. Geochim. Cosmochim. Acta 71, 2474–2490. doi: 10.1016/j.gca.2007.02.021
Pribil, M. J., Ridley, W. I., and Emsbo, P. (2015). Sulfate and sulfide sulfur isotopes (δ34S and δ33S) measured by solution and laser ablation MC-ICP-MS: an enhanced approach using external correction. Chem. Geol. 412, 99–106. doi: 10.1016/j.chemgeo.2015.07.014
Pruett, L. E., Kreutz, K. J., Wadleigh, M., Mayewski, P. A., and Kurbatov, A. (2004). Sulfur isotopic measurements from a West Antarctic Ice core: implications for sulfate source and transport. Ann. Glaciol. 39, 161–168. doi: 10.3189/172756404781814339
Rech, J. A., Quade, J., and Hart, W. S. (2003). Isotopic evidence for the source of Ca and S in soil gypsum, anhydrite and calcite in the Atacama Desert, Chile. Geochim. Cosmochim. Acta 67, 575–586. doi: 10.1016/S0016-7037(02)01175-1174
Reich, M., and Bao, H. (2018). Nitrate deposits of the Atacama Desert: a marker of long-term hyperaridity. Elements 14, 251–256. doi: 10.2138/gselements.14.4.251
Savarino, J., Kaiser, J., Morin, S., Sigman, D. M., and Thiemens, M. H. (2007). Nitrogen and oxygen isotopic constraints on the origin of atmospheric nitrate in coastal Antarctica. Atmos. Chem. Phys. 7, 1925–1945. doi: 10.5194/acp-7-1925-2007
Savarino, J., Lee, C. C. W., and Thiemens, M. H. (2000). Laboratory oxygen isotopic study of sulfur (IV) oxidation: origin of the mass-independent oxygen isotopic anomaly in atmospheric sulfates and sulfate mineral deposits on Earth. J. Geophys. Res. 105, 29079–29088. doi: 10.1029/2000jd900456
Shaheen, R., Abauanza, M., Jackson, T. L., Mccabe, J., Savarino, J., and Thiemens, M. H. (2013). Tales of volcanoes and El-Niño southern oscillations with the oxygen isotope anomaly of sulfate aerosol. Proc. Natl. Acad. Sci. U.S.A. 110, 17662–17667. doi: 10.1073/pnas.1213149110
Skidmore, M., Sharp, M., and Tranter, M. (2004). Kinetic isotopic fractionation during carbonate dissolution in laboratory experiments: implications for detection of microbial CO2 signatures using δ13C-DIC. Geochim. Cosmochim. Acta 68, 4309–4317. doi: 10.1016/j.gca.2003.09.024
Sun, T., Socki, R. A., Bish, D. L., Harvey, R. P., Bao, H., Niles, P. B., et al. (2015). Lost cold Antarctic deserts inferred from unusual sulfate formation and isotope signatures. Nat. Commun. 6:7579. doi: 10.1038/ncomms8579
Szynkiewicz, A., Moore, C. H., Glamoclija, M., and Pratt, L. M. (2009). Sulfur isotope signatures in gypsiferous sediments of the Estancia and Tularosa Basins as indicators of sulfate sources, hydrological processes, and microbial activity. Geochim. Cosmochim. Acta 73, 6162–6186. doi: 10.1016/j.gca.2009.07.009
Szynkiewicz, A., Olichwer, T., and Tarka, R. (2020). Delineation of groundwater provenance in Arctic environment using isotopic compositions of water and sulphate. J. Hydrol. 580:124232. doi: 10.1016/j.jhydrol.2019.124232
Toner, J. D., and Sletten, R. S. (2013). The formation of Ca-Cl-rich groundwaters in the Dry Valleys of Antarctica: field measurements and modeling of reactive transport. Geochim. Cosmochim. Acta 110, 84–105. doi: 10.1016/j.gca.2013.02.013
Toner, J. D., Sletten, R. S., and Prentice, M. L. (2013). Soluble salt accumulations in Taylor Valley, Antarctica: implications for paleolakes and Ross Sea Ice Sheet dynamics. J. Geophys. Res. Earth Surf. 118, 198–215. doi: 10.1029/2012JF002467
Tostevin, R., Turchyn, A. V., Farquhar, J., Johnston, D. T., Eldridge, D. L., Bishop, J. K. B., et al. (2014). Multiple sulfur isotope constraints on the modern sulfur cycle. Earth Planet. Sci. Lett. 396, 14–21. doi: 10.1016/J.EPSL.2014.03.057
Uemura, R., Barkan, E., Abe, O., and Luz, B. (2010). Triple isotope composition of oxygen in atmospheric water vapor. Geophys. Res. Lett. 37, 1–5. doi: 10.1029/2009GL041960
Vaniman, D. T., Bish, D. L., Chipera, S. J., Fialips, C. I., Carey, J. W., and Feldman, W. G. (2004). Magnesium sulphate salts and the history of water on Mars. Nature 431, 663–665. doi: 10.1038/nature02973
Vogt, T., and Corte, A. E. (1996). Secondary precipitates in pleistocene and present cryogenic environments (Mendoza Precordillera, Argentina, Transbaikalia, Siberia, and Seymour Island, Antarctica). Sedimentology 43, 53–64. doi: 10.1111/j.1365-3091.1996.tb01459.x
Walters, W. W., and Michalski, G. (2015). Theoretical calculation of nitrogen isotope equilibrium exchange fractionation factors for various NOy molecules. Geochim. Cosmochim. Acta 164, 284–297. doi: 10.1016/j.gca.2015.05.029
Welch, K. A., Lyons, W. B., Whisner, C., Gardner, C. B., Gooseff, M. N., Mcknight, D. M., et al. (2010). Spatial variations in the geochemistry of glacial meltwater streams in the Taylor Valley, Antarctica. Antarct. Sci. 22, 662–672. doi: 10.1017/S0954102010000702
Keywords: Antarctica, geochemistry, salts, stable isotopes, nitrate, sulfate, carbonate
Citation: Diaz MA, Li J, Michalski G, Darrah TH, Adams BJ, Wall DH, Hogg ID, Fierer N, Welch SA, Gardner CB and Lyons WB (2020) Stable Isotopes of Nitrate, Sulfate, and Carbonate in Soils From the Transantarctic Mountains, Antarctica: A Record of Atmospheric Deposition and Chemical Weathering. Front. Earth Sci. 8:341. doi: 10.3389/feart.2020.00341
Received: 12 March 2020; Accepted: 21 July 2020;
Published: 27 August 2020.
Edited by:
Melissa Jean Murphy, University College London, United KingdomReviewed by:
Ruth Hindshaw, University of Cambridge, United KingdomPeter Michael Wynn, Lancaster University, United Kingdom
Copyright © 2020 Diaz, Li, Michalski, Darrah, Adams, Wall, Hogg, Fierer, Welch, Gardner and Lyons. This is an open-access article distributed under the terms of the Creative Commons Attribution License (CC BY). The use, distribution or reproduction in other forums is permitted, provided the original author(s) and the copyright owner(s) are credited and that the original publication in this journal is cited, in accordance with accepted academic practice. No use, distribution or reproduction is permitted which does not comply with these terms.
*Correspondence: Melisa A. Diaz, ZGlhei4yMzdAb3N1LmVkdQ==