 Octavi Gómez-Novell
 Julián García-Mayordomo
 María Ortuño
 Eulàlia Masana
 Thomas Chartier
- 1RISKNAT Group, Geomodels Research Institute, Departament de Dinàmica de La Terra I de L’Oceà, Facultat de Ciències de La Terra, Universitat de Barcelona, Barcelona, Spain
- 2Departamento de Riesgos Geológicos, Instituto Geológico y Minero de España, Tres Cantos, Spain
- 3Hazard Team, Global Earthquake Model Foundation, Pavia, Italy
Including faults as seismogenic sources in probabilistic seismic hazard assessments (PSHA) has turned into a common practice as knowledge of active faults is improving. Moreover, the occurrence of earthquakes in multi-fault ruptures has evidenced the need to understand faults as interacting systems rather than independent sources. We present a PSHA for the Southeastern Spain obtained by including the faults of a moderate seismicity region, the Eastern Betics Shear Zone (EBSZ) in SE Spain, as the main seismogenic sources in two separate source models, one considering background seismicity. In contrast with previous studies in Spain, earthquake occurrence of the EBSZ system is modeled considering different hypotheses of multi-fault ruptures at the whole fault system scale and weighted in a logic tree. We compare the hazard levels with those from an area source PSHA and a previous fault-based approach. The results show a clear control of the EBSZ faults in the seismic hazard for all return periods, increasing drastically the hazard levels in the regions close to the fault traces and influencing up to 20 km farther with respect to the area source PSHA. The seismic hazard is dependent on the fault slip rates as peak ground accelerations and territorial extension of the fault influence appear higher around the Alhama de Murcia and Carboneras faults, while lower slip rate faults (Palomares Fault) show minor contribution to the hazard. For the return period of 475 years and near-fault locations, our models are more consistent with the ground motion values reached in the 2011 Mw 5.2 Lorca event than the building code or national seismic hazard map, which suggest that our fault system-based model performs more accurate estimations for this return period. Fault data, mainly slip rates, and its uncertainties have a clear impact on the seismic hazard and, for some faults, the lack of detailed paleoseismic studies can compromise the reliability of the hazard estimations. This, together with epistemic uncertainties concerning the background seismicity, are key discussion points in the present study, having an impact on further research and aiming to serve as a case example for other low-to-moderate seismicity regions worldwide.
Introduction
The use of geological data in probabilistic seismic hazard assessment (PSHA) has become increasingly important, since seismic catalogs do not usually extend for more than a few centuries. This is a very short time window for characterizing the occurrence of major events in regions of moderate seismic activity, even in areas where the catalogs extend for more than 1,000 years such as SE Spain or Portugal (García-Mayordomo, 2005; Vilanova and Fonseca, 2007, respectively). Traditionally, geological data and fault data have been used to characterize the occurrence of major, maximum or characteristic events (Wesnousky, 1986; Schwartz and Coppersmith, 1984). Maximum events usually have a very low impact in seismic hazard for the return periods considered in conventional building (e.g., 475 years) and so this type of fault-based PSHA has been regarded in studies interested in long return periods (e.g., critical infrastructures). However, there is increasing awareness of the fact that low-to-moderate magnitude events (Mw 4.0–6.0) are also able to produce significant damage, especially at sites located on top or very close to fault sources (e.g., 2011 Mw 5.2 Lorca earthquake in SE Spain; Alguacil et al., 2014). In this context, the identification and characterization of active faults as seismogenic sources able to produce all the range of earthquake magnitudes become critical tasks in the PSHA of moderate active regions.
For this reason, in accordance with the increasing availability and refinement of paleoseismic and geological studies, the incorporation of fault data in PSHA has become an important part of the source modeling aiming to estimate earthquake activity beyond the coverage of seismic catalogs. The use of faults in PSHA is a well-established practice worldwide (Frankel, 1995; WGCEP, 2003; Stirling et al., 2012; Woessner et al., 2015). In most of these cases, faults are modeled as independent sources following a characteristic earthquake model (Youngs and Coppersmith, 1985; Wesnousky, 1986) or a Gutenberg-Richter distribution (Gutenberg and Richter, 1945; Bungum, 2007).
During earthquakes, faults can rupture in very complex configurations involving several structures simultaneously and even with contrasting kinematics or geometries. Earthquakes such as the 2010 Mw 7.2 Cucapah (Fletcher et al., 2014), the 2012 Mw 8.6 Sumatra (Zhang et al., 2012) or the 2016 Mw 7.8 Kaikoura (Little et al., 2018) are good examples. Accordingly, in the recent years seismic hazard modelers and practitioners have developed new approaches for modeling faults as complex and interacting sources in seismic hazard. Including this complexity has demonstrated to be a turning point to model fault processes in PSHA. Approaches like UCERF-3 (Field et al., 2014) or the recent SHERIFS (Chartier et al., 2019) are emerging methodologies whose principle is modeling earthquake occurrence considering scenarios of multi-fault ruptures for source characterization in PSHA. In both cases fault rupturing is treated as an aleatory variable, whose occurrence is assumed to be linked to the randomness of the seismic process.
Most fault-based PSHA approaches are usually carried out in high seismicity regions with advanced paleoseismic fault knowledge to perform such studies (e.g., Stirling et al., 2012; Field et al., 2014 for New Zealand and California, respectively). Conversely, the scarcity of paleoseismic and geological slip rate data on faults has been one of the major challenges faced by PSHA analysts in low-to-moderate seismicity regions, such as Western Europe (e.g., Spain). In Spain, PSHA has been classically modeled using area sources following Cornell (1968) and McGuire (1976) methodology, as it is the case of the latest national seismic hazard map (IGN-UPM, 2013). In that work, fault information has been included as a complementary criterion for defining area sources and, particularly, the fault length, which is used to set the upper bound of the magnitude-frequency distribution in each one. In this map, faults have not been included as seismogenic sources in the calculations due to the incompleteness of the fault data across the country. However, that is not the case of SE Spain, the most seismically active area in the country (García-Mayordomo et al., 2007) and where one of the longest active fault systems is located: the Eastern Betics Shear Zone (EBSZ).
The EBSZ is a ∼400 km long transpressive tectonic corridor of mainly reverse and left-lateral strike-slip kinematics with a characteristic NE-SW sigmoidal trend (Bousquet, 1979; De Larouzière et al., 1988; Silva et al., 1993) (Figure 1B). It absorbs most part of the NW-SE convergence from the Eurasian and Nubian plates in Iberia (4–6 mm/yr; DeMets et al., 2015). Although it is a moderate seismicity region with rates lower than other European regions (e.g., Italy or Greece), many destructive earthquakes with intensities up to IX-X (IEMS98) have affected this region since historical times (e.g., 1518 VIII-IX Vera, 1522 VIII-IX Almería, 1674 VIII Lorca, 1804 VIII-IX Dalías-Berja, 1829 IX-X Torrevieja; Silva et al., 2014) (Figure 1B). More recently, moderate magnitude earthquakes have taken place (e.g., 1993–1994 Adra seismic series; the 1999 Mw 4.8 Mula, 2002 Mw 5.0 Bullas; the 2005 Mw 4.8 La Paca seismic series; Rodríguez-Escudero et al., 2014), including the damaging 2011 Mw 5.2 Lorca earthquake (e.g., Martínez-Díaz et al., 2012a).
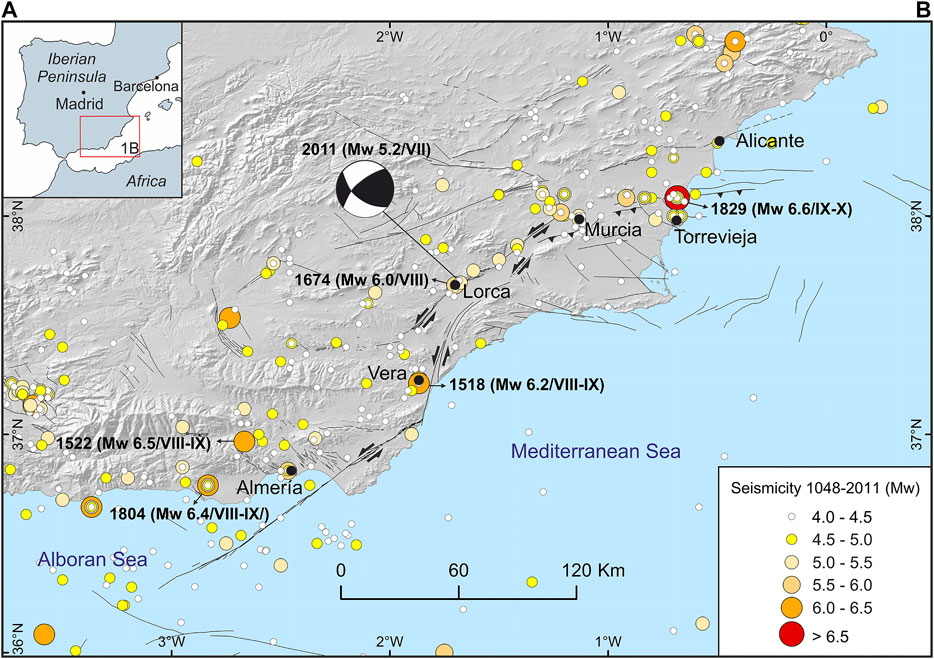
FIGURE 1. (A) Location of the study region within the Iberian Peninsula; (B) Seismotectonic context of SE Spain with the seismicity of Mw ≥ 4.0 from the 1048–2011 period (IGN-UPM, 2013), including the most damaging historical earthquakes of the region pointed with an arrow. The focal mechanism of the 2011 Mw 5.2 Lorca earthquake is extracted from the Instituto Geográfico Nacional agency (IGN, 2011). Intensity scale is European Macroseismic Scale (EMS98). The main traces of the Quaternary active faults are extracted from QAFI v.3. Database (IGME, 2015a; García-Mayordomo et al., 2017).
Over the last two decades, the EBSZ tectonic context has motivated many geological, geodetic and paleoseismic studies, especially since the 2011 Lorca earthquake (e.g., Moreno, 2011; Ortuño et al., 2012; Echeverria et al., 2013; Insua-Arévalo et al., 2015; Martín-Banda et al., 2015; Ferrater, 2016; Martínez-Díaz et al., 2018; Masana et al., 2018). Accordingly, PSHA studies focused here have successfully incorporated faults as independent sources either considering a characteristic earthquake or Gutenberg-Richter model (García-Mayordomo, 2005; García-Mayordomo et al., 2007; Rivas-Medina et al., 2018). However, no PSHA study has yet modeled fault sources from the perspective of multi-fault ruptures, so the present constitutes the first one in this matter. The incorporation of this variable representing fault behaviors widely observed in nature is seen as a step toward more realistic approximations of fault modeling and seismic hazard in the EBSZ.
The aim of our paper is to explore a fault-based PSHA in a moderate seismicity region as it is the EBSZ in SE Spain, using a state-of-the-art fault source modeling approach that implements fault data as inputs, considers multi-fault rupture possibilities at the whole fault system scale and treats them as aleatory uncertainty. We use the source models computed and published in a previous article (Gómez-Novell et al., 2020). There, an emergent methodology (SHERIFS; Chartier et al., 2019) is applied to perform a source modeling of the EBSZ by computing magnitude-frequency distributions (MFDs) at the scale of the whole EBSZ fault system considering different scenarios of fault ruptures. The adequacy of the models is evaluated and ranked in terms of their agreement with the regional seismic catalog and paleoseismic data. For the present study, we adapt and re-compute these models, weight them in a logic tree and use them as inputs for the hazard calculations. We compute seismic hazard using the OpenQuake engine (Pagani et al., 2014), evaluate the influence of the selected fault source models on the seismic hazard and compare them with previous PSHA approaches in SE Spain. We also place the interest of our study for other low-to-moderate seismicity regions worldwide.
Geological Setting
The EBSZ is a main active fault system in SE Spain. The faults affect Quaternary sedimentary deposits and generate geomorphological and morphotectonic features (e.g., fluvial channel offsets, fault scarps) along a left-lateral transpressive corridor, evidencing tectonic activity during the recent Quaternary (De Larouzière et al., 1988; Silva et al., 1993). The onset of the neotectonic activity under the nowadays compressional transpressive regime in the Eastern Betics occurred during the Late Miocene (e.g., Rodríguez-Fernández et al., 2012). From SW to NE these faults are (Figure 2A): Carboneras Fault (CF), Palomares Fault (PF), Alhama de Murcia Fault (AMF), Los Tollos Fault (LTF), Carrascoy Fault (CAF) and Bajo Segura Fault (BSF) (Bousquet, 1979; Silva et al., 1993). Characterizing the role and activity degree of these faults during the Quaternary has been the aim of many geomorphological, paleoseismic and geodetic studies in the last two decades, making the EBSZ one of the most studied fault systems in the Iberian Peninsula so far.
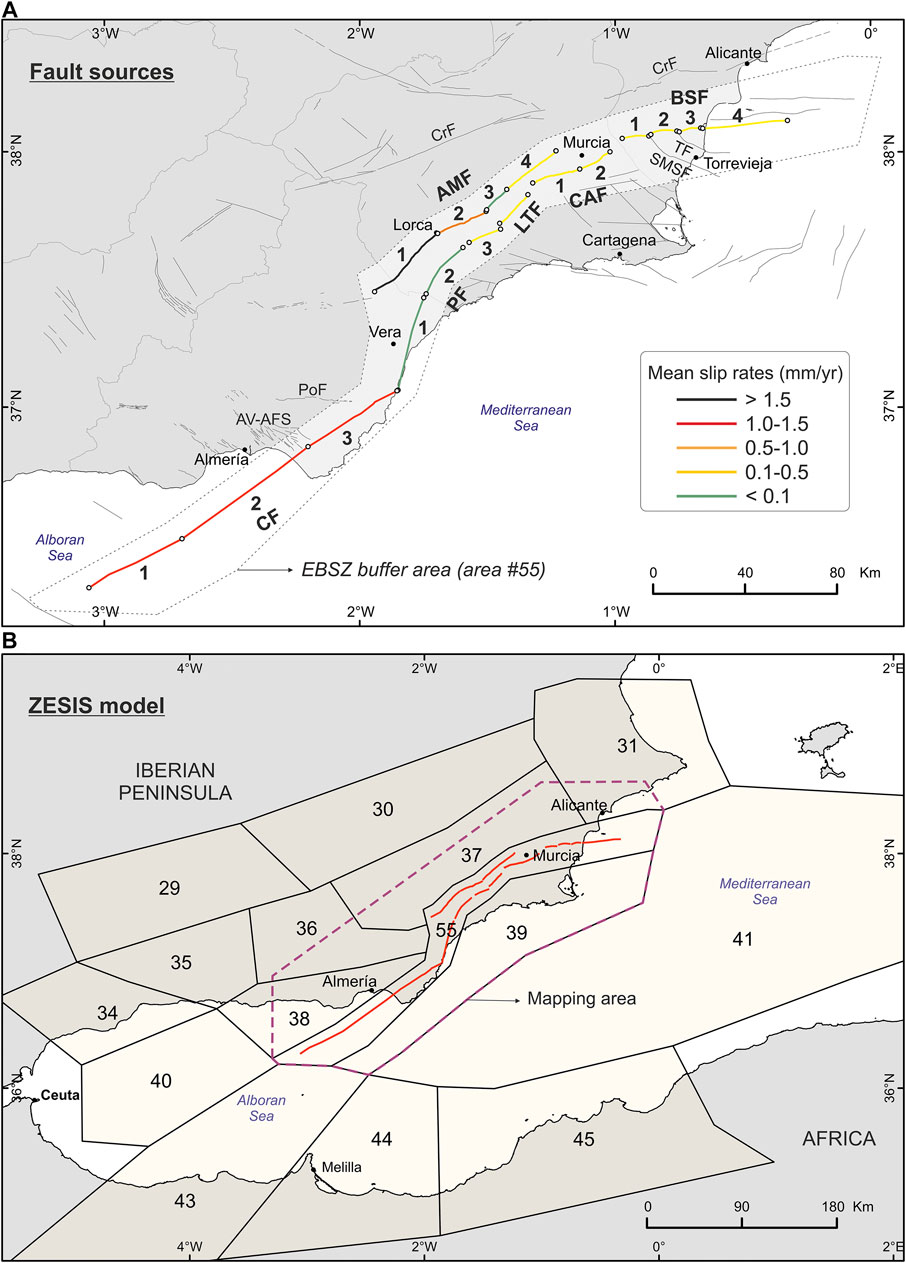
FIGURE 2. (A) Simplified traces of the major faults of the EBSZ considered in the fault source modeling of this study. Each fault is marked by an abbreviation and each section of the respective fault has a number assigned (ID). The parameters of each fault ID are indicated in Table 1. CF: Carboneras Fault; PF: Palomares Fault; LTF: Los Tollos Fault; CAF: Carrascoy Fault; BSF: Bajo Segura Fault; AMF: Alhama de Murcia Fault. The fault traces are presented following a colored scale according to their estimated mean slip rate values (Table 1). Other relevant secondary faults not included in the fault source modeling are also indicated. CrF: Crevillente Fault; SMSF: San Miguel de Salinas Fault; TF: Torrevieja Fault; AV-AFS: Andarax Valley and El Alquián Fault System; PoF: Polopos Fault. The buffer area of the EBSZ is indicated around the faults by a dotted line; (B) Seismogenic area sources considered in this study from the ZESIS model (IGME, 2015b; García-Mayordomo, 2015), whose parameters are indicated in Table 3. A dashed purple line delineates the mapping area where the seismic hazard is computed. The location of the main faults of the EBSZ from Figure 2A within its buffer area (#55) are indicated.
The EBSZ is one of the most seismically active regions of the Western Mediterranean and it has hosted many damaging earthquakes since the historical period. Most damaging earthquakes in the area have been attributed to the main faults forming the EBSZ. Important examples are the 1518 Vera earthquake, attributed to PF (e.g., García-Mayordomo, 2005), the 1522 Almería earthquake to CF (e.g., Reicherter and Hübscher, 2007), the 1674 Lorca earthquake to AMF (Martínez-Díaz et al., 2018), the 1829 Torrevieja earthquake to BSF (e.g., Alfaro et al., 2012) or, in recent times, the 2011 Lorca earthquake to AMF (Martínez-Díaz et al., 2012a) (Figure 1B). Some of these historical earthquakes are known to have ruptured the surface, as recently unveiled for the 1674 Lorca earthquake (Martínez-Díaz et al., 2018). Importantly, most of the instrumental seismicity in the EBSZ occurs relatively at shallow depths and focal mechanisms are consistent with the strike-slip and reverse character of the main faults (Stich et al., 2007, Stich et al., 2010).
Paleoseismic trenching and detailed geomorphological studies have demonstrated the capability of the system to generate large magnitude earthquakes (Mw > 6.0) and allowed to constrain critical seismic parameters (slip rate) in several of the main faults: AMF, CF, CAF or LTF (Table 1). The slip rate ranges between 1.0 and 1.7 mm/yr for AMF, according to estimates from Ferrater et al. 2017; 1.0 and 1.3 mm/yr for CF (Moreno, 2011); 0.37 ± 0.08 mm/yr for CAF (Martín-Banda et al., 2015) and 0.12–0.17 mm/yr for LTF (Insua-Arévalo et al., 2015). Conversely, PF, BSF and the northern termination of AMF have not been studied using detailed paleoseismic trenching analysis and their slip rate estimations are based mainly on long-term displacements of geological markers (e.g., Herrero-Barbero et al., 2020), which may be affected by larger uncertainties.
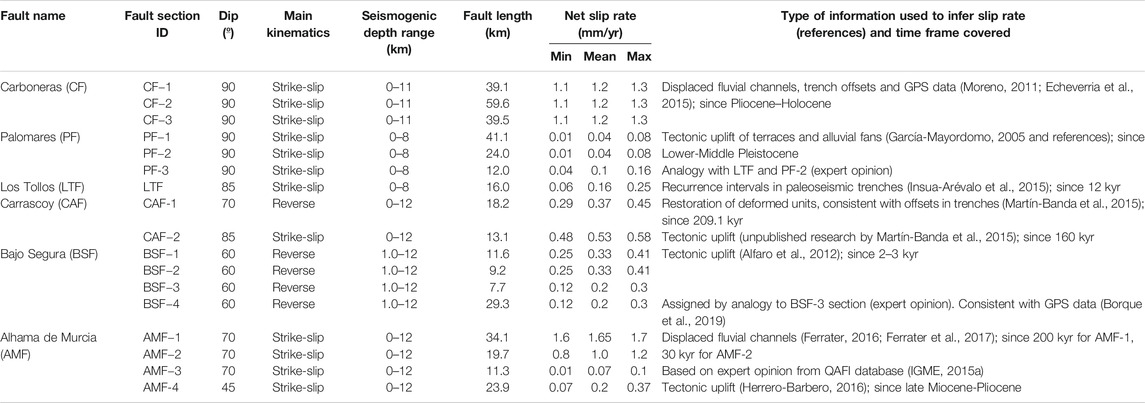
TABLE 1. Fault input data used to calculate the earthquake rates of the EBSZ fault system with the SHERIFS approach in the fault source modeling. The sources of information and references from where fault slip rate data are extracted are specified (see details in Gómez-Novell et al., 2020). Other fault parameters are extracted from the QAFI v.3. Database (IGME, 2015a; García-Mayordomo et al., 2017). See the map in Figure 2A for the location of each fault section mentioned in the table. Adapted from Gómez-Novell et al., 2020.
Continued tectonic activity in the EBSZ is also inferred from the current geodetic data. The obtained velocities of AMF-PF combined (1.5 ± 0.3; Echeverria et al., 2013) are consistent with the paleoseismic and geomorphologic slip rates of AMF, suggesting a main role of this fault into the deformation. Similarly, geodetic velocities of CF are in agreement with its geological slip rates (1.3 ± 0.2 mm/yr; Echeverria et al., 2015). In the NE end of the EBSZ GPS data indicates a partitioning of the deformation into lateral and reverse components, and compatibility with the kinematics of CAF and BSF, respectively (Borque et al., 2019).
Data and Methods for the Hazard Assessment
Source Modeling
In this work, we consider two types of seismogenic sources that are combined: faults and area sources (Figure 2). Fault sources are modeled within the EBSZ and area sources are modeled outside of it. The resulting composite source models are not a classical hybrid approach where faults accommodate earthquakes from a cutoff magnitude and area sources accommodate background seismicity (e.g., García-Mayordomo et al., 2007); instead, in our models both fault and area sources are modeled following a Gutenberg-Richter (GR) MFD for all the magnitude range (Mw ≥ 4.0), as we explain in the following sections.
Fault Sources
Fault sources are modeled exclusively for the EBSZ. The source modeling performed is based on the SHERIFS methodology as published in Gómez-Novell et al., 2020, where the first step of a source modeling for PSHA is performed at the EBSZ: the feasibility of multi-fault rupture scenarios is analyzed and earthquake occurrence on faults is modeled at the whole fault system scale following a GR distribution.
SHERIFS (Chartier et al., 2019) is a method of fault source modeling that uses geological fault data as inputs to calculate fault earthquake rates. Among its advantages, 1) it allows to model earthquake occurrence in fault systems as a whole and considering sets of multi-fault ruptures; 2) is well adapted for regions, such as the EBSZ, where geological data is the prime source of information for characterizing faults. In this sense, SHERIFS requires: i) a 3D geometry of the fault system, ii) slip rate of each fault source, iii) a target shape MFD of the fault system (e.g., GR) which is based on published studies or seismic databases and iv) a scaling relationship to estimate the upper bound of the MFD distribution (Mmax). The slip rate of each fault is treated as a budget and it is consumed following an iterative process to fit the target MFD, in which the different rupture scenarios are computed separately until the budget of the limiting faults is exhausted. The resulting MFDs are representative of the whole fault system and are weighted in a logic tree according to their consistency with data from the regional seismic catalog and paleoseismic studies (see Gómez-Novell et al., 2020 for details on how SHERIFS is applied to compute and weight the fault system MFDs).
Only the faults of the EBSZ have been considered for the SHERIFS modeling, because they are the ones absorbing most of the plate convergence motion in SE Spain (Bousquet, 1979; Silva et al., 1993) and because they show the best geological and paleoseismic data available in the region for seismogenic source modeling. The main fault sources are shown in Figure 2A. Faults outside of the EBSZ or secondary faults have not been considered mainly due to lack of enough quality data (e.g., Crevillente Fault, Torrevieja Fault, San Miguel de Salinas Fault, El Andarax Valley Fault, El Alquián Fault System, among others; Figure 2A).
For the fault source modeling we adopted the fault data and characteristics used in Gómez-Novell et al., 2020, obtained from available and mainly published data. Faults are sectioned (Figure 2A) according to segmentation in literature based on their geometry, geomorphic expression, seismicity, kinematics and activity evidence. Offshore segmentation of CF is adopted from Moreno (2011), onshore CF and PF from García-Mayordomo, 2005. Segmentation of CAF is based on Martín-Banda et al., 2015, BSF on Alfaro et al., 2012 and AMF on Martínez-Díaz et al., 2012b. These sections are then linked to create multi-fault rupture scenarios of the different fault rupture hypothesis explored in this study (see Table 2). Fault traces are simplified with respect to the ones depicted in the Quaternary Active Faults database of Iberia (QAFI v.3) (IGME, 2015a; García-Mayordomo et al., 2017) for the purposes of this study and multi-branch sections are simplified to a single one. This is consistent with studies that suggest that fault traces likely link at depth (e.g., CF: Moreno, 2011; AMF: Martínez-Díaz et al., 2012b). Dip, kinematics and seismogenic depths (Table 1) are extracted from the QAFI database, which compiles data from published studies on these faults. Fault slip rates are directly extracted from published works and, in selected cases, from unpublished data or expert opinion, as specified in Table 1 (see also the Appendix in Gómez-Novell et al., 2020 for specific details on the criteria followed for slip rate selection, especially for unpublished work).
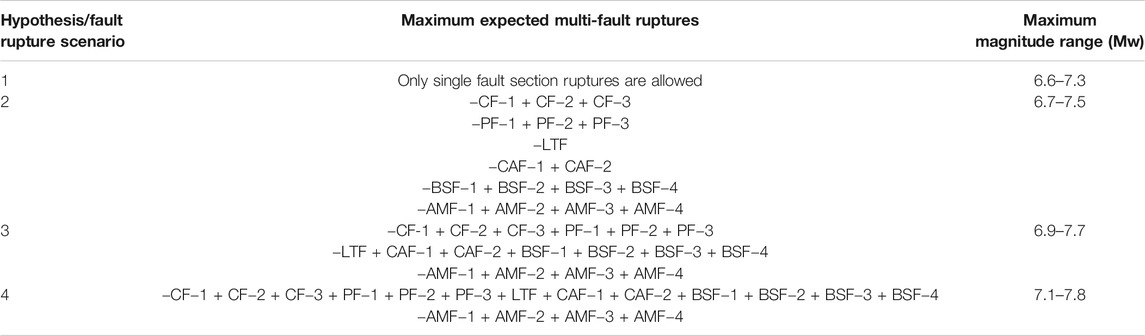
TABLE 2. Fault sections involved in the maximum fault and multi-fault ruptures envisaged in each hypothesis of the fault source modeling. See Figure 2A for the location of the mentioned fault sections. The maximum magnitude ranges of each hypothesis of the FM and FM_bg models are indicated. These ranges result from the random sampling of different fault ruptures allowed within a same hypothesis by the SHERIFS methodology.
The fault-system source model considered is spatially constrained to the limits of area source #55 of the ZESIS national scale area source model (García-Mayordomo, 2015), available at the ZESIS database (IGME, 2015b), which was delineated as the envelope of the surface projection of the EBSZ fault planes and characterized by the seismic record within (IGN-UPM, 2013). In this present approach, earthquake occurrence in this area (hereinafter called EBSZ buffer area) is completely modeled on faults from the geological fault data shown in Table 1. However, we also consider the alternative possibility that a small portion of the seismic moment release in the EBSZ is due to unknown faults (e.g., blind, unmapped) different from the considered ones, by modeling background seismicity in one of our models. Although the EBSZ buffer area is a narrow area constrained to the surface projection of well-known faults, it cannot be precluded that some activity may occur on unknown active faults not considered in this study (section 3.1.1.2).
Therefore, two alternative fault source models are envisaged within the EBSZ buffer area, one exclusively considering the faults’ activity (FM model) and another one considering a fraction of background seismic activity overlapped with the faults (FM_bg model).
Fault Sources: FM Model
For this model, earthquake rates in the EBSZ buffer area are modeled only on the EBSZ fault system, assuming that all seismicity over Mw 4.0 occurring within its limits is related to these faults. This fault-system source model is based on the results of the modeling performed in Gómez-Novell et al., 2020 without any additional modifications. Four scenarios or hypotheses of fault and multi-fault ruptures involving from single fault sections to nearly the whole system (hypothesis 1 to 4; Table 2) are modeled using SHERIFS and the fault data in Table 1 to obtain different GR distributions for the whole EBSZ system. In order to incorporate the epistemic uncertainty in the input data, the GR of each scenario is composed by 20 GR curves resulting from 20 computations exploring random values of input parameters, i.e., fault slip rates, b-values and Mmax of GR distribution. Slip rates are explored within the ranges provided in Table 1 and the b-values within the 0.8–1.2 range (Figure 3), whose mean (1.0) is in agreement with the one of the EBSZ in the ZESIS model (García-Mayordomo, 2015). The Mmax is set following Wells and Coppersmith, 1994 for rupture area and all kinematics. The resulting earthquake occurrences of each scenario (80 GR curves for all four scenarios) are expressed as the seismicity rates of each fault-rupture involved in that scenario (see Gómez-Novell et al., 2020 for details on the criteria applied to define the fault rupture scenarios, the input parameters used for the modeling with SHERIFS and the calculations). Furthermore, in the previous paper, the agreement of the resulting MFDs with the earthquake distribution from the catalog and paleoseismic record is analyzed and a qualitative ponderation of each hypothesis for PSHA is proposed, which we use here to set our logic tree weighting scheme (section 3.3 and Figure 3). All these outputs are used to build the source models in hazard calculations.
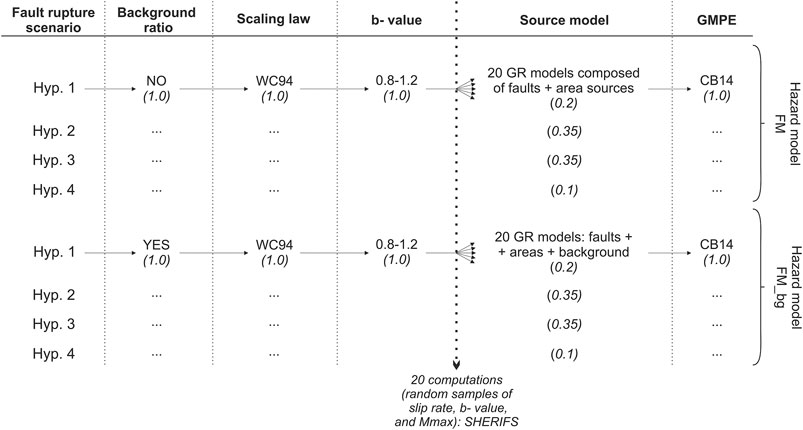
FIGURE 3. Logic tree schemes followed in this study for both FM and FM_bg source models. The weights (over 1) of each branch in the logic tree are indicated in brackets. Hyp.: hypothesis; WC94: Wells and Coppersmith, 1994; CB14: Campbell and Bozorgnia, 2014.
Fault Sources Including Background Seismicity: FM_bg Model
We introduced, by means of a background ratio, a modification respect to the previous FM model in order to consider that part of the seismic moment release in the EBSZ could be due to unknown active faults apart from the main ones. The rest of the input parameters are the same as mentioned for the FM model.
The background ratio is a parameter from SHERIFS that allows sharing a fraction (percentage) of the seismicity rate of a given magnitude between the faults and the background or the area directly surrounding the faults. For instance, a background ratio of 70% for Mw 4.0 means that 70% of the total seismicity rate of Mw 4.0 is modeled on faults and 30% as background seismicity. Therefore, the occurrence rates of the selected magnitude range on the faults are lowered with respect to the FM model consistently with the ratio adopted, avoiding double-counting of seismicity and respecting the GR distribution (see Chartier et al., 2019 for details on the background ratio). In our case, the background area corresponds to the EBSZ buffer area, whose seismic potential is then not only defined by the faults contained but also by the background seismicity as an area source.
Chartier et al., 2019 recognize that the user may rely on expert opinion to set this ratio due to its difficulty but propose to use the distance between earthquake epicenters and faults as possible criteria to set it. We cannot follow this approach due to large location errors at the EBSZ: 67% of the Mw ≥ 4.0 earthquakes are previous to year 1962 (IGN-UPM, 2013) and hence show epicentral errors larger than 10 km or even 20 km (García-Mayordomo, 2005). We then set the background ratios following expert opinion but based on criteria from seismicity data of the region as we explain below. These ratios are 70%, 80%, 90%, 95% for Mw 4.0, 4.5, 5.0, and 5.5, respectively, which represent the percentage of the total EBSZ seismic moment that is actually modeled on faults for each 0.5 magnitude bin. The remaining is modeled as background in the area of about 10 km around the faults.
The selected percentages are consistent with the fact that most of the instrumental earthquakes of Mw ≥ 4.0 in the EBSZ have occurred in the modeled faults. This is supported by the location of recent moderate earthquakes (e.g., 2011 Lorca seismic series related to AMF; Martínez-Díaz et al., 2012b) and by the fact that focal mechanisms of seismicity are in agreement with the main faults of the region (Stich et al., 2007, Stich et al., 2010). On the other hand, the GR distributions modeled with SHERIFS for the EBSZ in Gómez-Novell et al., 2020 predict good fits with the regional seismic catalog for most of the rupture scenarios in the Mw < 6.0 magnitude range. This supports that known faults might be responsible of most of the seismicity within the EBSZ. Consequently, we select ratios that do not modify significantly the GR distributions, hence that do not invalidate the proposed logic tree weighting in that study and comparison can be directly done with the FM model.
Only events in the range of Mw 4.0–5.5 are affected by the background ratio in our study, because earthquakes this size rarely cause surface rupture (Biasi and Weldon, 2006) and thus, they may occur in unrecognized faults and unadvertised by the paleoseismic studies. Mw > 6.0 earthquakes though, are considered to be produced in larger faults with geomorphic expression so they are modeled exclusively on the known EBSZ faults.
Area Sources
Outside the bounds of the EBSZ buffer area we consider the area sources of ZESIS model (García-Mayordomo, 2015). The area sources considered here are (Figure 2B): #29, #30, #31, #34, #35, #36, #37, #38, #39, #40, #41, #43, #44, #45 and, for the FM_bg model only, #55. These areas are all located within a radius of 50 km from the external boundary of the mapping area in order to account for the influence of seismogenic sources adjacent to the EBSZ buffer area (#55). The potential influence of farther sources is considered negligible for the purposes of this study. The earthquake occurrence in these areas is modeled according to GR distributions obtained in the frame of the project to update the national seismic hazard map of Spain (IGN-UPM, 2013), and their parameters (a and b-value, Mmin, Mmax; Table 3) are adopted here from the ZESIS database (IGME, 2015b). In the case of area #55, earthquake occurrence is controlled by the seismic moment assigned by the background ratios in each source model and following the target MFD of the faults (section 3.1.1.2). The area sources are added to the fault sources modeled with SHERIFS to build the different source models for the hazard calculations.
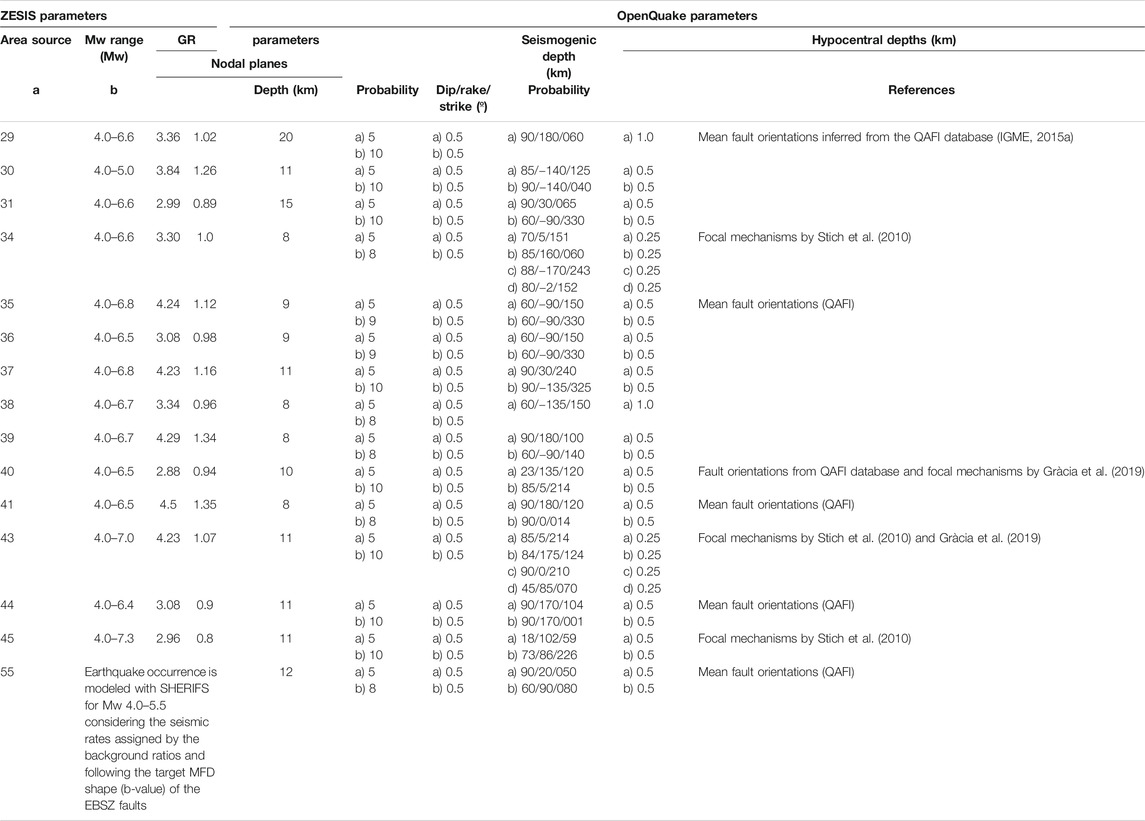
TABLE 3. Parameters of the area sources used for the area source model in this study. Mmin, Mmax (Mw range), a and b-values of the GR distribution are extracted from the ZESIS area source model (IGME, 2015b; García-Mayordomo, 2015). OpenQuake required parameters such as nodal planes are inferred from main fault orientations of the QAFI v.3. Database (IGME, 2015a; García-Mayordomo et al., 2017) or focal mechanisms of the studies indicated in the table. Seismogenic depths are based on fault data compiled in the QAFI database.
The characterization of the area sources is further completed defining a distribution of nodal planes and hypocentral depths in each area (OpenQuake manual v.3.7.1; GEM, 2019). The former controls the strike, dip and rake of earthquake ruptures inside the zone, while the latter controls the depth of the center of the ruptures. Nodal planes in each area are defined based on the predominant fault orientations from the QAFI v.3 database (IGME, 2015a), as well as by the distribution of focal mechanisms available in SE Spain and North-Africa (Stich et al., 2010), and the Alboran Sea (Gràcia et al., 2019) (Table 3). Eventually, a set of different nodal planes is defined for each area source representing each one the same probability of occurrence. Similarly, two equally probable hypocentral depths are defined for each source area (Table 3): the upper is set at 5 km and the lower between 8 and 10 km depending on the minimum common seismogenic depth of all faults contained in the area. The maximum seismogenic depth of the faults in the QAFI database defines the seismogenic depth for each area source.
Final Composite Seismogenic Source Models for Hazard Calculations
Two resulting composite source models are used for the calculations: FM + area sources and FM_bg + area sources. The “composite” term is used here to remark that each source model is composed by a fault source model and an area source model (Figure 3). The former sets the occurrence rates of all the fault ruptures envisaged in each fault rupture hypothesis modeled with SHERIFS within the EBSZ buffer area. The latter sets the occurrence rates of the different area sources considered outside the EBSZ buffer area and the background seismicity in the case of FM_bg model. The final models are referred by the distinctive fault source model name henceforth (i.e., FM and FM_bg). Because each of the four multi-fault rupture scenarios is composed of 20 different GR curves, a total of 80 input source models for OpenQuake compose both FM and FM_bg source models (Figure 3). The fault source part (e.g., earthquake rates, Mmax) is different for each 80 models because it depends on a) on the rupture scenario considered and b) the values of the input parameters explored randomly during the SHERIFS calculation. Each FM and FM_bg are computed separately in a different hazard calculation in order to better test and highlight the influence of including a background ratio, and to compare results more directly.
Ground Motion Prediction Equation
We selected the ground motion prediction equation (GMPE) derived by Campbell and Bozorgnia, 2014 from the PEER NGA project (Power et al., 2008). This equation is well adapted for fault-based PSHAs since it accounts for near-fault features such as fault geometry, style of faulting, depth of rupture and hanging wall effects. For the fault-based approach that we propose, this equation is then suitable to show the sensibility of the seismic hazard results to the fault source models. Additionally this equation is the one that Rivas-Medina et al., 2018 selected for a fault-based PSHA in SE Spain after an analysis of several GMPEs. According to the authors, this equation allowed better estimations of the expected accelerations in the study region considering the characteristics of the sources and the available data.
We acknowledge that considering a set of GMPEs is a normal practice in the attempt to capture the epistemic uncertainty related to ground motion. However, we consider just one GMPE to facilitate the detection of the impact of fault incorporation into PSHA and to be able to perform direct comparisons with previous studies. In order to quantify the influence of the GMPE on the results related to the fault source model and compared to other GMPEs not sensible to near-fault effects, we perform a sensibility analysis to the FM model by using the Akkar et al., 2014 equation. This is the latest GMPE derived from pan-European databases and does not include fault parameters in its functional form apart from style of faulting as a dummy variable. The implications of this analysis are discussed in section 5.3.
Logic Trees Explored
Each source model is computed separately. Thus, two logic trees are explored in this study as depicted in Figure 3. For each logic tree, the four different hypotheses of multi-fault ruptures are considered in order to incorporate the epistemic uncertainty of earthquake occurrence on faults. Each rupture hypothesis constitutes a branch of the logic tree, weighted based on the analysis of the agreement with the seismic catalog and paleoseismic data performed in Gómez-Novell et al., 2020. That study concluded that hypotheses 2 and 3 were the ones with better agreement with the regional seismic catalog and paleoseismic data, followed by hypothesis 1 and lastly, hypothesis. 4. A better agreement implies a more suitable hypothesis for the study region. Accordingly, we assigned a weight of 35% to both hyp. 2 and 3, 20% to hyp. 1 and 10% to hyp. 4. Each hypothesis is composed by 20 GR curves, hence 20 input source models for OpenQuake that include a fault source model and an area sources model. The weight of each of the 20 branches or models that form a hypothesis equals 1/20 of the weight of the whole branch (Figure 3).
Hazard Calculations
Hazard calculations are performed using the OpenQuake engine (Pagani et al., 2014). We compute a set of mean hazard maps in terms of PGA as function of probabilities of exceedance of 10, 5, 2 and 1% in a time window of 50 years, which correspond to return periods (RPs) of 475-, 975-, 2,475- and 4,975-years, respectively (Figures 4, 5). The region considered is depicted in Figure 2B and follows a 2 × 2 km grid, accounting for a total of 10,556 calculation points for each return period. This region is defined to comprise completely the EBSZ buffer area and include important cities of the region (Murcia, Lorca, Almería, Vera, Torrevieja, Alicante and Cartagena). To analyze fault influence, in the cities adjacent to the EBSZ faults (Murcia, Lorca, Almería, Vera, Torrevieja) we produce mean hazard curves in terms of PGA (Figure 6) and hazard disaggregation for distance-magnitude (Figure 7 and Supplementary material). Soil conditions are always considered to be rock or hard soil (Vs30 = 760 m/s). The maximum distance considered for the hazard calculations is 100 km in order to better reproduce the near-fault related hazard of the EBSZ and because farther sources have negligible impact in the study area (see disaggregation results in section 4.1). Source input files of the hazard calculations including source models, GMPE, logic tree and calculation specifications are included in the Supplementary material of the article.

FIGURE 4. (A) Mean hazard maps for PGA (g) of the FM model for the respective return periods (RPs) of 475 years; (B) 975 years; (C) 2,475 years and; (D) 4,975 years, equivalent to the probabilities of exceedance (POE) of 10%, 5%, 2%, and 1%, respectively. A common color scale is set for all return periods. The main cities in the region and the traces of the EBSZ faults considered are depicted in red. See Figure 2A for the names of each fault.
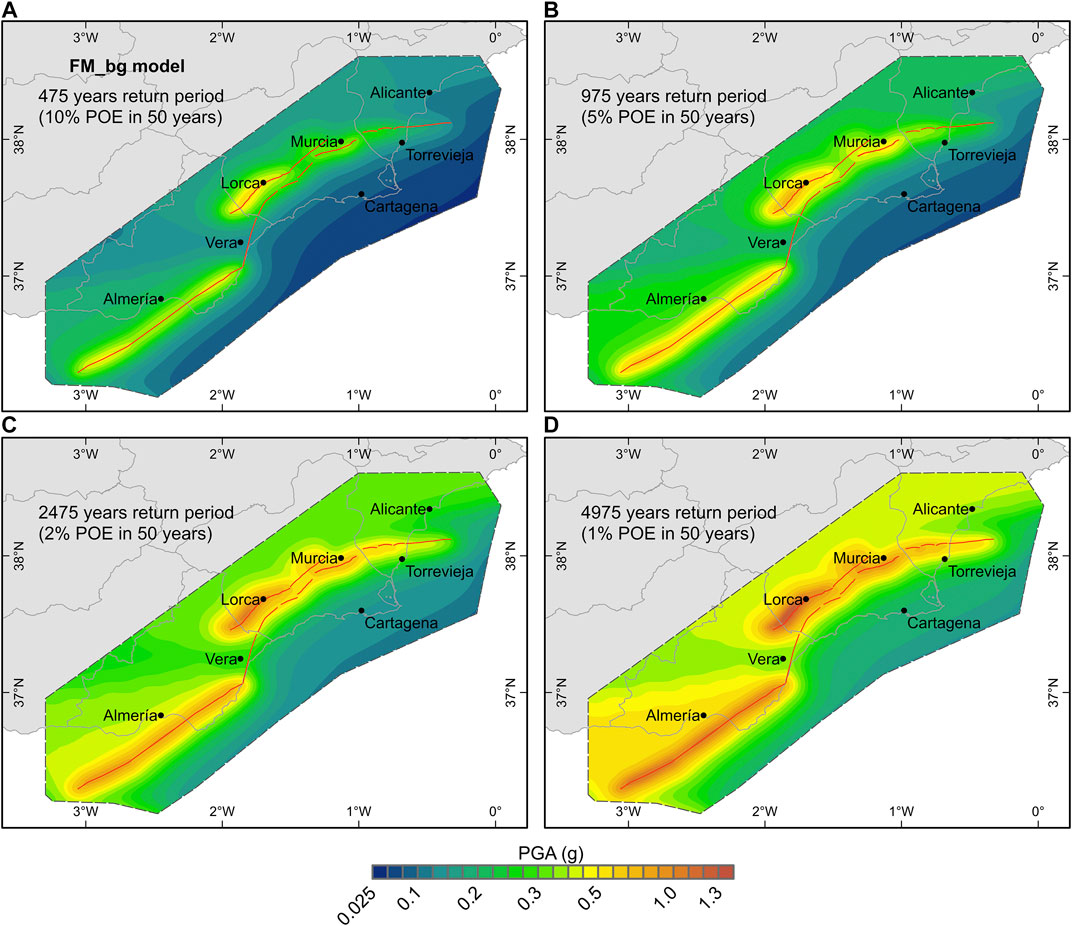
FIGURE 5. (A) Mean hazard maps for PGA (g) of the FM_bg model for the return periods (RPs) of 475 years; (B) 975 years; (C) 2,475 years and; (D) 4,975 years, equivalent to the probabilities of exceedance (POE) of 10%, 5%, 2%, and 1%, respectively. A common color scale is set for all return periods. The main cities in the region and the traces of the EBSZ faults considered are depicted in red. See Figure 2A for the names of each fault.
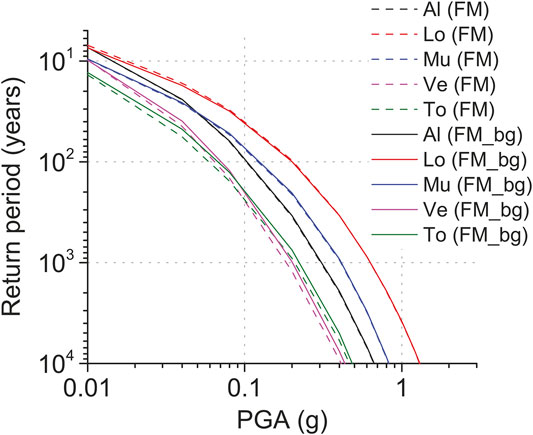
FIGURE 6. Mean hazard curves for PGA (g) of the FM and FM_bg models in the cities of Almería (Al), Lorca (Lo), Murcia (Mu), Vera (Ve) and Torrevieja (To). Their location is indicated in the maps from Figures 4, 5.
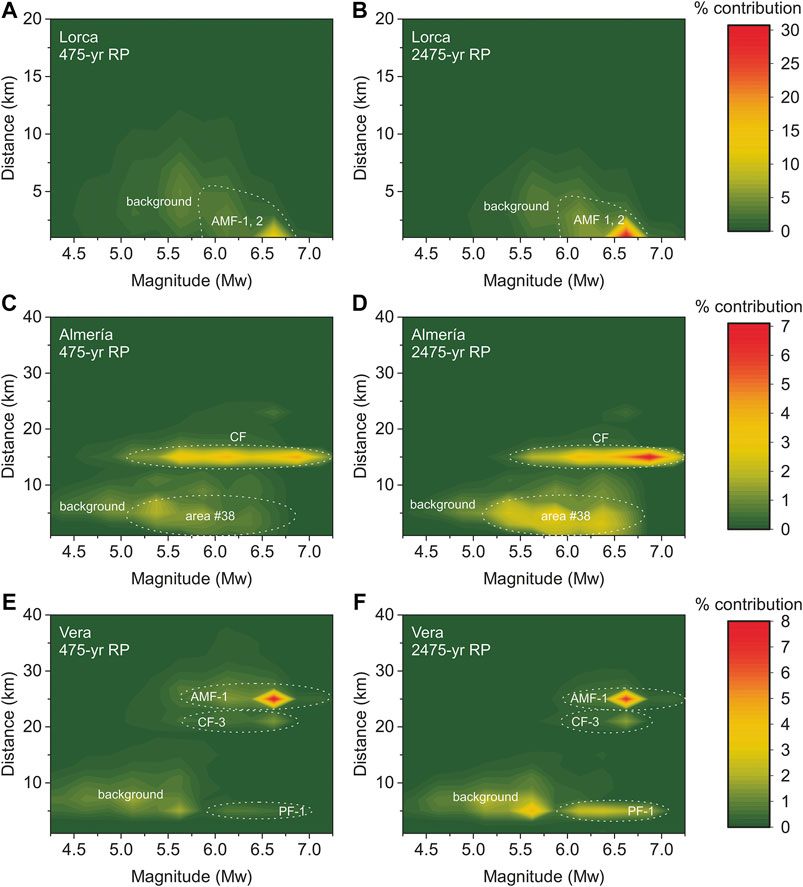
FIGURE 7. (A) Hazard disaggregation for the magnitude-distance relationship of the FM_bg model in the cities of Lorca for the return periods of 475 years and; (B) 2,475 years; (C) Almería for 475 years and; (D) 2,475 years; (E) Vera for 475 years and; (F) 2,475 years. A common color scale is set for the two return periods representing each city. The main sources contributing to the hazard of each city and return period are highlighted. For disaggregation figures of all the cities in Figure 6 and for the four return periods of 475, 975, 2,475, and 4,975 years, see the Supplementary Material of this paper.
Results
The results of the calculations are presented in mean hazard maps (Figures 4, 5) and mean hazard curves for five cities of the region (Figures 6). Maps were obtained after interpolation using the natural neighbor approach from the OpenQuake outputs. A common colored scale has been set for all maps to facilitate comparison. Mean hazard curves for the cities of Murcia, Lorca, Almería, Vera, Torrevieja are also depicted in terms of PGA on rock (Figure 6). To test the influence of the different fault sources and the seismic background on the hazard, we computed hazard disaggregation of the FM_bg model for the magnitude-distance relationship. In Figure 7, we depict representative disaggregation results in three cities and for two RPs (475 and 2,475 years). For complete disaggregation, figures of all the cities considered in Figure 6 and all four RPs are available the Supplementary material.
The results show a clear control of the EBSZ fault over the seismic hazard of SE Spain for all RPs, especially in the vicinity of faults (10–20 km). Slip rate values directly affect fault influence into the hazard because highest accelerations are located around faults with higher slip rates of the system, while lower slip rate faults have much less influence. The impact of the background into the models is very limited given the similarity of results from both FM and FM_bg.
Mean Hazard Maps and Disaggregation
Fault Influence
The mean hazard maps from both FM and FM_bg models (Figures 4, 5) produce very similar results in terms of absolute hazard levels and distribution and increments between them are very low (Figure 8). The modeled EBSZ fault system exerts a clear control into the seismic hazard of SE Spain for all RPs, especially noticeable in the near-fault regions, where maximum PGA values are located.
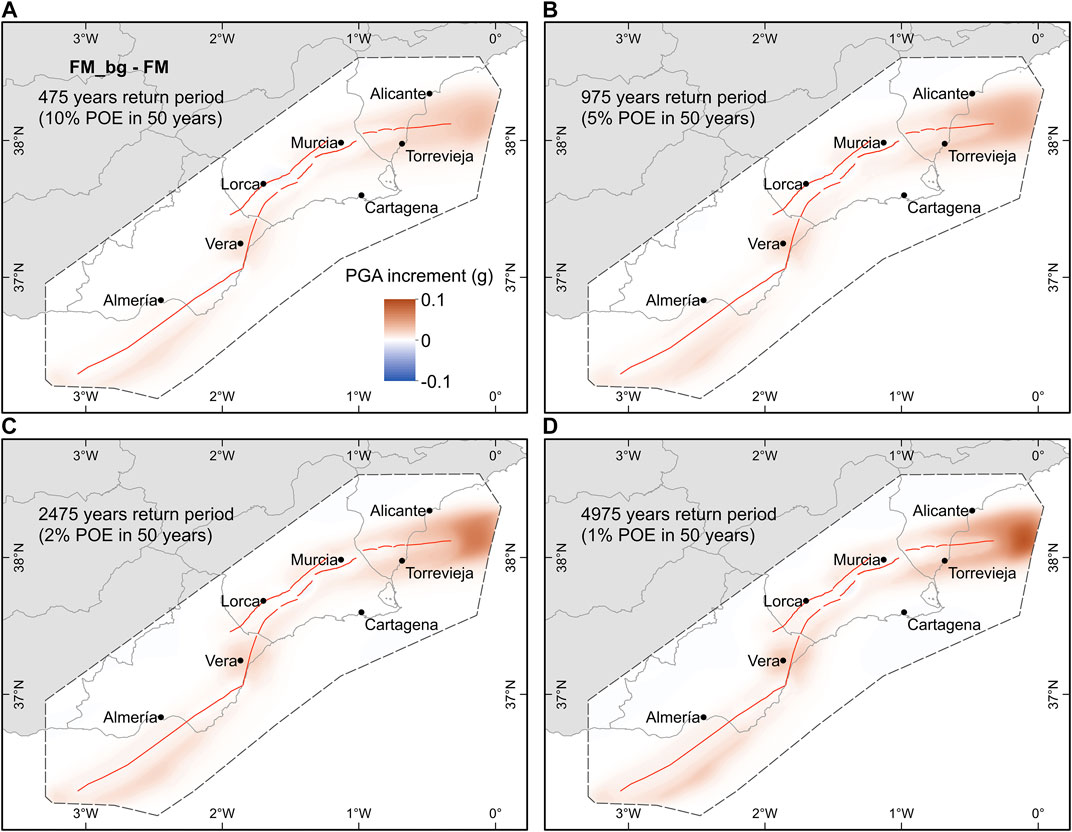
FIGURE 8. (A) Difference (in g) of the mean hazard maps from the FM_bg model (Figure 5) respective to the FM model (Figure 4) for the return periods of 475 years; (B) 975 years; (C) 2,475 years, and; (D) 4,975 years. A common color scale is set for all return periods. The traces of the EBSZ faults considered are depicted in red.
In both models, the maximum acceleration values range from 0.5–0.6 g for the 475 years RP to 1.2–1.3 g for the 4,975 years RP (Figures 4, 5) and are located along the faults with higher slip rates. That is the case of the Southwestern termination of AMF, near Lorca (AMF-1 and 2) or CF near Almería, which have the highest slip rates of the system (>1.0 mm/yr; Table 1 and Figure 2A). On the other hand, lower slip rate faults have minor influence in the hazard levels for all RPs, also depending on their slip rates. Mean hazard maps from both FM and FM_bg models (Figures 4, 5, respectively) show that PF is the fault with less footprint on the hazard for all RPs, which is consistent with its slip rate being the lowest of all the system according to the available estimations (<0.1 mm/yr; Table 1). Other faults such as the Eastern termination of BSF (BSF-3 and 4), AMF-4 or LTF, have higher slip rates (∼0.1–0.4 mm/yr; Table 1) but their influence to the hazard is limited compared to AMF-1, 2 or CF (Figures 4, 5).
The hazard disaggregation of the FM_bg model (Figure 7) shows that all the contributions to the seismic hazard in a specific site are from sources located within a 20–30 km radius, suggesting that farther sources do not influence the hazard. Higher slip rate faults contribute the most to the seismic hazard values of the closer zones, while lower slip rate faults have very small contributions, even in the sites in their closest vicinity. In the cities of Lorca and Almería (Figures 7A–D), the magnitude-distance relationships that influence most the hazard coincide with the location of AMF-1 and 2, and CF-3, respectively, which are the fault sections with higher slip rates in the system (Table 1). Lorca is located <1 km from AMF in the limit between AMF-1 and 2, which explains the maximum influence from sources located between 1–5 km. These maximum AMF-1 and 2 contributions are in a tight Mw 6.5–6.75 range for both RPs (Figures 7A, B), which might suggest the controlling earthquakes in this city. Almería is located at ∼15 km from CF-3, consistent with the distance of the source’s maximum contribution. The higher distance of the fault from the city causes its contribution to be considerably lower than AMF-1 and hence other non-fault sources influence the hazard as well (Figures 7C, D). The contributions of CF-3 comprise a wider magnitude range (Mw 5.0–7.0) in the 475 years RP (Figure 7C), while they concentrate around Mw 6.5–7.0 in the 2,475 years RP (Figure 7D). Conversely, in zones such as Vera, located next to very low slip rate faults (i.e. PF), the main contributions to the seismic hazard are not from the closer faults, but from other farther faults (Figures 7E, F). In this city AMF-1 is the main contribution despite this fault being ∼25 km farther, while PF is the least even for long RPs (Figure 7F).
A hanging wall effect can be observed in non-vertical dipping faults such as AMF, CAF or BSF (Figures 4, 5). Such near-fault effect is more visible at longer RPs (i.e., 2,475 and 4,975 years), where PGAs for two selected sites at the same distance of a fault trace but on opposite sides, are higher on the hanging wall. A clear example is the transect perpendicular to AMF near the city of Lorca (Figure 9E). This is a significant observation for seismic hazard assessment in near-fault zones as we discuss in section 5.1.1.
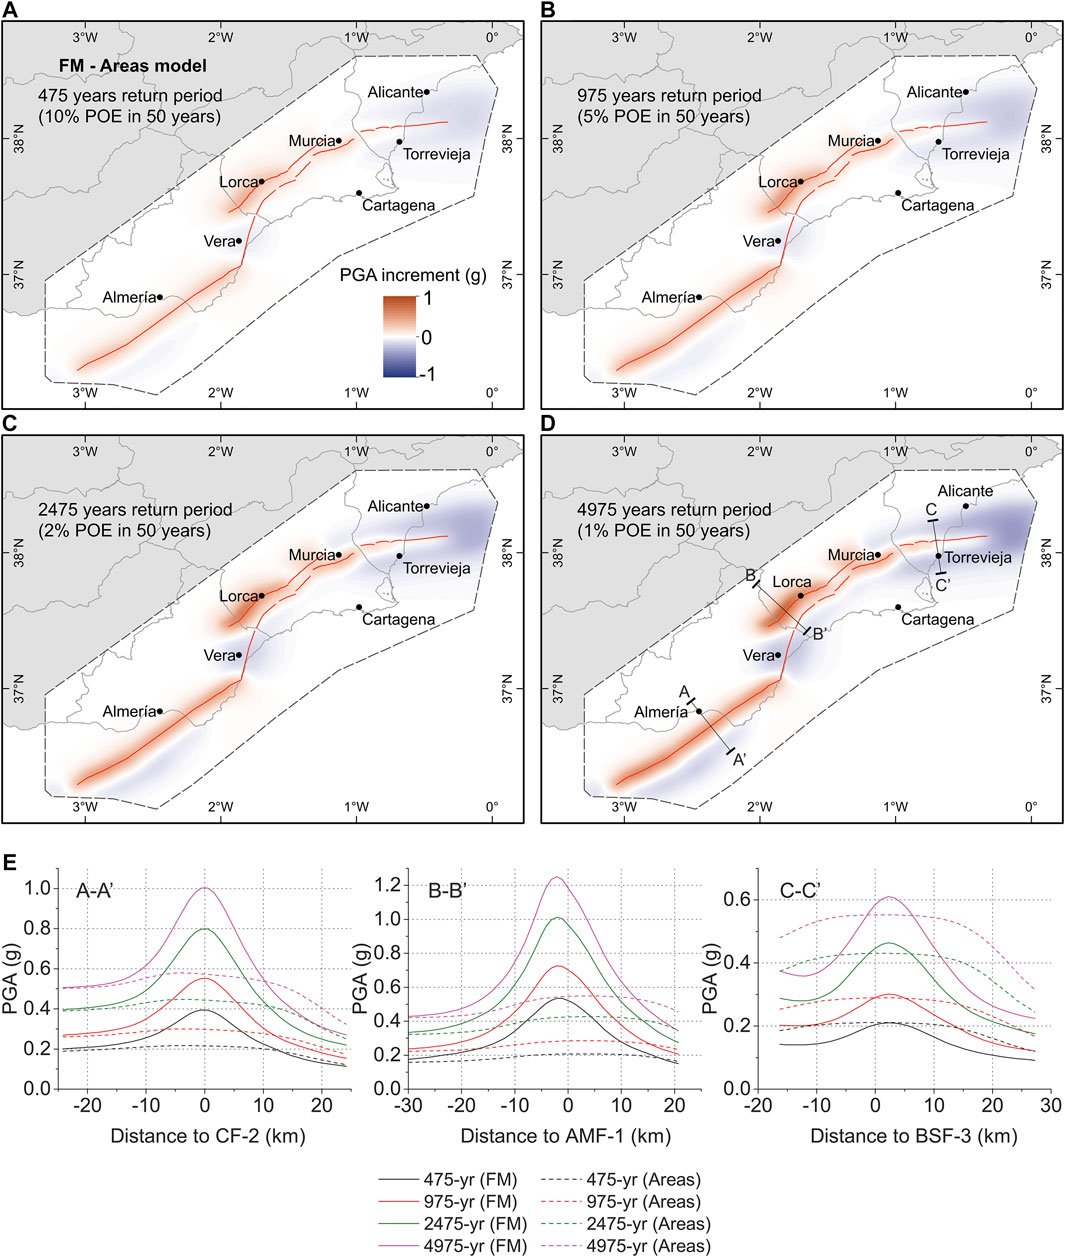
FIGURE 9. (A) Difference (in g) of the mean hazard map from the FM model (Figure 4) respective to the mean hazard map using exclusively the ZESIS area source model (Areas model) and for the return periods of 475 years; (B) 975 years; (C) 2,475 years, and; (D) 4,975 years. The traces of the EBSZ faults considered are depicted in red. A common color scale is set for all return periods; (E) Cross sections representing PGA values of both FM model (solid line) and Areas model (dashed line) as a function of distance to the surface fault trace and for the same return periods as the maps. The locations of the cross sections are depicted in Figure 9D.
Background Influence
The similarities between the mean hazard maps from the FM and FM_bg models suggest that adding a seismic activity background ratio in the FG_bg model produces minor changes to the final hazard results within the EBSZ buffer for any RP (Figure 8). In general, the background contributes to raise the hazard values with respect to the FM model, while the decreases are depreciable. PGA increments, especially for the shorter RPs, are mild (Figures 8A–C), but for the 4,975 years RP the hazard values are incremented up to a maximum of ∼0.1 g in some zones (e.g., E of BSF; Figure 8D). For the faults, PGA values remain practically identical for all RPs, which means that earthquake occurrence on most faults is higher than the one generated by the background. However, the background contributes to slightly increment the hazard within the EBSZ buffer area in the zones farther from the traces and influence of the faults (e.g., E of BSF-4) or next to faults with slip rates much lower than the average of the system (∼0.5 mm/yr; based on the mean values in Table 1); mainly PF. In these zones, the poor influence of faults allows the background of the FM_bg model to overcome the occurrence rates (i.e., probabilities of exceedance) of the hazard from the FM model, thus higher values are found in the FM_bg model within a same RP.
The maximum hazard increments caused by the background take place E of BSF-4 (Figure 8), where the Bajo Segura fault-system terminates. This is because fault-related seismic hazard influence is larger and wider in the transversal sections across faults rather than in their longitudinal ends, as it can be seen in CF or the Southwestern termination of AMF (Figures 4, 5). In addition, BSF-4 has a lower slip rate (∼0.2 mm/yr; Table 1) than the average of the faults in the system and the closest area sources in this zone, i.e., #31, #39 and especially #41 (Figure 2B), have very low activity rates (IGME, 2015b). This particular situation causes low occurrence rates of the hazard from the FM model in this zone and allows the background (FM_bg) to overcome such rates more remarkably than any other zone.
These observations are consistent with the disaggregation results of the FM_bg model as in general the background shows low contributions on the hazard, especially where faults dominate the hazard (Figure 7 and Supplementary material). Only in the case of Vera, the seismic background has a significant contribution due to the lower slip rates, hence activity rates, of the PF (Figures 7E,F). This causes the background to overcome the contribution of PF in the Mw 4.0–5.5 range and to contribute significantly to the seismic hazard levels of the city, especially in longer RPs (Figure 7F).
Area Sources Influence
From the mean hazard maps of both FM and FM_bg models it can be observed that the area sources have a much minor footprint in the seismic hazard distribution of the EBSZ than the faults. This is mainly because the activity rates of the area sources modeled are either very low (#31, #36, #39 or #41; IGME, 2015b) or are located too far (>100 km) to have a significant impact in the hazard of the mapped region, such as the North-African source areas (#43, #44 and #45) (Figure 2B). Nevertheless, area sources such as #37 and #38 have a recognizable influence on the hazard results as their shapes can be recognized in the hazard maps especially for the 2,475 and 4,975 years RPs (Figures 4, 5). These area sources have high activity rates comparable to the EBSZ buffer area (IGME, 2015b) and contain faults known to be capable of producing Mw > 5.0 earthquakes, such as the Crevillente Fault or the Andarax Valley and El Alquián fault systems (#37 and #38, respectively; Figure 2).
The hazard disaggregation shows the contribution of area source #38 on the hazard of Almería for RPs of 2,475-years RP (Figure 7D) as the city is located inside this area source. Contrarily, neither Lorca or Vera have contribution of area sources into their hazard (Figures 7A–F, respectively) as they are located ∼8–9 km from the closest area source limit. Although these areas are at relatively close distances, the higher proximity of AMF-1 in Lorca and the low activity rates of the closer area #36 in Vera prevent them to contribute to the hazard in these cities.
Mean Hazard Curves
Figure 6 shows the mean hazard curves obtained for five cities located close to the EBSZ faults (Almería, Lorca, Murcia, Vera and Torrevieja) for both the FM and FM_bg models. It is clear that setting a background ratio for the EBSZ buffer area does not imply dramatic changes in the hazard curves of these cities, which are all very close to active faults. In the case of the Almería, Lorca and Murcia, the respective hazard curves of both models predict practically identical PGA values for any RP. Conversely, in Torrevieja and, especially, in Vera, the FM_bg model predicts higher PGAs than the FM model, although these differences are very small: less than <0.1 g for the ∼10,000 years RP. The reason for these differences between models is the lower slip rates of the BSF and PF, respectively for Torrevieja and Vera, compared to the other faults close to the other studied cities.
Discussion
Comparison With Previous Probabilistic Seismic Hazard Assessment in SE Spain: Implications of the Modeling
The results presented in this study highlight a clear influence of the faults of the EBSZ in the seismic hazard values of SE Spain, as shown in Figures 4–7. Both of the FM and FM_bg source models applied for the hazard calculations show very similar results, meaning that the application of a background ratio has minor influence on the hazard, especially in those zones closer to faults (Figure 8). Hence, for the comparison analysis that follows we will focus on results of the FM model, though practically all the observations are also applicable to the FM_bg model results. In the same way and due to the low impact of the background on the hazard, the fault influence observations from the disaggregation of the FM_bg model (Figure 7) are valid for the FM model. We compare our results with a PSHA produced only considering the ZESIS area sources model, as well as with a recent fault-based PSHA done in SE Spain (Rivas-Medina et al., 2018).
Comparison With a Probabilistic Seismic Hazard Assessment Using the ZESIS Area Source Model
The PSHA results of our FM model are compared with a PSHA reached here by using exclusively the area sources of the ZESIS model (Figure 2B) and the same GMPE as our calculations (Campbell and Bozorgnia, 2014). Significant changes in PGA are found between both models within the limits of the EBSZ, where the faults are modeled (Figures 9A–D); outside these limits, the hazard values do not experience any change since all use the same area sources model. The FM model increases the PGA with respect to the areas approach in the zones strictly around the faults. Hence, faults concentrate the hazard highlighting the controlling effect of the faults on the hazard levels. The curves in Figure 10A depict this effect as Lorca, which is located nearly on top of AMF (Figure 2A), shows the highest increment in the FM model. Next, Murcia and Almería show progressively lower PGA increments with respect to the areas model as the distance to the fault increases. These hazard increments in the near-fault zones are achieved by reducing the hazard in the zones farther from the faults with respect to the areas approach and are more visible in longer RPs (975 years RP or larger; Figures 9B–D), where the faults have more influence.
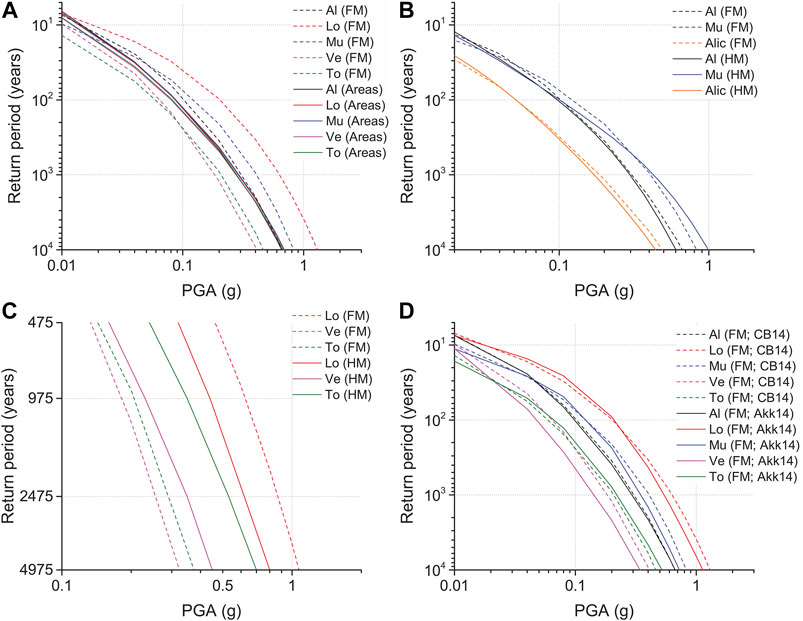
FIGURE 10. (A) Mean hazard curves for PGA (g) of the FM model plotted with the ones of the ZESIS areas model for the cities of Almería (Al), Lorca (Lo), Murcia (Mu), Vera (Ve) and Torrevieja (To); (B) Mean hazard curves for PGA (g) of the FM model and the HM model from Rivas-Medina et al., 2018 for the cities of Almería, Alicante (Alic) and Murcia and (C) for the cities of Lorca, Vera and Torrevieja. In these last three cities, the results are visually inferred from pixels of the maps from this publication, hence the curves are exclusively plotted for the return periods of 475, 975, 2,475, and 4,975 years (D) Mean hazard curves for PGA (g) of the FM model using the CB14 (Campbell and Bozorgnia, 2014) and Akk14 (Akkar et al., 2014) GMPEs and for the same cities as Figures 6, 10A.
The influence of faults on the hazard (net PGA and areal extension) respect to the areas approach, strongly depend on the fault slip rates. The cross sections A-A′ and B-B’ (Figure 9E), show that higher slip rate faults in the system such as CF or AMF-1, respectively (1–2 mm/yr; Table 1) influence the hazard up to 10–20 km far from the fault trace for all return periods. This causes significant increments in the PGA values within 20–40 km-wide influence zones of ∼70–80% for all RPs in CF-3 and ∼130–150% for all RPs in AMF-1 (Figure 9E). Such increments are slip rate dependent, thus higher for AMF-1 because it has the highest slip rate. Despite this, the disaggregation results of the FM_bg model show that faults can control the hazard in regions farther than the influence zone of the faults up to 20–30 km from its traces, as it is the case of AMF-1 in Vera (Figures 7E,F). Farther than this distance limit however, no source has significant influence in any part of the studied area. Fault influence zones are also dependent on the dip direction in non-vertical dipping faults (AMF, BSF), wider in the hanging wall (Figure 9E), implying a hanging wall effect.
Contrarily, lower slip rate faults have much less impact on the hazard with respect to the areas approach. Although no exhaustive slip rate analysis has been performed, it can be observed that the faults that have slip rates <0.1 mm/yr do not increase the seismic hazard and it is overcome by the areas approach, as it is the clear case of PF (Figures 9, 10A in Vera). Even so, faults with slightly higher slip rates (∼0.1–0.4 mm/yr; AMF-4, LTF or BSF) do influence the hazard, but their impact is more limited than AMF-1, 2 or CF, even for long RPs (Figure 9D). The cross section in BSF-3 (C-C’; Figure 9E) depicts one of these latter examples. This fault section has a slip rate range 4–14 times smaller than AMF-1 and CF (0.12–0.3 mm/yr; Table 1), which causes its influence zone to be over 2–3 times smaller (<10 km wide). In this case the near-fault PGA increments are negligible for short RPs of 475- and 975-years and very small (<0.1 g) for longer RPs (Figure 9E). The small influence of the fault causes the FM’s PGA values to be overcome by the ones of the areas approach in less than 5 km from the peak of maximum fault influence. This is also depicted by the Torrevieja curves (Figure 10A) and the maps of Figure 9. The implications of lower slip rate faults on the hazard are discussed in section 5.2.
The consideration of near-fault hazard in zones in the vicinity of the EBSZ faults as both FM and FM_bg models do, including effects such as the hanging wall, provides more realistic estimations of the seismic hazard. This is relevant because during earthquakes, zones close to active faults are exposed to higher accelerations than farther zones due to these near-source effects (e.g., 2011 Lorca earthquake; Alguacil et al., 2014). Their location respect to the dip direction of the fault is also relevant for the ground motion, usually higher in the hanging wall (e.g., Yu and Gao, 2001). Conversely, area source approaches do not reproduce these effects, but uniform PGA distributions within an area, as depicted by the nearly identical mean hazard curves of the cities within the EBSZ buffer area (Figure 10A). A detailed and representative analysis of the relationship between PGA, distance to the fault and influence of fault slip rate is a necessary step to be taken in further hazard studies in the region, as it could be useful to define amplification coefficients in earthquake resistant provisions to account for near-fault effects at sites located next to active faults.
Comparison With Rivas-Medina et al., 2018 Fault-Based Approach
We compare the results from the FM model with the fault-based study of Rivas-Medina, 2014, recently published in Rivas-Medina et al., 2018. In that study a PSHA of Southern Spain is performed considering faults as independent, non-interacting sources, following a hybrid methodology (HM model) that avoids setting an arbitrary cutoff magnitude for modeling seismicity in the background (see details in Rivas-Medina et al., 2018). The PSHA was performed for a larger territory of SE Spain than the present study and for all the active faults of the region as compiled in the old QAFI v.2 database back in 2012. The areal model for this study (GM10) is different from the ZESIS model (aka GM12; IGN-UPM, 2013) as it does not identify the EBSZ buffer area (area #55; Figure 2B). The GMPE used is the same as in our study. We compare the mean hazard curves of the FM model with the HM model, including Alicante (Figures 10B, 10C). The hazard curves for the cities of Lorca, Vera and Torrevieja were not computed specifically by the authors, hence we inferred visually the PGA values at these cities from pixel screening of the hazard maps for each of the four RPs calculated (475, 975, 2,475 and 4,975 years; Figure 10C).
The main contribution of our work with respect to Rivas-Medina et al., 2018 is the consideration of multi-fault ruptures in the source modeling, which causes differences in the hazard estimations mainly for long RPs. Regarding the EBSZ as a whole in PSHA is a novelty in Spain and might constitute a more realistic approach to model the seismic hazard. The main point is that multi-fault ruptures are regarded as a frequent phenomenon, demonstrated by numerous morphogenetic earthquakes in the last decades (e.g., Choi et al., 2012; Hamling et al., 2017; Villani et al., 2018).
In general, the study by Rivas-Medina et al., 2018 provides hazard levels in the range of the ones obtained by the FM model, however there are noteworthy differences. These are mainly due to 1) the consideration of multi-fault ruptures in the FM model, 2) differences in the fault data used in each source modeling, 3) the background seismicity of the HM model and 4) the number of faults considered. The FM model treats the fault system as a whole by allowing the possibility for faults to rupture simultaneously in multi-fault ruptures including large rupturing scenarios. This consideration allows a larger number of fault rupture possibilities to host a certain magnitude and therefore hazard values are generally higher for this model, as shown by the curves of Lorca, Almería and Alicante (Figures 10B,C). These differences are more notable in RPs over ∼1,000 years because multi-fault ruptures produce higher magnitudes that control the longer RPs. Moreover, the discrepancies in the slip rate values and segmentation between both FM and HM models are also responsible for the hazard differences. For instance, the higher values of the FM in Lorca are because updated slip rate data for AMF-1 and AMF-2 are used (1.65 and 1.0 mm/yr, respectively; Table 1), contrary to the HM model (0.3 and 0.5 mm/yr). The higher values in Almería, on the other hand, are because CF is divided in three segments with a mean slip rate of 1.1 mm/yr (Table 1) in the FM model, while in the HM it is divided in two segments, one of which uses an outdated slip rate (0.04 mm/yr).
In the cities of Murcia, Vera and Torrevieja, the curves of the HM model predict higher values than the FM model (Figures 10B,C). In Murcia this is only for RPs over ∼500 years, as for lower RPs the tendency is the same as the mentioned for Almería and Lorca. We attribute this to the fact that CAF, which controls the hazard of this city (see disaggregation in the Supplementary material), is considered as a single-segment fault in the HM model (CAF; 0.54 mm/yr), while in the FM as two segments with different and lower mean slip rates (0.37 and 0.53 mm/yr for CAF-1 and 2, respectively; Table 1). In RPs over 500 years this implies that probably a big part of the magnitudes that in the HM model are achieved independently by CAF, in the FM model are achieved by multi-fault ruptures involving CAF-1 and 2. As the slip rates of CAF-1 are lower than CAF-2, the occurrence rates of these multi-fault ruptures are limited by the former (see slip rate treatment in SHERIFS on section 3.1.1) and hence are lower than the HM model in this area. On the other hand, the fact that the fault is divided in two segments increases the earthquake rates of lower magnitudes and consequently the PGA values for low RPs (<500 years) in this city with respect to the HM model (Figure 10B). As such, linked ruptures between segments, i.e., higher magnitudes, are less frequent in low RPs.
In Vera and especially Torrevieja the higher values of the HM model are visible in all four RPs represented (Figure 10C). In the former, the hazard is not controlled by the nearest faults due to the low activity rates of PF, so the background seismicity of the HM model overcomes the ones from the FM. Remarkably, performing this comparison with the curves from the FM_bg model would produce practically the same results, as the background seismicity of the HM model is modeled for a larger magnitude range (Mw 4.0–6.9) and implies higher seismicity rates. In the latter, the higher HM values are because in this area, additional fault sources apart from the BSF are considered in the modeling (Torrevieja and San Miguel de Salinas faults; Figure 2A). While the incorporation of more fault sources on the hazard might suggest that the results from the HM model in the Torrevieja zone are more accurate than the FM, it should be noted that including more faults on the hazard does not necessarily imply more accurate results. These additional faults are not included in our models because are secondary faults to the BSF system (Alfaro et al., 2012) and hence are not part of the main structures in the EBSZ. Moreover, neither their relationship with the EBSZ system and their geological parameters have been studied in detail. The inclusion of such faults on the hazard should account for these uncertainties as they could imply misguided hazard estimations.
Implications for Moderate Magnitude Earthquakes
The hazard results from the disaggregation show that moderate magnitudes in the Mw 4.5–6.0 range, although not being the most remarkable, have a non-depreciable contribution to the final hazard in the selected studied sites even in long RPs (e.g., Almería and Vera; Figures 7D,F, respectively). Moreover, according to Gaspar-Escribano et al., 2008, in SE Spain, low-to-moderate magnitude earthquakes between Mw 4.0 and 5.5 control seismic hazard for the 475 years RP. Such kind of earthquakes are relatively frequent in SE Spain and have demonstrated to be quite destructive. The 1999 Mw 4.8 Mula, 2002 Mw 5.0 Bullas and 2005 Mw 4.8 La Paca earthquake series are some recent examples (Benito et al., 2007), being the 2011 Mw 5.2 Lorca earthquake the latest one (Martínez-Díaz et al., 2012a).
The near-source effects of the 2011 Mw 5.2 Lorca earthquake produced exceptionally high accelerations around 0.37 g in the city of Lorca (Cabañas et al., 2011) due to: 1) the proximity of the epicenter to the city, 2) the shallow depth of the earthquake and 3) the directivity of the rupture propagation toward Lorca (Alguacil et al., 2014). The hazard map of the current Spanish Building Code (NCSE-02, 2002) for the 500 years RP and the updated national seismic hazard map for the 475 years RP (IGN-UPM, 2013) predict PGA values in Lorca (0.12 and 0.19 g, respectively) that underestimate the PGA reached in the Lorca earthquake. Conversely, the results of the FM model, but also FM_bg, predict values that differ less than 0.1 g from the ones reached in the 2011 Lorca earthquake: ∼0.45 g for the 475 years RP. Rivas-Medina et al., 2018 predict slightly lower values of 0.3 g in Lorca for the same RP, but that are also close to the measured ones.
The fact that fault-based PSHAs in SE Spain predict PGA values for the 475 years RP coherent to the ones of the Lorca earthquake, whose moderate magnitude produced severe damage, may suggest that fault-based approaches perform more realistic hazard predictions than classical area source approaches, particularly for sites located on top of faults or in their vicinity. The PSHA such as the one presented in this study or the one from Rivas-Medina et al., 2018 approximate better the hazard for short RPs due to the effect of faults. However, other site effects such as topography, directivity and changes in soil properties should be incorporated for a more accurate hazard estimation, especially in seismic microzonation.
Implications of the Fault Slip Rates
Slip rate data of faults is a controlling factor in the hazard values obtained in this study as it has a direct impact on the probabilities of exceedance in a given observational period. Higher slip rate faults (e.g., AMF-1 and 2 or CF) imply higher PGA values and influence than lower slip rate faults, some of which have slip rate values so low (<0.1 mm/yr; PF) that are not able to influence significantly the hazard at any RP. This is also observable in the slip rate values used by the source models that compose each branch of the logic tree in relationship with the resulting PGA for each model (Figure 11). Each source model is built by picking a random slip rate value from the fault uncertainty ranges provided as inputs (Table 1). Thus, aside from the fault rupture hypotheses considered, the models that use higher slip rate values within the uncertainty range show an overall tendency to produce higher PGA estimations at closer sites within the same hypothesis (e.g., AMF-1 in Lorca; Figures 11A,B). Nevertheless, the data in the plots from Figure 11 show high dispersion, which suggests that the slip rate uncertainty is not the only parameter affecting seismic hazard variability. In fact, the proximity of the analyzed site to the fault, the rupture hypothesis in question or the RP might control the slope of the mentioned tendency for each hypothesis. Closer sites, i.e., Lorca, result in steeper slopes, similarly to higher RPs (Figures 11A,B).
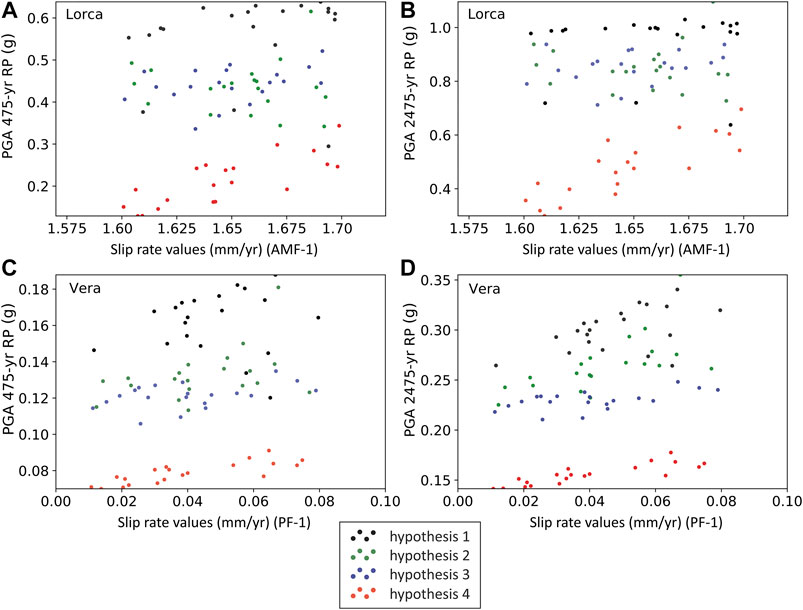
FIGURE 11. (A) Relationship between the slip rate values of AMF-1 used in each 80 source models that compose the logic tree of this study and the respective PGA (g) values obtained in the city of Lorca for the return periods of 475 years and; (B) 2,475 years; (C) Same relationship for PF-1 and the PGA (g) obtained in the city of Vera for the return periods of 475 years and; (D) 2,475 years. Note that the faults considered are the closest to the cities analyzed and so that can highlight a better effect. The source models belonging to each fault rupture hypotheses that compose the logic tree of this study are depicted in different colors.
PGA variations as a function of slip rate uncertainty are more remarkable in higher slip rate faults (Figures 11A,B), despite their uncertainties being smaller than for lower slip rate faults (Figures 11C,D). AMF-1 has an uncertainty that represents only the ∼3% of the mean, while it is ∼100% for PF-1 (Table 1), however the hazard variations linked to the slip rate variations are considerably higher for the former in Lorca than the latter in Vera. This is because lower slip rates have less impact on the return periods studied than higher slip rate faults, which is consistent with the low influence of PF in our hazard calculations (Figures 7E,F).
The identification of the method and source of information upon which slip rate data is based on for each individual fault (Table 1) is a crucial step, as it affects the reliability of such data and ultimately the hazard results. At the EBSZ, this is one of the main challenges today as most paleoseismic studies focus only on specific fault sections or single strands of faults with multiple branches, while others remain poorly studied. The faults that concentrate most part of these studies and thus have a better characterization are AMF-1 and 2, CAF and CF. Although most of these focus only on the major fault branches, their slip rate estimations are robust and consistent with overall geodetic data (see section 2 and references of Table 1). Conversely, PF, AMF-3 and 4 or BSF have not been object of detailed paleoseismic research to date and fault data is inferred based on qualitative geomorphological indicators and from geodetic data. These less studied faults at the EBSZ are the ones that have lower slip rate estimations (Table 1) and contribute poorly to the hazard, which could imply a bias of such hazard towards well-studied faults.
Considering the clear sensitivity of the seismic hazard to the fault slip rates, the acquisition of new data in the less studied faults is critical to increase the quality and reliability of the current available data compared to other faults in the EBSZ. Updated parameters can have important implications in the hazard results around them, especially PF. On the other hand, in the zones farther from the mentioned faults and controlled by faults with more paleoseismic research, seismic hazard estimations are more reliable and critical seismic parameters are well constrained (see references in Table 1).
Implications of the Ground Motion Prediction Equation Selection
The selection of GMPEs for PSHA is also a difficult task as it has a great influence on the hazard results obtained for a particular study region and sometimes can mask or exaggerate the influence of a seismic source. In this study, we selected a NGA GMPE that is well adapted for fault-based PSHA (Campbell and Bozorgnia, 2014; section 3.2) as it is sensitive to near-fault effects. Therefore, the strong contribution of the faults into our hazard models could be seen as a result of applying such equation. In order to test the sensitivity of the hazard models to the GMPEs we performed the hazard calculation of the FM model using the equation by Akkar et al., 2014 (henceforth Akk14). We used this equation because is not as specifically designed for near-fault effects as the one by Campbell and Bozorgnia, 2014 (henceforth CB14) and the source characteristics of earthquakes are exclusively represented by magnitude and style of faulting. The mean hazard maps of the FM model using Akk14 are shown in Figures 12A,B for the 475- and 4,975-years RPs. The differences with the CB14 equation are depicted in the maps of Figures 12C and 12D and the cross sections of Figure 12E for the same RPs. Only these two extreme RPs are shown in order to point out the maximum variations with the CB14 equation.
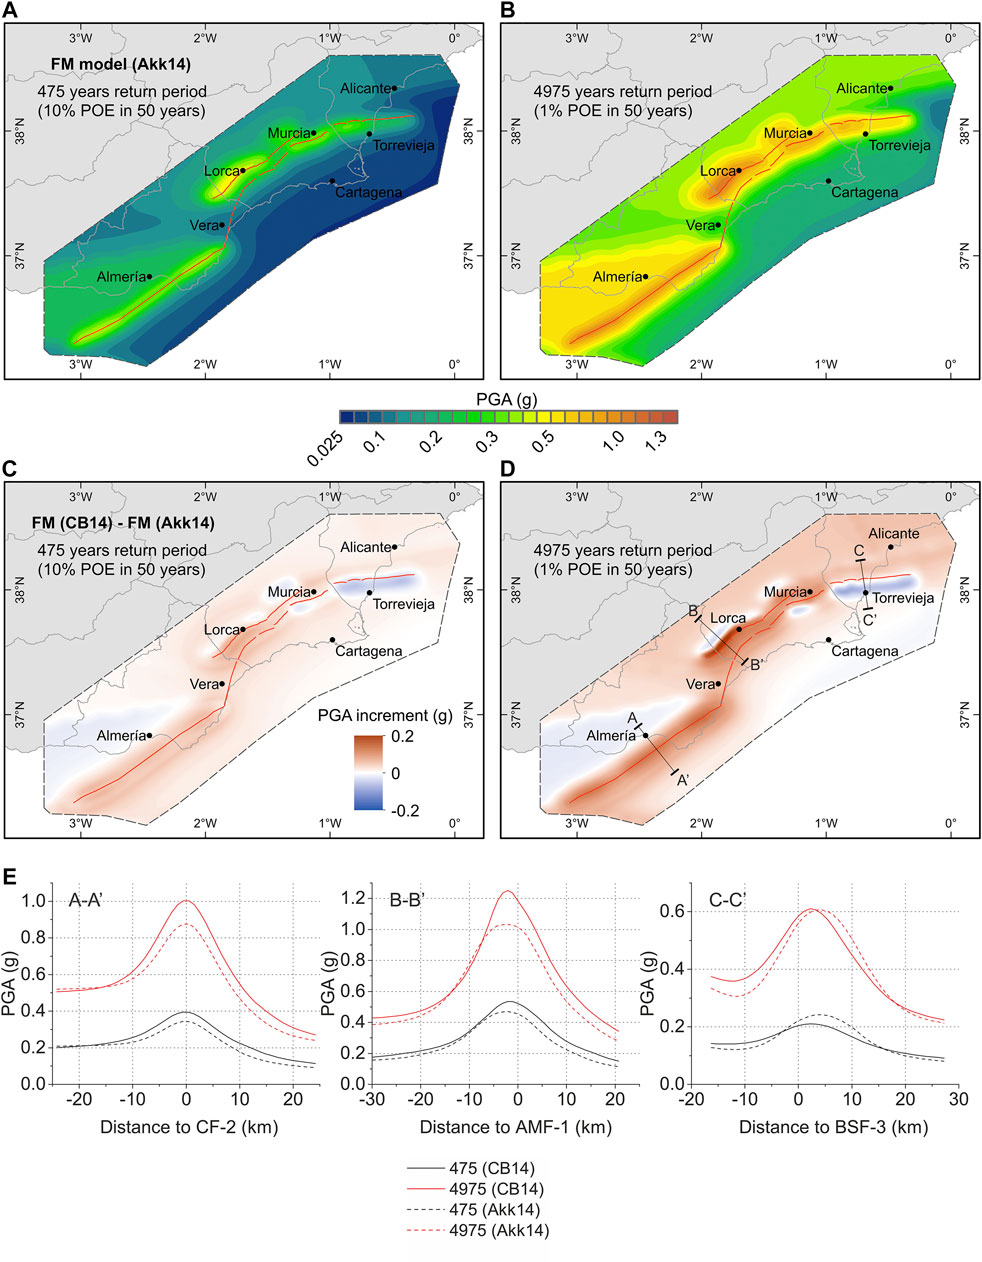
FIGURE 12. (A) Mean hazard maps for PGA (g) of the FM model using the Akk14 GMPE (Akkar et al., 2014) for the return periods of 475 years and; (B) 4,975 years. The color scale is common for both return periods; (C) Difference (in g) of the mean hazard maps from the FM model using the CB14 equation with respect to using Akk14 for the return periods of 475 years and; (D) 4,975 years. The color scale is common for both return periods. The traces of the EBSZ faults considered are depicted in red in all panels; (E) Cross sections representing PGA (g) values of the FM model using the CB14 (solid line) and Akk14 (dashed line) GMPEs as a function of distance to the surface fault trace and for the same return periods as the maps. The locations of the cross sections are indicated in Figure 12D.
The sensitivity test performed with the Akk14 equation evidences that the influence of the EBSZ faults on the hazard results performed in this paper is independent of the GMPE used. Therefore, the marked influence of the faults into the PSHA is not a consequence of the GMPE. The resulting mean hazard maps of Akk14 (Figures 12A,B) are very similar to the ones obtained with the CB14 equation (Figure 4) showing a similar hazard distribution. Faults have a clear influence on the hazard for both RPs explored in the near-fault zones and the highest PGA values are found along the traces of the faults, especially the most active according to their slip rates (e.g., AMF-1 and CF). Hanging wall effects are also recognized in the map using Akk14 for non-vertical dipping faults (AMF, CAF and BSF; Figures 12A and 12B).
Despite this, due to its less sensitivity to near-fault hazard estimations, Akk14 computes a more diffuse hazard estimation around the faults, with lower PGA values in general and lower PGA increments as a function of distance to the fault trace (Figure 12E). Therefore, CB14 produces higher PGA values than Akk14 for most of the mapped area and especially around faults, accentuating near-fault effects on the hazard levels. Maximum variations are located close to the traces of faults with higher slip rates, importantly around CF or AMF-1, where these are up to 0.1 and 0.2 g, respectively for the 4,975 years RP and <0.1 g for the 475 years RP (A-A′ and B-B′, respectively; Figure 12E). The mean hazard curves from Lorca, Almería, Murcia and Vera also depict PGA increments for the CB14 equation in RPs over ∼100 years (Figure 10D). In other lower slip rate faults such as BSF, the use of different GMPEs implies practically negligible PGA variations for all RPs (C-C′ cross section along BSF-3; Figure 12E). In this case, for the 475 years RP, the use of Akk14 provides slightly higher PGA values (∼0.05 g) due to the less sensitivity of the equation to the fault slip rates, up to one order of magnitude lower than AMF-1 or CF (Table 1).
In non-vertical dipping faults, hanging wall effects are more accentuated with the CB14 equation (Figures 12C–E). In the zones further away from the fault trace on the hanging wall, hazard decreases more abruptly with CB14 with respect to Akk14, especially in long RPs. The higher PGA gradient around the fault trace causes a rapid drop on the hazard values with respect to the lower gradient of Akk14 as distance to the fault increases. AMF, CAF and BSF are clear examples of this effect and, in particular, BSF is the one affected by highest reductions on the hanging wall for all RPs, because the surface projection of its fault plane is larger (Figures 12C,D). The curve of Torrevieja represents this effect related to the BSF (Figure 10D).
Overview: Limitations and Perspectives
The high hazard values in the near-fault zones, the high contribution of faults on the sites hazard and the agreement of the 475 years RP PGA values with the 2011 Lorca earthquake represent more coherent results with the observed values than classical area source methods. Examples of these classical methods are the current Spanish Building Code (NCSE, 2002) and the updated national seismic hazard map (IGN-UPM, 2013). The inclusion of multi-fault ruptures into fault-based PSHA is a novelty for Spain and yet unusual in other low-to-moderate seismicity regions worldwide. Generally, the lack of fault data prevents such kind of analysis in these regions, but as seen, it can imply very important hazard (PGA) changes respect to classical approaches. Moreover, considering multi-fault ruptures is a step forward towards a more realistic seismic hazard assessment, as the occurrence of multi-fault ruptures in nature is becoming an increasingly identified phenomena (e.g., Langridge et al., 2018; Quigley et al., 2019). We therefore aim that our study could serve as a case example for other studies focused in low-to-moderate seismicity regions, such as the EBSZ.
Nevertheless, it is necessary to assess the uncertainties of our study that affect the results presented and need to be considered when interpreting them. One remarkable topic is the background ratio selection of our study. The ratios modeled are an assumption that is established following expert opinion, based on available geological and seismological data from earthquakes in the region. This means that the ratios are not necessarily defining of the study area, but an approximation. The option selected here considers that a big part of the earthquakes in the Mw 4.0–5.5 range are related to the faults modeled because it is consistent with observations (section 3.1.1.2). However, we acknowledge the existent implicit epistemic uncertainties within this assumption, as exemplified by the main shocks of the 2019 Ridgecrest sequence (Mw 6.4 and 7.1), which developed in non-previously mapped faults (Ross et al., 2019). In this sense, other background ratios could and should be explored in a logic tree in further research to account for the epistemic uncertainty of earthquakes happening outside of the known faults. In the line of Chartier et al., 2019, we also recognize the difficulty of setting this parameter and encourage the discussion among researchers on what parameters could help its determination. This is a key issue in SE Spain considering the aforementioned large uncertainties affecting the seismicity epicenter locations of most Mw ≥ 4.0 earthquakes.
Another limitation of our results is the fact that the present hazard calculations may be underestimating the contribution of other fault sources in SE Spain outside of the EBSZ fault system. There are many Quaternary-active faults within the mapping area selected in our study that have not been considered in the source modeling mainly because of a lack of quality data, contrary to the faults within the EBSZ. Fault systems such as El Alquián and Andarax Valley, Polopos or San Miguel de Salinas (Figure 2A) are some examples of active faults in the area with evidence of related seismicity (QAFI database; IGME, 2015a). These faults could also contribute to the seismic hazard, especially outside the EBSZ buffer area, although none of them have the dimensions (length) of the ones in the EBSZ considered in our study and thus their contribution should not be expected to be that relevant.
Further research is then encouraged to focus on incorporating such uncertainties in the light of a more complete and accurate PSHA analysis. As such, in the zones where there is a lack of paleoseismological studies, obtaining well-constrained and updated fault parameters, especially slip rate values, is critical because they can compromise the reliability or bias of the hazard results. This is not only important for the EBSZ faults but also for the ones outside of it and not included in this study. Updated paleoseismic and geodetic data on faults and the inclusion of more faults as sources would necessarily lead to a reassessment of the source modeling and the hazard in the region. In the meanwhile and given the need of updated and more realistic hazard assessments, it would be useful to consider the near-fault hazard estimations in our models as they could help to set near-fault amplification coefficients to be applied at sites located on top of active faults or in close vicinity. Further research should also focus on exploring the use of other parameters rather than PGA to quantify the seismic hazard such as the spectral acceleration or peak ground velocity and displacement. These parameters are more indicative of the damage generated by an earthquake than PGA as they highlight possible amplification effects in buildings and structures at a given site that ultimately are of interest for seismic engineering purposes. In this sense, and additionally to the use of GMPEs, exploring approaches of spatially correlated ground motion intensity measures (e.g., Park et al., 2007) could be interesting for further research in order to better characterize expected ground motion, damage and loss estimates for seismic hazard and risk assessment.
Conclusions
This paper presents a fault system-based PSHA of SE Spain in which earthquake occurrence in the EBSZ is modeled at the scale of the whole fault system and using geological fault data. We devised two alternative models for characterizing the seismicity in the EBSZ, one assuming that all seismic activity is due to known faults of the EBSZ (FM) and another in which part of the seismicity (Mw 4.0–5.5) also occurs as background, related to unknown active faults (FM_bg).
The main conclusion is that, for both models analyzed, faults dominate the seismic hazard in the areas located around faults up to 20–30 km from them, even for short return periods of 475 years. This is remarkable for SE Spain as most of the important cities or towns in this area are commonly found on top or very close to Quaternary active faults (e.g., Lorca, Murcia, Totana, Alhama de Murcia, etc.). Fault effects increase PGA values compared to previous PSHAs based on classical area source methods, but their influence zone is strongly dependent on their slip rates. Around the faults with the higher slip rates of the system, such as the Carboneras Fault or the southwestern end of the Alhama de Murcia Fault (>1 mm/yr), the PGA values are increased up to 150% respect to area source methods for all return periods and the fault influence extends up to 10–20 km from the fault traces. On the other hand, lower slip rate faults such as Bajo Segura Fault (∼0.2 mm/yr) produce minor PGA increments, only significant for long return periods, and their influence zones extend up to 5 km from the trace. Around non-vertical dipping faults (e.g., Alhama de Murcia and Bajo Segura faults), the higher hazard values are found in the hanging wall, implying hanging wall effects. Lastly, the faults with the lowest estimated slip rates of the system such as Palomares Fault (<0.1 mm/yr) have no significant impact in the hazard whatsoever. The very similar results from both models evidence that modeling a small portion of the Mw 4.0–5.5 seismicity rate as background (FM_bg) has a minor impact on the seismic hazard of the EBSZ, because fault activity generally overcomes the rates of the background.
The fault-based approach presented seems to provide more accurate hazard estimations than classical area source approaches in sites located close to the faults, at least for the return period of 475 years typically dominated by moderate-magnitude earthquakes. Our hazard results in Lorca for this return period appear to be more consistent with the instrumental PGA values recorded during the 2011 Mw 5.2 earthquake than the ones predicted in the Spanish Building Code or in the updated national seismic hazard map. Also, the consideration of multi-fault ruptures in the source modeling causes significant differences with previous fault-based PSHA in SE Spain and it is a step forward to account for the complexity observed in nature. This kind of approach is a novelty in Spain and might serve as a case example for other low-to-moderate seismicity regions worldwide.
Fault slip rate and its uncertainties have an important influence on the seismic hazard, especially in higher slip rate faults that have more impact in the studied return periods. However, the lack of detailed paleoseismic studies in some lower slip rate faults of the EBSZ (Palomares Fault, Bajo Segura Fault and northeastern termination of Alhama de Murcia Fault) compromises the reliability of the hazard in their surroundings. We identify thus that further research should focus primarily on the obtention of new data to characterize these faults. In the meanwhile, we suggest the use of a near-fault amplification coefficients to be applied to the basic design acceleration provided in the current seismic code for the buildings near Quaternary active faults in this region.
Data Availability Statement
The original contributions presented in the study are included in the article/Supplementary Material, further inquiries can be directed to the corresponding author.
Author Contributions
OGN and JGM conceived the original idea of the paper, prepared the input data and performed the hazard calculations. OGN, JGM and TC contributed to the interpretation of the results. All authors contributed to the discussions and preparation of the manuscript.
Funding
This work was funded by the PREVENT project (CGL2015-66263-R) and FPI predoctoral grant of Octavi Gómez‐Novell (BES‐2016‐077048) from the Spanish Ministry of Science, Innovation and Universities. Open access fees were partially funded by the Vice-rectorate for Ph.D. and Research Promotion of the University of Barcelona.
Conflict of Interest
The authors declare that the research was conducted in the absence of any commercial or financial relationships that could be construed as a potential conflict of interest.
Acknowledgments
The authors want to thank Alicia Rivas-Medina for providing files for the comparison performed in the present paper and the ESC Fault2SHA working group for the discussions on the main topics of fault data as inputs for PSHA. We also want to thank Chong Xu, Sergio Molina-Palacios and an anonymous reviewer for their comments and suggestions that contributed to improve this paper.
Supplementary Material
The Supplementary Material for this article can be found online at: https://www.frontiersin.org/articles/10.3389/feart.2020.579398/full#supplementary-material.
References
Akkar, S., Sandıkkaya, M. A., and Bommer, J. J. (2014). Empirical ground-motion models for point- and extended-source crustal earthquake scenarios in Europe and the Middle East. Bull. Earthq. Eng. 12, 359–387. doi:10.1007/s10518-013-9461-4
Alfaro, P., Bartolomé, R., Borque, M. J., Estévez, A., García-Mayordomo, J., García-Tortosa, F. J., et al. (2012). The Bajo Segura fault zone: active blind thrusting in the eastern betic cordillera (SE Spain). J. Iber. Geol. 38, 287–300. doi:10.5209/rev_JIGE.2012.v38.n1.39217
Benito, B., Capote, R., Murphy, P., Gaspar-Escribano, J. M., Martínez-Díaz, J. J., Tsige, M., et al. (2007). An overview of the damaging and low magnitude Mw 4.8 La Paca earthquake on 29 January 2005: context, seismotectonics, and seismic risk implications for southeast Spain. Bull. Seismol. Soc. Am. 97, 671–690. doi:10.1785/0120050150
Borque, M. J., Sánchez‐Alzola, A., Martin‐Rojas, I., Alfaro, P., Molina, S., Rosa‐Cintas, S., et al. (2019). How much nubia‐eurasia convergence is accommodated by the NE end of the eastern betic shear zone (SE Spain)? constraints from GPS velocities. Tectonics 38, 1824–1839. doi:10.1029/2018TC004970
Bousquet, J.-C. (1979). Quaternary strike-slip faults in southeastern Spain. Dev. Geotectonics. 13, 277–286. doi:10.1016/B978-0-444-41783-1.50044-1
Bungum, H. (2007). Numerical modelling of fault activities. Comput. Geosci. 33, 808–820. doi:10.1016/j.cageo.2006.10.011
Cabañas, L., Carreño-Herrero, E., Izquierdo-Álvarez, A., Martínez-Solares, J. M., Capote, R., Martínez-Díaz, J. J., et al. (2011). Informe del sismo de Lorca del 11 de Mayo de 2011, Madrid, Spain, Available at: http://hdl.handle.net/10261/62381 (Accessed Febuary 20, 2011).
Campbell, K. W.,, and Bozorgnia, Y. (2014). NGA-West2 ground motion model for the average horizontal components of PGA, PGV, and 5% damped linear acceleration response spectra. Earthq. Spectra. 30, 1087–1114. doi:10.1193/062913EQS175M
Chartier, T., Scotti, O., and Lyon‐Caen, H. (2019). SHERIFS: open‐source code for computing earthquake rates in fault systems and constructing hazard models. Seismol Res. Lett. 90, 1678–1688. doi:10.1785/0220180332
Choi, J.-H., Jin, K., Enkhbayar, D., Davvasambuu, B., Bayasgalan, A., and Kim, Y.-S. (2012). Rupture propagation inferred from damage patterns, slip distribution, and segmentation of the 1957 MW8.1 Gobi-Altay earthquake rupture along the Bogd fault, Mongolia. J. Geophys. Res. 117, a–n. doi:10.1029/2011JB008676
De Larouzière, F. D., Bolze, J., Bordet, P., Hernandez, J., Montenat, C., and Ott d’Estevou, P. (1988). The Betic segment of the lithospheric Trans-Alboran shear zone during the Late Miocene. Tectonophysics 152, 41–52. doi:10.1016/0040-1951(88)90028-5
DeMets, C., Iaffaldano, G., and Merkouriev, S. (2015). High-resolution neogene and quaternary estimates of nubia-eurasia-north America plate motion. Geophys. J. Int. 203, 416–427. doi:10.1093/gji/ggv277
Echeverria, A., Khazaradze, G., Asensio, E., Gárate, J., Dávila, J. M., and Suriñach, E. (2013). Crustal deformation in eastern Betics from CuaTeNeo GPS network. Tectonophysics 608, 600–612. doi:10.1016/j.tecto.2013.08.020
Echeverria, A., Khazaradze, G., Asensio, E., and Masana, E. (2015). Geodetic evidence for continuing tectonic activity of the carboneras fault (SE Spain). Tectonophysics 663, 302–309. doi:10.1016/J.TECTO.2015.08.009
Ferrater, M., Ortuño, M., Masana, E., Martínez-Díaz, J. J., Pallàs, R., Perea, H., et al. (2017). Lateral slip rate of Alhama de Murcia fault (SE Iberian Peninsula) based on a morphotectonic analysis: comparison with paleoseismological data. Quat. Int. 451, 87–100. doi:10.1016/j.quaint.2017.02.018
Field, E. H., Biasi, G. P., Bird, P., Dawson, T. E., Felzer, K. R., Jackson, D. D., et al. (2014). Uniform California earthquake rupture forecast, version 3 (UCERF3): the time-independentmodel. Bull. Seismol. Soc. Am. 3, 1122–1180. doi:10.3133/ofr20131165
Fletcher, J. M., Teran, O. J., Rockwell, T. K., Oskin, M. E., Hudnut, K. W., Mueller, K. J., et al. (2014). Assembly of a large earthquake from a complex fault system: surface rupture kinematics of the 4 April 2010 El Mayor‐Cucapah (Mexico) Mw 7.2 earthquake. Geosphere 10, 797–827. doi:10.1130/GES00933.1
Frankel, A. (1995). Mapping seismic hazard in the central and eastern United States. Seismol Res. Lett. 66, 8–21. doi:10.1785/gssrl.66.4.8
Ferrater, M. (2016). Velocitat de desplaçament de la falla d’Alhama de Murcia (Bètiques Orientals); implicacions en el seu potencial sísmic. Dissertation thesis. Barcelona (Spain): Universitat de Barcelona.
García-Mayordomo, J. (2005). Caracterización y analisis de la peligrosidad sismica en el sureste de España. Dissertation thesis. Madrid (Spain): Universidad Complutense de Madrid.
García-Mayordomo, J. (2015). Creación de un modelo de zonas sismogénicas para el cálculo del mapa de peligrosidad sísmica de España. Dissertation thesis. Madrid (Spain): Instituto Geológico y Minero de España.
García-Mayordomo, J., Gaspar-Escribano, J. M., and Benito, B. (2007). Seismic hazard assessment of the Province of Murcia (SE Spain): analysis of source contribution to hazard. J. Seismol. 11, 453–471. doi:10.1007/s10950-007-9064-0
García-Mayordomo, J., Martín-Banda, R., Insua-Arévalo, J. M., Álvarez-Gómez, J. A., Martínez-Díaz, J. J., and Cabral, J. (2017). Active fault databases: building a bridge between earthquake geologists and seismic hazard practitioners, the case of the QAFI v.3 database. Nat. Hazards Earth Syst. Sci. 17, 1447–1459. doi:10.5194/nhess-17-1447-2017
Gaspar-Escribano, J. M., Benito, B., and García-Mayordomo, J. (2008). Hazard-consistent response spectra in the Region of Murcia (Southeast Spain): comparison to earthquake-resistant provisions. Bull. Earthq. Eng. 6, 179–196. doi:10.1007/s10518-007-9051-4
Gil, G., Vidal, F., Navarro, M., García-Jerez, A., and Pérez-Muelas, J. (2014). Characterization of earthquake shaking severity in the town of Lorca during the May 11, 2011 event. Bull. Earthq. Eng. 12, 1889–1908. doi:10.1007/s10518-013-9475-y
Global Earthquake Model (GEM) (2019). The OpenQuake-engine user manual. Global earthquake model (GEM) open–quake manual for engine version 3.7.1. doi:10.13117/GEM/OPENQUAKE.MANENGINE.3.7.1
Gómez-Novell, O., Chartier, T., García-Mayordomo, J., Ortuño, M., Masana, E., Insua-Arévalo, J. M., et al. (2020). Modelling earthquake rupture rates in fault systems for seismic hazard assessment: the eastern betics shear zone. Eng. Geol. 265 105452. doi:10.1016/j.enggeo.2019.105452
Gràcia, E., Grevemeyer, I., Bartolomé, R., Perea, H., Martínez-Loriente, S., Gómez de la Peña, L., et al. (2019). Earthquake crisis unveils the growth of an incipient continental fault system. Nat. Commun. 10, 1–12. doi:10.1038/s41467-019-11064-5
Hamling, I. J., Hreinsdóttir, S., Clark, K., Elliott, J., Liang, C., Fielding, E., et al. (2017). Complex multifault rupture during the 2016Mw7.8 Kaikōura earthquake, New Zealand. Science 356, eaam7194. doi:10.1126/science.aam7194
Herrero-Barbero, P. (2016). Análisis estructural del segmento Alhama–alcantarilla de la Falla de Alhama de Murcia y sus implicaciones en el Riesgo Sísmico. Master’s thesis Madrid (Spain): Universidad Complutense de Madrid.
Herrero-Barbero, P., Álvarez-Gómez, J. A., Martínez-Díaz, J. J., and Klimowitz, J. (2020). Neogene basin inversion and recent slip rate distribution of the northern termination of the Alhama de Murcia fault (eastern betic shear zone, SE Spain). Tectonics 39, 1–25. doi:10.1029/2019TC005750
Instituto Geográfico Nacional–Universidad Politécnica de Madrid Working Group (IGN-UPM) (2013). Actualización de mapas de peligrosidad sísmica de España 2012. Madrid, Spain: Centro Nacional de Información Geográfica, Instituto Geográfico Nacional.
Instituto Geológico y Minero de España (IGME) (2015a). QAFI v.3: quaternary active faults database of Iberia. Available at: http://info.igme.es/qafi (Accessed March 9, 2020).
Instituto Geológico y Minero de España (IGME) (2015b). ZESIS: base de Datos de Zonas Sismogénicas de la Península Ibérica y territorios de influencia para el cálculo de la peligrosidad sísmica en España. Available at: http://info.igme.es/zesis (Accessed March 9, 2020).
Instituto Geográfico Nacional (2011). Serie terremoto NE Lorca (Murcia). Available at: http://www.ign.es(Accessed May 11, 2020).
Insua-Arévalo, J. M., García-Mayordomo, J., Salazar, A. E., Rodríguez-Escudero, E., Martín-Banda, R., Álvarez-Gómez, J. A., et al. (2015). Paleoseismological evidence of holocene activity on Los Tollos Fault (Murcia, SE Spain): a lately formed quaternary tectonic feature of the eastern betic shear zone. J. Iber. Geol. 41, 333–350. doi:10.5209/rev_JIGE.2015.v41.n3.49948
Langridge, R. M., Rowland, J., Villamor, P., Mountjoy, J., Townsend, D. B., Nissen, E., et al. (2018). Coseismic rupture and preliminary slip estimates for the papatea fault and its role in the 2016 Mw 7.8 kaikōura, New Zealand, earthquake. Bull. Seismol. Soc. Am. 108, 1596–1622. doi:10.1785/0120170336
Little, T. A., van Dissen, R., Kearse, J., Norton, K., Benson, A., and Wang, N. (2018). Kekerengu fault, New Zealand: timing and size of late holocene surface ruptures. Bull. Seismol. Soc. Am. 108, 1556–1572. doi:10.1785/0120170152
Martín-Banda, R., García-Mayordomo, J., Insua-Arévalo, J. M., Salazar, Á. E., Rodríguez-Escudero, E., Álvarez-Gómez, J. A., et al. (2016). New insights on the seismogenic potential of the eastern betic shear zone (SE Iberia): quaternary activity and paleoseismicity of the SW segment of the Carrascoy Fault zone. Tectonics 35, 55–75. doi:10.1002/2015TC003997
Martínez-Díaz, J. J., Bejar-Pizarro, M., Álvarez-Gómez, J. A., Mancilla, F. d. L., Stich, D., Herrera, G., et al. (2012a). Tectonic and seismic implications of an intersegment rupture. Tectonophysics 546–547, 28–Q17 37. doi:10.1016/j.tecto.2012.04.010
Martínez-Díaz, J. J., Masana, E., and Ortuño, M. (2012b). Active tectonics of the Alhama de Murcia fault, betic cordillera, Spain. J. Iber. Geol. 38, 253–270. doi:10.5209/rev_JIGE.2012.v38.n1.39218
Masana, E., Moreno, X., Gràcia, E., Pallàs, R., Ortuño, M., López, R., et al. (2018). First evidence of paleoearthquakes along the Carboneras fault zone (SE iberian Peninsula): Los trances site. Geol. Acta. 16, 461–476. doi:10.1344/GeologicaActa2018.16.4.8
McGuire, R. K. (1976). USGS Open-File Report 76-67. FORTRAN computer program for seismic risk analysis. Available at: https://pubs.usgs.gov/of/1976/0067/report.pdf. (Accessed January 26, 1976).
Medialdea, J. J., Alonso-Henar, J., Insua-Arévalo, J. M., Canora, C., García-Mayordomo, J., Rodríguez-Escudero, E., et al. (2018). Geological evidences of surface rupture related to a seventeenth century destructive earthquake in Betic Cordillera (SE Spain): constraining the seismic hazard of the Alhama de Murcia fault. J. Iber. Geol. 45, 73. doi:10.1007/s41513-018-0082-2
Moreno, X. (2011). Neotectonic and paleoseismic onshore-offshore integrated study of the Carboneras fault (eastern Betics, SE Iberia). Dissertation thesis. Barcelona (Spain): Universitat de Barcelona.
Norma de la Construcción Sismorresistente Española (NCSE-02) (2002). Real Decreto 997/2002, de 27 de septiembre, por el que se aprueba la norma de construcción sismorresistente: parte general y edificación (NCSR-02). Boletín Oficial del Estado. 244, 35898–35967.
Ortuño, M., Masana, E., García-Meléndez, E., Martínez-Díaz, J., Stepancikova, P., Cunha, P. P., et al. (2012). An exceptionally long paleoseismic record of a slow-moving fault: the Alhama de Murcia fault (Eastern Betic shear zone, Spain). Geol. Soc. Am. Bull. 124, 1474–1494. doi:10.1130/B30558.1
Pagani, M., Monelli, D., Weatherill, G. A., and Garcia, J. (2014). Global earthquake model (GEM) technical report 2014-08. The OpenQuake-engine book: hazard. 67. doi:10.13117/-GEM.OPENQUAKE.TR2014.08
Park, J., Bazzurrro, P., and Baker, J. (2007). “Modeling spatial correlation of ground motion Intensity Measures for regional seismic hazard and portfolio loss estimation,” in Applications of Statistics and Probability in civil engineering. editors T. Kanda, and Furuta (London, UK: Taylor and Francis Group), 579.
Power, M., Chiou, B., Abrahamson, N., Bozorgnia, Y., Shantz, T., and Roblee, C. (2008). An overview of the NGA project. Earthq. Spectra. 24, 3–21. doi:10.1193/1.2894833
Quigley, M. C., Jiménez, A., Duffy, B., and King, T. R. (2019). Physical and statistical behavior of multifault earthquakes: darfield earthquake case study, New Zealand. J. Geophys. Res. Solid Earth. 124, 4788–4810. doi:10.1029/2019JB017508
Reicherter, K.,, and Hübscher, C. (2007). Evidence for a seafloor rupture of the Carboneras fault zone (southern Spain): relation to the 1522 Almería earthquake? J. Seismol. 11, 15–26. doi:10.1007/s10950-006-9024-0
Rivas-Medina, A., Benito, B., and Gaspar-Escribano, J. M. (2018). Approach for combining fault and area sources in seismic hazard assessment: application in south-eastern Spain. Nat. Hazards Earth Syst. Sci. 18, 2809–2823. doi:10.5194/nhess-18-2809-2018
Rivas-Medina, A. (2014). Contribución metodológica para incorporar fallas activas en la modelización de la fuente dirigida a estimaciones de peligrosidad sísmicaAplicación al sur de España. PhD thesis. Madrid (Spain)]: Universidad Politécnica de Madrid.
Rodríguez-Escudero, E., Martínez-Díaz, J. J., Álvarez-Gómez, J. A., Insua-Arévalo, J. M., and Capote del Villar, R. (2014). Tectonic setting of the recent damaging seismic series in the Southeastern Betic Cordillera, Spain. Bull. Earthq. Eng. 12, 1831–1854. doi:10.1007/s10518-013-9551-3
Rodríguez-Fernández, J., Miguel Azañón, J., and Azor, A. (2012). “The betic intramontane basins (SE Spain): stratigraphy, subsidence, and tectonic history,” in Tectonics of sedimentary basins: recent advances. editors C. Busby, and A. Azor (Hoboken: Blackwell Publishing Ltd.), 461–479.
Ross, Z. E., Idini, B., Jia, Z., Stephenson, O. L., Zhong, M., Wang, X., et al. (2019). Hierarchical interlocked orthogonal faulting in the 2019 Ridgecrest earthquake sequence. Science 366, 346–351. doi:10.1126/science.aaz0109
Schwartz, D. P., and Coppersmith, K. J. (1984). Fault behavior and characteristic earthquakes: examples from the Wasatch and San Andreas fault zones. J. Geophys. Res. 89, 5681–5698. doi:http://dx.doi.org/10.1029/JB089iB07p05681
Silva, P. G., Goy, J. L., Somoza, L., Zazo, C., and Bardají, T. (1993). Landscape response to strike-slip faulting linked to collisional settings: Quaternary tectonics and basin formation in the Eastern Betics, southeastern Spain. Tectonophysics 224, 289–303. doi:10.1016/0040-1951(93)90034-H
Silva, P. G., Rodríguez-Pascua, M. A., Giner-Robles, J. L., Perez-Lopez, R., Gomez Lario, J., Perucha Atienza, M., et al. (2014). Catálogo de los efectos geológicos de los terremotos en España. Available at: http://igmepublicaciones.blogspot.com.es/ (Accessed April 6, 2015).
Stich, D., Martín, J. B., and Morales, J. (2007). Deformación sísmica y asísmica en la zona Béticas-Rif-Alborán. Rev. Soc. Geol. Espana. 20, 311–320.
Stich, D., Martín, R., and Morales, J. (2010). Moment tensor inversion for Iberia-Maghreb earthquakes 2005-2008. Tectonophysics 483, 390–398. doi:10.1016/j.tecto.2009.11.006
Stich, G. P.,, and Weldon, R. J. (2006). Estimating surface rupture length and magnitude of paleoearthquakes from point measurements of rupture displacement. Bull. Seismol. Soc. Am. 96, 1612–1623. doi:10.1785/0120040172
Stirling, M., McVerry, G., Gerstenberger, M., Litchfield, N., Van Dissen, R., Berryman, K., et al. (2012). National seismic hazard model for New Zealand: 2010 update. Bull. Seismol. Soc. Am. 102, 1514–1542. doi:10.1785/0120110170
Vilanova, S. P.,, and Fonseca, J. F. B. D. (2007). Probabilistic seismic-hazard assessment for Portugal. Bull. Seismol. Soc. Am. 97, 1702–1717. doi:10.1785/0120050198
Villani, F., Pucci, S., Civico, R., De Martini, P. M., Cinti, F. R., and Pantosti, D. (2018). Surface faulting of the 30 october 2016 Mw 6.5 Central Italy earthquake: detailed analysis of a complex coseismic rupture. Tectonics 37, 3378–3410. doi:10.1029/2018TC005175
Villaseñor, B.,, and Richter, C. F. (1945). Frequency of earthquakes in California. Nature 156, 371. doi:10.1038/156371a0
Wells, D. L.,, and Coppersmith, K. J. (1994). New empirical relationships among magnitude, rupture length, rupture width, rupture area, and surface displacement. Bull. Seismol. Soc. Am. 84, 974–1002.
Wesnousky, S. G. (1986). Earthquakes, quaternary faults, and seismic hazard in California. J. Geophys. Res. 91 (12), 12587–12631. doi:10.1029/JB091iB12p12587
Woessner, J., Laurentiu, D., Laurentiu, D., Giardini, D., Crowley, H., Cotton, F., et al. (2015). The 2013 European Seismic Hazard Model: key components and results. Bull. Earthq. Eng. 13, 3553–3596. doi:10.1007/s10518-015-9795-1
Working Group on California Earthquake Probability (WGCEP) (2003). USGS Open-File Report 03-214. Earthquake probabilities in the san francisco bay Region : 2002-2031.
Youngs, R. R.,, and Coppersmith, K. J. (1985). Implications of fault slip rates and earthquake recurrence models to probabilistic seismic hazard estimates. Int. J. Rock Mech. Min. Sci. Geomech. Abstr. 23, 125. doi:10.1016/0148-9062(86)90651-0
Yu, Y.-X.,, and Gao, M.-T. (2001). Effects of the hanging wall and footwall on peak acceleration during the Jiji (Chi-Chi), Taiwan Province, earthquake. Acta Seimol. Sin. 14, 654–659. doi:10.1007/BF02718076
Keywords: seismic hazard assessment, source modelling, fault system, peak ground acceleration, near-fault, moderate magnitude earthquakes, paleoseismology, Eastern Betics Shear Zone
Citation: Gómez-Novell O, García-Mayordomo J, Ortuño M, Masana E and Chartier T (2020) Fault System-Based Probabilistic Seismic Hazard Assessment of a Moderate Seismicity Region: The Eastern Betics Shear Zone (SE Spain). Front. Earth Sci. 8:579398. doi: 10.3389/feart.2020.579398
Received: 02 July 2020; Accepted: 27 October 2020;
Published: 09 December 2020.
Edited by:
Jorge Miguel Gaspar-Escribano, Polytechnic University of Madrid, SpainReviewed by:
Chong Xu, National Institute of Natural Hazards, ChinaSergio Molina-Palacios, University of Alicante, Spain
Copyright © 2020 Gómez-Novell, García-Mayordomo, Ortuño, Masana and Chartier. This is an open-access article distributed under the terms of the Creative Commons Attribution License (CC BY). The use, distribution or reproduction in other forums is permitted, provided the original author(s) and the copyright owner(s) are credited and that the original publication in this journal is cited, in accordance with accepted academic practice. No use, distribution or reproduction is permitted which does not comply with these terms.
*Correspondence: Octavi Gómez-Novell, b2N0Z29tZXpAdWIuZWR1