 Yifan Ding
 Yuan Qi
 Lixin Wu
 Wenfei Mao
 Yingjia Liu
- 1School of Geosciences and Info-Physics, Central South University, Changsha, China
- 2Laboratory of Geo-hazards Perception, Cognition and Prediction, Central South University, Changsha, China
A Mw 7.3 earthquake occurred near the Iran-Iraq border on November 12, 2017, as the result of oblique-thrust squeezing of the Eurasian plate and the Arabian plate. By employing the spatio-temporally weighted two-step method (STW-TSM) and microwave brightness temperature (MBT) data from AMSR-2 instrument on board Aqua satellite, this paper investigates carefully the spatiotemporal features of multi-frequency MBT anomalies relating to the earthquake. Soil moisture (SM), satellite cloud image, regional geological map and surface landcover data are utilized to discriminate the potential MBT anomalies revealed from STW-TSM. The low-frequency MBT residual images shows that positive anomalies mainly occurred in the mountainous Urmia lake and the plain region, which were 300 km north and 200 km southwest about to the epicenter, respectively. The north MBT anomaly firstly appeared 51 days before the mainshock and its magnitude increased over time with a maximum of about +40K. Then the anomaly disappeared 3 days before, reappeared 1d after and diminished completely 10 days after the mainshock. Meanwhile, the southwest MBT anomaly firstly occurred 18 days before and peaked 3 days before the mainshock with a maximum of about +20K, and then diminished gradually with aftershocks. It is speculated that the positive MBT anomaly in the Urmia lake was caused by microwave dielectric property change of water body due to gas bubbles leaking from the bottom of the lake disturbed by local crust stress alteration, while the southwest MBT positive anomaly was caused by microwave dielectric constant change of shallow surface due to accumulation of seismically-activated positive charges originated at deep crust. Besides, some accidental abnormal residual stripes existed in line with satellite orbit, which turned out to be periodic data errors of the satellite sensor. High-frequency MBT residual images exhibit some significant negative anomalies, including a narrow stripe pointing to the forthcoming epicenter, which were confirmed to be caused by synchronous altostratus clouds. This study is of guidance meaning for distinguishing non-seismic disturbances and identifying seismic MBT anomaly before, during and after some large earthquakes.
Introduction
Microwave radiative signals are capable of penetrating thick fog and clouds, and do not rely on the Sun as the source for illumination. These particular attributes allow microwave radiation monitoring of the Earth’s surface become valid under almost all-weather conditions (Ulaby and Long, 2015). Since 2008, satellite microwave brightness temperature (MBT) has been preliminarily adopted for thermal anomaly monitoring of volcanic and earthquake activities (Maeda and Takano, 2008; Takano and Maeda, 2009). Afterwards, Maeda and Takano (2009, 2010) used MBT data at 18.7 GHz from AMSR-E instrument to detect microwave radiation anomaly associated with 2008 Wenchuan earthquake and 2004 Morocco earthquake, and found obvious abnormal microwave signals distributing along the seismogenious faults or near the epicenter region. Subsequently, Chen and Jin (2010) proposed a radiation anomaly index to analyze microwave radiation anomaly of 2010 Yushu earthquake, and revealed a MBT anomaly area behaving great spatial correlation with the main faults 2 days before the mainshock; Jing et al. (2020) detected the anomalous MBT associated with three strong earthquakes occurred in Sichuan province, China, and also found that the MBT anomalies distributed around the forthcoming epicenter or along the main faults. Recently, Qi et al. (2020a) proposed the spatio-temporally weighted two-step method (STW-TSM) and validated its effectiveness by revealing and analyzing the spatiotemporal evolution of MBT anomalies of 2008 Wenchuan earthquake sequence (Qi et al., 2020a, b) and 2015 Nepal earthquake sequence (Qi et al., 2020c). Although current studies are based on different methods and various microwave satellite data, they have uncovered valuable seismic-related thermal anomalies before, during and after the earthquakes. This indicates that it is a feasible and promising way to use satellite MBT data to reveal particular phenomena and to explore geophysical mechanism of seismic thermal anomaly.
The Mw 7.3 Sarpol Zahab earthquake, occurred on November 12, 2017, was caused by the oblique-thrust faulting beneath the Iran-Iraq border (Yang et al., 2018). The epicenter located at the small town named Sarpol Zahab, with a depth of about 17.9 km, south of the Zagros Mountains that is seismically active (Berberian and King, 1981). So far, there are some relevant studies reported about the possible anomaly before this significant earthquake. Tariq et al. (2019) analyzed the time series of total electron content (TEC) in Iran-Iraq area, and found that there were anomalies several days before the earthquake, among which the anomalies 5days before the earthquake were caused by magnetic storms, and the ionospheric anomalies 8–11 days before the earthquake were thought to be related to the earthquake. Akhoondzadeh et al. (2019) studied the TEC and four atmospheric parameters (skin temperature, vertical column water vapor, aerosol optical thickness and sulfur dioxide) near the epicenter. They found that TEC 11 days before the earthquake enhanced obviously, while most atmospheric parameters presented abnormal in different times before the ionospheric anomaly. The sulfur dioxide anomaly, total aerosol thickness (AOT) anomaly, and skin temperature (SKT) anomaly occurred 9–19 days, 9–17 days and 14–15 days before the earthquake, respectively. These parameters all appeared before the ionospheric anomaly, which exhibited the potential effect of lithosphere-atmosphere-ionosphere (LAI) coupling (Pulinets and Ouzounov, 2011). Zhou, (2019) combined multi-parameter of land surface, near-surface, upper atmosphere and ionosphere to analyze abnormal precursor information in each geosphere before the earthquake, and further analyzed and confirmed the coupling effects between different geospheres.
However, the above researches mainly focus on atmospheric and ionospheric parameters, the coversphere (including water bodies, snow and ice, soil and sand layers, deserts, and vegetation) as well as the surface thermal radiative parameter is overlooked. The Iran-Iraq area is featured with simple land cover such as flat terrain, lifted mountain and sparse vegetation, and with stable climate (Saraf et al., 2008). It is regarded that the coversphere modifies the geo-electromagnetic signals from the deep crust and underground to the Earth’s surface (Wu et al., 2012, 2016). The physical properties of the Earth’s surface are critical to the microwave radiative capacity and satellite thermal observation. Therefore, monitoring seismic thermal anomaly using satellite MBT data will be less disturbed in the Iran-Iraq border area, which is worthy of detailed exploratory research.
This research aims to uncover the spatiotemporal evolution of MBT anomalies relating to the Sarpol Zahab earthquake by employing STW-TSM. Based on regional crust stress variations, existing theories and experiments, the uncovered MBT anomalies in the northern Urmia lakes and in the southwestern study area before and after the Sarpol Zahab earthquake are interpreted. By using soil moisture (SM) and satellite cloud images, as well as contrast analysis of low-high frequency MBT residual images, occasional positive abnormal stripes and characteristic negative anomalies are ruled out of possible seismic anomalies, which is of instructive significance for discriminating seismic MBT anomalies using multiple source auxiliary data.
Study Area
The Iran-Iraq region is located at the junction of the Eurasian plate and the Arabian plate, and has a tropical desert climate with large areas of deserts and plateaus (Salahi and Asareh, 2008). As shown in Figure 1, the Caspian Sea is located to the northeast of the study area, while the Zagros mountains are in the middle, with undulating terrain; and the Mesopotamia plain is in the southwest, with quite flat terrain. The Arabian plate subducted under the Eurasian plate at a speed of about 30 mm per year, which caused the Eurasian plate to constantly rise and form Zagros mountains (Reilinger et al., 2006), and also made the Iran-Iraq region one of the most frequent seismic regions in the world. The Sarpol Zahab earthquake occurred at 18:18:25 (UTC) on November 12, 2017, near the border between Iran and Iraq (

FIGURE 1. The terrain of Zagros mountains and eastern Mesopotamia plain.
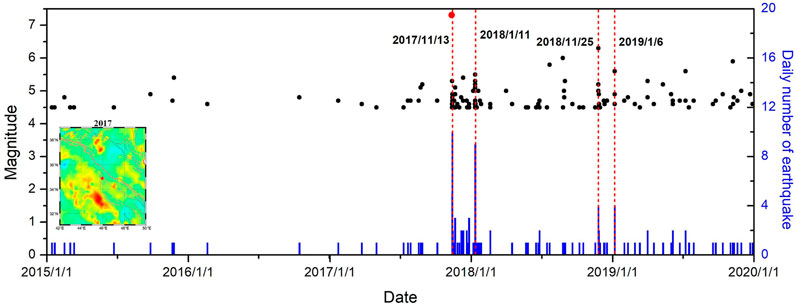
FIGURE 2. Time series of seismicity (Mw
Materials and Method
The Advanced Microwave Scanning Radiometer-2 (AMSR-2), a successor of AMSR on the Advanced Earth Observing Satellite-II and AMSR for EOS (AMSR-E) on NASA’s Aqua satellite, is a single mission instrument on GCOM-W1 (Imaoka et al., 2012). The AMSR-2 is a five-frequency microwave radiometer system with dual polarization capability (Vertical and Horizontal, i.e., H & V in brief) for all frequency bands. The observations from AMSR-2 occur between approximately 1:30 a.m. and 2:30 a.m. (descending mode), 1:30 p.m. and 2:30 p.m. (ascending mode) local time. Basic characteristics of AMSR-2 instrument are shown in Table 1.
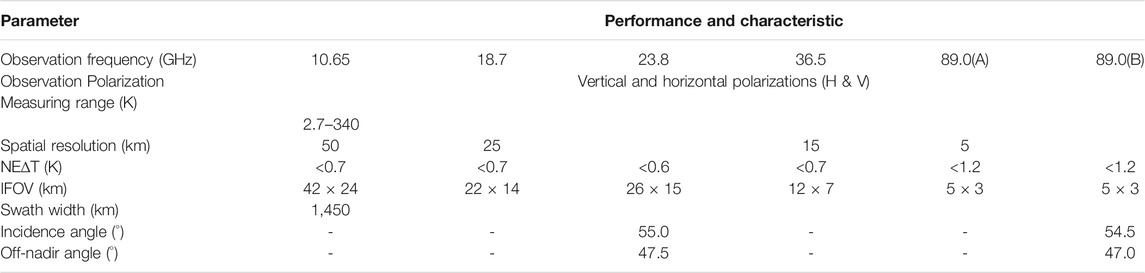
TABLE 1. Major performances and characteristics of AMSR-2.
Low-frequency microwave signal has a certain penetration to the arid and desert areas, while high-frequency microwave signal has a certain sensitivity to the possible cloud and rain in the study area. The MBT data of 89 GHz has two channels with different incident angles, in which the incident angle of channel A is consistent with that of the low frequency. So that MBT of 89 GHz with channel-A is adopted to ensure the consistency of the incidence angle of the lower bands. In addition, soil moisture (SM) data retrieved from 10.65 GHz MBT data, satellite cloud images at nighttime derived from Meteosat-8, SRTM-DEM dataset with 30 m resolution, geological map provided by the Geological Survey of Canada (GSC), and land cover data with 30 m spatial resolution provided by the National Geomatics Center of China (NGCC) are also used in this research, in order to conduct the discriminating analysis using multi-source auxiliary data.
The diameter of preparation zone of Mw 7.3 earthquake calculated from Dobrovolsky’s equation (Dobrovolsky et al., 1979) is about 2750 km, which is much large than the swath width of AMSR-2 data (1450 km). It is impossible to cover the entire preparation zone for a single swath of the observation. Therefore, the study area is selected as
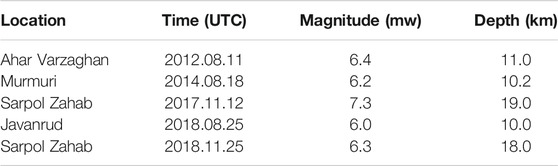
TABLE 2. Historical earthquakes (Mw ≥ 6.0) from 2012 to 2019 in the study area (from USGS).
STW-TSM is employed in this research for seismic anomaly detection. The principle of the STW-TSM is to obtain the basic residuals of the Earth surface MBT by removing the inherent general and stable trend with a temporally weighted background in the first step as in following equation:
where
Then, to retain the cleaned MBT residuals by eliminating the internal short-term variable effects in the study area with a spatially weighted background in the second step as in the following equation:
where
Results
Spatiotemporal Features of Low-High Frequency MBT Residuals
Figure 3 shows the spatiotemporal evolution of cleaned MBT residuals with 10.65 and 89 GHz at H polarization. As for the low-frequency (10.65 GHz) results, positive MBT anomaly mainly concentrated in the northern mountainous Urmia Lake and southwestern plain area (bare land and cultivated land) near the epicenter. Besides, there also existed several fortuitous strip-shaped abnormal MBT residuals, which were in line with the direction of satellite orbit (i.e., on September 21, October 7, November 8, and November 22).
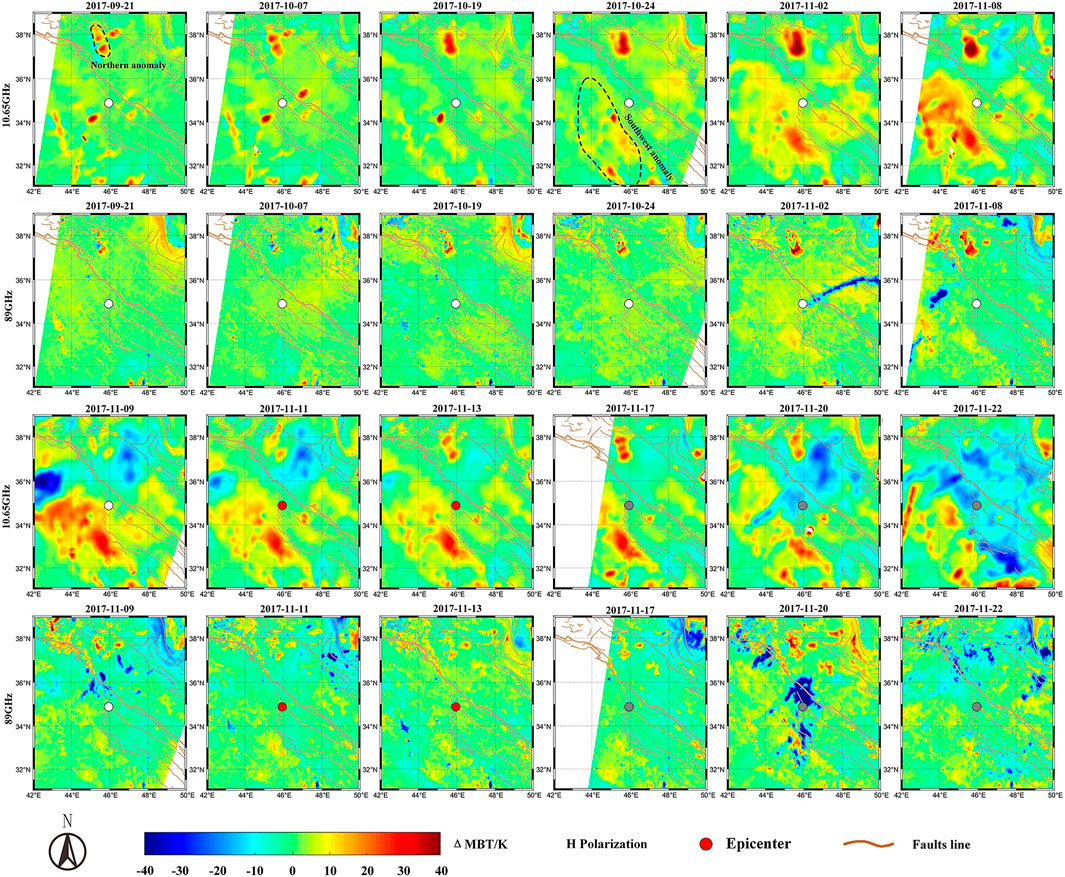
FIGURE 3. Spatiotemporal evolution of the MBT residuals with 10.65 and 89 GHz at H polarization. The circle dots mark the epicenters of the shock, with white, red, and gray color for the days before earthquake, during earthquake, and after earthquake, respectively.
The positive MBT anomaly in the northern mountainous Urmia Lake firstly appeared 51 days before the Mw 7.3 earthquake (September 21, 2017), and the amplitude and range of the anomaly increased with the approaching of the earthquake with a maximum of about 40K. From 3 days before (November 9) the earthquake, the positive anomaly of the lake region significantly reduced until it disappeared 1 day before the earthquake (November 11). Then the anomaly reoccurred 1d after the earthquake (November 13) but maintained relative low level compared with that before the earthquake until 5 days after the earthquake (November 17). Subsequently, the anomaly began to fade gradually and disappeared completely 10 days after the earthquake (November 22). The evolution pattern of MBT anomaly in the Urmia Lake behaved as: occurring and continuously strengthening before the earthquake, reaching to the peak and then immediately disappearing during the short-impending of the earthquake, reoccurring and gradually dissipating after the earthquake.
The positive MBT anomaly in the southwest plain area firstly appeared 18 days before the earthquake (October 24, 2017), and also strengthened over time. The amplitude and range of the south anomaly achieved the peak 3 days before the earthquake (November 9) with a maximum of about 20K, and then started to decay on November 11. Slight positive anomaly persisted in this area until early February of the next year (see Supplementary Figure S1). The evolution pattern of the southwest MBT anomaly behaved as: occurring before the earthquake, strengthening continuously and reaching the peak during the short-impending of the earthquake, decaying gradually shortly before and after the earthquake.
As for the high-frequency (89 GHz) results, positive MBT anomaly in the northern mountainous Urmia lake behaved the same spatiotemporal pattern as that of low-frequency results, but the amplitude and range of the anomaly were relatively weak and small. However, the high-frequency MBT data failed to reveal positive regional anomaly in the southwest plain area. Meanwhile, there existed an obvious strip-shaped negative anomaly pointing at the forthcoming epicenter from east to west on November 2, and a regional negative anomaly almost overlapping with the epicenter on November 20. The negative anomalies are very characteristic and deserves further attention.
As described above, there are four types of MBT anomalies in the revealed residual images, including positive anomaly in the Urmia lake at both low-frequency and high-frequency bands, regional positive anomaly in the southwest plain area at low-frequency band, occasional abnormal positive stripes at low-frequency band, and significant negative abnormal residuals at high-frequency band.
Meteorological Disturbance and Negative Anomaly Discrimination
The MBT data of 89 GHz has better performance to reflect the influence from atmospheric clouds and heavy rains, for microwave signals at this band have shorter wavelength and better susceptibility to atmosphere (Eastman et al., 2019). Therefore, the possible causes of the negative MBT anomalies are analyzed, using multi-source remote sensing data involving original MBT observations, SM data and infrared satellite cloud images (nighttime). The comparative results are presented as in Figure 4.
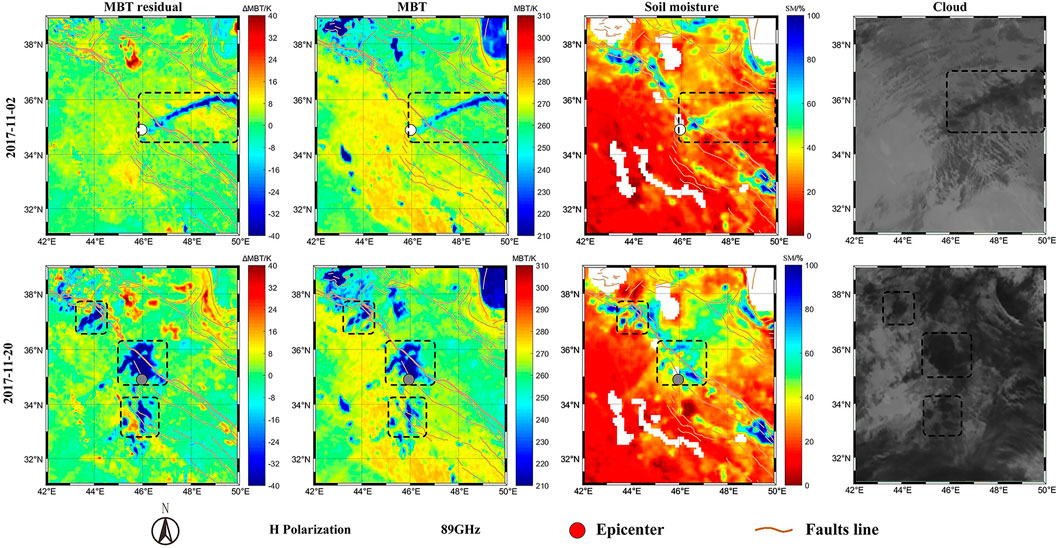
FIGURE 4. Negative MBT residual images, MBT original observations, soil moisture, and satellite cloud images on November 2 and November 20, 2017.
As one can see, in the first row of Figure 4, an evident negative MBT residual stripe pointed at the epicenter from east to west on November 2, 2017, which also could be reflected as a negative stripe in the MBT image and as a high value stripe in the SM image. Checking the synchronous infrared satellite cloud images, it is easy to find a linear cloud in the area where the negative MBT anomaly was located. Besides, from the second row of Figure 4, the featured negative phenomena are visible in the black dotted box on November 20, 2017, which were consistent in space with low values in MBT image, high values in SM image, and thick clouds in the infrared cloud images. Obviously, we can draw a preliminary conclusion that the negative anomalies in high-frequency residual images were related with the synchronous clouds. However, the cloud images in Figure 4 also indicate that only part of the clouds corresponded well with the negative anomalies, and what attributes of clouds were responsible for the negative residual values needs further analysis.
Figure 5 shows the cloud amount at three different altitude in the study area on November 2 and November 20, 2017. It can be found that the cloud on November 2 was mostly concentrated in the middle layer, but the cloud corresponding to the negative MBT residuals mainly existed in the high layers. On November 20, most of the clouds were concentrated in the middle and high layers, but the cloud corresponding to the negative MBT residuals mainly existed in the high layers. It is known that altostratus clouds are mainly composed of small ice crystals (Zhao et al., 2002), and the influence of solid particles such as snow, ice and haze are suggested reduce the microwave radiation of cloud comparing with cloudless conditions (Gu et al., 2016). Therefore, cloud at high altitude (altostratus cloud) are considered to cause the negative MBT anomalies at high frequency in this study.
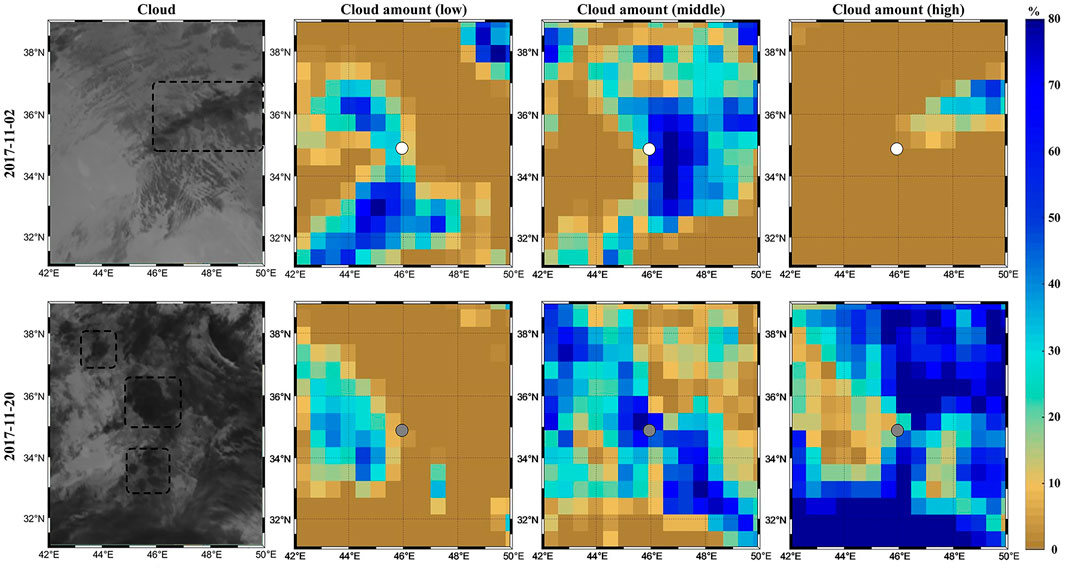
FIGURE 5. Cloud amount at different altitudes.
Attribution Analysis
Periodical Positive MBT Residual Stripes
As mentioned above, there existed some positive stripes in the MBT residual images, which are marked with black dotted boxes in Figure 6. The stripes are in the same direction with the satellite orbit and have strict periodicity in recurrence time. According to their geolocations, the stripes can be divided into four categories, naming A, B, C, and D (see Figure 6). As one can see, stripe A and D both occurred on October 30 and November 15, 2017, stripe B occurred on November 6 and November 22, 2017, while stripe C occurred on November 8 and November 24, 2017. The time intervals of the reoccurrence of the respective stripes are all 16 days, which is exactly consistent with the revisit cycle of the AMSR-2 instrument. The MBT images in Figure 6 show that four types of stripes actually come from the original satellite observations, which are not in harmony with normal observations.
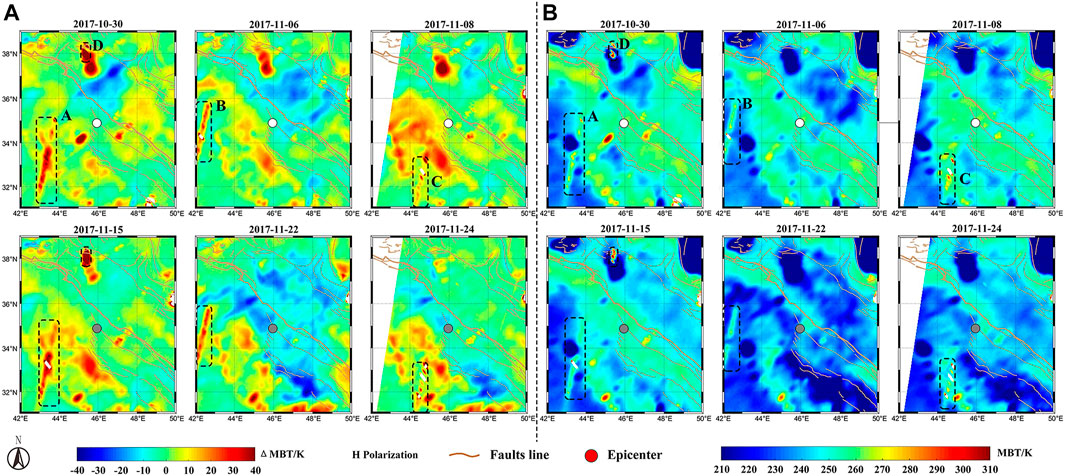
FIGURE 6. Periodic positive abnormal stripes in residual MBT images (A) and original MBT images (B) with 10.65 GHz at H polarization.
Simplify taking stripe A and D as an example, the positive MBT residuals with five different bands (10.65, 18.7, 23.8, 36.5 and 89 GHz) are compared in Figure 7. It could be found that the abnormal stripes existed only in the results of 10.65 GHz. Figure 8 exhibits the stripes A and D with 10.65 GHz at H and V polarization, and the abnormal stripes existed only in the results at H polarization. Furthermore, we extended the time range from months before the earthquake to months after the earthquake, to examine the periodicity and persistence of the four abnormal stripes, and the results proved the phenomena stated.
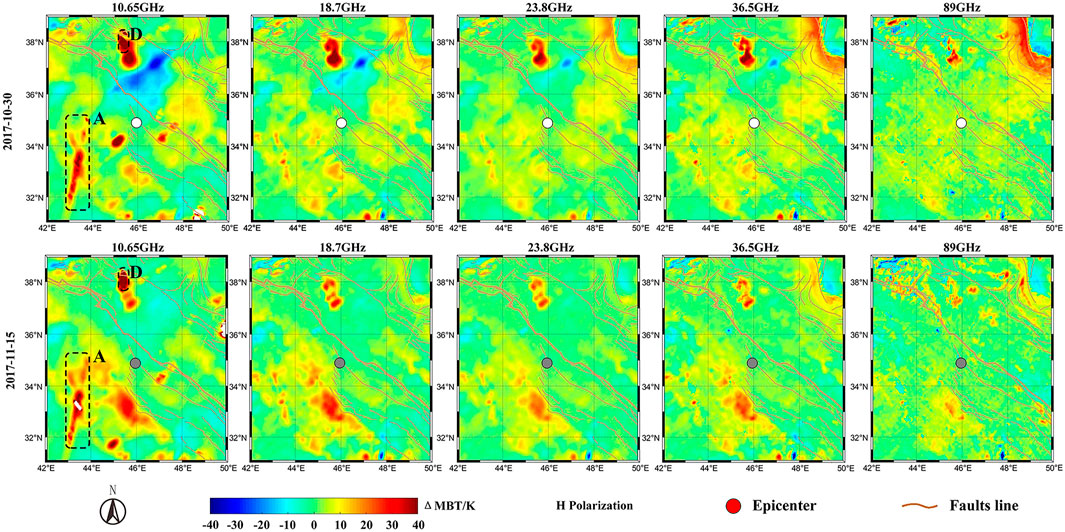
FIGURE 7. Residual MBT images of different frequency (10.65, 18.7, 23.8, 36.5, and 89 GHz) at H polarization.
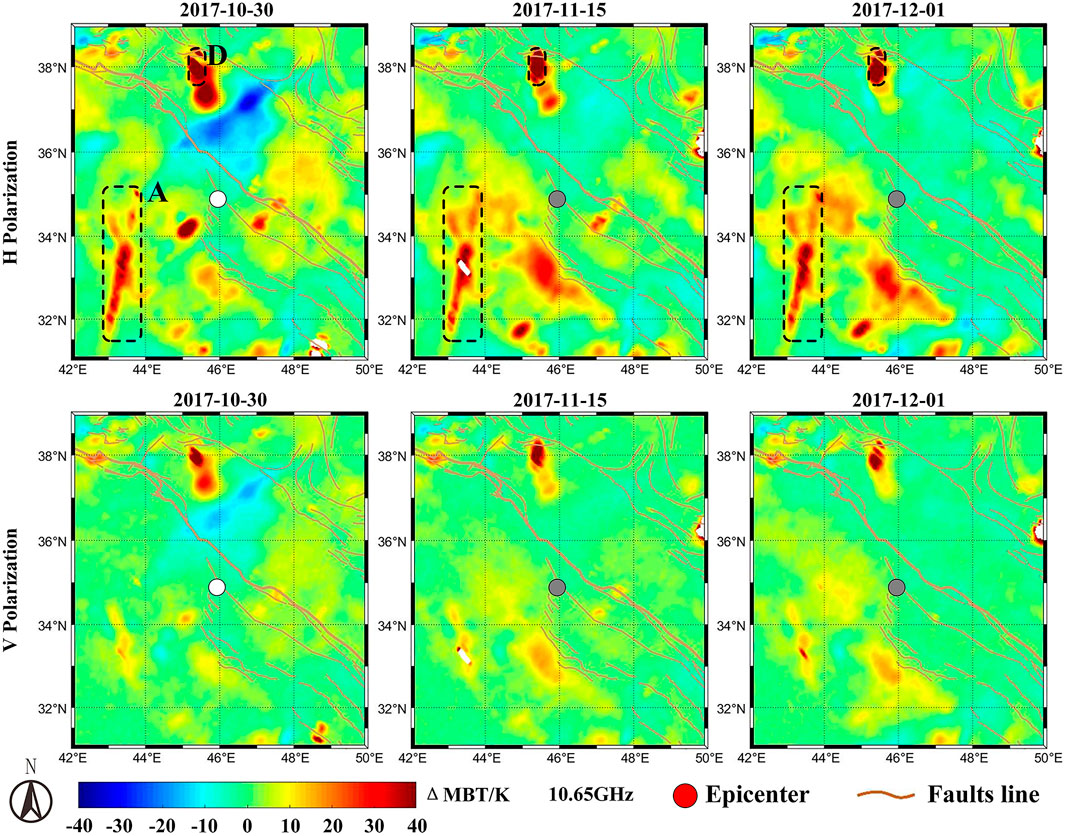
FIGURE 8. Residual MBT images with 10.65 GHz at H and V polarization.
From above comparative analysis, it is known that the abnormal stripes existed only in MBT residual maps with 10.65 GHz at H polarization, and the interval time of reoccurrence were all 16 days. It can be deduced that the abnormal stripes may be data errors caused by sensor failures, which has nothing to do with seismic activity.
Positive MBT Residuals in the Mountainous Urmia Lake
Referring to microwave remote sensing physics, MBT can be expressed as the product of microwave emissivity and physical temperature (Ulaby et al., 1981). As one can note from above results that the original MBT observations in the Urmia lake are at low level, which is because the physical temperature and emissivity of the water body all are low. Contrastively, in the revealed MBT residual images, the residual values in the lake area are much higher than that of surrounding land area. It was regarded that rock mass friction and collisions between the fault planes might cause the physical temperatures of ground surface to rise during the preparation phase of an earthquake (Wu et al., 2006). Nevertheless, such temperature changes in the deep crust are difficult to affect the remote coversphere, especially the water body, and physical temperature changes of up to tens of K are theoretically impossible. Therefore, alterations in emissivity of lake area are essential except for the potential minor contribution of physical temperature rise.
Microwave signals of low frequency have certain penetrability to the object surface, and can reflect the radiation characteristics of water body to a certain depth. Microwave satellite observations are proved very sensitive to the physical properties of the water bodies through the effects on the microwave dielectric constant and the emissivity (Ulaby and Long, 2015). According to Ziolkowski, (1998), the change in stress before an earthquake would cause the gas to swell and contract under the action of still water, resulting in bubbles and then floating from the bottom to the surface under the action of gravity. The bubbles inside the water body or on the water surface would be able to change the dielectric property of lake water, thus affecting its scattering and radiation characteristics. The Urmia lake, north to the epicenter of the Sarpol Zahab earthquake, is the largest lake in Iran and the third largest saltwater lake in the world. According to Ma et al. (1999), the Urmia lake contained a large number of Na and Br ions, and the salinity of the lake was increasing continuously due to numerous water conservancy projects and continuous climate drought. Moreover, it was found by Camps et al. (2005) that with the same aeration rate, the thickness of foam layer on the sea surface raised with the increase of salinity. Williams (1971) experimentally measured the microwave emissivity of the artificial foam layer on different substrates at 9.4 GHz frequency using waveguide technology, and found that the foam covering the water surface had a high microwave emissivity, and the emissivity was positively correlated with the thickness of the foam layer. Therefore, both bubbles inside shallow water and possible foams above water surface of Urmia lake were able to reduce the dielectric constant of lake water, thus lifted the microwave emissivity and led to the rise of MBT.
Taghipour et al. (2018) found that the Eastern Lake Fault on the east side of the Urmia Lake and the Eastern Salmas Fault on the west side of the Urmia Lake had the same strike and were both dextral strike-slip, and a linear geomorphic feature across the lake ascertained by satellite images divided the lake into north and south parts with different depths. This investigation shows that there is a possible geomorphic linkage between the faults. From Figure 9, it is known that the long-term trend of plate movement within the study area is approximately from south to north along the Mountain Front Flexure (MFF) (Vernant et al., 2004). According to the coseismic deformation field from D-InSAR and MAI measurements (Wang et al., 2019), the area north to the epicenter was squeezed from NE to SW. This suggested that the movement direction of the area around the Urmia Lake and the area north near to the epicenter may be inconsistent.
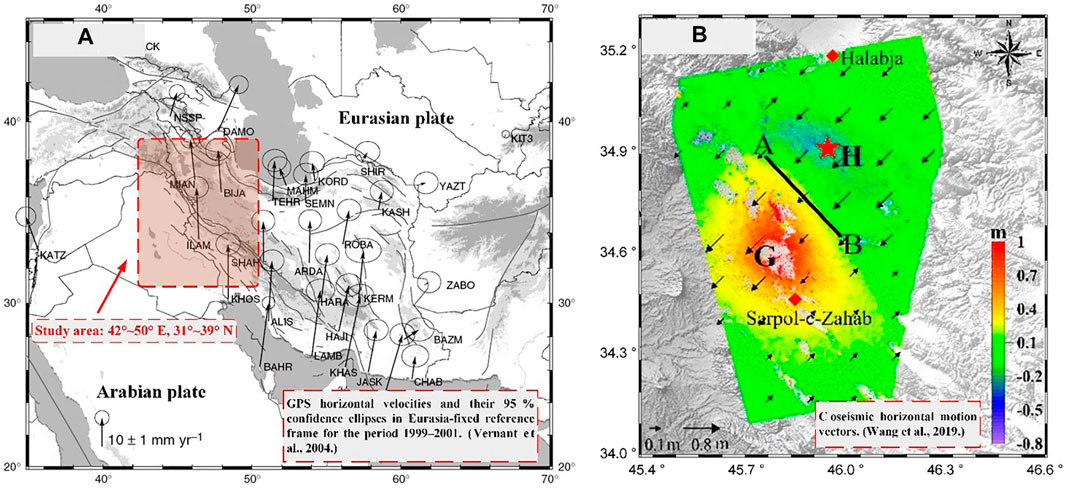
FIGURE 9. Historical horizontal displacement (A) and coseismic horizontal motion vectors (B) in the study area adapted from Vernant et al. (2004) and Wang et al. (2019).
FLAC-3D software was used to make a numerical simulation of the seismogenious process during this earthquake. The results are shown in Figure 10, in which the fault structure was adapted from Vergés et al. (2011). The distribution of tectonic stress on the Main Recent Fault (MRF), which passes western through the Urmia lake, were presented by the simulation. It is found that during the northeast squeezing process of the Arabian cover and Arabian basement toward the MFF, the stress state in MRF region were divided into six stages. In the first stage, the MRF region appeared as a tensile zone. In the second stage, the area of tensile zone in MRF region decreased. In the third stage, the area of tensile zone in MRF region further reduced. In the fourth stage, the tensile zone in MRF region disappeared, and the whole study area was in a state of compression. In the fifth stage, a small tensile zone appeared on the northeast side of the MRF region, and in the sixth stage, the MRF region reappeared as a tensile zone. It is also shown that a non-squeezing zone appeared, disappeared and reappeared on the ground or coversphere along the MRF.
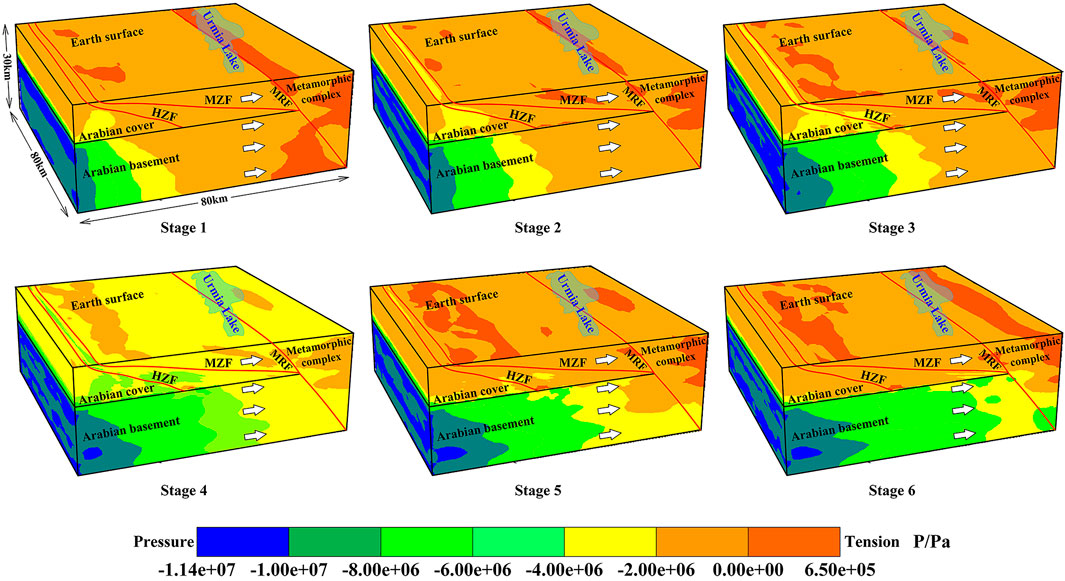
FIGURE 10. Simulated dynamic stress state of local plate movement. The elastic model was applied to define the constitutive models of Arabian basement and metamorphic complex, and the Mohr-Coulomb model was applied to the Arabian cover. The interfaces were generated with respect to the main faults presented with red lines. In addition to the pre-set gravity, compressive stress of 10 MPa was initially applied at the depth from 0 to 10 km, while the initially applied compressive stress was 1 MPa at depth from 10 to 30 km on the left boundary surface.
The simulation indicated that the mountainous Urmia Lake area, through which the MRF-ELF-ESF passes (as in Figure 10), was in a stretched state several days before the shocking (Stage 1–3). So that the underground passages or channels could be opened owing to tensile stress at the bottom of the Urmia lake, through which underground gas (such as CH4, CO2) could be released to produce bubbles and possible foams, which in consequence led to positive MBT anomaly in the lake area (from 51 days before the earthquake to 3 days before the earthquake). However, during the impending period (2 days before) of the earthquake (Stage 4), crust stress was blocked in the hypocenter area, and the continuous movement of the Eurasian plate from NE to SW caused the plates at the bottom of the lake to be squeezed. Therefore, the underground passages through which the gas raised from lake bottom got closed, and consequently the positive MBT anomaly disappeared shortly before the earthquake. With the occurrence of the earthquake, the stress around the Zagros Mountains was partially adjusted, and the underground stress state of the ELF-ESF at the lake region might return to that of the earthquake impending (Stage 5–6). Therefore, the lake region was abnormal again (1d after the earthquake). With the departure of the shocking day, the lake region returned to its usual state, i.e., MRF was compressed and the gas passages are closed. Therefore, it is presented that the positive MBT anomaly in Urmia lake area were mainly produced by the uniformly distributed and altering crust stress field in the seismogenic area, which created good conditions for underground gas to escape from the lake floor and ELF-ESF, and then reduced the dielectric properties of the Urmia lake water, which led to an increment of MBT of Urmia lake.
Southwest Positive MBT Residuals Near the Epicenter
From Figure 3, it is known that positive MBT residuals existed also in the expansive plain southwest to the epicenter. The evolution of the abnormal positive residuals here fluctuates in range and amplitude, but the position remains unchanged over time. The most prominent area of the positive MBT residuals distributed along the southwest front of the Zagros mountains. By comparing the land cover and geological map of the study area with the MBT residual images, it is clear that the positive MBT anomaly area, bare land and cultivated land, and the Quaternary are in good spatial correspondence (see Figure 11). According to Freund’s laboratory experiments, stress-activated charge carriers, known as P-hole, are able to appear in deep rock mass under compressively loading (Freund, 2000, 2011). The activated P-holes are mobile and capable of flowing down stress gradients and finally accumulating on the surface of distant unstressed rock, thus leading to additional electric field in the rock subsurface (King and Freund, 1984), even on the surface of a sand layer or a soil layer above the rock (Freund, 2010). The accumulation of P-holes will result in a positive surface e-potential and reduce the regional dielectric constant of the superficial rock mass. Thus, the microwave emissivity and the microwave radiation of rock surface would be enhanced. In addition, experimental studies have confirmed that the microwave dielectric constant of the rock surface reduced significantly during compressively loading (Mao, 2019), and the microwave radiation of sand layers overburdened the compressed rock specimen increased during rock loading process (Mao et al., 2020).
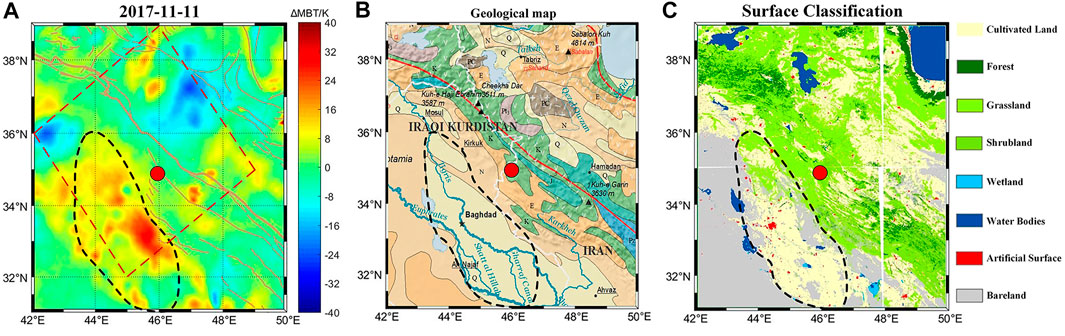
FIGURE 11. Southwestern positive MBT anomaly, Geological map, and land cover.
The peroxy defects are widespread in the mineral grains of the igneous and metamorphic rocks, which are susceptive to compressive stress. The Arabian basement is comprised of gneissose granites, schists, limestones, migmatites and mudstone (Bahroudi and Talbot, 2003), among which gneissose granites, schists, and migmatites are also peroxy rich. During the last preparation phase of Sarpol Zahab earthquake, the compression of plates caused the stress concentration of rock mass at the forthcoming hypocenter, a large number of micro-fractures were presented to had occurred at this period. The vast peroxy bonds embedded in the crust rock mass were broken, thus positive charges were activated in the stress concentration zone, showing a trend of propagating along crust stress gradient. Quaternary strata are usually characteristic by loose lithology, and mainly consist of gravel, sand, soil, and clay (Cao, 1995). The lithology of Arabian basement consists of fragments of intermediate-to-high grade metamorphic rocks, which played a good medium for P-hole producing and propagating from the deep crust (T4, see Figure 12) to the Quaternary strata. Therefore, the local geological conditions allowed perfectly for the transfer of P-holes from MFF and Arabian cover to the northwest bare land and cultivated land, which resulting in the positive MBT anomaly here. The schematic diagram of this chain process is shown in Figure 12, of which the geographical range is marked in the red dotted box of the first subgraph in Figure 11. This effect induced by seismically activated P-holes reached its peak 2 days before the earthquake, and persisted with the stress adjustment and the occurrence of aftershocks.
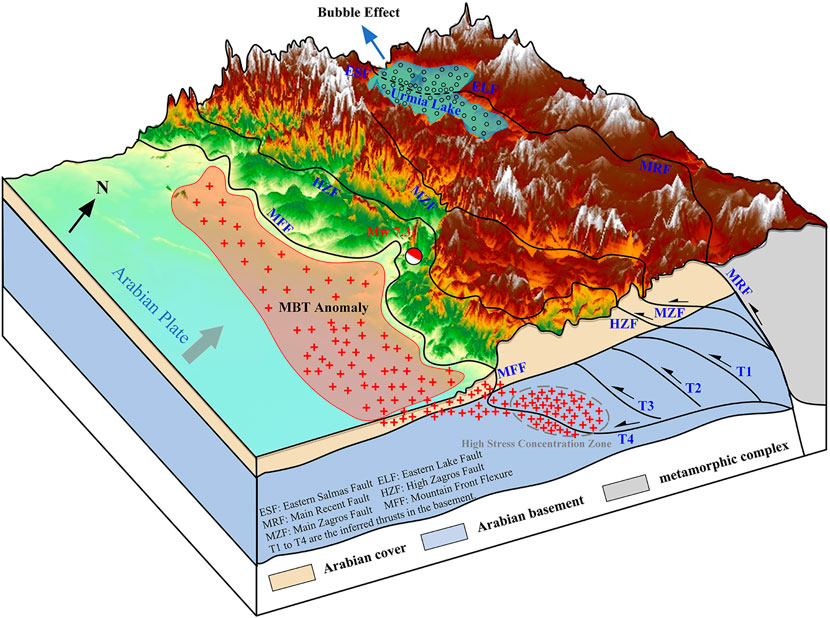
FIGURE 12. Geologic section across the Zagros Mountains (interpreted from Vergés et al., 2011 and Yang et al., 2018) and conceptual diagram of P-hole transferring as well as bubble swelling.
The southwest anomaly lasted until the early February of the following year, with a relatively lower level than that before the Sarpol Zahab earthquake. During this period, more than 40 middle-large aftershocks (Mw
Conclusion and Discussion
In this research, the spatiotemporal evolution of multi-frequency MBT anomalies associated with the 2017 Mw7.3 Sarpol Zahab earthquake is carefully investigated and analyzed. The uncovered MBT anomalies are divided into four featured categories, including the negative anomalies existing in the high-frequency result, the occasional positive abnormal stripes in line with satellite orbit, the significant positive anomaly in northern mountainous Urmia lake, and the extensive positive anomaly in Quaternary plain southwest to the epicenter.
Through comparative analysis of synchronous cloud image and SM data, the negative MBT anomalies of high-frequency were uncovered being attributed to the influence of high-altitude clouds, and were firstly excluded from being related to the impeding earthquake. We reach that not all atmospheric clouds are responsible for the negative MBT anomaly, only the altostratus (high clouds) can be reflected in the satellite MBT observations, which should be firstly excluded from the precursor study.
There existed also some abnormal stripes in the low-frequency MBT residuals. The geolocations of the stripes remain the same, and the reoccurrence time interval keep consistent with the revisit time of AMSR-2 instrument. We discovered that the abnormal stripes appeared in the results only with 10.65 GHz at H polarization. In addition, part of the Urmia lake behaved MBT over 300 K when the stripes existed with 16days reoccurrence, which is not in accordance with the natural phenomenon. It is daring but reasonable to attribute the abnormal stripes to data errors of the satellite instrument. Such periodically recurrent abnormal phenomenon requires careful identification in the study of seismic MBT anomaly.
The positive MBT anomaly in the northern mountainous Urmia lake existed both in the results of high-frequency and low-frequency, and behaved the same pattern in space and time. The positive MBT anomaly appeared 51 days before the earthquake and enhanced over time, but disappeared suddenly during the short-impending of the earthquake. Then the anomaly reoccurred 1 d after the earthquake and diminished gradually. Referring to the existing theory and microwave remote sensing physics, the amplitude of the positive MBT anomaly, with a maximum of 40K about, in the lake area might be caused by seismic-disturbed bubbles swelling from the lake bottom and ELF-EFF fault to water surface. Thus, the dielectric constant of lake surface water got reducing and the microwave radiative capacity got enhanced, which led to the positive MBT anomaly of the lake area.
The large-scale positive anomaly in the southwest plain appeared 18 days before the Sarpol Zahab earthquake, and the range and amplitude got larger with the approaching of the earthquake. The southwest MBT anomaly weakened also just 1 d before the impending earthquake, and continued to weaken until all aftershocks disappeared in the early February of 2018. Referring to the P-hole theory, seismogenic mechanism and microwave remote sensing physics, the southwest MBT positive anomaly, with a maximal amplitude of 20K about, was considered to be caused by seismic-activated positive charges transferring down the stress gradient from the deep crust to the Quaternary strata, which reduced the dielectric constant and lifted the microwave radiation there. Bare land and sand layers might have amplified the microwave signals from the crust to the atmosphere, thus to increase the significance of potential seismic MBT anomaly.
It is also essential to note that, from Figure 2, the seismicity in the study area was less frequent from 2015 to May 2017, but more frequent from July 2017 to 2019. The MBT data of 2015 and 2016 are selected for confutation analysis, and reach that no obvious positive MBT anomaly occurred in 2015. However, in 2016, positive MBT anomaly appeared also in the southwest plain area on October 25 and disappeared on December 24 (see Supplementary Figure S2). It can be seen from Supplementary Figure S2 that the number of earthquakes in the study area in 2016 was much greater than that in 2015, and the epicenter was mostly located near the positive anomaly. By analyzing the distribution of earthquakes in this period, we believe that there was a certain spatial correlation between the location of positive anomalies and the coming epicenters in seismogenic process.
The epicenter of the Sarpol Zahab earthquake located at the boundary of two subzones with relatively uneven stress distribution, and MRF is the most active seismotectonic structure in the Zagros region (Khanban et al., 2021). The dynamic alteration of local stress in lithosphere might have been much more activated prior to the Sarpol Zahab earthquake, which led to the preseismic deformation (Vaka et al., 2019) and micro cracks of deep-to-shallow rock mass. The carbonaceous gas (such as CH4 and CO2) enclosed in the lithosphere might escape through the produced-and-opened micro cracks, which might cause MBT variations in Urmia lake since 51 days before the earthquake, and the accumulation of stress-activated P-holes on ground surface led to the MBT variations in plain area 18 days before, and then skin temperature got rise 15 days before the earthquake (Akhoondzadeh et al., 2019). Meanwhile, these up-swelling carbonaceous gases would had changed the composition of the atmosphere near ground surface accompanied by greenhouse effect, air-water condensation and aerosol generation, thus AOT and the water vapor behaved anomaly from 17 to 9 days and 6 to 4 days preceding the earthquake, respectively (Akhoondzadeh et al., 2019). The air ionization from possible radon gas emission was also supposed, and it could had ultimately disturbed the TEC in the ionosphere from 11 to 8 days preceding the earthquake (Akhoondzadeh et al., 2019; Tariq et al., 2019; Senturk et al., 2020). Supplementary Figure S3 shows the temporal distribution of seismic precursor anomalies. As one can see from the figure, the occurrence time of precursor anomalies in each sphere generally presents a “slope” structure. In other words, anomalies in the coversphere appeared first, followed by those in the atmosphere, and those in the ionosphere appeared last. All the abnormal phenomena occurred in the multiple geospheres might reflect some coupling effect in the final phase of Sarpol Zahab seismogenic process. Through the analysis of the anomalies related with this earthquake, we found that the time of the anomaly occurred in each sphere was reasonable, which further proved the rationality of MBT anomaly in coversphere.
Data Availability Statement
Publicly available datasets were analyzed in this study. This data can be found here: The datasets generated for this study are available on request from the first corresponding author, and from the National Aeronautics and Space Administration (NASA) for SRTM DEM data (https://earthexplorer.usgs.gov), the Japan Aerospace Exploration Agency (JAXA) for MBT data and soil moisture data (https://www.jaxa.jp), and European Meteorological Satellite website for cloud images (https://www.eumetsat.int).
Author Contributions
YD: scientific analysis, data collection and manuscript writing. YQ and LW: scientific analysis, article organization and revising. LW: initiative thought and research supervisor; WM: numerical simulation; WM and YL: data processing and article improving.
Funding
This work was synergic supported by the National Key R and D Program of China under Grant 2018YFC15035, the Key Program of the National Natural Science Foundation of China under Grant 41930108, the innovation leading program of Central South University under Grant 506030101, and the Talents Gathering Program of Hunan Province, China under Grant 2018RS3013.
Conflict of Interest
The authors declare that the research was conducted in the absence of any commercial or financial relationships that could be construed as a potential conflict of interest.
Publisher’s Note
All claims expressed in this article are solely those of the authors and do not necessarily represent those of their affiliated organizations, or those of the publisher, the editors and the reviewers. Any product that may be evaluated in this article, or claim that may be made by its manufacturer, is not guaranteed or endorsed by the publisher.
Acknowledgments
We acknowledge the European Space Agency and NASA’s Earth Observing System Data and Information System for making AMSR-2 images, SM data, SRTM DEM data and satellite cloud images free available to various researchers and communities. And we would also like to thank the reviewers for their hard work on this article.
Supplementary Material
The Supplementary Material for this article can be found online at: https://www.frontiersin.org/articles/10.3389/feart.2021.656216/full#supplementary-material
Supplementary Figure S1 | Spatiotemporal evolution of the MBT residuals with 10.65 GHz and 89 GHz at H polarization (following the Figure 3). The circle dots mark the epicenters of the shock, with gray color for the days after shock.
Supplementary Figure S2 | Seismic distribution (Mw >4.0) and spatiotemporal evolution of MBT residuals with 10.65 GHz at H polarization from October to December in 2015 and 2016. The circle dots mark the epicenters of the different magnitude shock, with white, red, and gray color for the days before the earthquake, during the earthquake, and after the earthquake, respectively.
Supplementary Figure S3 | Time distribution of reported earthquake anomalies at multiple geosphere. The dashed line and solid line indicate the intermittent and continuous abnormality, respectively. The light blue dashed line represents the point in time when the anomalies appeared and disappeared.
References
Akhoondzadeh, M., De Santis, A., Marchetti, D., Piscini, A., and Jin, S. (2019). Anomalous Seismo-LAI Variations Potentially Associated with the 2017 Mw = 7.3 Sarpol-E Zahab (Iran) Earthquake from Swarm Satellites, GPS-TEC and Climatological Data. Adv. Space Res. 64 (1), 143–158. doi:10.1016/j.asr.2019.03.020
Bahroudi, A., and Talbot, C. J. (2003). The Configuration of the Basement beneath the Zagros basin. J. Pet. Geol 26 (3), 257–282. doi:10.1111/j.1747-5457.2003.tb00030.x
Berberian, M., and King, G. C. P. (1981). Towards a Paleogeography and Tectonic Evolution of Iran. Can. J. Earth Sci. 18 (2), 210–265. doi:10.1139/e81-019
Camps, A., Vall-llossera, M., Villarino, R., Reul, N., Chapron, B., Corbella, I., et al. (2005). The Emissivity of Foam-Covered Water Surface at L-Band: Theoretical Modeling and Experimental Results from the FROG 2003 Field experiment. IEEE Trans. Geosci. Remote Sensing 43 (5), 925–937. doi:10.1109/TGRS.2004.839651
Chen, H., and Jin, Y. (2010). A Preliminary Detection of Anomalous Radiation of Rock Failures Related with Yushu Earthquake by Using Satellite-Borne Microwave Radiometers. Remote Sens. Technol. Appl. 25 (6), 860–866. doi:10.3724/SP.J.1087.2010.02819
Dobrovolsky, I. P., Zubkov, S. I., and Miachkin, V. I. (1979). Estimation of the Size of Earthquake Preparation Zones. Pageoph 117 (5), 1025–1044. doi:10.1007/BF00876083
Eastman, R., Lebsock, M., and Wood, R. (2019). Warm Rain Rates from AMSR-E 89-GHz Brightness Temperatures Trained Using CloudSat Rain-Rate Observations. J. Atmos. Ocean Tech. 36 (6), 1033–1051. doi:10.1175/JTECH-D-18-0185.1
Freund, F. (2011). Pre-earthquake Signals: Underlying Physical Processes. J. Asian Earth Sci. 41 (4-5), 383–400. doi:10.1016/j.jseaes.2010.03.009
Freund, F. (2000). Time-resolved Study of Charge Generation and Propagation in Igneous Rocks. J. Geophys. Res. 105 (B5), 11001–11019. doi:10.1029/1999JB900423
Freund, F. (2010). Toward a Unified Solid State Theory for Pre-earthquake Signals. Acta Geophys. 58 (5), 719–766. doi:10.2478/s11600-009-0066-x
Gu, C., Wang, Y., Zhang, X., Zhong, B., and Ma, X. (2016). Effects of Parameter on Brightness Temperature Computation in Microwave Band. J. Appl. Meteorol. Sci. 27 (3), 380–384. doi:10.11898/1001-7313.20160313
Imaoka, K., Maeda, T., Kachi, M., Kasahara, M., Ito, N., and Nakagawa, K. (2012). “Status of AMSR-2 Instrument on GCOM-W1,” in Earth Observing Missions and Sensors: Development, Implementation, and Characterization II (Kyoto, Japan: International Society for Optics and Photonics), 8528, 852815.
Jing, F., Singh, R. P., Cui, Y., and Sun, K. (2020). Microwave Brightness Temperature Characteristics of Three strong Earthquakes in Sichuan Province, China. IEEE J. Sel. Top. Appl. Earth Observations Remote Sensing 13, 513–522. doi:10.1109/JSTARS.2020.2968568
Khanban, M. A., Pakzad, M., Mirzaei, N., Moradi, A., Mehramuz, M., and Mahmoud, M. (2021). The Present‐day Stress Field in the Zagros Fold-Thrust Belt of Iran, from Inversion of Focal Mechanisms. J. Geodynamics 143, 101812. doi:10.1016/j.jog.2020.101812
King, B. V., and Freund, F. (1984). Surface Charges and Subsurface Space-Charge Distribution in Magnesium Oxides Containing Dissolved Traces of Water. Phys. Rev. B 29 (10), 5814–5824. doi:10.1103/PhysRevB.29.5814
Ma, P., Li, H., and Zhang, P. (1999). Comprehensive Utilization of Urmia Salt lake Resources. J. Salt Lake Res. 7 (1), 11–20. doi:10.3969/j.issn.1008-858X.1999.01.002
Maeda, T., and Takano, T. (2010). Detection Algorithm of Earthquake-Related Rock Failures from Satellite-Borne Microwave Radiometer Data. IEEE Trans. Geosci. Remote Sensing 48 (4), 1768–1776. doi:10.1109/TGRS.2009.2036008
Maeda, T., and Takano, T. (2009). Detection of Microwave Signals Associated with Rock Failures in an Earthquake from Satellite-Borne Microwave Radiometer Data. Proc. Int. Geosci. Remote Sens. Symp., 61–64. doi:10.1109/IGARSS.2009.5418159
Maeda, T., and Takano, T. (2008). Discrimination of Local and Faint Changes from Satellite-Borne Microwave-Radiometer Data. IEEE Trans. Geosci. Remote Sensing 46 (9), 2684–2691. doi:10.1109/TGRS.2008.919144
Mao, W. (2019). Pressure Effects on the Microwave Radiation and Dielectric Property of Rocks: Experiments and Mechanisms. dissertation’s thesis] (Shenyang: Northeastern University). doi:10.33737/gpps19-bj-086
Mao, W., Wu, L., Liu, S., Gao, X., Huang, J., Xu, Z., et al. (2020). Additional Microwave Radiation from Experimentally Loaded Granite Covered with Sand Layers: Features and Mechanisms. IEEE Trans. Geosci. Remote Sensing 58, 5008–5022. doi:10.1109/TGRS.2020.2971465
Pulinets, S., and Ouzounov, D. (2011). Lithosphere-Atmosphere-Ionosphere Coupling (LAIC) Model - an Unified Concept for Earthquake Precursors Validation. J. Asian Earth Sci. 41 (4-5), 371–382. doi:10.1016/j.jseaes.2010.03.005
Qi, Y., Wu, L., Ding, Y., and Mao, W. (2020c). Microwave Brightness Temperature Anomalies Associated with the 2015 Mw 7.8 Gorkha and Mw 7.3 Dolakha Earthquakes in Nepal. IEEE Trans. Geosci. Remote Sensing, 1–11. doi:10.1109/TGRS.2020.3036079
Qi, Y., Wu, L., He, M., and Mao, W. (2020a). Spatio-temporally Weighted Two-step Method for Retrieving Seismic MBT Anomaly: May 2008 Wenchuan Earthquake Sequence Being a Case. IEEE J. Sel. Top. Appl. Earth Observations Remote Sensing 13, 382–391. doi:10.1109/JSTARS.2019.2962719
Qi, Y., Wu, L., Mao, W., Ding, Y., and He, M. (2021b). Discriminating Possible Causes of Microwave Brightness Temperature Positive Anomalies Related with May 2008 Wenchuan Earthquake Sequence. IEEE Trans. Geosci. Remote Sensing 59, 1903–1916. doi:10.1109/TGRS.2020.3004404
Reilinger, R., Mcclusky, S., Vernant, P., Lawrence, S., Ergintav, S., Cakmak, R., et al. (2006). GPS Constraints on continental Deformation in the Africa-Arabia-Eurasia continental Collision Zone and Implications for the Dynamics of Plate Interactions. J. Geophys. Res. 111 (B5), a–n. doi:10.1029/2005JB004051
Salahi, A., and Asareh, M. (2008). “Iran and its Natural Resources Features,” in Review of Forests, wood Products and wood Biotechnology of Iran and Germany, Part II (Göttingen: Universitätsverlag Göttingen).
Saraf, A. K., Rawat, V., Banerjee, P., Choudhury, S., Panda, S. K., Dasgupta, S., et al. (2008). Satellite Detection of Earthquake thermal Infrared Precursors in Iran. Nat. Hazards 47, 119–135. doi:10.1007/s11069-007-9201-7
Senturk, E., Inyurk, S., and Sertcelik, I. (2020). Ionospheric Anomalies Associated with the Mw 7.3 Iran-Iraq Border Earthquake and a Moderate Magnetic Storm. Ann. Geophys. 38, 1031–1043. doi:10.5194/angeo-38-1031-2020
Taghipour, K., Khatib, M. M., Heyhat, M., Shabanian, E., and Vaezihir, A. (2018). Evidence for Distributed Active Strike-Slip Faulting in NW Iran: The Maragheh and Salmas Fault Zones. Tectonophysics 742-743, 15–33. doi:10.1016/j.tecto.2018.05.022
Takano, T., and Maeda, T. (2009). Experiment and Theoretical Study of Earthquake Detection Capability by Means of Microwave Passive Sensors on a Satellite. IEEE Geosci. Remote Sensing Lett. 6 (1), 107–111. doi:10.1109/LGRS.2008.2005735
Tariq, M. A., Shah, M., Hernández-Pajares, M., and Iqbal, T. (2019). Pre-earthquake Ionospheric Anomalies before Three Major Earthquakes by GPS-TEC and GIM-TEC Data during 2015-2017. Adv. Space Res. 63 (7), 2088–2099. doi:10.1016/j.asr.2018.12.028
Ulaby, F., and Long, D. (2015). Microwave Radar and Radiometric Remote Sensing. Fitchburg: Artech House.
Ulaby, F. T., Moore, R. K., and Fung, A. K. (1981). “Microwave Remote Sensing: Active and Passive,” in Remote Sensing Fundamentals and Radiometry (Boston, MA, USA: Addison-Wesley), 186–254.
Vaka, D. S., Rao, Y. S., and Bhattacharya, A. (2019). Surface Displacements of the 12 November 2017 Iran-Iraq Earthquake Derived Using SAR Interferometry. Geocarto Int. 36, 660–675. doi:10.1080/10106049.2019.1618927
Vergés, J., Saura, E., Casciello, E., Fernàndez, M., Villaseñor, A., Jiménez-munt, I., et al. (2011). Crustal-scale Cross-Sections across the NW Zagros belt: Implications for the Arabian Margin Reconstruction. Geol. Mag. 148 (5-6), 739–761. doi:10.1017/S0016756811000331
Vernant, P., Nilforoushan, F., Hatzfeld, D., Abbassi, M. R., Vigny, C., Masson, F., et al. (2004). Present-day Crustal Deformation and Plate Kinematics in the Middle East Constrained by GPS Measurements in Iran and Northern Oman. Geophys. J. Int. 157 (1), 381–398. doi:10.1111/j.1365-246X.2004.02222.x
Wang, Z., Zhang, R., and Liu, Y. (2019). 3D Coseismic Deformation Field and Source Parameters of the 2017 Iran-Iraq Mw7.3 Earthquake Inferred from DInSAR and MAI Measurements. Remote Sensing 11 (19), 2248. doi:10.3390/rs11192248
Williams, G. (1971). Microwave Emissivity Measurements of Bubbles and Foam. IEEE Trans. Geosci. Electron. 9 (4), 221–224. doi:10.1109/TGE.1971.271504
Wu, L.-x., Qin, K., and Liu, S.-j. (2012). GEOSS-based thermal Parameters Analysis for Earthquake Anomaly Recognition. Proc. IEEE 100 (10), 2891–2907. doi:10.1109/JPROC.2012.2184789
Wu, L., Liu, S., and Wu, H. (2006). The experiment Evidences for Tectonic Earthquake Forecasting Based on Anomaly Analysis on Satellite Infrared Image. IEEE Int. Symp. Geosci. Remote Sens. 2158–2162. doi:10.1109/IGARSS.2006.558
Wu, L., Zheng, S., De Santis, A., Qin, K., Di, Mauro, R., Liu, S., et al. (2016). Geosphere Coupling and Hydrothermal Anomalies before the 2009 Mw 6.3 L'Aquila Earthquake in Italy. Nat. Hazards Earth Syst. Sci. 16 (8), 1859–1880. doi:10.5194/nhess-16-1859-2016
Yang, Y. H., Hu, J. C., Yassaghi, A., Tsai, M. C., Zare, M., Chen, Q., et al. (2018). Midcrustal Thrusting and Vertical Deformation Partitioning Constraint by 2017 Mw 7.3 Sarpol Zahab Earthquake in Zagros Mountain Belt, Iran. Seismol. Res. Lett. 89 (6), 2204–2213. doi:10.1785/0220180022
Zhao, S., Chen, W., and Hang, H. (2002). Analysis on Precipitation Altostratus Microphsical Structure in spring over North-East Qinghai. plateau meteorology 21 (3), 281–287. doi:10.1002/mop.10502
Zhou, Y. (2019). Muti-parameter Remote Sensing Pre-seismic Anomalies over Iran-Iraq Area. Master’s thesis. Shenyang: Northeastern University. doi:10.1109/igarss.2019.8898238
Keywords: Sarpol Zahab earthquake, earthquake anomaly, microwave brightness temperature, STW-TSM, multi-frequency data, remote sensing
Citation: Ding Y, Qi Y, Wu L, Mao W and Liu Y (2021) Discriminating the Multi-Frequency Microwave Brightness Temperature Anomalies Relating to 2017 Mw 7.3 Sarpol Zahab (Iran-Iraq Border) Earthquake. Front. Earth Sci. 9:656216. doi: 10.3389/feart.2021.656216
Received: 20 January 2021; Accepted: 02 August 2021;
Published: 12 August 2021.
Edited by:
Dimitar Ouzounov, Chapman University, United StatesReviewed by:
Angelo De Santis, University of Studies G d’Annunzio Chieti and Pescara, ItalyFeng Jing, China Earthquake Administration, China
Copyright © 2021 Ding, Qi, Wu, Mao and Liu. This is an open-access article distributed under the terms of the Creative Commons Attribution License (CC BY). The use, distribution or reproduction in other forums is permitted, provided the original author(s) and the copyright owner(s) are credited and that the original publication in this journal is cited, in accordance with accepted academic practice. No use, distribution or reproduction is permitted which does not comply with these terms.
*Correspondence: Yuan Qi, d2Vsb3ZlcXlAMTYzLmNvbQ==; Lixin Wu, d3VseDY2QGNzdS5lZHUuY24=