 Yin Fang
 Guopei Huang2†
- 1College of Marine Ecology and Environment, Shanghai Ocean University, Shanghai, China
- 2State Key Laboratory of Environmental Geochemistry, Guiyang Institute of Geochemistry, Chinese Academy of Sciences, Guiyang, China
- 3Shanghai Key Laboratory of Atmospheric Particle Pollution and Prevention (LAP3), Department of Environmental Science and Engineering, Fudan University, Shanghai, China
- 4College of Marine Geosciences, Ocean University of China, Qingdao, China
Coastal seas, including coastal bays, are the geographically critical transitional zone that links terrestrial and open oceanic ecosystems. Organic carbon cycling in this area is a dynamic and disproportionally key component in the global carbon cycle and budget. As the thermally-transformed organic carbon produced exclusively from the incomplete combustion of biomass and fossil fuels, the recalcitrance and resultant longer environmental residence times result in important implications of black carbon (BC) in the global carbon budget. However, the environmental dynamics of BC in coastal seas have not well been constrained. In this study, we conducted one seawater sampling campaign in the high-intensity BC emission influenced Bohai Bay (BHB) and Laizhou Bay (LZB) in 2013, and quantified both particulate and dissolved BC (PBC and DBC). We elaborated the distributions, sources, and associated influencing factors of PBC and DBC in BHB and LZB in 2013, and simultaneously contrasted the PBC and DBC quantity and quality under two distinct fluvial hydrological regimes of 2013 and 2014 [discussed in Fang et al. (Environ. Sci. Technol., 2021, 55, 788–796)]. Except for the overwhelmingly high PBC in northern BHB caused by anthropogenic point-source emission, horizontally, both PBC and DBC showed a seaward decreasing trend, suggesting that riverine discharge was the major source for PBC and DBC. Vertically, in contrast to the uniform concentrations of DBC between surface and bottom waters, the PBC levels in bottom waters was significantly higher than that in surface waters, which was primarily resulted from the intense sediment re-suspension process during this sampling period. The nearly simultaneous investigations in 2013 and 2014 revealed consistent spatial patterns of PBC and DBC quantity and quality. But significantly lower PBC and DBC quantity and quality were found in 2014 than in 2013, which were largely due to the significantly different climatic conditions (including the watershed hydrology and sunlit radiation) between these 2 years.
Introduction
Coastal seas, including coastal bays, are the geographically critical transitional zone that links terrestrial and open oceanic ecosystems (Bauer et al., 2013; Fang et al., 2018a; Fang et al., 2021). Despite comprising only 7–10% of global ocean surface area, the coastal seas are responsible for 20–30% of global marine primary productivity and up to 80–90% of organic carbon (OC) accumulation in marine sediments (Bauer et al., 2013; Keil, 2017; Fang et al., 2018a). This results in OC cycling in coastal seas as a dynamic and disproportionally crucial component in the global carbon cycle and budget (Dai et al., 2012; Bauer et al., 2013). As the thermally-transformed OC generated exclusively from the incomplete combustion of biomass and fossil fuels (Masiello, 2004; Hammes et al., 2007), black carbon (BC) has recently received considerable concern due to its recalcitrance and the resultant longer environmental residence times, which has significant implications when including BC in the global carbon budget (Bird et al., 2015; Landry and Matthews, 2017; Wagner et al., 2019). The global-scale yields of BC from biomass burning and fossil fuels combustion are each estimated to be 114–383 and 2–29 Tg-C yr−1 (Bond et al., 2013; Santín et al., 2016; Coppola et al., 2018; Jones et al., 2019). A vast majority of BC (>90%) produced from vegetation wildfires resides in the neighborhood of the burning sites (Kuhlbusch and Crutzen, 1995; Jones et al., 2019). BC deposited on the landscapes becomes incorporated into soils, in which it constitutes on average 13.7% of soil organic carbon reservoirs globally (Reisser et al., 2016). In addition to mineralization to CO2, lateral transport is a significant process for the translocation of BC from soils (Guggenberger et al., 2008; Major et al., 2010; Dittmar et al., 2012a). Soil BC is mobilized to adjacent rivers and then to coastal seas through wind, erosion, and/or leaching pathways (Abney and Berhe, 2018; Coppola et al., 2018), supplying a continuous contribution of fire-derived carbon to the aquatic environments (Wagner et al., 2018). In the natural water bodies, BC occurs simultaneously as particulate and dissolved phases (i.e., PBC and DBC) (Wagner et al., 2015; Wang et al., 2016; Xu et al., 2016; Myers-Pigg et al., 2017; Fang et al., 2018a; Wagner et al., 2018; Qi et al., 2020; Fang et al., 2021; Liu and Han, 2021). Available studies regarding process-based BC fluxes suggested that global rivers deliver 17–37 and 18–66 Tg-C yr−1 of PBC and DBC to the coastal seas, respectively (Jaffé et al., 2013; Coppola et al., 2018; Jones et al., 2020; Fang et al., 2021). It is therefore of great necessity and importance to elaborate the distributions and sources of BC in coastal seas, especially those areas strongly influenced by high intensity of BC emission (Wang et al., 2012; Wang et al., 2014), such as the eastern China marginal seas, which will largely refine the regional and even global BC cycle (Fang et al., 2018a; Fang et al., 2021).
China is commonly recognized as the largest BC emitter in the world, accounting for approximately one-fifth of global emissions (Bond et al., 2004). Due to the large spatially-bias in development status in China, the geographic patterns of BC emission varied dramatically (Wang et al., 2012). The recent compiled BC emission inventory manifests that districts in Bohai Rim, comprising the five provinces/municipalities of Shandong, Hebei, Liaoning, Beijing, and Tianjin (Figure 1A), rank the strongest BC emission intensity in China (Wang et al., 2012). Though comprising only 5% of the Chinese territory, these areas contribute >20% of China’s total BC emission. Under the integrated impacts from large amounts of riverine discharge (including the Yellow River (Figure 1B), carrying the world’s second largest sediment loads into the ocean (Hu et al., 2016)) and prevailing northerly/northwesterly winter and spring East Asian monsoon, large quantities of BC produced in Bohai Rim can be easily migrated to the adjacent coastal Bohai Sea and then involved in the coastal carbon cycle (Wang et al., 2016; Xu et al., 2016; Fang et al., 2015; Fang et al., 2018a; Fang et al., 2021). This renders the coastal Bohai Sea as an important BC reservoir (Huang et al., 2016; Fang et al., 2015; Fang et al., 2018a; Fang et al., 2021).
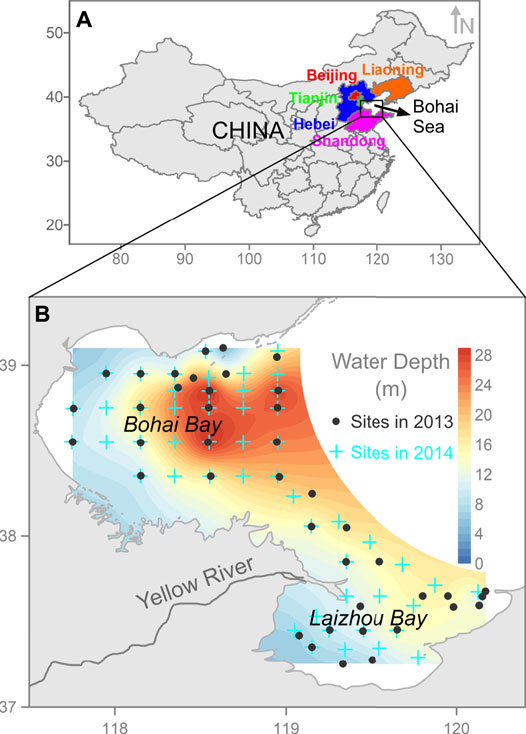
FIGURE 1. Map of study area illustrating deployed sampling sites with water depth. Note: Details for sampling sites in 2014 is referred to Supplementary Table S1 and Fang et al. (2021).
To date, there have been plenty of investigations concerning PBC on the regional atmosphere, soils, sediments, and coastal wetlands in Bohai Rim (Li and Bai, 2009; Liu et al., 2011; Chen et al., 2013; Huang et al., 2014; Andersson et al., 2015; Fang et al., 2015; Zhang et al., 2015; Fang et al., 2016; Liu et al., 2016; Xu et al., 2017; Fang et al., 2018b; Shao et al., 2018). In comparison, however, the available studies draw relatively less attention on PBC in the aquatic environments (such as the riverine water and coastal seawater), let alone the analytically highly complicated and challengeable DBC (Wang et al., 2016; Xu et al., 2016; Fang et al., 2018a; Qi et al., 2020; Fang et al., 2021). The relative absence of refined studies on PBC and DBC in aquatic ecosystems might to a large extent hamper our comprehensive understanding of BC geochemistry in this high-intensity BC emission affected coastal zones. To resolve this geochemically key issue, we implemented the seawater sampling campaigns in Bohai Bay (BHB) and Laizhou Bay (LZB) in two neighboring years of 2013 and 2014, at which their fluvial hydrological regimes contrasted significantly (Bulletin of Chinese River Sediment, 2013, 2014). We quantified and discussed both PBC and DBC, with relatively more emphasis on DBC molecular composition changes owing to the absolute advantage of the benzene poly-carboxylic acid (BPCA) molecular marker method used. The detailed sampling and analysis for samples in 2014 were detailed in our recent work (Fang et al., 2021). Here we only presented the associated datasets and figures to make direct and clear comparisons on PBC and DBC distributions and sources between these 2 years.
The primary objectives of this study were 1) to elaborate the distributions and sources of PBC and DBC in coastal BHB and LZB in 2013; and 2) to contrast the PBC and DBC quantity and quality under two distinct fluvial hydrological regimes of 2013 and 2014.
Materials and Methods
Seawater Sampling and Preparation
A total of 41 sites were deployed to collect the stratified (surface and bottom) seawater in coastal BHB and LZB during a month sampling duration in 2013 (from 23rd September to 17th October) (Figure 1B). Upon retrieval of seawater samples from Niskin bottles, they were immediately filtered through 47 mm diameter precombusted (at 450°C for 4 h) quartz fiber filters (QFF, Whatman, a nominal pore size of 0.7 μm) aboard to conduct the physical separation between particulate and dissolved phases. The QFFs loaded with total suspended solids (TSS) were reweighed under the same temperature and humidity conditions as those for the blank filters and stored at −20°C for PBC quantification. The mass concentrations of TSS (mg L−1) were calculated by dividing the dry weight of solids onto the filter by the total filtered seawater volume. For the dissolved phase, an aliquot of 1 L was acidified with 32% HCl (analytical grade) to pH = 2. The acidified filtrate was extracted for DBC through the solid phase extraction (SPE) cartridges (Supelco Supelclean ENVI-Chrom P, 500 mg), which was pre-rinsed with HPLC grade MeOH. The flow rate of extraction was limited within 5 ml min−1. Following the extraction, the SPE cartridges were desalted with 20 ml of pH = 2 HCl, dried under an airstream, and stored at −20°C for DBC quantification.
PBC Analysis
Except for elucidating the present distributions and sources of coastal seawater PBC, constructing a regional PBC budget has been one of our major scientific focuses (Fang et al., 2015, 2018a). To maximize comparability of PBC datasets within different PBC pools, including the atmosphere, riverine and seawater, as well as sediments, we kept the consistency of the PBC analytical method for these different sample types. The Thermal Optical Reflectance (TOR) method was originally designed for aerosol BC measurements (Chow et al., 2001), and it has been applied to reliably determine BC in soils and sediments, as well as TSS in waters (Han et al., 2007; Zhan et al., 2013; Fang et al., 2018a; Fang et al., 2021). So here we adopted the TOR method for quantifying PBC in coastal seawater samples.
PBC was analyzed on a Desert Research Institute Model 2001 Thermal/Optical Carbon Analyzer via the Interagency Monitoring of Protected Visual Environment (IMPROVE) protocol (Han et al., 2015; Fang et al., 2018a). Prior to the instrumental analysis, TSS was acidified with HCl fumes (32%) for at least 24 h to effectively remove the inorganic carbon. A circular punch of 0.544 cm2 drilled from the filter was placed in a quartz boat and sent into an oven. The oven was first heated in 100% He, releasing organic carbon fractions in different temperature steps. The environment was then shifted to 2% O2/98% He, and three BC sub-fractions (BC1, BC2, and BC3) were yielded at three temperature stages (580, 740, and 840°C). During 100% He, a portion of organic carbon pyrolyzed (defined as OCPyro) and was monitored from the reflectance laser. OCPyro similar to the original BC was oxidized in the second O2/He stage. The quantity of OCPyro was defined as the carbon that evolves in the oxidizing atmosphere until the reflectance laser signal returns to its initial value. Based on the IMPROVE protocol, PBC content is calculated by the sum of three BC sub-fractions minus OCPyro. The PBC in μg-C cm−2 output from the analyzer were then normalized to the initial volume of filtered seawater and were reported in μg-C per liter seawater (here abbreviated as μg-C L−1 in the following text).
DBC Analysis
DBC was analyzed at the molecular level using the BPCA method optimized in our laboratory (Huang et al., 2016; Fang et al., 2021), which not only eliminated the complicated pretreatments but also quantified the nitrated BPCAs (NO2-BPCAs), the significant fractions not involved by most of previous DBC studies (Dittmar, 2008; Jaffé et al., 2013; Wagner et al., 2015; Bao et al., 2017; Fang et al., 2017; Khan et al., 2017; Roebuck et al., 2018a; Roebuck et al., 2018b; Wagner et al., 2019; Bao et al., 2019; Drake et al., 2020; Jones et al., 2020). DBC was eluted from SPE cartridges with 10 ml of HPLC grade MeOH. The eluents were condensed to ∼0.5 ml with a high-purity N2 stream at 50°C and then transferred into 2 ml Teflon digestion tubes. After the eluents were evaporated to dryness, 0.5 ml of concentrated HNO3 (65%) was added. The tubes were sealed and heated at 170°C for 7 h to convert condensed aromatic structures of DBC into the BPCAs molecular markers. After digestion, the remaining HNO3 and water were evaporated to dryness under high purity N2 at 50°C. Subsequently, 5 μL of biphenyl-2′2-dicarboxylic acid (2 μg μl−1 in MeOH) was added as an internal standard. The samples were re-dissolved in 1 ml of MeOH/water (v/v, 50:50), and transferred to auto-sampler vials for BPCAs analysis.
BPCAs were determined on a Water a Alliance E2695 HPLC system outfitted with a photodiode array (PDA) ultraviolet absorbance detector and an auto-sampler. An ether-linked phenyl with polar end-capping reversed phase HPLC column (Synergi, 4.6 × 250 mm, 4 μm, Phenomenex) and a binary mobile phase consisting of mobile phase A (0.5% formic acid in water, v/v, pH = 2.3) and B (MeOH) under the gradient elution conditions were used to implement the chromatographic separation. The BPCAs were identified through the retention time and absorbance spectra (210–400 nm), and quantification was conducted using the absorbance signal at 240 nm.
In this study, a total of 14 BPCAs (including 7 NO2-BPCAs, their full names and abbreviations are listed in Supplementary Table S2) with the number of carboxyl functional groups (−COOHs) ≥ 3 were operationally defined as DBC. The B2CAs (substituted with 2 −COOHs) were not involved, since they might be originated from certain sources other than incomplete combustion processes, such as the lignin and humic substances (Brodowski et al., 2005; Coppola et al., 2014). Some BPCAs compounds with standards commercially unavailable were quantified by their analogous standard compounds calibration curves. Specifically, the calibration curve of 5-NO2-1,2,3-B3CA was used to quantify 4-NO2-1,2,3-B3CA, 3-NO2-1,2,4-B3CA, 5-NO2-1,2,4-B3CA, and 6-NO2-1,2,4-B3CA, and that of 1,2,4,5-B4CA was used to quantify 1,2,3,4-B4CA, 1,2,3,5-B4CA, 3-NO2-1,2,4,5-B4CA, and 5-NO2-1,2,3,4-B4CA. An average factor of 4.0 obtained from the systematic analysis of a suite of BC reference materials, consisting of charcoals, soot substances, and high-ring PAH model compounds, which covered the entire BC combustion continuum, was used to convert the carbon in all quantified BPCAs into DBC for seawater samples (Fang et al., 2021).
Results and Discussion
Distributions and Sources of PBC in 2013
PBC was detected in all seawater samples, and its concentration varied by more than one order of magnitude, ranging from 10.1 to 111.1 μg-C L−1 in surface waters and from 10.9 to 248.2 μg-C L−1 in bottom waters (Supplementary Table S3). The mean PBC in surface and bottom waters were 32.2 ± 24.3 and 45.9 ± 40.4 μg-C L−1, respectively. The PBC concentrations in BHB and LZB were markedly lower than those in the riverine samples in Bohai Rim (Fang et al., 2018a). For the sub-regions, the BHB had PBC concentration ranges of 11.7–111.1 μg-C L−1 in surface waters and 10.9–248.2 μg-C L−1 in bottom waters, averaging 40.3 ± 29.9 and 56.9 ± 50.5 μg-C L−1, respectively (Supplementary Table S3). In comparison, the LZB had narrower PBC concentration ranges (by a factor of < 5; 10.1–43.1 μg-C L−1 in surface waters and 16.0–78.0 μg-C L−1 in bottom waters) and lower PBC concentration averages (22.8 ± 8.3 μg-C L−1 in surface waters and 33.1 ± 16.1 μg-C L−1 in bottom waters). It was worth noting that the relative magnitude of PBC concentrations in BHB and LZB was consistent with their respective riverine PBC levels. The riverine PBC levels in BHB (394.3 ± 591.8 μg-C L−1) was on average 30% higher than those rivers pouring into LZB (303.4 ± 241.5 μg-C L−1), reflecting the more intense human activities occurring in BHB than in LZB (Fang et al., 2018a).
The spatial distributions of PBC concentrations in 2013 were shown in Figures 2A,B. Horizontally, it was apparent that, except for the extremely high individual PBC values in northern BHB, an area adjacent to the rapidly constructing Caofeidian (CFD) industrial district, PBC levels overall exhibited a seaward decreasing trend, which was particular true in the Yellow River-affected near-shore areas. The markedly higher PBC concentrations measured in the riverine than in the bay together with the overall seaward decreasing trend suggested that PBC in BHB and LZB was primarily sourced from locally river discharge. PBC concentrations in the CFD-affected region averaged 56.2 ± 31.7 μg-C L−1 in surface waters and 78.7 ± 66.1 μg-C L−1 in bottom waters, which were ∼2 times higher than those of rest of BHB (27.0 ± 20.6 μg-C L−1 in surface waters and 38.8 ± 17.5 μg-C L−1 in bottom waters) (Supplementary Table S4). During our sampling, we noticed that there were plenty of large engineering machineries operating in the CFD and dusts suspending in the air. It was therefore plausible that the extremely high PBC levels observed in northern BHB were largely due to the local anthropogenic point-source emission and subsequent atmospheric deposition.
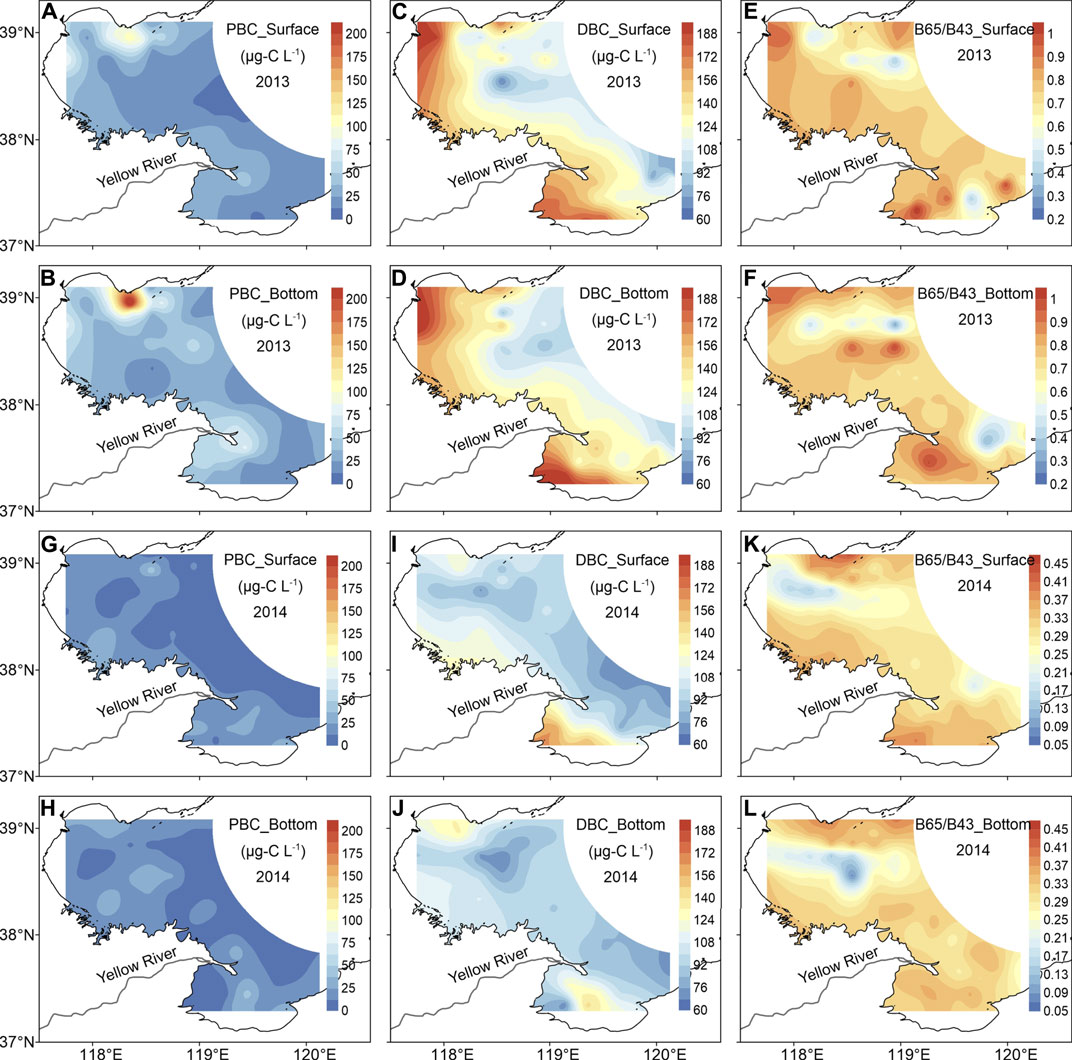
FIGURE 2. Distributions of PBC and DBC concentrations as well as DBC aromatic condensation in BHB and LZB in 2013 and 2014. Note: 1) Datasets for illustrating Figures 2A–F and Figures 2G–L are referred to Supplementary Table S4 and Fang et al. (2021), respectively; 2) DBC molecularly aromatic condensation was characterized by the ratio of (B6CA + B5CA)/(tB4CA + tB3CA), and we abbreviated it as B65/B43 (tB4CAs and tB3CAs denote total (including nitrated and non-nitrated) B4CAs and B3CAs, respectively, listed in Supplementary Table S2).
Vertically, the PBC concentration in bottom waters was significantly (t test, p < 0.001) higher than that in surface waters (Supplementary Tables S3, S4). The mean water depth of the study area was within 16 m (Figure 1B) and there was strong wind blowing during our sampling period. What impressed us most was that during our sampling in northern BHB, the strong wind resulted in the severe sea conditions and even interrupted our scheduled sampling arrangements. We had to take shelter from the strong wind for several days (Supplementary Table S4). The shallow water depth in combination with the strong wind triggered the intensive re-suspension of sediments, which elevated bottom TSS and associated PBC concentrations (Supplementary Figure S1; Supplementary Tables S3, S4). The TSS normalized PBC (termed PBC*, expressed as mg-C g−1 TSS and here abbreviated as mg-C g−1) averaged 2.45 ± 0.90 mg-C g−1 in surface waters and 1.84 ± 0.50 mg-C g−1 in bottom waters in BHB, and 4.46 ± 2.44 mg-C g−1 in surface waters and 4.17 ± 2.11 mg-C g−1 in bottom waters in LZB (Supplementary Table S3). The PBC* concentrations detected in surface sediments covering the same regions in this study averaged 0.93 ± 0.31 mg-C g−1 in BHB and 0.42 ± 0.29 mg-C g−1 in LZB (Fang et al., 2015), both of which were lower than the PBC* measured in their respective seawater samples. This supported that the sediment re-suspension was a vital factor declining bottom waters PBC* concentrations. The influence of sediment re-suspension was particular evident in BHB, as indicated by the relatively larger differences between surface and bottom waters PBC* concentrations occurring in BHB than those in LZB. To conclude, the spatial distribution of PBC concentration in BHB and LZB in 2013 was controlled by multiple factors, including riverine discharge, point-source emission and subsequent atmospheric deposition, as well as sediment re-suspension.
Distributions and Sources of DBC in 2013
In contrast to that of PBC, DBC concentration in BHB and LZB in 2013 varied by only a factor of <3, and similar averages were observed in surface and bottom waters (Supplementary Table S3). The DBC concentration ranged from 65.9 to 188.9 μg-C L−1 in surface waters and from 83.9 to 208.3 μg-C L−1 in bottom waters, with mean values of 131.0 ± 30.2 and 133.2 ± 29.9 μg-C L−1, respectively. Regardless of layers, the BHB and LZB sub-regions also had similar DBC ranges and averages (Supplementary Table S3). Due to high BC emission intensity in Bohai Rim and the weak water exchange in the semi-enclosed Bohai Sea, the DBC concentrations in BHB and LZB were relatively higher than those in other coastal seas, such as 32.0–49.0 μg-C L−1 for East China Sea (Wang et al., 2016), 5.9–19.2 μg-C L−1 for western South China Sea (Fang et al., 2017), 7.9–12.1 μg-C L−1 for Chukchi Sea (Nakane et al., 2017), 4.8–15.5 μg-C L−1 for Bering Sea (Nakane et al., 2017), and 7.2–46.8 μg-C L−1 for Gulf of Mexico (Dittmar et al., 2012a). Undoubtedly, they were also higher than those detected in open oceans, such as 4.0–30.0 μg-C L−1 for Atlantic Ocean and 1.1–16.8 μg-C L−1 for Pacific Ocean (Dittmar and Paeng, 2009; Ziolkowski and Druffel, 2010; Coppola and Druffel, 2016; Wagner et al., 2019). However, the DBC concentrations in BHB and LZB were lower than those of riverine samples, not only in rivers encompassing BHB and LZB (range: 161–735 μg-C L−1, mean: 399 ± 142 μg-C L−1) (Fang et al., 2018a), but also in some major world rivers, such as the Amazon (181–802 μg-C L−1), Congo (444–912 μg-C L−1), Mississippi (∼216 μg-C L−1), and Siberian Arctic Rivers (100–500 μg-C L−1) (Jaffé et al., 2013; Myers-Pigg et al., 2015; Coppola et al., 2019; Wagner et al., 2019; Drake et al., 2020).
Despite the above comparisons conducted, of particular note is that the estimation of DBC concentrations from BPCA concentrations is largely method-dependent. To our knowledge, formulations proposed by Dittmar (2008) and Stubbins et al. (2015) were widely adopted for calculating DBC concentrations in the aquatic ecosystems. In comparison with these two methods, the evident advantage of our method was the determination and subsequent inclusion of NO2-BPCAs, which were indeed produced during the nitration (Ziolkowski et al., 2011). We compared DBC concentrations calculated with the three methods and found that DBC concentrations calculated by our method were ∼3–4 times higher than those obtained from the Dittmar (2008) and Stubbins et al. (2015) equations (Supplementary Figure S2). For the coastal BHB and LZB, the NO2-BPCAs accounted for 21–35% of the total BPCAs (C-based), clearly demonstrating the necessity of inclusion of NO2-BPCAs into total BPCAs in future BPCAs-based DBC studies (Fang et al., 2021). Differences in the factors converting the BPCAs concentrations to DBC concentrations [a factor of 4 in Fang et al. (2021) versus a factor of ∼3 in Dittmar (2008)] and differences in the relative weighting of individual BPCA concentrations in the three equations also to some extent results in the different DBC concentrations calculated with these equations. Finally, the production of B3CAs and B4CAs from non-pyrogenic sources (such as oak biomass, grass biomass, and compost) can lead to overestimation of calculated DBC concentrations (Bostick et al., 2018). Therefore, as some researchers proposed (Wagner et al., 2018), in the future it is critical to present individual BPCA concentrations, as shown here in Supplementary Table S5, so DBC-associated studies can be best integrated as the DBC fields continues to evolve. Nonetheless, given the consistency in our DBC analytical procedures and calculations, we feel that the following discussion of DBC spatial trends (horizontally and vertically in 2013 in this section) and temporal trends (comparing DBC quantity and quality between 2013 and 2014 in the next section) is geochemically meaningful.
Horizontally, consistent with that of PBC, the DBC concentration also decreased seaward (Figures 2C,D). Despite this overall similarity, there were significant spatial deviations on the locations of occurrence of the highest DBC and PBC concentrations in LZB. The highest DBC concentration occurred in the southern LZB, whereas the highest PBC level took place in the Yellow River Estuary. The overwhelmingly high sediment and associated PBC discharges from the Yellow River (Fang et al., 2018a) yielded high PBC concentration in the Yellow River Estuary. Our sampling campaign in August 2013 found that the TSS and PBC concentrations in the Yellow River each reached as high as 2000 mg L−1 and 5,720 μg-C L−1, both of which were 1–2 orders of magnitude higher than those detected in other surrounding rivers (Fang et al., 2018a). For areas nearby the southern LZB, there were widely distributed petrochemical and thermal industries (Pan et al., 2010; Pan et al., 2011), which consumed large amounts of fossil fuels and largely contributed to the high riverine (217–735 μg-C L−1) (Fang et al., 2018a) and subsequent estuarine DBC levels (>180 μg-C L−1). Vertically, in contrast to the elevated PBC levels in bottom waters than in surface waters, the dissolving characteristic of DBC together with the shallow feature of water depth of study area made the similar levels in surface and bottom waters.
Seen from the steep river-to-coastal sea DBC concentration gradients (by a factor of ∼3), it can be concluded that DBC in BHB and LZB was derived primarily from riverine inputs. This preliminary assertion could be also evidenced by the significant negative correlations between DBC concentrations and salinity observed in this study (R2 = 0.37–0.38, p < 0.01; Figures 3A,B). Regardless of global- and regional-scale marine districts (such as the present Bohai Sea), the existing studies revealed that the DBC flux from riverine discharge was approximately one order of magnitude higher than that from atmospheric deposition (Jaffé et al., 2013; Bao et al., 2017; Jones et al., 2020; Fang et al., 2018a; Fang et al., 2021). For instance, the riverine discharge and atmospheric deposition were estimated to delivery 6–16 and 0.9 Gg-C yr−1 of DBC into the Bohai Sea, respectively (Fang et al., 2018a). Recently, however, Wagner et al. (2019) found that the compound-specific stable carbon isotopes (δ13C) of DBC in the open ocean is ∼6‰ enriched than that in major world rivers. They thus concluded that the oceanic DBC does not predominantly originate from rivers and instead may be derived from autochthonous marine phytoplankton production. Besides, heterotrophic and abiotic (e.g., photochemical and radical-mediated oxidative and reductive) processes that transform DOC compounds to DBC are also likely sources of non-pyrogenic DBC (Chen et al., 2014; Waggoner et al., 2015). However, despite these suggestions, direct evidence for the production of DBC in marine waters (including coastal and open oceans) does not exist. It remains an open area for investigation, and we will look into this in our future work.
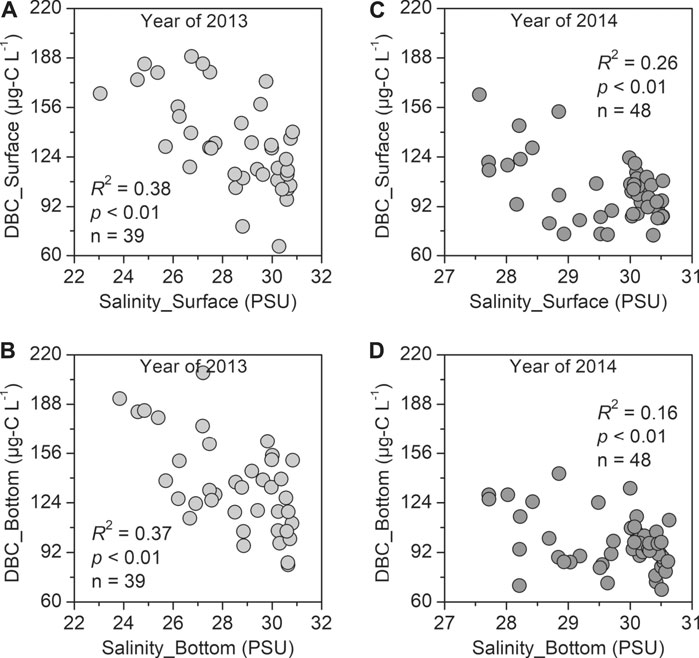
FIGURE 3. Linear correlations between DBC concentrations and salinity in BHB and LZB in 2013 and 2014. Note: Datasets for illustrating Figures 3A,B and Figures 3C,D are referred to Supplementary Table S4 and Fang et al. (2021), respectively.
Once DBC enters the coastal seas from rivers, during the waterborne transport it will undergo photochemical degradation, yielding a less condensed aromatic pool of DBC molecules (Stubbins et al., 2012; Masiello and Louchouarn, 2013; Fang et al., 2021). The DBC aromatic condensation in this study was characterized as the ratio of (B6CA + B5CA)/(tB4CA + tB3CA) (following we abbreviated it as B65/B43). The B65/B43 spanned from 0.38 to 1.07 in surface waters and from 0.28 to 1.03 in bottom waters, with averages of 0.74 ± 0.14 and 0.73 ± 0.16, respectively (Supplementary Table S3). Horizontally, it was visible that there was a general seaward decreasing trend for B65/B43 in both surface and bottom waters (Figures 2E,F), demonstrating the indeed occurrence of the influence of photochemical degradation on DBC quality (and quantity) along with waterborne transport. The photochemical-induced yield of less poly-condensed aromatic DBC has been observed in geographically distributed water regimes, including the western South China Sea (Fang et al., 2017), the surface Atlantic Ocean (Dittmar and Paeng, 2009), and even the global cryosphere (Khan et al., 2017). A rough estimation from Stubbins et al. (2012) suggested that the global oceanic photo-chemical sink of DBC reached 20–490 Tg-C yr−1. In addition, other potentially important mechanisms, like removal of DBC through photo-induced flocculation might also affect the distributions, quality, and also quantity of DBC. This process was found to be closely tied to iron chemistry (Chen et al., 2014), and should therefore be examined in future studies. Considering that a fraction of the PBC in these waters may have resulted from the photo-flocculation of DBC already present in the water sample, we recommend that in future studies it is of high importance to use consistent DBC and PBC analytical methods. The BPCA molecular marker method, which is capable of providing some structural and compositional information, may be the preferred approach from a relatively economic perspective. Only in this way can we achieve a clearer relationship between the PBC and DBC pools and then develop a more comprehensive understanding of the regional and global BC cycling (Coppola et al., 2014; Wagner et al., 2018). In addition, future studies comparing TOR-based and BPCA-based PBC will largely facilitate the analysis of PBC in situations where it is not necessary to obtain the structural/compositional information that can be obtained from the BPCA method.
Contrasting PBC and DBC Quantity and Quality Between 2013 and 2014
The nearly simultaneous sampling in BHB and LZB in 2013 (23rd September to 17th October) and 2014 (11th August to 5th September) made the contrasts in PBC and DBC quantity and quality between the 2 years meaningful. The spatial distributions of PBC and DBC concentrations (i.e., quantity) and DBC aromatic condensation (i.e., quality; characterized by B65/B43 ratios) were overall consistent between these 2 years (Figure 2). However, significantly lower PBC and DBC concentrations as well as DBC aromatic condensation were measured in 2014 than those in 2013 (Supplementary Table S3).
The PBC concentrations in 2014 averaged 14.2 ± 8.9 μg-C L−1 in surface waters and 16.0 ± 9.8 μg-C L−1 in bottom waters, both of which were half of those in 2013 (27.0 ± 20.6 μg-C L−1 in surface waters and 38.8 ± 17.5 μg-C L−1 in bottom waters; here we excluded the outliers in northern BHB caused by point-source emission for comparison) (Supplementary Tables S3, S4). The mean DBC concentrations in 2014 were 101.5 ± 19.6 μg-C L−1 in surface waters and 98.1 ± 17.2 μg-C L−1 in bottom waters, both were ∼23% lower than those in 2013 (131.0 ± 30.2 μg-C L−1 in surface waters and 133.2 ± 29.9 μg-C L−1 in bottom waters) (Supplementary Table S3). Watershed hydrology has been acknowledged as one of the major factors shaping the temporal variations of riverine PBC and DBC concentrations and fluxes (Dittmar et al., 2012b; Wagner et al., 2015; Marques et al., 2017; Roebuck et al., 2018a; Bao et al., 2019; Drake et al., 2020). With regard to the terrestrial-derived substances, like the present PBC and DBC, the variations in riverine fluxes will further affect their concentrations in the coastal seas, especially in the estuarine areas. As a case study of the dominant Yellow River, the annual sediment and water discharges were 1.7 × 10¹⁴ g and 2.4 × 10¹⁰ m3 in 2013, respectively, which were ∼5.8 and ∼2.1 times higher than those in 2014 (0.3 × 10¹⁴ g and 1.1 × 10¹⁰ m3) (Figure 4). Most importantly, the inter-annual deviations reached up to ∼6.7 times for sediment discharge and ∼3.5 times for water discharge in the 3 months of June, July, and August (Figure 4), the nearest period prior to our sampling. It can be therefore concluded that watershed hydrology-derived differences in riverine export was a major factor affecting the PBC and DBC concentrations in BHB and LZB between 2013 and 2014. This was evidenced by our recent rough estimations on the riverine PBC and DBC fluxes into the Bohai Sea (Fang et al., 2018a). Based on the hydrological datasets and measured riverine concentrations (from four riverine water sampling campaigns in August in 2013 and March, August and October in 2014), we estimated that ∼150.4 and ∼16.3 Gg-C of PBC and DBC were exported from rivers to the Bohai Sea during 2013 and ∼5.8 and ∼6.4 Gg-C were exported during 2014, respectively (Fang et al., 2018a). The annual riverine PBC and DBC fluxes were each ∼26 and ∼2.5 times higher in 2013 than in 2014. For the most concerned Yellow River, the PBC and DBC fluxes were ∼135.7 and ∼6.0 Gg-C in 2013, ∼58 and ∼3 times higher than in 2014, respectively (∼2.3 and ∼2.0 Gg-C yr−1). Unfortunately, however, due to the low temporal resolution riverine water sampling, we couldn’t achieve more refined temporal variations (such as monthly and even daily) of PBC and DBC fluxes, which need to be strengthened in our future work.
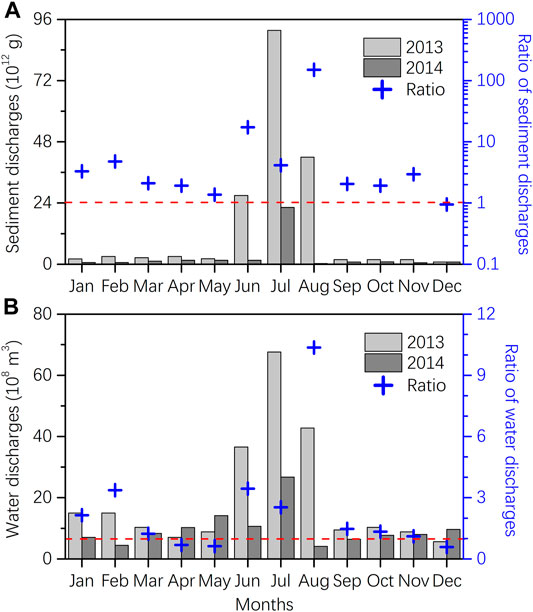
FIGURE 4. Comparison of Yellow River sediment and water discharges hydrological data between 2013 and 2014 (Bulletin of Chinese River Sediment, 2013, 2014). Note: 1) The left y-axis denotes monthly discharges of sediment (A) and water (B) in 2013 and 2014, and the right y-axis denotes ratios of monthly discharges of sediment (A) and water (B) between 2013 and 2014; 2) The blue “+” above red dashed line (Ratio = 1) indicates higher monthly discharges of sediment (A) and water (B) in 2013 than in 2014.
The DBC aromatic condensation as represented by the ratio of B65/B43 in 2014 averaged 0.30 ± 0.06 in both surface and bottom waters, which were lower than 0.74 ± 0.14 in surface waters and 0.73 ± 0.16 in bottom waters measured in 2013 (Supplementary Table S3). During these two sampling periods, the average water temperatures were 25.80 ± 1.07°C in surface waters and 24.70 ± 2.10°C in bottom waters in 2014, which were ∼5 and ∼4°C higher than those in 2013, respectively (20.53 ± 1.63°C in surface waters and 20.47 ± 1.59°C in bottom waters; Supplementary Table S3). The seawater temperature to some extent reflected the sunlight intensity. This signified that DBC in 2014 experienced higher extent of photochemical degradation, thus producing a pool of less poly-condensed DBC than those in 2013. In addition, the photochemical-induced DBC loss to some extent weakened the correlation between DBC concentration and salinity in 2014 (R2 = 0.16–0.26, p < 0.01; Figures 3C,D) as compared with those in 2013 (R2 = 0.37–0.38, p < 0.01; Figures 3A,B). From above contrasts in the PBC and DBC quantity and quality in BHB and LZB between 2013 and 2014, we concluded that the climatic conditions (such as the watershed hydrology and sunlight radiation) exerted a significant effect on the geochemical behaviors of terrestrial-derived substances in coastal seas.
Data Availability Statement
The original contributions presented in the study are included in the article/Supplementary Material, further inquiries can be directed to the corresponding author.
Author Contributions
All authors contributed to the design of the study. YF and GH collected and analyzed the seawater samples for PBC and DBC. YF built the figures and tables. All authors contributed to the data interpretation and writing of the manuscript.
Funding
This work was financially supported by the National Natural Scientific Foundation of China (No. 41703087) and Shanghai Committee of Science and Technology (No. 21ZR1427100).
Conflict of Interest
The authors declare that the research was conducted in the absence of any commercial or financial relationships that could be construed as a potential conflict of interest.
Publisher’s Note
All claims expressed in this article are solely those of the authors and do not necessarily represent those of their affiliated organizations, or those of the publisher, the editors and the reviewers. Any product that may be evaluated in this article, or claim that may be made by its manufacturer, is not guaranteed or endorsed by the publisher.
Acknowledgments
The authors wish to thank the crew of Research Vessel Haohai for collecting the coastal seawater samples.
Supplementary Material
The Supplementary Material for this article can be found online at: https://www.frontiersin.org/articles/10.3389/feart.2021.697728/full#supplementary-material
References
Abney, R. B., and Berhe, A. A. (2018). Pyrogenic Carbon Erosion: Implications for Stock and Persistence of Pyrogenic Carbon in Soil. Front. Earth Sci. 6, 26. doi:10.3389/feart.2018.00026
Andersson, A., Deng, J., Du, K., Zheng, M., Yan, C., Sköld, M., et al. (2015). Regionally-varying Combustion Sources of the January 2013 Severe Haze Events over Eastern China. Environ. Sci. Technol. 49, 2038–2043. doi:10.1021/es503855e
Bao, H., Niggemann, J., Huang, D., Dittmar, T., and Kao, S. J. (2019). Different Responses of Dissolved Black Carbon and Dissolved Lignin to Seasonal Hydrological Changes and an Extreme Rain Event. J. Geophys. Res. Biogeosci. 124, 479–493. doi:10.1029/2018jg004822
Bao, H., Niggemann, J., Luo, L., Dittmar, T., and Kao, S.-J. (2017). Aerosols as a Source of Dissolved Black Carbon to the Ocean. Nat. Commun. 8, 510. doi:10.1038/s41467-017-00437-3
Bauer, J. E., Cai, W.-J., Raymond, P. A., Bianchi, T. S., Hopkinson, C. S., and Regnier, P. A. G. (2013). The Changing Carbon Cycle of the Coastal Ocean. Nature 504, 61–70. doi:10.1038/nature12857
Bird, M. I., Wynn, J. G., Saiz, G., Wurster, C. M., and McBeath, A. (2015). The Pyrogenic Carbon Cycle. Annu. Rev. Earth Planet. Sci. 43, 273–298. doi:10.1146/annurev-earth-060614-105038
Bond, T. C., Doherty, S. J., Fahey, D. W., Forster, P. M., Berntsen, T., DeAngelo, B. J., et al. (2013). Bounding the Role of Black Carbon in the Climate System: A Scientific Assessment. J. Geophys. Res. Atmos. 118, 5380–5552. doi:10.1002/jgrd.50171
Bond, T. C., Streets, D. G., Yarber, K. F., Nelson, S. M., Woo, J. H., and Klimont, Z. (2004). A Technology-Based Global Inventory of Black and Organic Carbon Emissions from Combustion. J. Geophys. Res. 109, D14203. doi:10.1029/2003JD003697
Bostick, K. W., Zimmerman, A. R., Wozniak, A. S., Mitra, S., and Hatcher, P. G. (2018). Production and Composition of Pyrogenic Dissolved Organic Matter from a Logical Series of Laboratory-Generated Chars. Front. Earth Sci. 6, 1–14. doi:10.3389/feart.2018.00043
Brodowski, S., Rodionov, A., Haumaier, L., Glaser, B., and Amelung, W. (2005). Revised Black Carbon Assessment Using Benzene Polycarboxylic Acids. Org. Geochem. 36, 1299–1310. doi:10.1016/j.orggeochem.2005.03.011
Chen, B., Andersson, A., Lee, M., Kirillova, E. N., Xiao, Q., Kruså, M., et al. (2013). Source Forensics of Black Carbon Aerosols from China. Environ. Sci. Technol. 47, 9102–9108. doi:10.1021/es401599r
Chen, H., Abdulla, H. A. N., Sanders, R. L., Myneni, S. C. B., Mopper, K., Hatcher, P. G., et al. (2014). Production of Black Carbon-like and Aliphatic Molecules from Terrestrial Dissolved Organic Matter in the Presence of Sunlight and Iron. Environ. Sci. Technol. Lett. 1, 399–404. doi:10.1021/ez5002598
Chow, J. C., Watson, J. G., Crow, D., Lowenthal, D. H., and Merrifield, T. (2001). Comparison of IMPROVE and NIOSH Carbon Measurements. Aerosol Sci. Tech. 34, 23–34. doi:10.1080/02786820119073
Coppola, A. I., and Druffel, E. R. M. (2016). Cycling of Black Carbon in the Ocean. Geophys. Res. Lett. 43, 4477–4482. doi:10.1002/2016GL068574
Coppola, A. I., Seidel, M., Ward, N. D., Viviroli, D., Nascimento, G. S., Haghipour, N., et al. (2019). Marked Isotopic Variability within and between the Amazon River and marine Dissolved Black Carbon Pools. Nat. Commun. 10, 4018. doi:10.1038/s41467-019-11543-9
Coppola, A. I., Wiedemeier, D. B., Galy, V., Haghipour, N., Hanke, U. M., Nascimento, G. S., et al. (2018). Global-scale Evidence for the Refractory Nature of Riverine Black Carbon. Nat. Geosci 11, 584–588. doi:10.1038/s41561-018-0159-8
Coppola, A. I., Ziolkowski, L. A., Masiello, C. A., and Druffel, E. R. M. (2014). Aged Black Carbon in marine Sediments and Sinking Particles. Geophys. Res. Lett. 41, 2427–2433. doi:10.1002/2013GL059068
Dai, M., Yin, Z., Meng, F., Liu, Q., and Cai, W.-J. (2012). Spatial Distribution of Riverine DOC Inputs to the Ocean: an Updated Global Synthesis. Curr. Opin. Environ. Sustainability 4, 170–178. doi:10.1016/j.cosust.2012.03.003
Dittmar, T., de Rezende, C. E., Manecki, M., Niggemann, J., Coelho Ovalle, A. R., Stubbins, A., et al. (2012b). Continuous Flux of Dissolved Black Carbon from a Vanished Tropical forest Biome. Nat. Geosci 5, 618–622. doi:10.1038/ngeo1541
Dittmar, T., and Paeng, J. (2009). A Heat-Induced Molecular Signature in marine Dissolved Organic Matter. Nat. Geosci 2, 175–179. doi:10.1038/ngeo440
Dittmar, T., Paeng, J., Gihring, T. M., Suryaputra, I. G. N. A., and Huettel, M. (2012a). Discharge of Dissolved Black Carbon from a Fire-Affected Intertidal System. Limnol. Oceanogr. 57, 1171–1181. doi:10.4319/lo.2012.57.4.1171
Dittmar, T. (2008). The Molecular Level Determination of Black Carbon in marine Dissolved Organic Matter. Org. Geochem. 39, 396–407. doi:10.1016/j.orggeochem.2008.01.015
Drake, T. W., Wagner, S., Stubbins, A., Wabakanghanzi, J. N., Dinga, J. B., Six, J., et al. (2020). Du Feu à l'Eau: Source and Flux of Dissolved Black Carbon From the Congo River. Glob. Biogeochem. Cycles 34, e2020GB006560. doi:10.1029/2020GB006560
Fang, Y., Chen, Y., Huang, G., Hu, L., Tian, C., Xie, J., et al. (2021). Particulate and Dissolved Black Carbon in Coastal China Seas: Spatiotemporal Variations, Dynamics, and Potential Implications. Environ. Sci. Technol. 55, 788–796. doi:10.1021/acs.est.0c06386
Fang, Y., Chen, Y., Lin, T., Hu, L., Tian, C., Luo, Y., et al. (2018b). Spatiotemporal Trends of Elemental Carbon and Char/Soot Ratios in Five Sediment Cores from Eastern China Marginal Seas: Indicators of Anthropogenic Activities and Transport Patterns. Environ. Sci. Technol. 52, 9704–9712. doi:10.1021/acs.est.8b00033
Fang, Y., Chen, Y., Tian, C., Lin, T., Hu, L., Huang, G., et al. (2015). Flux and Budget of BC in the continental Shelf Seas Adjacent to Chinese High BC Emission Source Regions. Glob. Biogeochem. Cycles 29, 957–972. doi:10.1002/2014GB004985
Fang, Y., Chen, Y., Tian, C., Lin, T., Hu, L., Li, J., et al. (2016). Application of PMF Receptor Model Merging with PAHs Signatures for Source Apportionment of Black Carbon in the continental Shelf Surface Sediments of the Bohai and Yellow Seas, China. J. Geophys. Res. Oceans 121, 1346–1359. doi:10.1002/2015JC011214
Fang, Y., Chen, Y., Tian, C., Wang, X., Lin, T., Hu, L., et al. (2018a). Cycling and Budgets of Organic and Black Carbon in Coastal Bohai Sea, China: Impacts of Natural and Anthropogenic Perturbations. Glob. Biogeochem. Cycles 32, 971–986. doi:10.1029/2017GB005863
Fang, Z., Yang, W., Chen, M., and Ma, H. (2017). Source and Fate of Dissolved Black Carbon in the Western South China Sea during the Southwest Monsoon Prevailing Season. J. Geophys. Res. Biogeosci. 122, 2817–2830. doi:10.1002/2017jg004014
Glaser, B., Haumaier, L., Guggenberger, G., and Zech, W. (1998). Black Carbon in Soils: the Use of Benzenecarboxylic Acids as Specific Markers. Org. Geochem. 29 (4), 811–819. doi:10.1016/S0146-6380(98)00194-6
Guggenberger, G., Rodionov, A., Shibistova, O., Grabe, M., Kasansky, O. A., Fuchs, H., et al. (2008). Storage and Mobility of Black Carbon in Permafrost Soils of the forest Tundra Ecotone in Northern Siberia. Glob. Change Biol. 14, 1367–1381. doi:10.1111/j.1365-2486.2008.01568.x
Hammes, K., Schmidt, M. W. I., Smernik, R. J., Currie, L. A., Ball, W. P., Nguyen, T. H., et al. (2007). Comparison of Quantification Methods to Measure Fire-Derived (Black/elemental) Carbon in Soils and Sediments Using Reference Materials from Soil, Water, Sediment and the Atmosphere. Glob. Biogeochem. Cycles 21, a–n. doi:10.1029/2006GB002914
Han, Y., Cao, J., An, Z., Chow, J. C., Watson, J. G., Jin, Z., et al. (2007). Evaluation of the thermal/optical Reflectance Method for Quantification of Elemental Carbon in Sediments. Chemosphere 69, 526–533. doi:10.1016/j.chemosphere.2007.03.035
Han, Y. M., Wei, C., Bandowe, B. A. M., Wilcke, W., Cao, J. J., Xu, B. Q., et al. (2015). Elemental Carbon and Polycyclic Aromatic Compounds in a 150-Year Sediment Core from Lake Qinghai, Tibetan Plateau, China: Influence of Regional and Local Sources and Transport Pathways. Environ. Sci. Technol. 49, 4176–4183. doi:10.1021/es504568m
Hu, L., Shi, X., Bai, Y., Qiao, S., Li, L., Yu, Y., et al. (2016). Recent Organic Carbon Sequestration in the Shelf Sediments of the Bohai Sea and Yellow Sea, China. J. Mar. Syst. 155, 50–58. doi:10.1016/j.jmarsys.2015.10.018
Huang, G., Chen, Y., Tian, C., Tang, J., Zhang, H., Luo, Y., et al. (2016). Spatial Distributions and Seasonal Variations of Dissolved Black Carbon in the Bohai Sea, China. J. Coastal Res. 74, 214–227. doi:10.2112/si74-019.1
Huang, R.-J., Zhang, Y., Bozzetti, C., Ho, K.-F., Cao, J.-J., Han, Y., et al. (2014). High Secondary Aerosol Contribution to Particulate Pollution during Haze Events in China. Nature 514, 218–222. doi:10.1038/nature13774
Jaffé, R., Ding, Y., Niggemann, J., Vähätalo, A. V., Stubbins, A., Spencer, R. G. M., et al. (2013). Global Charcoal Mobilization from Soils via Dissolution and Riverine Transport to the Oceans. Science 340, 345–347. doi:10.1126/science.1231476
Jones, M. W., Coppola, A. I., Santín, C., Dittmar, T., Jaffé, R., Doerr, S. H., et al. (2020). Fires Prime Terrestrial Organic Carbon for Riverine export to the Global Oceans. Nat. Commun. 11, 2791. doi:10.1038/s41467-020-16576-z
Jones, M. W., Santín, C., van der Werf, G. R., and Doerr, S. H. (2019). Global Fire Emissions Buffered by the Production of Pyrogenic Carbon. Nat. Geosci. 12, 742–747. doi:10.1038/s41561-019-0403-x
Keil, R. (2017). Anthropogenic Forcing of Carbonate and Organic Carbon Preservation in Marine Sediments. Annu. Rev. Mar. Sci. 9, 151–172. doi:10.1146/annurev-marine-010816-060724
Khan, A. L., Wagner, S., Jaffe, R., Xian, P., Williams, M., Armstrong, R., et al. (2017). Dissolved Black Carbon in the Global Cryosphere: Concentrations and Chemical Signatures. Geophys. Res. Lett. 44, 6226–6234. doi:10.1002/2017GL073485
Kuhlbusch, T. A. J., and Crutzen, P. J. (1995). Toward a Global Estimate of Black Carbon in Residues of Vegetation Fires Representing a Sink of Atmospheric CO2and a Source of O2. Glob. Biogeochem. Cycles 9, 491–501. doi:10.1029/95GB02742
Landry, J.-S., and Matthews, H. D. (2017). The Global Pyrogenic Carbon Cycle and its Impact on the Level of Atmospheric CO2over Past and Future Centuries. Glob. Change Biol. 23, 3205–3218. doi:10.1111/gcb.13603
Li, W., and Bai, Z. (2009). Characteristics of Organic and Elemental Carbon in Atmospheric fine Particles in Tianjin, China. Particuology 7, 432–437. doi:10.1016/j.partic.2009.06.010
Liu, J., and Han, G. (2021). Tracing Riverine Particulate Black Carbon Sources in Xijiang River Basin: Insight from Stable Isotopic Composition and Bayesian Mixing Model. Water Res. 194, 116932. doi:10.1016/j.watres.2021.116932
Liu, J., Mo, Y., Li, J., Liu, D., Shen, C., Ding, P., et al. (2016). Radiocarbon‐derived Source Apportionment of fine Carbonaceous Aerosols before, during, and after the 2014 Asia‐Pacific Economic Cooperation (APEC) summit in Beijing, China. J. Geophys. Res. Atmos. 121, 4177–4187. doi:10.1002/2016JD024865
Liu, S., Xia, X., Zhai, Y., Wang, R., Liu, T., and Zhang, S. (2011). Black Carbon (BC) in Urban and Surrounding Rural Soils of Beijing, China: Spatial Distribution and Relationship with Polycyclic Aromatic Hydrocarbons (PAHs). Chemosphere 82, 223–228. doi:10.1016/j.chemosphere.2010.10.017
Major, J., Lehmann, J., Rondon, M., and Goodale, C. (2010). Fate of Soil-Applied Black Carbon: Downward Migration, Leaching and Soil Respiration. Glob. Change Biol. 16, 1366–1379. doi:10.1111/j.1365-2486.2009.02044.x
Marques, J. S. J., Dittmar, T., Niggemann, J., Almeida, M. G., Gomez-Saez, G. V., and Rezende, C. E. (2017). Dissolved Black Carbon in the Headwaters-To-Ocean Continuum of Paraíba Do Sul River, Brazil. Front. Earth Sci. 5, 11. doi:10.3389/feart.2017.00011
Masiello, C. A., and Louchouarn, P. (2013). Fire in the Ocean. Science 340, 287–288. doi:10.1126/science.1237688
Masiello, C. A. (2004). New Directions in Black Carbon Organic Geochemistry. Mar. Chem. 92, 201–213. doi:10.1016/j.marchem.2004.06.043
Myers-Pigg, A. N., Louchouarn, P., Amon, R. M. W., Prokushkin, A., Pierce, K., and Rubtsov, A. (2015). Labile Pyrogenic Dissolved Organic Carbon in Major Siberian Arctic Rivers: Implications for Wildfire-Stream Metabolic Linkages. Geophys. Res. Lett. 42, 377–385. doi:10.1002/2014gl062762
Myers-Pigg, A. N., Louchouarn, P., and Teisserenc, R. (2017). Flux of Dissolved and Particulate Low-Temperature Pyrogenic Carbon from Two High-Latitude Rivers across the Spring Freshet Hydrograph. Front. Mar. Sci. 4, 38. doi:10.3389/fmars.2017.00038
Nakane, M., Ajioka, T., and Yamashita, Y. (2017). Distribution and Sources of Dissolved Black Carbon in Surface Waters of the Chukchi Sea, Bering Sea, and the North Pacific Ocean. Front. Earth Sci. 5, 34. doi:10.3389/feart.2017.00034
Pan, X., Tang, J., Chen, Y., Li, J., and Zhang, G. (2011). Polychlorinated Naphthalenes (PCNs) in Riverine and marine Sediments of the Laizhou Bay Area, North China. Environ. Pollut. 159, 3515–3521. doi:10.1016/j.envpol.2011.08.016
Pan, X., Tang, J., Li, J., Guo, Z., and Zhang, G. (2010). Levels and Distributions of PBDEs and PCBs in Sediments of the Bohai Sea, North China. J. Environ. Monit. 12, 1234–1241. doi:10.1039/c000340a
Qi, Y., Fu, W., Tian, J., Luo, C., Shan, S., Sun, S., et al. (2020). Dissolved Black Carbon Is Not Likely a Significant Refractory Organic Carbon Pool in Rivers and Oceans. Nat. Commun. 11, 5051. doi:10.1038/s41467-020-18808-8
Reisser, M., Purves, R. S., Schmidt, M. W. I., and Abiven, S. (2016). Pyrogenic Carbon in Soils: A Literature-Based Inventory and a Global Estimation of its Content in Soil Organic Carbon and Stocks. Front. Earth Sci. 4, 80. doi:10.3389/feart.2016.00080
Roebuck, J. A., Medeiros, P. M., Letourneau, M. L., and Jaffé, R. (2018a). Hydrological Controls on the Seasonal Variability of Dissolved and Particulate Black Carbon in the Altamaha River, GA. J. Geophys. Res. Biogeosci. 123, 3055–3071. doi:10.1029/2018jg004406
Roebuck, J. A., Seidel, M., Dittmar, T., and Jaffé, R. (2018b). Land Use Controls on the Spatial Variability of Dissolved Black Carbon in a Subtropical Watershed. Environ. Sci. Technol. 52, 8104–8114. doi:10.1021/acs.est.8b00190
Santín, C., Doerr, S. H., Kane, E. S., Masiello, C. A., Ohlson, M., de la Rosa, J. M., et al. (2016). Towards a Global Assessment of Pyrogenic Carbon from Vegetation Fires. Glob. Change Biol. 22, 76–91. doi:10.1111/gcb.12985
Shao, P., Tian, H., Sun, Y., Liu, H., Wu, B., Liu, S., et al. (2018). Characterizing Remarkable Changes of Severe Haze Events and Chemical Compositions in Multi-Size Airborne Particles (PM1, PM2.5 and PM10) from January 2013 to 2016-2017 winter in Beijing, China. Atmos. EnvironmentEnviron 189, 133–144. doi:10.1016/j.atmosenv.2018.06.038
Stubbins, A., Niggemann, J., and Dittmar, T. (2012). Photo-lability of Deep Ocean Dissolved Black Carbon. Biogeosciences 9, 1661–1670. doi:10.5194/bg-9-1661-2012
Stubbins, A., Spencer, R. G. M., Mann, P. J., Holmes, R. M., McClelland, J. W., Niggemann, J., et al. (2015). Utilizing Colored Dissolved Organic Matter to Derive Dissolved Black Carbon export by Arctic Rivers. Front. Earth Sci. 3, 63. doi:10.3389/feart.2015.00063
Waggoner, D. C., Chen, H., Willoughby, A. S., and Hatcher, P. G. (2015). Formation of Black Carbon-like and Alicyclic Aliphatic Compounds by Hydroxyl Radical Initiated Degradation of Lignin. Org. Geochem. 82, 69–76. doi:10.1016/j.orggeochem.2015.02.007
Wagner, S., Brandes, J., Spencer, R. G. M., Ma, K., Rosengard, S. Z., Moura, J. M. S., et al. (2019). Isotopic Composition of Oceanic Dissolved Black Carbon Reveals Non-riverine Source. Nat. Commun. 10, 5064. doi:10.1038/s41467-019-13111-7
Wagner, S., Cawley, K. M., Rosario-Ortiz, F. L., and Jaffé, R. (2015). In-stream Sources and Links between Particulate and Dissolved Black Carbon Following a Wildfire. Biogeochemistry 124, 145–161. doi:10.1007/s10533-015-0088-1
Wagner, S., Jaffé, R., and Stubbins, A. (2018). Dissolved Black Carbon in Aquatic Ecosystems. Limnol. Oceanogr. 3, 168–185. doi:10.1002/lol2.10076
Wang, R., Tao, S., Balkanski, Y., Ciais, P., Boucher, O., Liu, J., et al. (2014). Exposure to Ambient Black Carbon Derived from a Unique Inventory and High-Resolution Model. Proc. Natl. Acad. Sci. 111, 2459–2463. doi:10.1073/pnas.1318763111
Wang, R., Tao, S., Wang, W., Liu, J., Shen, H., Shen, G., et al. (2012). Black Carbon Emissions in China from 1949 to 2050. Environ. Sci. Technol. 46, 7595–7603. doi:10.1021/es3003684
Wang, X., Xu, C., Druffel, E. M., Xue, Y., and Qi, Y. (2016). Two Black Carbon Pools Transported by the Changjiang and Huanghe Rivers in China. Glob. Biogeochem. Cycles 30, 1778–1790. doi:10.1002/2016GB005509
Xu, C., Xue, Y., Qi, Y., and Wang, X. (2016). Quantities and Fluxes of Dissolved and Particulate Black Carbon in the Changjiang and Huanghe Rivers, China. Estuaries and Coasts 39, 1617–1625. doi:10.1007/s12237-016-0122-0
Xu, W., Wang, F., Li, J., Tian, L., Jiang, X., Yang, J., et al. (2017). Historical Variation in Black Carbon Deposition and Sources to Northern China Sediments. Chemosphere 172, 242–248. doi:10.1016/j.chemosphere.2016.12.155
Zhan, C., Han, Y., Cao, J., Wei, C., Zhang, J., and An, Z. (2013). Validation and Application of a thermal-optical Reflectance (TOR) Method for Measuring Black Carbon in Loess Sediments. Chemosphere 91, 1462–1470. doi:10.1016/j.chemosphere.2012.12.011
Zhang, Y.-L., Huang, R.-J., El Haddad, I., Ho, K.-F., Cao, J.-J., Han, Y., et al. (2015). Fossil vs. Non-fossil Sources of fine Carbonaceous Aerosols in Four Chinese Cities during the Extreme winter Haze Episode of 2013. Atmos. Chem. Phys. 15, 1299–1312. doi:10.5194/acp-15-1299-2015
Ziolkowski, L. A., Chamberlin, A. R., Greaves, J., and Druffel, E. R. M. (2011). Quantification of Black Carbon in marine Systems Using the Benzene Polycarboxylic Acid Method: a Mechanistic and Yield Study. Limnol. Oceanogr. Methods 9, 140. doi:10.4319/lom.2011.9.140
Keywords: carbon cycle, dissolved black carbon, particulate black carbon, coastal bays, riverine discharge, watershed hydrology, aromatic condensation
Citation: Fang Y, Huang G, Chen Y, Hu L, Lin J and Lin T (2021) Particulate and Dissolved Black Carbon in Bohai and Laizhou Bays, China: Distributions, Sources, and Contrasts Under Two Distinct Fluvial Hydrological Regimes. Front. Earth Sci. 9:697728. doi: 10.3389/feart.2021.697728
Received: 20 April 2021; Accepted: 09 August 2021;
Published: 20 August 2021.
Edited by:
David Jay Burdige, Old Dominion University, United StatesReviewed by:
Andrew Wozniak, University of Delaware, United StatesPatrick G. Hatcher, Old Dominion University, United States
Copyright © 2021 Fang, Huang, Chen, Hu, Lin and Lin. This is an open-access article distributed under the terms of the Creative Commons Attribution License (CC BY). The use, distribution or reproduction in other forums is permitted, provided the original author(s) and the copyright owner(s) are credited and that the original publication in this journal is cited, in accordance with accepted academic practice. No use, distribution or reproduction is permitted which does not comply with these terms.
*Correspondence: Yingjun Chen, eWpjaGVuZmRAZnVkYW4uZWR1LmNu
†These authors have contributed equally to this work