 Johanna Gille-Petzoldt1,2*
 Karsten Gohl1
 Gabriele Uenzelmann-Neben1
 Jens Grützner1
 Johann P. Klages1 and IODP Expedition 379 Scientists
- 1Alfred Wegener Institute Helmholtz-Centre for Polar and Marine Research, Division of Geosciences, Bremerhaven, Germany
- 2University of Bremen, Department of Geosciences, Bremen, Germany
Observations of rapid ongoing grounding line retreat, ice shelf thinning and accelerated ice flow from the West Antarctic Ice Sheet (WAIS) may forebode a possible collapse if global temperatures continue to increase. Understanding and reconstructing West Antarctic Ice Sheet dynamics in past warmer-than-present times will inform about its behavior as an analogue for future climate scenarios. International Ocean Discovery Program (IODP) Expedition 379 visited the Amundsen Sea sector of Antarctica to obtain geological records suitable for this purpose. During the expedition, cores from two drill sites at the Resolution Drift on the continental rise returned sediments whose deposition was possibly influenced by West Antarctic Ice Sheet dynamics from late Miocene to Holocene times. To examine the West Antarctic Ice Sheet dynamics, shipboard physical properties and sedimentological data are correlated with seismic data and extrapolated across the Resolution Drift via core-log-seismic integration. An interval with strongly variable physical properties, high diatom abundance and ice-rafted debris occurrence, correlating with partially high amplitude seismic reflection characteristics was identified between 4.2 and 3.2 Ma. Sedimentation during this interval is interpreted as having occurred during an extended warm period with a dynamic West Antarctic Ice Sheet in the Amundsen Sea sector. These records compare to those of other drill sites in the Ross Sea and the Bellingshausen Sea, and thus suggest an almost simultaneous occurrence of extended warm periods in all three locations.
Introduction
To be seen as reliable, simulations of Antarctica’s ice sheet response to present and future climate forcing require validation against climate and ice sheet states in the Earth’s past, particularly during times warmer than present. West Antarctica plays a key role in these simulations, as its ice sheet is largely based below sea level and therefore highly susceptible to collapse in response to the arrival of warm ocean waters around its edges (e.g., Oppenheimer 1998; Joughin and Alley 2011; DeConto and Pollard 2016; Rignot et al., 2019). A total West Antarctic Ice Sheet (WAIS) collapse would raise global sea level by 3.4–5 m (Fretwell et al., 2013; Joughin et al., 2012; Sun et al., 2020). Such scenarios have been numerically simulated (e.g., DeConto and Pollard 2016; Sutter et al., 2016; Lipscomb et al., 2021) but direct, unambiguous evidence for an impending collapse is still lacking. Similar to observations of present ice sheet retreat, modelling of past warm periods show that the WAIS retreated first and with enormous ice mass loss in the Amundsen Sea sector of West Antarctica before other sectors followed (Golledge et al., 2019). The International Ocean Discovery Program (IODP) Expedition 379 (Gohl et al., 2021a) provided a unique opportunity for the recovery of sediments that were influenced by the WAIS. Sites U1532 and U1533 have been drilled into a large sediment drift on the continental rise (Figure 1). The Resolution Drift is one of five such bodies found north of the Amundsen Sea Embayment (ASE) continental slope. The drift is characterized by its gently dipping western and steep eastern flanks, each neighboring a north-striking deep-sea channel (Gohl et al., 2021b). Similar drifts have been used to document ocean-bottom current activity not only in the Amundsen Sea sector but also further east off the Antarctic Peninsula (Nitsche et al., 2000; Lucchi et al., 2002; Hillenbrand et al., 2008; Uenzelmann-Neben and Gohl 2012). Sites U1532 and U1533 are expected to have recorded significant processes directly related to past WAIS dynamics in the form of sediment deposition after downslope transport via deep-sea channels, but also indirectly by bottom current-related transport and deposition. This study presents the first deep drill sites on the western Pacific margin revealing sedimentary processes only affected by the WAIS and not by other ice sheets. Therefore, this study aims to fill a major gap in information on solely WAIS influenced processes to achieve a better understanding of WAIS dynamics. Our analysis of drill records from both sites reveals WAIS-related characteristics from a Miocene to Pleistocene climate history of both cold and warm periods. We construct a seismostratigraphic model by constraining the ages of key seismic units and horizons to enable an extrapolation of the core-log-seismic integration. Furthermore, we compare our results to those of other drill records in order to highlight similarities and differences along the Pacific margin of Antarctica. We address the processes of sediment transport and deposition, especially with respect to diatom abundance and IRD, during warmer-than-present Pliocene periods that indicate extended periods of reduced WAIS extent.
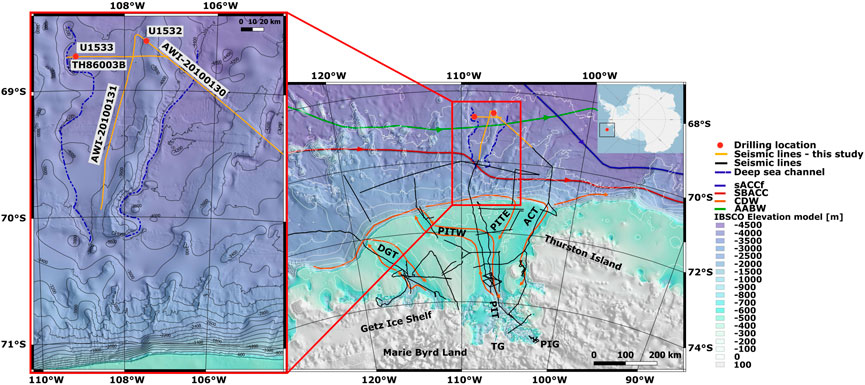
FIGURE 1. Bathymetric map (Arndt et al., 2013) from the Pacific sector of Antarctica (right) showing IODP Expedition 379 Sites U1532 and U1533 and the network of seismic lines (black) in the Amundsen Sea sector. Seismic lines used in this study are highlighted in orange and an enlarged view is provided in the left map. The blue dashed lines on both maps outline the paths of the deep-sea channels enclosing the drift. Schematic flow paths for Circumpolar Deep Water (CDW, orange arrows) (Assmann et al., 2013; Nakayama et al., 2013; Walker et al., 2013; Thompson et al., 2020), Antarctic Bottom Water (AABW, green arrow), southern Antarctic Circumpolar Current front (sACCf, purple arrow), southern boundary of the Antarctic Circumpolar Current (SBACC, red arrow) are plotted on the right map (Orsi et al., 1995; Orsi et al., 1999). The base map (right map in the upper right corner) was made available by Matsuoka et al. (2018). DGT = Dotson-Getz Trough; PITW = Pine Island Trough West; PIT = Pine Island Trough; PITE = Pine Island Trough East; TG = Thwaites Glacier; PIG = Pine Island Glacier; ACT = Abbot-Cosgrove Trough.
Geological and paleoclimatic background
The growth of an Antarctic ice sheet at the Eocene-Oligocene transition has been associated with the “earliest Oligocene oxygen isotope step” glaciation event at ∼34 Ma (Hutchinson et al., 2021). Following that time, the ice sheet periodically expanded and retreated until the Mid-Miocene Climatic Optimum (17–14.5 Ma), which was followed by continuously decreasing temperatures that led to an expanded Antarctic ice sheet, including the WAIS, by 14 Ma (McKay et al., 2016). Global temperatures decreased steadily until the next warm period, defined by Fedorov et al. (2013) as Pliocene Climatic Optimum (PCO), between 4.4 and 4.0 Ma. The PCO is described as a period with 4°C higher global mean and 2–5°C higher annual air and sea-surface temperature in Antarctica, compared to modern levels (Brierley and Fedorov 2010; Golledge et al., 2017). Despite these higher temperatures, evidence for reduced ice sheets is first known from 4.2 Ma, in the form of reduced sea ice cover in the Ross Sea, and 3.9 Ma off the Antarctic Peninsula and in Prydz Bay (Escutia et al., 2009; Golledge et al., 2017). A second Pliocene warm period from 3.2 to 3.0 Ma known as the mid-Pliocene or Mid-Piacenzian warm period (MPWP), had global mean temperatures 2–3°C higher than present (Pagani et al., 2009; Dumitru et al., 2019). During the MPWP, global sea level is reported to have peaked at 20–21 m above the modern level due to reduced ice sheet volume (Miller et al., 2012). The MPWP was followed by a cooling trend between 3 Ma and 2.5 Ma that accompanied an overall expansion of the Antarctic ice sheets (Naish et al., 2009). The coastal ice sheets interact with ocean water masses and current systems at the interface between ice and water at the bottom of ice shelves and at the ice sheets’ grounding zones. The onset of the eastward flowing Antarctic Circumpolar Current (ACC) was first possible with the opening of the Tasmanian Gateway at 35.5 Ma and the Drake Passage/Scotia Sea Gateway between 50 and 31 Ma (Lawver and Gahagan 2003; Livermore et al., 2005; Barker et al., 2007). The ACC is described by three oceanographic fronts: the Subantarctic Front, the Polar Front and the southern ACC front (sACCf) (Orsi et al., 1995). The sACCf and the southern boundary of the ACC extent to the continental rise of the ASE (Figure 1). The ACC entrains circumpolar Deep Water (CDW), which either obtains its nutrient-rich water mass (Upper CDW) from the Pacific and Indian Ocean or its nutrient-depleted, high salinity water mass (Lower CDW) from North Atlantic Deep Water (NADW) (Whitworth et al., 1998). On other continental margins of Antarctica, CDW mixes with very cold (< −1.7 C°) shelf waters of variable salinity, forming Antarctic Bottom Water (AABW) (Gordon 1971; Orsi et al., 1999) that moves in large cyclonic cells such as the Weddell and Ross gyres (Orsi et al., 1999). In the ASE, however, the ACC transports the relatively warm CDW onto the ASE shelf, where it locally reaches the edge of the WAIS via seafloor channels and troughs (Figure 1). This results in sub-ice-shelf melting and marine ice sheet instability (Whitworth et al., 1998; Pritchard et al., 2012). It has been hypothesized that these processes also occurred during the Late Eocene/Early Oligocene (Uenzelmann-Neben et al., 2022), the Pliocene under the influence of warmer-than-present NADW (1–2°C higher than recent) (Billups et al., 1998), and during Holocene retreat phases (Hillenbrand et al., 2017).
IODP Expedition 379 drill site records
IODP Site U1532
Site U1532 is located on seismic line AWI-20100130 (Supplementary Figure S1) (Gohl and Uenzelmann-Neben 2021a) in 3962 m water depth near the top of Resolution Drift with the deepest hole, Hole G, drilled to 794 m depth with 90% core recovery (Figure 2) (Gohl et al., 2021a; Wellner et al., 2021a). To correlate the drill holes, a splice was constructed from records of Holes A, B, C, D and G. Boreholes F and E were not considered because of unsuccessful coring (Wellner et al., 2021a). The cores of Site U1532 comprise mainly silty clay with varying biogenic proportions, some sand grains, granules, and pebbles (Figure 2). The pebbles are interpreted as ice rafted debris (IRD) and correlate mainly with zones of high bioturbation (Wellner et al., 2021a). The cores comprise single lithostratigraphic unit which is divided into three subunits denoted IA (0–92.6 mbsf, Pliocene to recent), IB (92.6–400.6 mbsf, Pliocene), and IC (401.0–787.4 mbsf, late Miocene to Pliocene) (Wellner et al., 2021a).
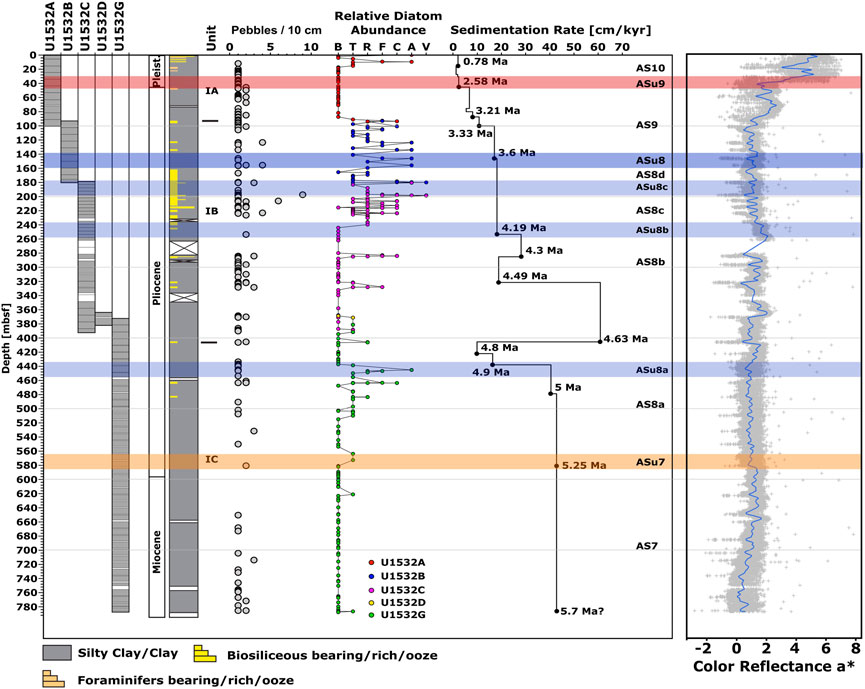
FIGURE 2. Overview of lithology, pebble count (IRD), diatom abundance and sedimentation rate observations, modified after Gohl et al. (2021b), with correlations to color reflectance a*. Colored bars indicate the division into seismic units AS7 to AS10 used for Site U1532. Reflections ASu7 to ASu9 describe the associated seismic unit boundary horizons. The data were derived from shipboard analysis during the IODP Expedition 379 (Gohl et al., 2021a; Wellner et al., 2021a). Diatom Abundance is categorized as follows: Barren (B) = 0%; Trace (T) = <2%; Rare (R) = 2–5%; Few (F) = 5–10%; Common (C) = 10–20%; Abundant (A) = 20–40%; Very Abundant (V) = 40–60% (Gohl et al., 2021a).
IODP Site U1533
Site U1533 is located in 4178.9 m water depth on the lower western flank of Resolution Drift, close to a north-striking deep-sea channel and 62 km away from U1532. The site is located on seismic line TH86003B (Supplementary Figure S2) (Yamaguchi et al., 1988) and can be connected to Site U1532 via intersections with lines AWI-20100130 (Gohl and Uenzelmann-Neben 2021a) and AWI-20100131 (Gohl and Uenzelmann-Neben 2021b) (Figure 1 and Supplementary Figure S3). The deepest hole, Hole B, reached 383 m drill depth (Wellner et al., 2021b). Site U1533 was drilled with an overall core recovery of 70% (Figure 3) (Wellner et al., 2021b). The splice of Site U1533 was constructed from Holes A, B, and D with the definition of a core composite depth scale (CCSF-A [m]) for better data presentation. The cored sediments are mainly silty clay with variable biogenic content, bioturbation (correlated to higher biogenic content) and a few occurrences of diamict and conglomerate (Wellner et al., 2021b). IRD appears almost throughout with higher concentrations correlated to diatom ooze layers (Wellner et al., 2021b). The cored material from Site U1533 was attributed to a single lithostratigraphic unit, subdivided into two subunits, IA (0–54.9 mbsf Pliocene - recent) and IB (54.9–381.2 mbsf Miocene—Pliocene) (Gohl et al., 2021a).
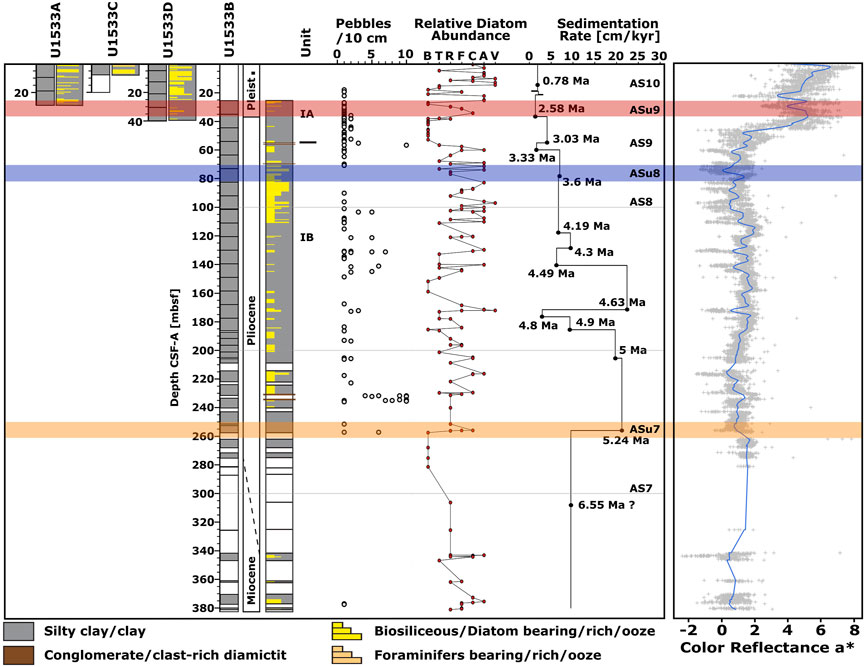
FIGURE 3. An overview of lithology, pebble count (IRD), diatom abundance and sedimentation rate observations at Site U1533, derived from shipboard data during IODP expedition 379 (Gohl et al., 2021a; Wellner et al., 2021b), with correlations to color reflectance a*. Colored bars indicate the division into seismic units AS7 to AS10. Reflections ASu7 to ASu9 describe the associated seismic unit boundary horizons. Diatom Abundance is categorized as follows: Barren (B) = 0%; Trace (T) = <2%; Rare (R) = 2–5%; Few (F) = 5–10%; Common (C) = 10–20%; Abundant (A) = 20–40%; Very Abundant (V) = 40–60% (Gohl et al., 2021a).
Methods
Premature termination of the expedition meant that no downhole logs were collected (Gohl et al., 2021a). Instead, on board measured physical property data were used to carry out a core-log-seismic integration for Sites U1532 and U1533. To tie core-log information to seismic profiles, gamma ray attenuation bulk density and P-wave velocity were used to calculate synthetic seismograms. Furthermore, we included data for color reflectance a*, green/gray color ratio, age constraints, sedimentation rate, diatom abundance, and lithological descriptions obtained by the IODP Expedition 379 shipboard scientific party (Gohl et al., 2021a).
Measurements
The following is a brief summary of the measurements and data relevant for this study. Detailed information can be found in Gohl et al. (2021a), Wellner et al. (2021a), Wellner et al. (2021b).
P-wave velocity was measured using the Whole-Round Multisensor Logger (WRMSL), with the P-wave logging tool and a sampling interval of 2 cm. The P-wave logger emits a P-wave pulse of 500 kHz, which travels through the core and is received with a precision of 50 ns. The P-wave logger was used for Advanced Piston Corer (APC) recovered cores. The APC is applied in soft sediments, which usually appear in the upper part of the sedimentary column. With increasing depth, density and compaction of the sediment increased, requiring a change of coring system to the Extended Core Barrel (XCB) or Rotary Core Barrel (RCB). Since XCB and RCB drilled cores were not always completely filled, they were measured using the Section Half Multisensor Logger (SHMSL) with the P-wave caliper, which determines the P-wave velocity vertically to the sectional plane of the core (x-caliper). The changes from WRMSL to SHMSL measurements occur at 260 mbsf at Site U1532 and 205 mbsf at Site U1533.
Gamma Ray Attenuation Bulk Density was measured with the Whole-Round Multisensor Logger with a sampling interval of ∼1 cm. The gamma-ray attenuation densitometer analyzes the bulk density by transmitting a gamma-ray beam through the core, which is attenuated by the material due to Compton scattering. The density can then be derived by using an average attenuation coefficient of the sediment (Gerland and Villinger 1995). This method was applied to the ACP, XCB and also RCB recovered core sections of Sites U1532 and U1533.
Color Reflectance a* was measured with the SHMSL and provided the colors redness (>0) and greenness (<0). In this study, the reported colors in reflectance a* were used to support the definition of intervals considered to represent warmer periods, as greenness in sediments is an indicator of higher biogenic content. Such intervals may be evidence of higher productivity during open ocean conditions (Wellner et al., 2021a).
Green/Gray color ratio was calculated after Gruetzner et al. (2003) to quantify the visible impression of color changes in the cores using spectral bands from 390 to 730 nm. We calculated the green average from 500 to 590 nm band and the gray average by all spectral bands. The achieved green/gray color ratio highlights the greenish units, with high peak values comparable to the lows of color reflectance a* (Figures 4, 5).
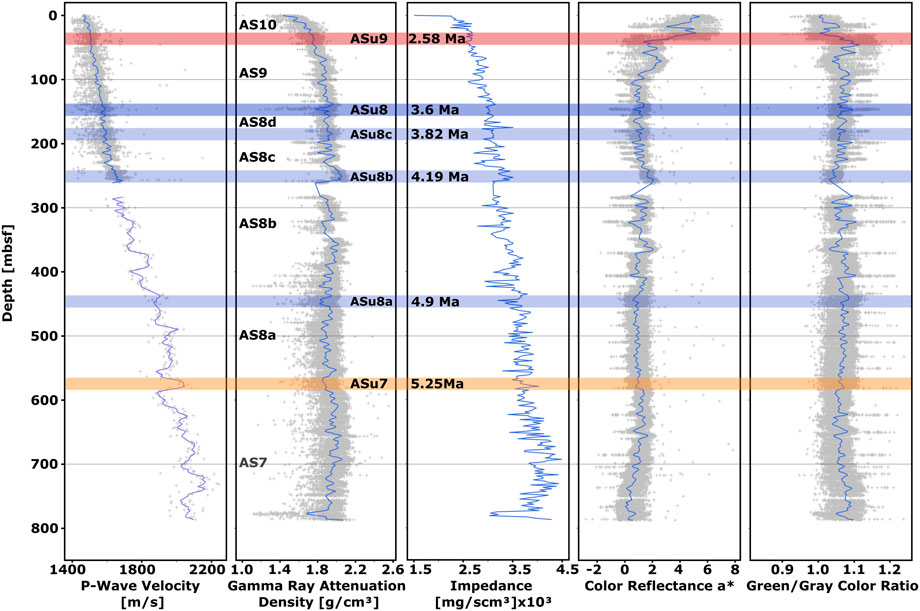
FIGURE 4. Physical properties measured at cores of IODP Expedition 379 Site U1532 (Gohl et al., 2021a; Wellner et al., 2021a). Colored bars divide the data into seismic units AS7 to AS10. ASu7 to ASu9 describe the reflections separating the seismic units. The complete edited data sets are visible in gray overlain by a smoothed curve calculated by locally weighted regression.
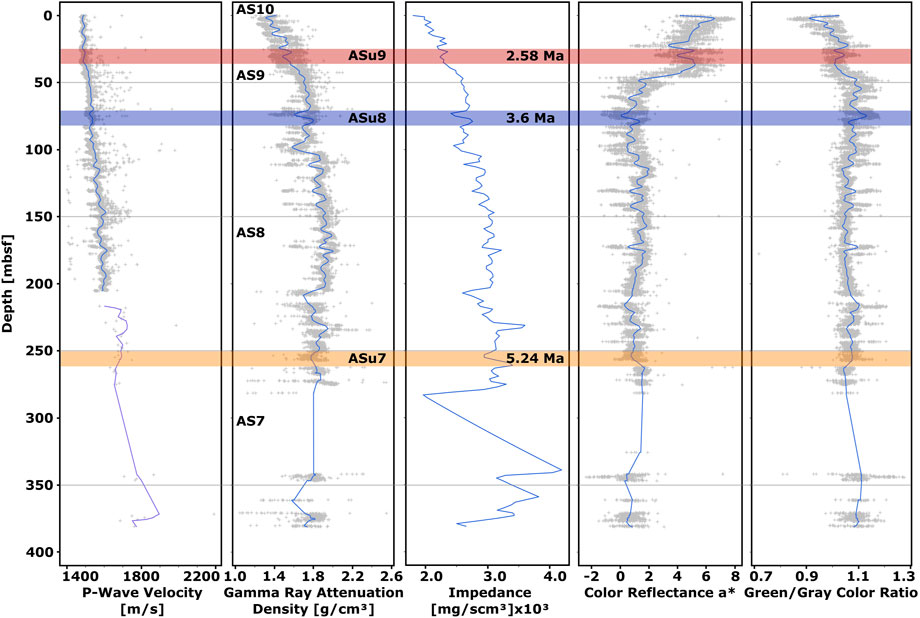
FIGURE 5. Physical properties measured at cores of IODP Expedition 379 of Site U1533 (Gohl et al., 2021a; Wellner et al., 2021b). Colored bars divide into seismic units AS7 to AS10. ASu7 to ASu9 describe the horizons separating the seismic units. The complete edited data sets are visible in gray overlain by a smoothed curve calculated by locally weighted regression.
Ages used in this study were taken from the shipboard age-depth models, which are based on biostratigraphy age datums in correlation with magnetostratigraphic polarity zones (Wellner et al., 2021b). For Site U1532, Holes A, B, C, D, and G were used to develop the age-depth model and, for Site U1533, Holes A and B. The biostratigraphic ages were derived from diatom and radiolarian datums at both sites, although Site U1532 showed some intervals where no microfossils were found. For those intervals, between 10 and 92 mbsf (meters below sea level) as well as between 509 and 787 mbsf depth, no biostratigraphic age control has been possible. Nevertheless, the polarity pattern at both intervals was clearly defined and could be used for age classification (Wellner et al., 2021a). Between the age control points, linear sedimentation rates were calculated for Site U1532 and Site U1533.
Diatom classification and abundance estimates were carried out via several methods. Smear slides were analyzed, and samples were sieved at 10–20 µm. In particular, sections with a low bulk density and greenish units were sampled (Wellner et al., 2021a; Wellner et al., 2021b).
Pebble (IRD) quantity was derived by counting pebbles appearing on the surface of the core section. Coarser grains between 4 mm and 6 cm long axis were counted and summed for intervals of 10 cm. If the number of pebbles ranged between 0 and 9, the exact count was entered, although if the number of pebbles was higher or equal to 10 the count was listed as 10.
Seismic data include profile AWI-20100130 which was collected during expedition ANT-XXVI/3 with RV Polarstern in 2010. Four GI-Guns were used to generate the seismic signal with frequencies up to 300 Hz, a streamer of 3000 m active length and 240 channels received the data (Uenzelmann-Neben and Gohl 2014). Processing of the data up to migration was carried out preserving true reflection amplitude, thus, neither deconvolution nor gain was applied (Uenzelmann-Neben and Gohl 2014). The stacked seismic profile TH86003B was acquired in the Antarctic summer 1986/1987 during expedition TH-86 with RV Hakurei-Maru, where two water guns generated the seismic signal and a 600 m, 24-channel streamer received the data (Yamaguchi et al., 1988). This seismic profile is one of seven lines and was made available via the Antarctic Seismic Data Library System (SDLS) of the Scientific Committee on Antarctic Research.
Editing physical properties
For detailed analysis of the physical property data, the raw data were edited to improve the quality. Therefore, we automatically excluded P-wave velocity values below 1400 m/s and above 4000 m/s, bulk density data below <1 g/cm3, and color reflectance a* of less than -3 and greater than +8. After sorting the data according to the splice, we checked the data for double values which, when discovered, were replaced by an average value. To further exclude outliers, P-wave velocity and gamma ray bulk density data were plotted against the visual core descriptions and compared to core-to-core transitions, drilling disturbance or small data gaps (Gruetzner et al., 2019). For the data sets of diatom abundance, pebble count, ages and sedimentation rate, no further editing was needed or possible. After splices were constructed, an additional core composite depth (CCSF-A [m]) was needed for Site U1533 due to overlapping depths of the holes. The CCSF-A depth scale follows the current IODP depth scale terminology IODP MI 2011 by expressing the depth below seafloor as a fitted construct combining all cores to one depth to overcome irregularities in depth and close data gaps due to poor core recovery. The main data sets of Site U1533 were already provided with the additional CCSF-A depth scale from Wellner et al. (2021b). Following the editing process, we displayed the data (Figures 4, 5) with an added locally weighted regression curve, calculated at 10 m intervals for all data sets except the P-wave velocity x-caliper data (20 m). These intervals were chosen to account for the vertical resolution of the seismic data (29–37 m) and for larger changes in physical property values.
Synthetic seismograms
Synthetic seismograms were generated to enable tying the core-log data of sites U1532 and U1533 to the seismic profiles. P-wave velocity and gamma ray attenuation density are the necessary data sets to calculate synthetic seismograms. We calculated the acoustic impedance from the P-wave velocity and gamma ray attenuation density shipboard data in the seismic data analysis software ParadigmTM and applied a “Ricker” wavelet to generate the synthetic seismogram. After calculating the synthetic seismogram, a calibration for best fit to the seismic data was executed. The required main frequencies for the calibration were derived from the seismic profiles at Sites U1532 and U1533 by analyzing their normalized amplitude spectra. Hence, we calibrated the records of Site U1532 by applying a wavelet of 250 ms length and 38 Hz main frequency. For Site U1533, we changed the main frequency to 30 Hz, but retained a wavelet of 250 ms length. Each main frequency represents the mean frequency of the associated seismic trace at the borehole location to achieve the best fit between synthetic and seismic data. For both sites, the time-depth conversion was derived using the P-wave velocities measured at the core. We compared the P-wave velocity trend measured at Site U1532 to the seismic interval velocity at common depth point (CDP) 10300 of profile AWI-20100130 (closest velocity analysis to Site U1532 (Figure 6)). The two functions share a similar increase of velocity with increasing depth (Figure 7). For Site U1533 no seismic velocity information is available from the SDLS database. However, the good correlation between the synthetic seismogram and the seismic line TH86003B at Site U1533 suggests a realistic time-depth conversion was achieved (Figure 8).
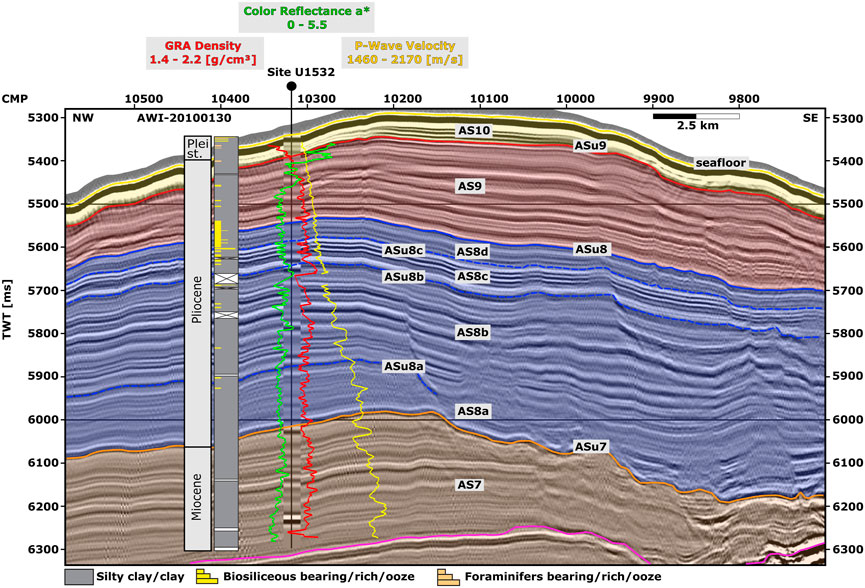
FIGURE 6. Seismic profile AWI-20100130 (Gohl and Uenzelmann-Neben 2021a) near Expedition 379 Site U1532. The seismostratigraphic model divided in seismic units AS7 to AS10 with the associated unit boundary horizons reflections ASu7 to ASu9 (colored solid lines) is shown. Seismic unit AS8 is subdivided into subunits AS8a to AS8d separated by marker horizons (dashed blue line). The synthetic seismogram is plotted at the location of Site U1532. CMP = Common mid-point, TWT [ms] = Two Way Time.
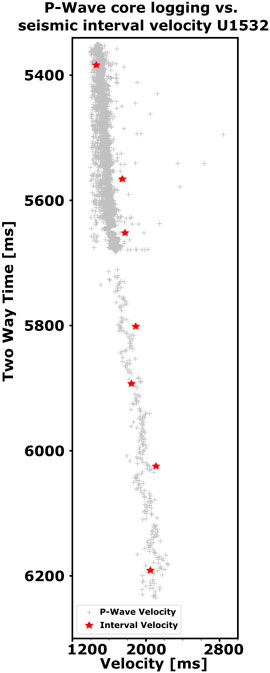
FIGURE 7. Comparison of the shipboard P-wave velocity data measured at cores of Site U1532 (grey crosses) and interval velocity derived from velocity analysis at CDP 10300 of seismic profile AWI-20100130 (red stars) (Uenzelmann-Neben and Gohl 2014; Gohl et al., 2021a; Wellner et al., 2021a).
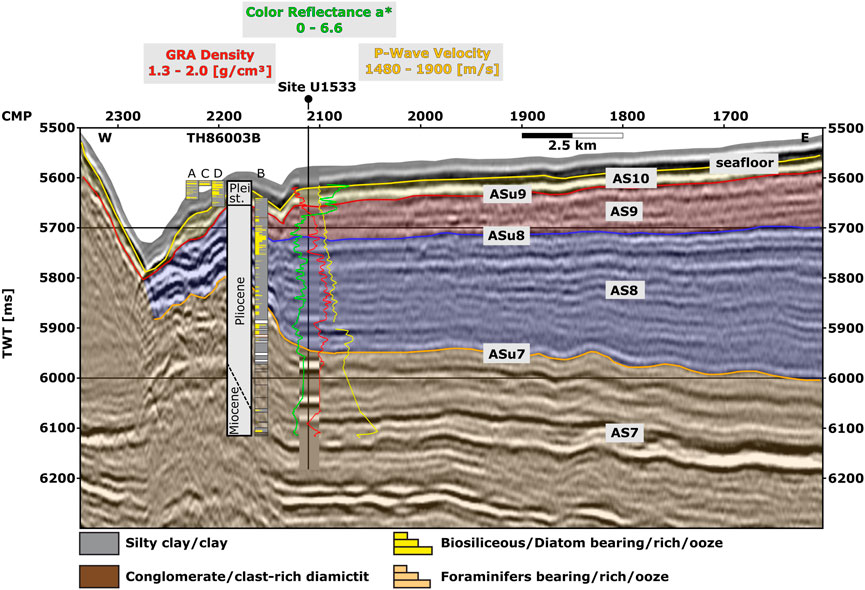
FIGURE 8. Seismic profile TH86003B (Yamaguchi et al., 1988) near Expedition 379 Site U1533 including the seismostratigraphic model, divided into seismic units AS7 to AS10 that are separated by unit boundary horizons reflections ASu7 to ASu9 (solid lines). CMP = Common mid-point, TWT [ms] = Two Way Time.
Seismostratigraphic model and correlation with physical properties
The regional stratigraphic model of the Amundsen Sea follows the nomenclature of Lindeque et al. (2016), which has been revised by Lamb et al. [personal communication]. Seismic units are named as AS-xx and the seismic horizons separating them (often unconformities) called ASu-xx. Furthermore, we compared the newly created seismostratigraphic model in this paper to the model by Uenzelmann-Neben and Gohl (2014) with its seismic units named ASR-I to ASR-IV. In the following, we describe the main seismic characteristics in the proximity of both sites in conjunction with physical property variations, IRD occurrence and diatom abundance. The correlation between the seismic data and the sedimentological information was carried out via the calculated synthetic seismogram. In this way, ages can be assigned and the origin of reflections can be inferred.
Seismic line AWI-20100130—Site U1532
Drilling at Site U1532 retrieved sediments from seismic units AS7 to AS10 (Figure 6, CMP 10600–9700), which are described in the following (Supplementary Table S1).
Seismic unit AS7
Seismic unit AS7 is the deepest unit sampled at Site U1532 at the Resolution Drift (Figure 6). Within unit AS7, gamma ray attenuation density stays at a constant average value, P-wave velocity and green/gray color ratio decrease, and color reflectance a* increases from bottom to top (Figure 4). Diatom abundance is almost zero throughout unit AS7. IRD appears in the lower part of the unit. The calculated average sedimentation rate is 9.5 cm/kyr (Figure 2). The minor changes in physical properties and sedimentological characteristics are expressed in the seismic data by parallel reflections of low to moderate amplitudes (Figure 9). Stronger changes in physical properties and sedimentological patterns match high amplitude reflections in the seismic data, as apparent at seismic reflection ASu7 (560–580 mbsf, 6010–6030 ms TWT) (Figures 6, 10). Decreasing density and color reflectance a* and increasing P-wave velocity values correlate with increasing diatom abundance and IRD and are expressed by a high amplitude reflection with positive polarity, ASu7 (Figures 2, 6). Also, the top reflection of unit AS7, reflection ASu7 was identified as the Miocene–Pliocene boundary (5.25 Ma), and therefore seismic unit AS7 represents the Miocene >5.25 Ma (Figure 9). Seismic reflection ASu7 revises the published boundary between seismic unit ASR-IV (4–0 Ma) and ASR-III (14.1–4 Ma), which was interpreted to represent 4 Ma in Uenzelmann-Neben and Gohl (2014) at the Resolution Drift.
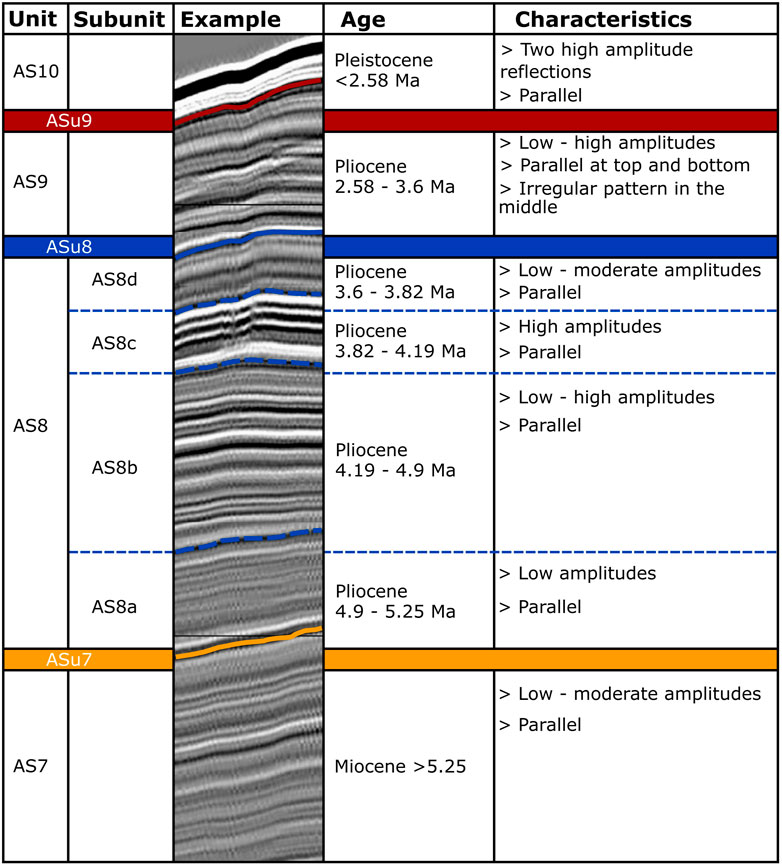
FIGURE 9. Summary of seismic characteristics and age assignments at the location of Site U1532.
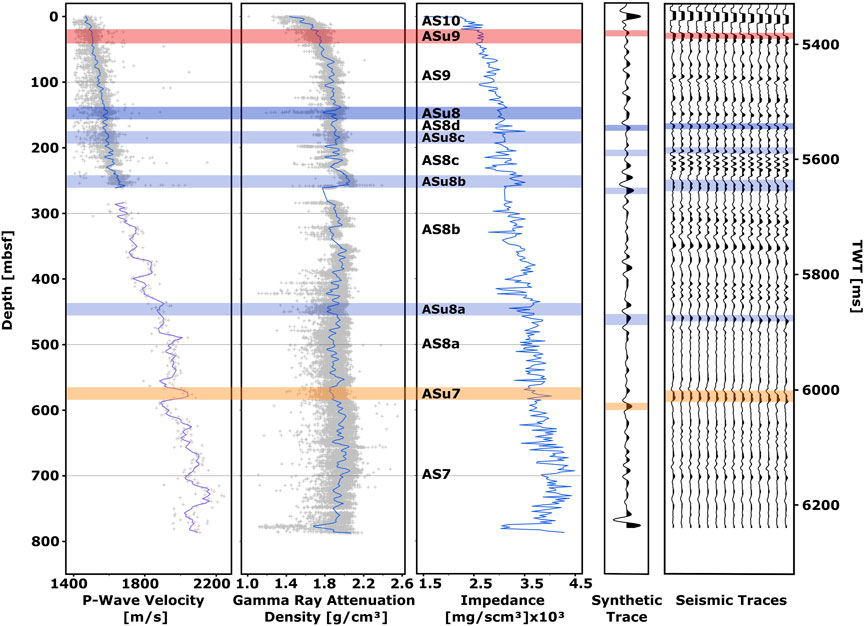
FIGURE 10. P-wave velocity, gamma ray attenuation density, impedance and synthetic seismogram next to the measured seismic data at the location of Site U1532.
Seismic unit AS8
Seismic unit AS8 at Site U1532 represents the thickest seismic unit sampled. Due to varying reflection characteristics, unit AS8 is divided into subunits AS8a to AS8d.
Subunit AS8a is the lowermost subunit of unit AS8 and is located on top of seismic unit AS7. It represents the oldest Pliocene subunit with an age between 5.25 and 4.9 Ma (Figure 9). Within subunit AS8a, gamma ray attenuation density, color reflectance a* and green/gray color ratio stay constant at average values, and P-wave velocity decreases from bottom to top. We observe no distinct changes in sedimentological characteristics except for an increase of diatom abundance towards the top of subunit AS8a (Figure 2). The seismic data image these minor changes of properties as parallel reflections with low amplitudes (Figure 9). Across reflection ASu8a (440–460 mbsf, 5890–5910 ms TWT), gamma ray attenuation density, P-wave velocity and color reflectance a* decrease, and green/gray color ratio increases. Furthermore, a positive peak value of diatom abundance and a strong decrease of sedimentation rate are reported (Figures 2, 4). These distinct changes are expressed by a high amplitude reflection (ASu8a, 4.9 Ma) with positive polarity marking the transition to subunit AS8b (Figure 10).
Subunit AS8b is assigned an age between 4.9 and 4.19 Ma (Pliocene) (Figure 9). Gamma ray attenuation density and color reflectance a* show a minor increase, and P-wave velocity and green/gray color ratio decrease from bottom to top. A stronger increase of all physical properties at 258 mbsf (5681 ms TWT) is correlated to the change of coring technique from APC to XCB/RCB and P-wave logger to P-wave caliper measured velocity (Figure 4). Within subunit AS8b, low values of physical properties correlate with high diatom abundance, IRD, biosiliceous bearing sediments and strongly changing sedimentation rates (Figure 2). Those changes match with parallel high amplitude reflections, whereas intervals of small changes in properties are expressed by low to moderate amplitude reflections (Figures 9, 10). Across reflection ASu8b (240–260 mbsf, 5660–5680 ms TWT), we observe increasing P-wave velocity, gamma ray attenuation density and color reflectance a*, and decreasing green/gray color ratios (Figure 4). Furthermore, sedimentation rate, biosiliceous bearing sediments, and IRD decrease, and no diatoms are reported (Figure 2). These characteristics correlate with a high amplitude reflection of positive polarity which we assigned as reflection ASu8b (4.19 Ma) (Figure 6).
Subunit AS8c has an assigned age between 4.19 and 3.82 Ma (Figure 9). Physical properties show strong fluctuations between lows and highs (Figure 4). Lows of gamma ray attenuation density and color reflectance a* correlate with high diatom abundance, IRD and high amounts of biosiliceous bearing sediment (Figure 2). These strong fluctuations are expressed in the seismic data throughout seismic subunit AS8c as parallel high amplitude reflections (Figures 6, 9). Across reflection ASu8c (180–200 mbsf, 5580–5610 ms TWT), P-wave velocity, gamma ray attenuation density and green/gray color ratio show increasing values and color reflectance a* low values (Figure 4). These correlate with high diatom and IRD abundances at the depth of the high amplitude reflection ASu8c (3.82 Ma) (Figure 2).
The youngest subunit AS8d shows less intense changes of physical properties than subunit AS8c. Physical properties stay constant at an average value from bottom to top and diatom abundance and IRD decrease almost to zero (Figures 2, 4). These minor changes are imaged in seismic data as parallel reflections with low amplitudes (Figure 9). Seismic subunit AS8d is bound at the top by marker horizon reflection ASu8 at 146 mbsf (5542 ms TWT). Reflection ASu8 shows low gamma ray attenuation density and color reflectance a*, and high green/gray color ratio and P-wave velocities (Figure 4). This observed shift in all physical properties correlates with high diatom and IRD abundances (Figure 2). These distinct characteristics match with a high amplitude reflection of positive polarity which we categorize as the marker horizon reflection ASu8 with an assigned age of 3.6 Ma (mid-Pliocene), placing subunit AS8d between 3.82 and 3.6 Ma (Figures 9, 10).
Seismic unit AS9
Unit AS9 represents the youngest Pliocene between 3.6 and 2.58 Ma (Figure 6). Within unit AS9, gamma ray attenuation density and P-wave velocity decrease and color reflectance a* increases above 100 mbsf (5480 ms TWT), while below this depth the properties stay constant at an average value with no visible trend (Figure 4). Furthermore, diatom abundance and IRD are high below 100 mbsf, but decline immediately above and maintain low values up the top of unit AS9 (Figure 2). The distinct characteristics below 100 mbsf (5480 ms TWT) are expressed in the seismic data by parallel, low to high amplitude reflections and above 100 mbsf by parallel to divergent, low to moderate amplitude reflections (Figures 6, 10). Seismic unit AS9 is separated from seismic unit AS10 by reflection ASu9, which represents the Pliocene/Pleistocene transition with an assigned age of 2.58 Ma (Figure 2). Across reflection ASu9 (30–50 mbsf, 5390–5420 ms TWT) P-wave velocity, gamma ray attenuation density and green/gray color ratio decrease, color reflectance a* values increase, and low IRD and diatom abundance are reported, with an assigned age of 2.58 Ma (Figures 2, 6).
Seismic unit AS10
Seismic unit AS10 represents the uppermost seismic unit of the Resolution Drift. Physical properties continue the trend of seismic unit AS9 with P-wave velocity, gamma ray attenuation density and green/gray color ratio decreasing and color reflectance a* increasing (Figure 4). Within unit AS10, IRD appears throughout and diatom abundance increases towards the top (Figure 2). The distinct trend of properties in the top 25 m (5350–5380 ms TWT) is expressed by one high amplitude reflection due to the resolution of the seismic data (Figure 10). We assign an age of 0.78 Ma at 15 mbsf, and therefore unit AS10 represents the lower to mid-Pleistocene (Figure 9).
Seismic line TH86003B–Site U1533
Site U1533 was drilled at profile TH86003B, recovering sediments divided into seismic units AS7 to AS10 between CMP 2300 and 1600 (Figure 8 and Supplementary Table S2).
Seismic unit AS7
Seismic unit AS7 represents the lowermost unit drilled at Site U1533. A reliable interpretation of the lower part of seismic unit AS7 is not possible due to large data gaps (low recovery) below 273 mbsf (5966 ms TWT). Above 273 mbsf, P-wave velocity, gamma ray attenuation density and green/gray color ratio decrease and color reflectance a* increases, whilst diatoms and IRD are absent (Figures 3, 5). Increasing P-wave velocity and green/gray color ratio and decreasing gamma ray attenuation density and color reflectance a* values are reported across the high amplitude reflection ASu7 (250–260 mbsf, 5940–5950 ms TWT) correlating with high diatom abundance, IRD, and increased sedimentation rate (Figures 3, 5, 11). Reflection ASu7 represents the Miocene–Pliocene boundary with an age of 5.24 Ma (Figures 11, 12) (Wellner et al., 2021b).
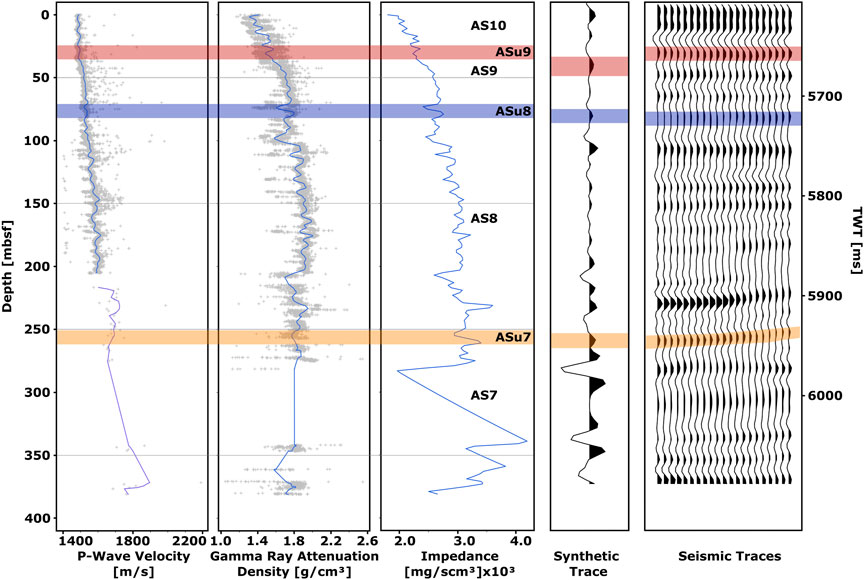
FIGURE 11. P-wave velocity, gamma ray attenuation density, impedance and synthetic seismogram next to the measured seismic data at the location of Site U1533.
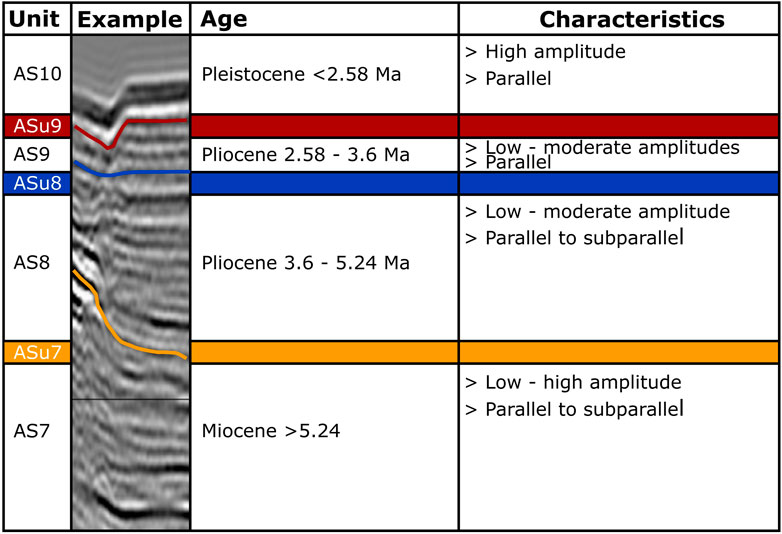
FIGURE 12. Summary of seismic characteristics and age assignments at the location of Site U1533.
Seismic unit AS8
Unit AS8 is the thickest unit at Site U1533. Because the ∼37 m vertical resolution (at dominant frequency of 30 Hz) of seismic profile TH86003B is slightly lower than ∼29 m resolution (at dominant frequency of 38 Hz) of seismic profile AWI-20100130, we cannot identify the subunits with confidence (Supplementary Figure S4). A stronger increase of gamma ray attenuation density and color reflectance a* at 205 mbsf (5880 ms TWT) are caused by the change from APC to XCB/RCB cores, for which P-wave velocity is measured by the P-wave caliper on core halves instead of by P-wave logger on whole cores (Figure 5) (Wellner et al., 2021b). Within unit AS8, P-wave velocity decreases from bottom to top, and gamma ray attenuation density, color reflectance a* and green/gray color ratio stay at constant average values throughout unit AS8. Localized spikes in physical property values intensify towards the top, with occasional low values below 114 mbsf (5769 ms TWT) and frequently occurring lows between 82 and 114 mbsf (5728 and 5769 ms TWT) (Figure 8). Diatom abundances fluctuate strongly throughout seismic unit AS8, and are consistently high between 74 and 110 mbsf (5717 and 5764 ms TWT) at 40–60% (Figure 3). IRD exhibits high accumulation rates at 230 mbsf (5910 ms TWT) and between 100 and 140 mbsf (5750 and 5800 ms TWT). The sedimentation rate shows strong variations below 118 mbsf (5774 ms TWT) but a constant rate between 118 mbsf and the top of seismic unit AS8 (Figure 3). Stronger changes in physical properties and sedimentological information, observed between 82 and 118 mbsf (5730 and 5770 ms TWT), correlate with biosiliceous bearing sediments and are expressed in the seismic data by moderate amplitude reflections that contrast with low amplitude reflections below 118 mbsf (5774 ms TWT) (Figures 8, 11). Seismic unit AS8 is bound at the top by reflection ASu8, to which we have assigned an age of 3.6 Ma (mid-Pliocene) (Figure 12) (Wellner et al., 2021b). Across reflection ASu8, we observe decreasing physical property values, high diatom abundance, and no IRD (Figures 3, 8, 12). These changes correlate with a low amplitude reflection that strengthens to the east and is assigned as reflection ASu8.
Seismic unit AS9
Seismic unit AS9 represents the Pliocene between 3.6 and 2.58 Ma. P-wave velocity and gamma ray attenuation density decrease and color reflectance a* increases from bottom to top (Figure 5). The interval of strongly changing physical properties observed in the upper part of seismic unit AS8 continues above the bottom of seismic unit AS9 and up to 60 mbsf (5698 ms TWT) (Figure 8). Within this interval, steady diatom abundance, IRD, biosiliceous content and sedimentation rate are reported (Figure 3). At ∼60 mbsf (5700 ms TWT) the sedimentation rate decreases, and diatoms disappear and remain absent all the way to the top of unit AS9. The interval from the bottom of unit AS9 to 60 mbsf (5698 ms TWT) correlates with moderate amplitude reflections, in contrast to the low reflection amplitudes above 60 mbsf (Figures 8, 11). Across reflection ASu9 (30–40 mbsf, 5660–5670 ms TWT), we observed increased gamma ray attenuation density, P-wave velocity and color reflectance a* values correlating with high diatom abundance, decreasing sedimentation rate and green/gray color ratio, and low IRD (Figures 3, 5). The change of properties is expressed by a moderate amplitude reflection with positive polarity that strengthens to the east (Figures 8, 11), identified as reflection ASu9 and representing the Pliocene–Pleistocene boundary, with an age of 2.58 Ma.
Seismic unit AS10
Seismic unit AS10 is the top unit at Site U1533 and represents the Pleistocene from 2.58 Ma to at least 0.78 Ma (Figure 12). Throughout unit AS10, the P-wave velocity stays at a consistent average value, gamma ray attenuation density and green/gray color ratio decrease, and color reflectance a* increases from bottom to top (Figure 5). Diatom abundance fluctuates between zero and 60%, IRD falls to zero, and a minor decrease in sedimentation rate is visible (Figure 3). The observed changes are expressed by one strong amplitude reflection for the whole of unit AS10 due to the low resolution of the seismic data.
Discussion
Our analysis of the physical properties, sedimentological information and seismic data support the following reconstruction of the history of the WAIS from late Miocene to Pleistocene times.
Late Miocene to early Pliocene (>5.25 to 4.19 Ma)
The physical properties and sedimentological information from seismic unit AS7 and subunits AS8a and AS8b suggest a period of relatively stable climatic conditions continued from >5.25 to 4.19 Ma. Increasing color reflectance a* values point to the dominance of terrigenous input (e.g., silty clay) during this period. This high terrigenous input, in combination with high sedimentation rates, indicates a strong component of downslope transport via the deep-sea channels on the Resolution Drift, which can be related to increased sediment input from the continental shelf during ice sheet advances (Figures 2, 3). The record of low diatom abundance is an indicator of low biological productivity under conditions of increased ice coverage and low IRD indicates low rates of calving from glaciers in the ASE. Hence, we interpret this interval as a cold period with intense turbidite activity, low biological productivity and decreased ice rafting (Figure 13). Similar patterns of low IRD and reduced diatom abundance during cold periods have also been reported by Hillenbrand et al. (2002), Hillenbrand et al. (2009), Konfirst et al. (2012). Interspersed through this interpreted cold period, we identify intervals with higher diatom abundance and IRD, correlating with low color reflectance a* values (Figure 2), which indicates increased biogenic input. These combined observations suggest intervals of warmer climatic conditions that may represent potential interglacials within this overall cold period. The frequency of those intervals, as seen most distinctly at Site U1532, increases from >5.25 to 4.19 Ma, suggesting progressively more vigorous ice sheet fluctuations within this cold period. The trend towards WAIS minimum and maximum extent with recurring downslope transport is also visible in the IRD and diatom deposition rate at Site U1533 (Figure 3). As Site U1533 is located near a deep-sea channel, the deposition of IRD and diatoms is likely to have been high due to overspill deposition during downslope transport since the Miocene-Pliocene boundary (Figure 3). Gohl et al. (2021b) reported that downslope transport might have started before the Miocene-Pliocene transition. This possibility cannot be interpreted with confidence at Site U1533 due to the large data gaps in the lower core. At Sites U1532 and U1533, we observed a distinct increase of sedimentation rate between 4.63 and 4.49 Ma, which correlates with lower diatom abundance and low IRD (Figures 2, 3). Similar to Hepp et al. (2006), who show high sedimentation rates during an ice sheet maximum off the Antarctic Peninsula, we suggest this might indicate an ice sheet advance with enhanced sediment transport over the continental shelf edge and downslope transport via the deep-sea channels (Figure 13). Sediment transported downslope is redeposited by bottom currents, leading to the asymmetry of the Resolution Drift, with its steeper eastern flank (Figures 1, 6). Asymmetry like this, formed under the mixed influence of downslope transport and bottom current activity, is characteristic of levee drifts (e.g., Faugeres et al., 1999; Rebesco and Stow 2001; Stow et al., 2002). The Resolution Drift is classified as such a levee drift due to the combination of turbidite and contourite deposits and because of its geometry of gently rising reflections towards the SE, followed by a steeper slope at CMP 10100 on seismic profile AWI-20100130 (Figure 6). Our conclusion of its formation in the Miocene, and the onset of related deep-sea channel activity, support the conclusions of Uenzelmann-Neben and Gohl (2012) of drift and channel activity since the Miocene. Following Stow et al. (2002) we interpret variable current speeds from the changes between parallel to sub-parallel reflections of moderate amplitudes in fine grained sediment and high amplitude reflections in coarser sediments along seismic profile AWI-20100130. A similar interpretation is not possible with profile TH86003B owing to its lower vertical resolution. Our analysis of the physical properties, sedimentological results and seismic data shows that late Miocene and early Pliocene (>5.25 to 4.19 Ma) sediments were deposited during a cold period showing ice sheet fluctuations in the early Pliocene with varying bottom current activity in the Amundsen Sea sector (Figure 13). Bottom current activity under colder climatic conditions during the late Miocene and early Pliocene, as described in this study, was also reported by Uenzelmann-Neben and Gohl (2012) and Uenzelmann-Neben and Gohl (2014). These interpretations of a cold period can be associated with intense continental shelf growth of the ASE after the beginning of the Pliocene, as reported by Gohl et al. (2021b). The observation of a strong progradational shelf growth is evidence that the grounding line reached the shelf edge frequently. During such periods, the grounded ice pushed sediment over the shelf edge to be re-deposited on the continental slope and rise. This mechanism can explain our observation of high sedimentation rates. Furthermore, reports from ODP Leg 178 Site 1095 at Sediment Drift seven of the Antarctic Peninsula (Gruetzner et al., 2005) describe an increased terrigenous input between 5.2 and 4.8 Ma which is interpreted to represent colder climatic conditions.
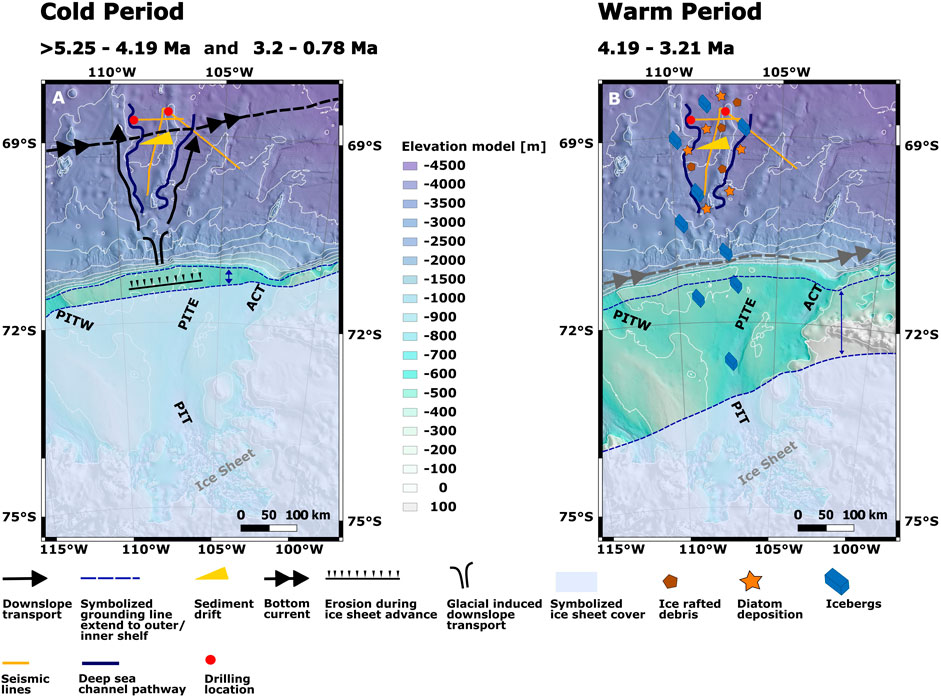
FIGURE 13. Conceptual model for the inferred cold (A) and warm period (B) in the Amundsen Sea sector with the major processes during those times. The IBSCO bathymetric map was made available by Arndt et al. (2013); PIT = Pine Island Trough, PITE = Pine Island Trough East, PITW = Pine Island Trough West, ACT = Abbot-Cosgrove Trough.
Early Pliocene to mid Pliocene (4.19–3.21 Ma)
Within the time interval between 4.19 and 3.21 Ma, we identify low color reflectance a* values which correlate with high diatom abundance and IRD (Figure 2). This pattern implies high biological productivity during open ocean conditions and increased ice rafting due to frequent calving of the ice shelf. Furthermore, a steady sedimentation rate indicates periods of stable hemipelagic sedimentation. Thus, we interpret the interval between 4.19 and 3.21 Ma as an extended warm period with open ocean conditions, frequent calving of the ice shelf and minimal downslope transport of shelf sediments (Figure 13). A distinct seismic signal with high amplitude reflections can be observed in seismic subunit AS8c (4.19–3.81 Ma). This subunit correlates with the onset of intense fluctuations of high diatom abundance, IRD counts, and low color reflectance a* values, which we interpret as the start of the warm period (Figures 2, 6). Due to its distinctly lower diatom abundance and IRD count, subunit AS8d is interpreted to represent a longer glacial event within this warm period, between 3.82 and 3.6 Ma. Reflection ASu8, assigned as a mid-Pliocene marker horizon (3.6 Ma) at the top of subunit AS8d, is interpreted to represent a distinct interglacial following the glacial event recorded by subunit AS8d. Both sites see diatom abundance decrease to zero at 3.2 Ma, and at Site U1532, IRD reduces to a minimum. Site U1533, in contrast, sees abundant IRD, which we regard as potentially re-deposited material related to increased downslope transport after an ice sheet advance to the continental shelf edge. The decrease of diatom abundance and assumed intensification of downslope transport indicate the end of the 4.19–3.21 Ma warm period. Our interpreted period of warmth correlates with a warm period reported for 3.7–3.5 Ma at Drift 7, Antarctic Peninsula, using cored materials from ODP Leg 178 Sites 1095 and 1096 (Escutia et al., 2009). As in our data, these sites showed high diatom abundance and IRD and decreased color reflectance a* values during the interpreted warm period (Escutia et al., 2009). High diatom abundance was observed for 4.5 to 3.2 Ma, matching the warm period of this study (Wolf-Welling et al., 2001). The warm period at the Antarctic Peninsula is interpreted to have seen the development of open ocean conditions offshore of a reduced ice sheet that was still vigorous enough to generate plentiful IRD by calving (Hepp et al., 2006). Further to the west, Naish et al. (2008) also report open ocean conditions for the Ross Sea at 4.2 to 4.1 Ma. Preserved Pliocene grounding zone wedges buried by hemipelagic sediment deposits are observed on the Amundsen Sea continental shelf by Gohl et al. (2021b), indicating extended periods without the erosive force of advancing grounded ice. Uenzelmann-Neben and Gohl (2012) report a southward shift of bottom currents in the Amundsen Sea sector during the Pliocene that would have accompanied this non-erosive phase, implying a retreated ice sheet over long time periods and supporting the persistent WAIS minimum and warm period interpreted here. The warm period (4.19–3.21 Ma) reconstructed from sediment retrieved at Sites U1532 and U1533 in the Amundsen Sea sector overlaps slightly with the MPWP (3.3–3.0 Ma; Pagani et al., 2009), a period of global Pliocene warmth 2–3°C warmer than present, and more strongly with a 4.39–3.27 Ma period of sea-level high stand (Dumitru et al., 2019).
Mid Pliocene to mid Pleistocene (3.21 to <0.78 Ma)
Following the warm period, an increase in color reflectance a* indicates increasing input of terrigenous sediment and lower biogenic content, consistent with low diatom abundance at both sites indicating decreased biological productivity (Figures 2, 3). Increased deposition of diatoms at Site U1533 and sedimentation rates increasing from 0.5 to 3.1 cm/kyr further indicate increased downslope transport, with sediments spilling over the continental shelf edge during a period of grounded ice sheet advance. More intense deposition of turbiditic sediment began at the Pliocene to Pleistocene boundary (2.58 Ma) where diatom abundance increased at Site U1533 and color reflectance a* increased at both sites. We interpret these observations as signals of high terrigenous sediment input, indicating a transition to colder climatic conditions together with an advancing ice sheet from 3.2 Ma to at least 0.78 Ma. These changes resulted in increased turbidity current activity and low oceanic biological productivity (Figure 13). The cold period is expressed in the seismic data by parallel low to moderate amplitude reflections in seismic units AS9 and AS10, which can be interpreted after Stow et al. (2002) to result from an increase in bottom current activity. Colder climatic conditions are also reported for the Ross Sea since 3.2 Ma (McKay et al., 2012) and the Antarctic Peninsula since 3.1 Ma (Hillenbrand and Ehrmann 2005). At ODP Leg 178 Sites 1096 and 1095 (Antarctic Peninsula) Hillenbrand and Ehrmann (2005) similarly report a decrease in biological productivity at this time, indicating increased ice coverage, and a primarily turbiditic deposition pattern.
Conclusion
By analyzing physical properties, sedimentological and paleontological results and seismic data in the Amundsen Sea sector on the continental rise at the Resolution Drift, we were able to reconstruct stages of WAIS dynamics from the Miocene to the Pleistocene. We applied core-log-seismic integration to extrapolate and correlate the results with the seismic data to better understand the lateral extent of processes across the region. The records of Sites U1532 and U1533 cover a period between >5.24 and <0.78 Ma including the globally warmer than present Pliocene. Analyses of gamma ray attenuation density, P-wave velocity, color reflectance a*, diatom abundance, IRD and sedimentation rate allow us to interpret a clear pattern of WAIS dynamics through time. During the Miocene to early Pliocene (>5.24–4.19), the drill records reveal a cold period characterized by intense bottom current activity and downslope transport, during which the WAIS appears to have fluctuated in size. Between 4.19 and 3.21 Ma, a warm period with recurrent WAIS minimum extent is interpreted from records of Sites U1532 and U1533. The beginning of the warm period correlates with high amplitude reflections expressing intense WAIS dynamics at Site U1532. During this time, downslope transport was reduced in response to weakening of the smaller ice sheet’s erosive capacity. This warm period preceded the global Mid-Piacenzian Warm Period (3.3–3.0 Ma, Pagani et al., 2009) by 0.89 Myr and coincides with a global sea level high stand (4.39–3.27 Ma) (Dumitru et al., 2019). At 3.2 Ma, the warm period transitioned to a cold period that lasted until at least 0.78 Ma. Increased downslope transport is observed at Site U1533 since the Pliocene to Pleistocene transition at 2.58 Ma. Correlation of the sedimentary records and seismic data reveals a distinct warm period in the Pliocene between 4.2 and 3.2 Ma, which coincides with previously-reported warm periods off the Antarctic Peninsula and in the Ross Sea inferring generally warmer climates along the West Antarctic margin at that time. Our study is consistent with indications from seismic continental shelf records (Gohl et al., 2021b) that in the Amundsen Sea sector the WAIS was at a minimum extent for prolonged periods during the Pliocene. Future investigation of the possibility that these WAIS minima may have accompanied one or more total WAIS collapses will require complementary drill core records from sediments of the continental shelf to track and compare depositional characteristics and their changes from the shelf to the rise.
IODP Expedition 379 Scientists
J. S. Wellner (Univ. Houston, USA) A. Klaus (IODP Texas A&M Univ., USA) D. Kulhanek (IODP Texas A&M Univ., USA) T. Bauersachs (Univ. Kiel, Germany) S. M. Bohaty (Univ. Southampton, UK) M. Courtillat (Univ. Perpignan, France) E. A. Cowan (Appalachian State Univ., USA) M. De Lira Mota (Unisinos Univ., Brazil) M. S. R. Esteves (Univ. Tromsø, Norway) J. M. Fegyveresi (Northern Arizona Univ., USA) T. Frederichs (Univ. Bremen, Germany) L. Gao (China Univ. Geosciences, China) A. R. Halberstadt (Univ. Massachusetts-Amherst, USA) C. D. Hillenbrand (BAS, UK) K. Horikawa (Toyama Univ., Japan), M. Iwai (Kochi Univ., Japan) J. H. Kim (Korea Inst. Geoscience and Minerals, Rep. Korea) T. M. King (Univ. South Florida, USA) S. Passchier (Montclair State Univ., USA) M. L. Penkrot (Texas A&M Univ., USA) J. G. Prebble (GNS Science, New Zealand) W. Rahaman (National Center for Polar and Ocean Res., India) B. T. I. Reinardy (Univ. Stockholm, Sweden) J. Renaudie (Museum f. Naturkunde Berlin, Germany) D. E. Robinson (Univ. Houston, USA) R. P. Scherer (Northern Illinois Univ., USA) C. S. Siddoway (Colorado College, USA) L. Wu (Tonji Univ., China) M. Yamane (Nagoya Univ., Japan).
Data availability statement
Publicly available datasets were analyzed in this study. This data can be found here: The IODP Exp. 379 datasets analyzed for this study can be found in LIMS Reports (https://web.iodp.tamu.edu/LORE/). The seismic line AWI-20100130 is available in PANGAEA (https://doi.pangaea.de/10.1594/PANGAEA.931266), and seismic line TH86003 can be accesses from the SCAR Antarctic Seismic Data Library System (https://www.scar.org/sdls/).
Author contributions
JGP wrote the draft manuscript, created the images and analyzed and interpreted the data. KG, GU, JG, and JK contributed to the analysis, interpretation of the data and the discussion of the results. GU processed the seismic data. All authors reviewed and improved the draft manuscript and approve the submitted version.
Funding
This study was supplied by institutional funds of the Alfred Wegener Institute and by grant no. GO 724/19-1 from the Deutsche Forschungsgemeinschaft (DFG) in the framework of the Priority Program 527 IODP. Expedition 379 was funded by the International Ocean Discovery Program (IODP).
Acknowledgments
We are grateful to the International Ocean Discovery Program (IODP) organizations, in particular the JOIDES Resolution Science Operator (JRSO) as well as the master and his ship and drill crews of RV JOIDES Resolution for their support in conducting IODP Expedition 379. This research used samples and data provided by the IODP. Funds for this project were contributed by the AWI INSPIRES program, the AWI research program “Changing Earth–Sustaining our Future” in Subtopic 2.1 Warming Climates, and by the Deutsche Forschungsgemeinschaft (DFG) in the framework of the Priority Program 527 IODP by grant GO 724/19-1. The study contributes to the Scientific Research Program “Instabilities and Thresholds in Antarctica” (INSTANT) of the Scientific Committee for Antarctic Research (SCAR). The authors would like to thank Emerson E&P Software, Emerson Automation Solutions, for providing licenses for the seismic software Paradigm in the scope of the Emerson Academic Program. The datasets collected for this study will be made available from the PANGAEA databank (www.pangea.de) by the time this manuscript is accepted.
Conflict of interest
The authors declare that the research was conducted in the absence of any commercial or financial relationships that could be construed as a potential conflict of interest.
The reviewer LP declared a past co-authorship with the author KG to the handling editor.
Publisher’s note
All claims expressed in this article are solely those of the authors and do not necessarily represent those of their affiliated organizations, or those of the publisher, the editors and the reviewers. Any product that may be evaluated in this article, or claim that may be made by its manufacturer, is not guaranteed or endorsed by the publisher.
Supplementary material
The Supplementary Material for this article can be found online at: https://www.frontiersin.org/articles/10.3389/feart.2022.976703/full#supplementary-material
Supplementary Figure S1 | Seismic profile AWI-20100130 (Gohl and Uenzelmann-Neben, 2021a) uninterpreted with drill location Site U1532 and the synthetic seismogram.
Supplementary Figure S2 | Seismic profile TH86003B (Yamaguchi et al., 1988) uninterpreted with drill location Site U1533 and the synthetic seismogram U1533 and the synthetic seismogram.
Supplementary Figure S3 | Seismic data correlation from seismic profile AWI-20100130 (Gohl and Uenzelmann-Neben, 2021a) with drill location Site U1532 via seismic profile AWI-20100131 (Gohl and Uenzelmann-Neben, 2021b) to seismic profile TH86003B (Yamaguchi et al., 1988) with drill location Site U1533.
Supplementary Figure S4 | Seismic data and reflection ASu7 to ASu9 correlation from seismic profile AWI-20100130 (Gohl and Uenzelmann-Neben, 2021a) with drill location Site U1532 via seismic profile AWI- (Gohl and Uenzelmann-Neben, 2021a) with drill location Site U1532 via seismic profile AWI-20100131 (Gohl and Uenzelmann-Neben, 2021b) to seismic profile TH86003B (Yamaguchi et al., 1988) with drill location Site U1533.
References
Arndt, J. E., Schenke, H. W., Jakobsson, M., Nitsche, F. O., Buys, G., Goleby, B., et al. (2013). The International Bathymetric Chart of the Southern Ocean (IBCSO) Version 1.0-A new bathymetric compilation covering circum-Antarctic waters. Geophys. Res. Lett. 40 (12), 3111–3117. doi:10.1002/grl.50413
Assmann, K. M., Jenkins, A., Shoosmith, D. R., Walker, D. P., Jacobs, S. S., and Nicholls, K. W. (2013). Variability of Circumpolar Deep Water transport onto the Amundsen Sea Continental shelf through a shelf break trough. J. Geophys. Res. Oceans 118, 6603–6620. doi:10.1002/2013JC008871
Barker, P. F., Filippelli, G. M., Florindo, F., Martin, E. E., and Scher, H. D. (2007). Onset and role of the Antarctic Circumpolar Current. Deep Sea Res. Part II Top. Stud. Oceanogr. 54 (21-22), 2388–2398. doi:10.1016/j.dsr2.2007.07.028
Billups, K., Ravelo, A. C., and Zachos, J. C. (1998). Early Pliocene deep water circulation in the western equatorial Atlantic: Implications for high-latitude climate change. Paleoceanography 13, 84–95. doi:10.1029/97pa02995
Brierley, C., and Fedorov, A. (2010). Relative importance of meridional and zonal sea surface temperature gradients for the onset of the ice ages and Pliocene-Pleistocene climate evolution. Paleoceanography 25 (2). doi:10.1029/2009pa001809
DeConto, R., and Pollard, D. (2016). Contribution of Antarctica to past and future sea-level rise. Nature 531 (7596), 591–597. doi:10.1038/nature17145
Dumitru, O. A., Austermann, J., Polyak, V. J., Fornós, J. J., Asmerom, Y., Ginés, J., et al. (2019). Constraints on global mean sea level during Pliocene warmth. Nature 574 (7777), 233–236. doi:10.1038/s41586-019-1543-2
Escutia, C., Bárcena, M. A., Lucchi, R. G., Romero, O., Ballegeer, A. M., Gonzalez, J. J., et al. (2009). Circum-Antarctic warming events between 4 and 3.5 Ma recorded in marine sediments from the Prydz Bay (ODP Leg 188) and the Antarctic Peninsula (ODP Leg 178) margins. Glob. Planet. Change 69 (3), 170–184. doi:10.1016/j.gloplacha.2009.09.003
Faugeres, J.-C., Stow, D. A. V., Imbert, P., and Viana, A. (1999). Seismic features diagnostic of contourite drifts. Mar. Geol. 162, 1–38. doi:10.1016/s0025-3227(99)00068-7
Fedorov, A. V., Brierley, C. M., Lawrence, K. T., Liu, Z., Dekens, P. S., and Ravelo, A. C. (2013). Patterns and mechanisms of early Pliocene warmth. Nature 496 (7443), 43–49. doi:10.1038/nature12003
Fretwell, P., Pritchard, H. D., Vaughan, D. G., Bamber, J. L., Barrand, N. E., Bell, R., et al. (2012). Bedmap2: Improved ice bed, surface and thickness datasets for Antarctica. Cryosphere 7, 375–393. doi:10.5194/tc-7-375-2013
Gerland, S., and Villinger, H. (1995). Nondestructive density determination on marine sediment cores from gamma-ray attenuation measurements. Geo-Marine Lett. 15, 111–118. doi:10.1007/bf01275415
Gohl, K., and Uenzelmann-Neben, G. (2021a). Amundsen Sea, seismic reflection profile AWI-20100130. Bremen and Bremerhaven: PANGAEA. doi:10.1594/PANGAEA.931266
Gohl, K., and Uenzelmann-Neben, G. (2021b). Amundsen Sea, seismic reflection profile AWI-20100131. Bremen and Bremerhaven: PANGAEA. doi:10.1594/PANGAEA.931265
Gohl, K., Uenzelmann-Neben, G., Gille-Petzoldt, J., Hillenbrand, C.-D., Klages, J. P., Bohaty, S. M., et al. (2021b). Evidence for a Highly Dynamic West Antarctic Ice Sheet during the Pliocene. Geophys. Res. Lett. 48 (14). doi:10.1029/2021gl093103
Gohl, K., Wellner, J. S., Klaus, A., and the Expedition 379 Scientists. (2021a). “Volume 379: Amundsen Sea West Antarctic Ice Sheet History,” in Proceedings of the International Ocean Discovery Program (College Station, TX: International Ocean Discovery Program), 379. doi:10.14379/iodp.proc.379.2021
Golledge, N. R., Keller, E. D., Gomez, N., Naughten, K. A., Bernales, J., Trusel, L. D., et al. (2019). Global environmental consequences of twenty-first-century ice-sheet melt. Nature 566 (7742), 65–72. doi:10.1038/s41586-019-0889-9
Golledge, N. R., Thomas, Z. A., Levy, R. H., Gasson, E. G. W., Naish, T. R., McKay, R. M., et al. (2017). Antarctic climate and ice-sheet configuration during the early Pliocene interglacial at 4.23 Ma. Clim. Past. 13 (7), 959–975. doi:10.5194/cp-13-959-2017
Gordon, A. L. (1971). Oceanography of antarctic waters. Antarct. Oceanol. 15 (1), 169–203. doi:10.1029/ar015p0169
Gruetzner, J., Espejo, F. J. J., Lathika, N., Uenzelmann-Neben, G., Hall, I. R., Hemming, S. R., et al. (2019). A New Seismic Stratigraphy in the Indian-Atlantic Ocean Gateway resembles major Paleo-Oceanographic changes of the Last 7 Ma. Geochem. Geophys. Geosyst., 20(1), 339–358. doi:10.1029/2018GC007668
Gruetzner, J., Hillenbrand, C.-D., and Rebesco, M. (2005). Terrigenous flux and biogenic silica deposition at the Antarctic continental rise during the late Miocene to early Pliocene: Implications for ice sheet stability and sea ice coverage. Glob. Planet. Change 45 (1-3), 131–149. doi:10.1016/j.gloplacha.2004.09.004
Gruetzner, J., Rebesco, M. A., Cooper, A. K., Forsberg, C. F., Kryc, K. A., and Wefer, G. (2003). Evidence for orbitally controlled size variations of the East Antarctic Ice Sheet during the late Miocene. Geol. 31 (9), 777. doi:10.1130/g19574.1
Hepp, D. A., Moerz, T., and Gruetzner, J. (2006). Pliocene glacial cyclicity in a deep-sea sediment drift (Antarctic Peninsula Pacific Margin). Palaeogeogr. Palaeoclimatol. Palaeoecol. 231 (1-2), 181–198. doi:10.1016/j.palaeo.2005.07.030
Hillenbrand, C.-D., Fütterer, D., Grobe, H., and Frederichs, T. (2002). No evidence for a Pleistocene collapse of the West Antarctic Ice Sheet from continental margin sediments recovered in the Amundsen Sea. Geo-Marine Lett. 22 (2), 51–59. doi:10.1007/s00367-002-0097-7
Hillenbrand, C.-D., and Ehrmann, W. (2005). Late Neogene to Quaternary environmental changes in the Antarctic Peninsula region: Evidence from drift sediments. Glob. Planet. Change 45 (1-3), 165–191. doi:10.1016/j.gloplacha.2004.09.006
Hillenbrand, C.-D., Camerlenghi, A., Cowan, E. A., Hernández-Molina, F. J., Lucchi, R. G., Rebesco, M., et al. (2008). The present and past bottom-current flow regime around the sediment drifts on the continental rise west of the Antarctic Peninsula. Mar. Geol. 255 (1-2), 55–63. doi:10.1016/j.margeo.2008.07.004
Hillenbrand, C.-D., Kuhn, G., and Frederichs, T. (2009). Record of a Mid-Pleistocene depositional anomaly in West Antarctic continental margin sediments: An indicator for ice-sheet collapse? Quat. Sci. Rev. 28 (13-14), 1147–1159. doi:10.1016/j.quascirev.2008.12.010
Hillenbrand, C.-D., Smith, J. A., Hodell, D. A., Greaves, M., Poole, C. R., Kender, S., et al. (2017). West Antarctic Ice Sheet retreat driven by Holocene warm water incursions. Nature 547 (7661), 43–48. doi:10.1038/nature22995
Hutchinson, D. K., Coxall, H. K., Lunt, D. J., Steinthorsdottir, M., Boer, A. M., Baatsen, M., et al. (2021). The Eocene–Oligocene transition: A review of marine and terrestrial proxy data, models and model–data comparisons. Clim. Past. 17 (1), 269–315. doi:10.5194/cp-17-269-2021
Joughin, I., Alley, R. B., and Holland, D. M. (2012). Ice-Sheet Response to Oceanic Forcing. Science 338, 1172–1176. doi:10.1126/science.1226481
Joughin, I., and Alley, R. B. (2011). Stability of the West Antarctic ice sheet in a warming world. Nat. Geosci. 4 (8), 506–513. doi:10.1038/ngeo1194
Konfirst, M. A., Scherer, R. P., Hillenbrand, C.-D., and Kuhn, G. (2012). A marine diatom record from the Amundsen Sea — Insights into oceanographic and climatic response to the Mid-Pleistocene Transition in the West Antarctic sector of the Southern Ocean. Mar. Micropaleontol. 92-93, 40–51. doi:10.1016/j.marmicro.2012.05.001
Lawver, L. A., and Gahagan, L. M. (2003). Evolution of Cenozoic seaways in the circum-Antarctic region. Palaeogeogr. Palaeoclimatol. Palaeoecol. 198 (1-2), 11–37. doi:10.1016/s0031-0182(03)00392-4
Lindeque, A., Gohl, K., Henrys, S., Wobbe, F., and Davy, B. (2016). Seismic stratigraphy along the Amundsen Sea to Ross Sea continental rise: A cross-regional record of pre-glacial to glacial processes of the West Antarctic margin. Palaeogeogr. Palaeoclimatol. Palaeoecol. 443, 183–202. doi:10.1016/j.palaeo.2015.11.017
Lipscomb, W. H., Leguy, G. R., Jourdain, N. C., Asay-Davis, X., Seroussi, H., and Nowicki, S. (2021). ISMIP6-based projections of ocean-forced Antarctic Ice Sheet evolution using the Community Ice Sheet Model. Cryosphere 15 (2), 633–661. doi:10.5194/tc-15-633-2021
Livermore, R., Nankivell, A., Eagles, G., and Morris, P. (2005). Paleogene opening of Drake Passage. Earth Planet. Sci. Lett. 236 (1-2), 459–470. doi:10.1016/j.epsl.2005.03.027
Lucchi, R. G., Rebesco, M., Camerlenghi, A., Busetti, M., Tomadin, L., Villa, G., et al. (2002). Mid-late Pleistocene glacimarine sedimentary processes of a high-latitude, deep-sea sediment drift (Antarctic Peninsula Pacific margin). Mar. Geol. 189 (3-4), 343–370. doi:10.1016/s0025-3227(02)00470-x
Matsuoka, K., Skoglund, A., Roth, G., De Pomereu, J., Griffiths, H., Headland, R., et al. (2018). Quantarctica (Dataset). Tromsø: Norwegian Polar Institute. doi:10.21334/NPOLAR.2018.8516E961
McKay, R., Barrett, P. J., Levy, R. S., Naish, T. R., Golledge, N. R., and Pyne, A. (2016). Antarctic Cenozoic climate history from sedimentary records: ANDRILL and beyond. Phil. Trans. R. Soc. A 374, 20140301. doi:10.1098/rsta.2014.0301
McKay, R., Naish, T., Carter, L., Riesselman, C., Dunbar, R., Sjunneskog, C., et al. (2012). Antarctic and Southern Ocean influences on Late Pliocene global cooling. Proc. Natl. Acad. Sci. U. S. A. 109 (17), 6423–6428. doi:10.1073/pnas.1112248109
Miller, K. G., Wright, J. D., Browning, J. V., Kulpecz, A., Kominz, M., Naish, T. R., et al. (2012). High tide of the warm Pliocene: Implications of global sea level for Antarctic deglaciation. Geology 40 (5), 407–410. doi:10.1130/g32869.1
Naish, T., Powell, R. D., Barrett, P. J., Levy, R. H., Henrys, S., Wilson, G. S., et al. (2008). “Late Cenozoic Climate History of the Ross Embayment from the AND-1B Drill Hole: Culmination of Three Decades of Antarctic Margin Drilling,” in Antarctica: A Keystone in a Changing World. Proceedings of the 10th International Symposium on Antarctic Earth Sciences. Editors A. K. Cooper, P. J. Barrett, H. Stagg, B. Storey, E. Stump, and W. Wise and the 10th ISAES editorial team. Washington, DC: The National Academies Press. doi:10.3133/of2007-1047.kp07
Naish, T., Powell, R., Levy, R., Wilson, G., Scherer, R., Talarico, F., et al. (2009). Obliquity-paced Pliocene West Antarctic ice sheet oscillations. Nature 458 (7236), 322–328. doi:10.1038/nature07867
Nakayama, Y., Schroeder, M., and Hellmer, H. H. (2013). From circumpolar deep water to the glacial meltwater plume on the eastern Amundsen Shelf. Deep Sea Res. Part I Oceanogr. Res. Pap. 77, 50–62. doi:10.1016/j.dsr.2013.04.001
Nitsche, F. O., Cunningham, A. P., Larter, R. D., and Gohl, K. (2000). Geometry and development of glacial continental margin depositional systems in the Bellingshausen Sea. Mar. Geol. 162 (2-4), 277–302. doi:10.1016/s0025-3227(99)00074-2
Oppenheimer, M. (1998). Global warming and the stability of the West Antarctic Ice Sheet. Nature 393, 325–332. doi:10.1038/30661
Orsi, A. H., Johnson, G. C., and Bullister, J. L. (1999). Circulation, mixing, and production of Antarctic Bottom Water. Prog. Oceanogr. 43, 55–109. doi:10.1016/s0079-6611(99)00004-x
Orsi, A. H., Whitworth, T., and Nowlin, W. D. (1995). On the meridional extent and fronts of the Antarctic Circumpolar Current. Deep Sea Res. Part I Oceanogr. Res. Pap. 42 (5), 641–673. doi:10.1016/0967-0637(95)00021-w
Pagani, M., Liu, Z., LaRiviere, J., and Ravelo, A. C. (2009). High Earth-system climate sensitivity determined from Pliocene carbon dioxide concentrations. Nat. Geosci. 3 (1), 27–30. doi:10.1038/ngeo724
Pritchard, H. D., Ligtenberg, S. R. M., Fricker, H. A., Vaughan, D. G., Broeke, M. R., and Padman, L. (2012). Antarctic ice-sheet loss driven by basal melting of ice shelves. Nature 484 (7395), 502–505. doi:10.1038/nature10968
Rebesco, M., and Stow, D. (2001). Seismic expression of contourites and related deposits: A preface. Mar. Geophys. Res. (Dordr). 22 (22), 303–308. doi:10.1023/a:1016316913639
Rignot, E., Mouginot, J., Scheuchl, B., Broeke, M., Wessem, M. J., and Morlighem, M. (2019). Four decades of Antarctic Ice Sheet mass balance from 1979–2017. Proc. Natl. Acad. Sci. U. S. A. 116 (4), 1095–1103. doi:10.1073/pnas.1812883116
Stow, D. A. V., Faugères, J.-., Howe, J. A., Pudsey, C. J., and Viana, A. R. (2002). Bottom currents, contourites and deep-sea sediment drifts: Current state-of-the-art. Memoirs 22, 7–20. doi:10.1144/gsl.mem.2002.022.01.02
Sun, S., Pattyn, F., Simon, E. G., Albrecht, T., Cornford, S., Calov, R., et al. (2020). Antarctic ice sheet response to sudden and sustained ice-shelf collapse (ABUMIP). J. Glaciol. 66 (260), 891–904. doi:10.1017/jog.2020.67
Sutter, J., Gierz, P., Grosfeld, K., Thoma, M., and Lohmann, G. (2016). Ocean temperature thresholds for Last Interglacial West Antarctic Ice Sheet collapse. Geophys. Res. Lett. 43 (6), 2675–2682. doi:10.1002/2016gl067818
Thompson, A. F., Speer, K. G., and Schulze-Chretien, L. M. (2020). Genesis of the Antarctic Slope Current in West Antarctica. Geophys. Res. Lett. 47. doi:10.1029/2020GL087802
Uenzelmann-Neben, G., and Gohl, K. (2012). Amundsen Sea sediment drifts: Archives of modifications in oceanographic and climatic conditions. Mar. Geol., 299-302, 51–62. doi:10.1016/j.margeo.2011.12.007
Uenzelmann-Neben, G., and Gohl, K. (2014). Early glaciation already during the early Miocene in the Amundsen Sea, Southern Pacific: Indications from the distribution of sedimentary sequences. Glob. Planet. Change 120, 92–104. doi:10.1016/j.gloplacha.2014.06.004
Uenzelmann-Neben, G., Gohl, K., Hochmuth, K., Salzmann, U., Larter, R. D., Hillenbrand, C.-D., et al. (2022). Deep water inflow slowed offshore expansion of the West Antarctic Ice Sheet at the Eocene-Oligocene transition. Commun. Earth Environ. 3 (1), 36. doi:10.1038/s43247-022-00369-x
Walker, D. P., Jenkins, A., Assmann, K. M., Shoosmith, D. R., and Brandon, M. A. (2013). Oceanographic observations at the shelf break of the Amundsen Sea, Antarctica. J. Geophys. Res. Oceans 118, 2906–2918. doi:10.1002/jgrc.20212
Wellner, J. S., Gohl, K., Klaus, A., Bauersachs, T., Bohaty, S. M., Courtillat, M., et al. (2021a). “Site U1532. Amundsen Sea West Antarctic Ice Sheet History,” in Proceedings of the International Ocean Discovery Program. Editors K. Gohl, J. S. Wellner, and A. Klaus 379. College Station, TX: International Ocean Discovery Program. doi:10.14379/iodp.proc.379.103.2021
Wellner, J. S., Gohl, K., Klaus, A., Bauersachs, T., Bohaty, S. M., Courtillat, M., et al. (2021b). “Site U1533. Amundsen sea West Antarctic ice sheet history,” in Proceedings of the International Ocean Discovery Program. Editors K. Gohl, J. S. Wellner, and A. Klaus 379. College Station, TX: International Ocean Discovery Program. doi:10.14379/iodp.proc.379.104.2021
Whitworth, T., Orsi, A. H., Kim, S.-J., Nowlin, W. D., and Locarnini, R. A. (1998). Water masses and Mixing Near the Antarctic Slope Front. Ocean, Ice, Atmos. Interact. Antarct. Cont. Margin, Antarct. Res. Ser. 75, 1–27. doi:10.1029/ar075p0001
Wolf-Welling, T. C. W., Moerz, T., Hillenbrand, C.-D., Pudsey, C. J., and Cowan, E. A. (2001). Data report: Bulk sediment parameters (CaCO3, TOC, and >63 µm) of sites 1095, 1096, and 1101, and coarse-fraction analysis of site 1095 (ODP Leg 178, western antarctic Peninsula). Proc. ODP, Sci. Results. Editors P. F. Barker, A. Camerlenghi, G. D. Acton, and A. T. S. Ramsay (College Station, TX: Proceedings Ocean Drilling Program) 178, 1–19. doi:10.2973/odp.proc.sr.178.223.2001
Keywords: Amundsen Sea, Pliocene, core-log seismic integration, IODP Expedition 379, West Antarctic Ice Sheet, sediment drift
Citation: Gille-Petzoldt J, Gohl K, Uenzelmann-Neben G, Grützner J, Klages JP and IODP Expedition 379 Scientists (2022) West Antarctic Ice Sheet Dynamics in the Amundsen Sea Sector since the Late Miocene—Tying IODP Expedition 379 Results to Seismic Data. Front. Earth Sci. 10:976703. doi: 10.3389/feart.2022.976703
Received: 23 June 2022; Accepted: 05 December 2022;
Published: 21 December 2022.
Edited by:
Lauren Miller Simkins, University of Virginia, United StatesReviewed by:
Lara F. Pérez, Geological Survey of Denmark and Greenland, DenmarkLindsay Prothro, Texas A&M University Corpus Christi, United States
Copyright © 2022 Gille-Petzoldt, Gohl, Uenzelmann-Neben, Grützner and Klages.
IODP Expedition 379 Scientists. This is an open-access article distributed under the terms of the Creative Commons Attribution License (CC BY). The use, distribution or reproduction in other forums is permitted, provided the original author(s) and the copyright owner(s) are credited and that the original publication in this journal is cited, in accordance with accepted academic practice. No use, distribution or reproduction is permitted which does not comply with these terms.
*Correspondence: Johanna Gille-Petzoldt, am9oYW5uYS5naWxsZS1wZXR6b2xkdEBhd2kuZGU=