- 1Science Systems and Applications (SSAI), Lanham, MD, United States
- 2Climate and Radiation Laboratory, NASA-Goddard Space Flight Center (GSFC), Greenbelt, MD, United States
- 3Goddard Earth Science Technology and Research (GESTAR) II, University of Maryland Baltimore County, Baltimore, MD, United States
- 4Goddard Earth Sciences Technology and Research (GESTAR) II, Morgan State University, Baltimore, MD, United States
- 5Space Science and Engineering Center (SSEC), University of Wisconsin-Madison, Madison, WI, United States
Aerosol optical depth (AOD) is a crucial data record to understand aerosols and their direct and indirect effects on air quality and climate forcing. The Dark Target aerosol retrieval product includes AOD and other properties derived from multispectral satellite imagers, available for MODIS on Terra (from 2000), MODIS on Aqua (from 2002), and VIIRS on Suomi-NPP (from 2012). Although Terra now has over 25 years of observations, the record must continue onto VIIRS beyond the end of the MODIS mission to meet requirements as a Global Climate Observing System (GCOS) climate data record. We present the recent update to version 2.0 of the VIIRS product, which now includes NOAA-20 VIIRS (from 2017) and algorithm improvements. The combined MODIS-VIIRS dataset is examined for consistency and to ascertain aerosol trends. Overall, the VIIRS products show consistency with the MODIS products. To assess regional trends, two time intervals are studied: a 22-year record that compares Terra and Aqua, and a more recent 12-year record (the VIIRS era) that compares three sensors. According to linear regressions of monthly average AOD for each global 1°×1° grid cell, AOD has decreased by between 0.003 and 0.01 per year over parts of China, the United States, Brazil, and much of Europe, while increasing on the same scale over India and parts of Canada, while more modestly but significantly increasing over the southern oceans. For seven regions with significant AOD trends, this study examines the seasonal dependence, relationship to aerosol size parameters, and whether the sign or magnitude of these trends have changed. With high agreement among sensors, we are confident that the Dark Target AOD record can extend into the 2030s and beyond.
1 Introduction
Atmospheric aerosols, which vary greatly in composition and concentration over regional scales, and which persist in the atmosphere for only days or weeks, are among the largest sources of uncertainty in the climate system (IPCC, 2021). Measurements of aerosol loading and optical properties are needed to assess air quality, direct radiative effects on global climate, and indirect effects on cloud and precipitation processes, and satellite observations are especially important because of their global coverage.
Aerosols are emitted into the atmosphere from a variety of sources, both natural and anthropogenic. Anthropogenic sources such as effluents from burning fossil fuels for industry or transportation and intentional agricultural burning change over time (Hand et al., 2012; 2014; Yu et al., 2020; Bauer et al., 2022; Quaas et al., 2022) based on varying policy, technology and population patterns (Zhao et al., 2017; Chowdhury et al., 2019; Gupta et al., 2023). Additionally, because Earth’s climate is changing, even the natural sources of aerosol vary in time. Drought can modulate dust aerosol on an interannual basis (Aryal and Evans, 2021), while enhanced fire weather (lightning activity, low humidity, high winds) over dry wildlands can ignite more intense and frequent wildfires that contribute smoke aerosol (Richardson et al., 2022; Cunningham et al., 2024). The point is that the global aerosol system is dynamic and changing on the order of years to decades. Because aerosols have climate relevancy, measuring and characterizing the change in the aerosol system is critical for input into climate models and prediction of climate change (Bauer et al., 2022).
Aerosol optical depth (AOD), a measure of aerosol loading integrated over the atmospheric column, is a designated essential climate variable (ECV) according to the Global Climate Observing System (GCOS, 2012; GCOS, 2017). To meet GCOS definition to serve as an AOD climate data record (CDR), an AOD dataset should include global coverage at a spatial resolution of 10 km or finer, with an accuracy better than the maximum of 0.03 or 10% and a drift of less than 0.01 per decade, and spanning at least the 30 years needed to assess changes in climate. Benefiting from improved calibration, mitigation of sensor drift, and algorithm development since Terra and Aqua were launched, AOD retrievals derived from MODIS can theoretically meet all but the temporal cadence and longevity requirement. In 2021 both spacecraft that carry MODIS began allowing their equatorial crossing time to drift, in preparation for decommissioning before the end of the decade. Since MODIS cannot meet the GCOS requirements, we have ported the AOD retrieval to newer sensors with similar capabilities to MODIS. This includes the Visible Infrared Imaging Radiometer Suite (VIIRS) and advanced imagers in geostationary orbit (such as the Advanced Baseline Imager (ABI) on the NOAA GOES series and the Advanced Himawari Imager (AHI) on Himawari-8 and 9) Together, they can satisfy both the remaining requirements.
The more than 20 years for which MODIS observations already exist are not quite long enough to definitively show whether the global AOD is changing over time. However, the global average may be less important for decision makers than regional trends driven by a single type of aerosol or aerosol event. Regional climate trends and projections in the most recent IPCC do not explicitly account for changes in aerosol (IPCC, 2021).
In this study, we examine regional trends in AOD and related parameters that appear in the combined MODIS record since the launch of Aqua, and in the combined MODIS/VIIRS record since the launch of Suomi-NPP. This is not the first attempt to characterize the changing aerosol system from a trend analysis of the satellite AOD record. Beginning with only 46 months of data, Loeb and Manalo-Smith (2005) reported seasonal fluctuations and random events in the MODIS AOD record, but no discernible temporal trends across 13 broad regions in MODIS’s limited first 4 years. Local trends derived from MODIS AOD products began to be reported in China after MODIS had achieved 6 years of data (Bao et al., 2008) and 8 years of data (Lyapustin et al., 2011). With a decade of MODIS AOD data available, Zhang and Reid (2010) produced a global analysis that identified regions with statistically significant temporal trends in the aerosol record. Chin et al. (2014) took a broader view and searched for global and regional trends from both satellite records and model results. As the satellite aerosol product time series grew, we find updates to these trend studies from the MODIS record (Cherian and Quaas, 2020) and from other sensors (Gui et al., 2021) and from merged data sets including assimilation systems (Sogacheva et al., 2020; Shaheen et al., 2020; Gupta et al., 2023). Many of these studies take a global view and focus on AOD, but others are regionally or locally focused (Kumar et al., 2018; Shaheen et al., 2020), and some track a different aerosol parameter such as particulate matter (Hammer et al., 2020) or dust (Song et al., 2021).
These studies illustrate the complexity of the global aerosol system and how that system changes in time. Unlike greenhouse gases that demonstrate a seasonally averaged monotonic upward trend globally (e.g., Keeling et al., 2001), aerosol trends are regional. For much of the globe, there is no expectation of a significant trend. Regions with rapid industrialization might be expected to have experienced increases, whereas those with strong emission controls may have seen a decrease in AOD. Others may have experienced an overall trend during the satellite record, but no trend or even a reversal during more recent periods, such as that noted by Gupta et al. (2023). Of course, apparent trends could result from strong episodic events either at the beginning or end of the record. As the satellite record continues, it is important to revisit trend analysis to identify slow trends undetected in shorter time series and reversals in trends, as seen previously in China (Bao et al., 2008; Lyapustin et al., 2011).
Trend analysis of satellite aerosol products is inherently challenging. Satellite missions are generally designed to last less than 10 years, too short to identify long term trends above natural interannual variability (Sogacheva et al., 2020). Studies seeking to mitigate this challenge have moved towards merged time series from multiple sensors that lengthen the record, either externally (Sogacheva et al., 2020) or by using the products of an assimilation system (Gupta et al., 2023). There is merit in lengthening time series by merging data from different sensors, but the process of merging further can make results difficult to interpret if the data source becomes ambiguous. On the other hand, relying on a single sensor to determine global and regional aerosol trends is dangerous, not only because of the short time series, but also because individual sensors are susceptible to undiagnosed calibration drift.
We are currently experiencing a rare situation in which we have two satellite missions still in operation long after their design lifetime has passed. Terra recently celebrated its 25th birthday in December 2024 and Aqua turned 22 in July 2024. In this study we proceed with an analysis of aerosol trends using individual sensors including the long-lived Terra MODIS and Aqua MODIS. By using multiple sensors, but not merging them, we can test for calibration drift and still not lose the individuality of the data sources. We will analyze the full 25-year record provided by Terra-MODIS, making this the longest satellite time series of total column AOD ever analyzed. Furthermore, by taking a regional approach we look to explain regions of consistency among sensors as well as differences. Section 2 describes the Dark Target aerosol retrieval and its products for MODIS and VIIRS, as well as recent algorithm updates to the VIIRS version and its release for VIIRS NOAA-20. Section 3 describes the methods used to find regional trends in Dark Target aerosol retrievals. Section 4 contains seasonal trend analyses.
2 Data sources
2.1 MODIS dark target
The Dark Target (DT) aerosol retrieval was originally developed for MODIS, which launched with Terra in late 1999 and with Aqua in early 2002 (Kaufman et al., 1997; Remer et al., 2008; 2005; Levy et al., 2013; 2007a; b, 2010). Updates to the algorithm are synchronized with developments for MODIS calibration and geolocation (level 1b or L1b data products) as well as developments for other derived products (known as level 2 or L2) to form “Collections”. For MODIS, the most recent Collection is known as 6.1 (C6.1) (Levy et al., 2013). The DT retrieval uses L1b geolocated reflectances as input, from which it retrieves AOD and other properties separately over land and ocean at four and seven wavelength bands, respectively.
Each L2 aerosol retrieval is assigned a quality assurance flag (QA) with an integer value between 0 and 3, with 0 denoting marginal retrievals and 3 retrievals with the algorithm’s highest level of confidence. AOD values over ocean are considered reliable enough to use for quantitative purposes at QA between 1 and 3, while for AOD over land confidence is limited to QA = 3 only. For both MODIS and VIIRS, the “QA-filtered” AOD product used extensively in this study is the combination of land and ocean AOD at 0.55 μm with these QA criteria applied.
MODIS also includes an AOD product aggregated to a 1° × 1° latitude-longitude grid, known as level 3 or L3. These represent daily and monthly average data, calculated using logic originally presented in Levy et al. (2009). The daily average is calculated for a given grid cell if it contains at least six valid L2 retrievals (approximately 5% of the total grid cell area). The monthly average is calculated if the grid cell has at least three valid daily average values (10% of possible days). This study uses L3 datasets that are filtered by QA flag as described in the previous paragraph.
2.2 VIIRS dark target
The Dark Target algorithm was fully ported to use standard L1b input from the Suomi-NPP VIIRS instrument in 2020 (Sawyer et al., 2020). The MODIS and VIIRS instruments use different resolutions and wavelength bands, which lead to minor adjustments in the algorithm: VIIRS has its own spectral reflectance model and omits the urban correction (Gupta et al., 2016) and a cirrus test that is unavailable in the MODIS-VIIRS continuity cloud mask product. Each VIIRS sensor requires its own lookup tables for spectral response and gas correction. Finally, having different nomenclature than the MODIS products, VIIRS atmospheric retrieval products are organized as Versions, with V2.0 replacing the previous V1.1 as of September 2023. Unlike MODIS, Versions are organized by algorithm/product, without necessarily being synchronized with updates in calibration. V2.0 has been used to process all Suomi-NPP VIIRS observations since first light in 2012, as well as NOAA20 observations since 2017.
The largest difference between algorithm versions is an update to the cloud mask. VIIRS includes 22 bands, for which some are nearly overlapping in wavelength space but have different spatial resolutions. V1.1 used the Moderate “M” resolution (e.g., 750 m) red band whereas V2.0 now uses the Image “I” resolution (e.g., 375 m) band for spatial variability and threshold tests. Although the rest of the retrieval is done using moderate resolution bands, the higher-resolution cloud mask allows the algorithm to retrieve closer to cloud edges with less contamination than in the previous version, an effect that is especially apparent over ocean.
There are additional differences between V2.0 and V1.1. Version 2.0 uses NASA Global Modeling and Assimilation Office (GMAO) as its source for meteorological ancillary data (specifically the DFPITI3NXASM product from GEOS FP-IT, see Lucchesi, 2015) instead of the NCEP Global Data Assimilation System (GDAS) product (Kanamitsu, 1989). This means that the column ozone and water vapor used for gas correction (Patadia et al., 2018), and the surface winds used to estimate surface reflectance over ocean, are now taken from the nearest three-hourly interval at 0.5° × 0.625° resolution, rather than the nearest six-hourly interval at 1° × 1°, which provides better precision. Also for V2.0, the 1.64 μm channel replaces the 1.24 μm channel in the equation for snow masking, enabling greater compatibility with newer Dark Target retrievals for other sensors such as the geosynchronous Advanced Himawari Imager (AHI), which do not detect at 1.24 μm (e.g., Gupta et al., 2024). Several smaller bug fixes are also included.
While there is not yet a publicly available L3 AOD product, the intention is that like MODIS, VIIRS L3 be presented on a 1° × 1° latitude grid, and at daily and monthly increments. In the meantime, we use the MODIS L3 logic to create an offline product, to compare the two versions of the VIIRS product and to compare VIIRS with MODIS. We assess not only the differences between two products, but also whether values are reported in one but not the other (and vice versa). In the case of two versions of the same product, in addition to quantifying the differences (e.g., a new version retrieving higher or lower values), we assess where coverage is increased or reduced.
Figure 1 shows a comparison between the previous version 1.1 (Sawyer et al., 2020) and the more recent version 2.0 (V2.0) for the VIIRS SNPP Dark Target product (AERDT_L2_VIIRS_SNPP) for all daily grid cell AOD values in 2019. The scatterplots in the left side panels plot daily average grid cell values only where a one-to-one comparison is possible: both versions of the algorithm had data for the same grid cell on the same day (at least six valid L2 retrievals to the 1° × 1° cell). The histograms on the right show this set as overlapping dashed curves. Meanwhile, the histograms plotted as solid curves show the distribution of values for grid cells in which only one version of the algorithm had valid data. This is rare for two versions from the same sensor, as the bar below it indicates, although it is interesting that the “additional” retrievals for V2.0 are distributed smaller than roughly the same number of “removed” retrievals from V1.1. Along with the lower values in V2.0 for scatterplot outliers, this suggests reduced cloud contamination. Overall, the value distribution and the temporal and spatial coverage of AOD retrievals is similar.
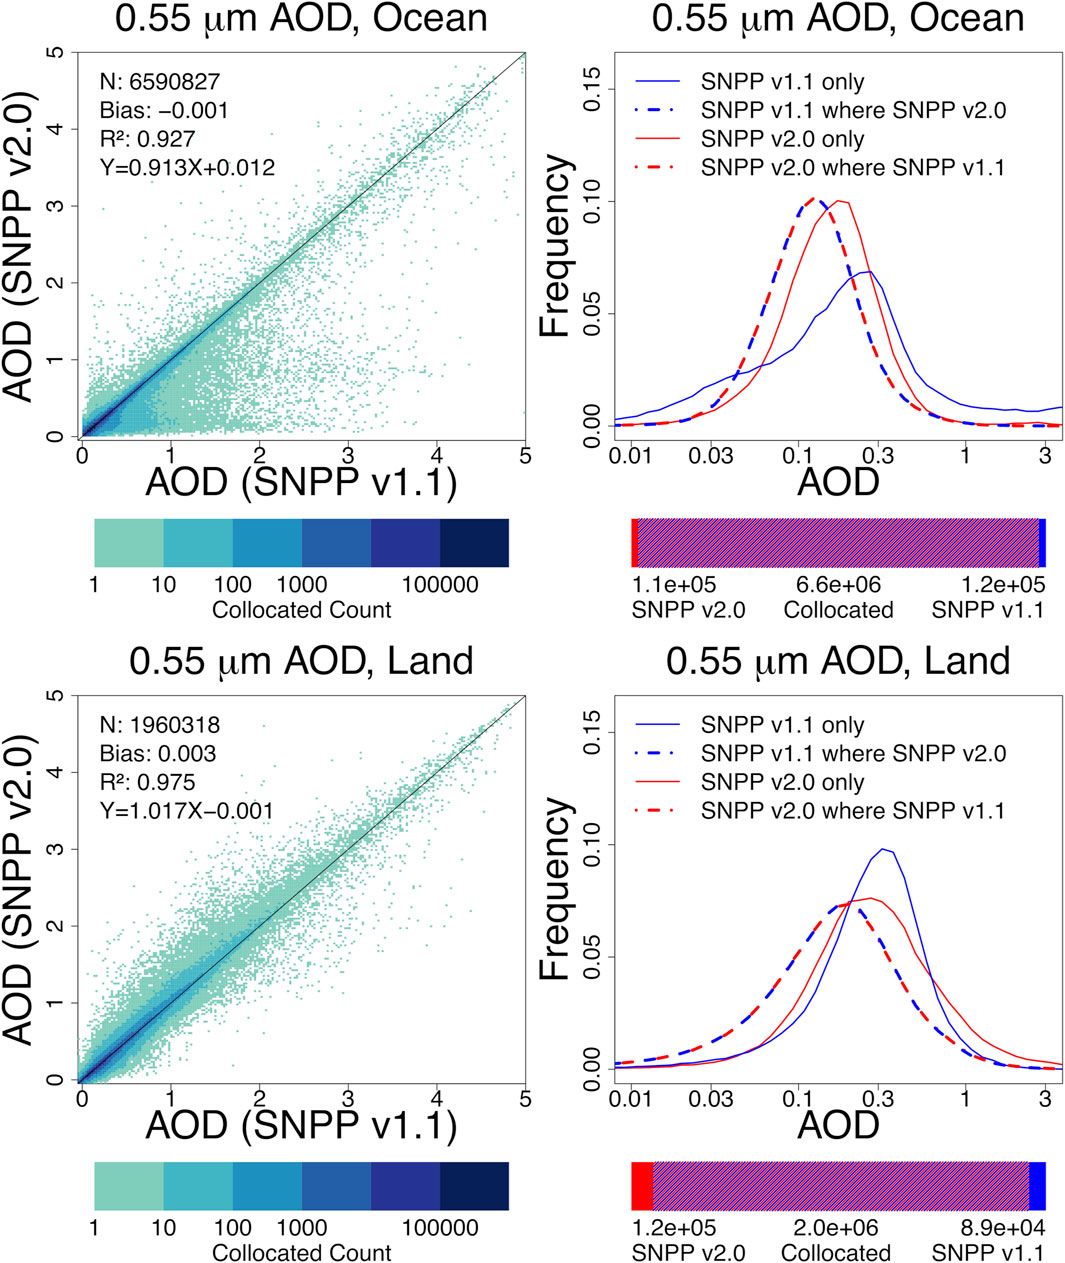
Figure 1. Comparison of daily average 1°×1° gridded AOD between version 1.1 and version 2.0 of the AERDT_L2_VIIRS_SNPP product, for all days in 2019. Left, scatterplots of collocated grid cells; right, histogram frequencies where both versions have a valid retrieval (dotted lines) and where only one version does (solid lines). The horizontal bar on the right indicates the number of collocated and non-collocated grid cells. Top, over ocean; bottom, over land.
NOAA-20 and SNPP both pass the equator around 13:30 Local Solar Time (LST), although NOAA-20 is about half an orbit behind SNPP. This means that when SNPP passes the Equator during daylight, NOAA-20 is passing opposite the globe at night, which leads to NOAA-20 overpassing the daylight side approximately 50 min later and ∼12.5° in longitude to the West. Because of the wide swath of VIIRS (∼3,000 km), both the previous and next NOAA-20 VIIRS orbits partially observe a given SNPP orbit. While the two VIIRS are similar in principle, the VIIRS instrument on the NOAA-20 spacecraft differs from VIIRS SNPP in spectral response functions and calibration (Uprety et al., 2018), thus requiring new lookup tables for radiative transfer and gas correction as described in previous Dark Target publications (e.g., Levy et al., 2013; Patadia et al., 2018). Otherwise, the algorithm is the same as for VIIRS SNPP, and a Dark Target product for VIIRS NOAA-20 (AERDT_L2_VIIRS_NOAA20) is available as part of the version 2.0 release.
NOAA-20 data for 2019 have been similarly aggregated and averaged to prototype Level 3, allowing for comparison with SNPP. Because NOAA-20 and SNPP fly half an orbit apart, overlapping scenes might look different due to the movement of clouds or angle of observation. Thus, daily average grid cells that were unique to one sensor and not by the other are much more common than unique cells between versions of the same sensor product. One might expect, however, that since both cover the same targets only 50 min apart, that their statistics should be similar.
Figure 2 is analogous to Figure 1, but this time comparing V2.0 retrievals for SNPP and NOAA-20. The scatterplot on the left and the dotted curves in the histogram represent daily AOD grid cell values, mutually reported by SNPP and NOAA-20. Similar to experiences comparing MODIS on Terra and Aqua (Levy et al., 2018) there appears to be an offset between SNPP and NOAA-20. Since the time difference is minimal, we attribute these offsets most likely due to uncertainties of sensor calibration (Lyapustin et al., 2023). It is important to note that neither SNPP nor NOAA-20 should be taken as truth in the comparison, although literature suggests that calibration from SNPP is biased “high”. In fact, offline tests have suggested that if we apply suggested calibration “corrections” to SNPP L1b (Lyapustin et al., 2023; Doelling et al., 2024), results would be much closer to those of Aqua or to NOAA-20. However, since no corrections have been applied to this Version 2.0, the overall AOD distribution for SNPP does not change between versions 1.1 and 2.0.
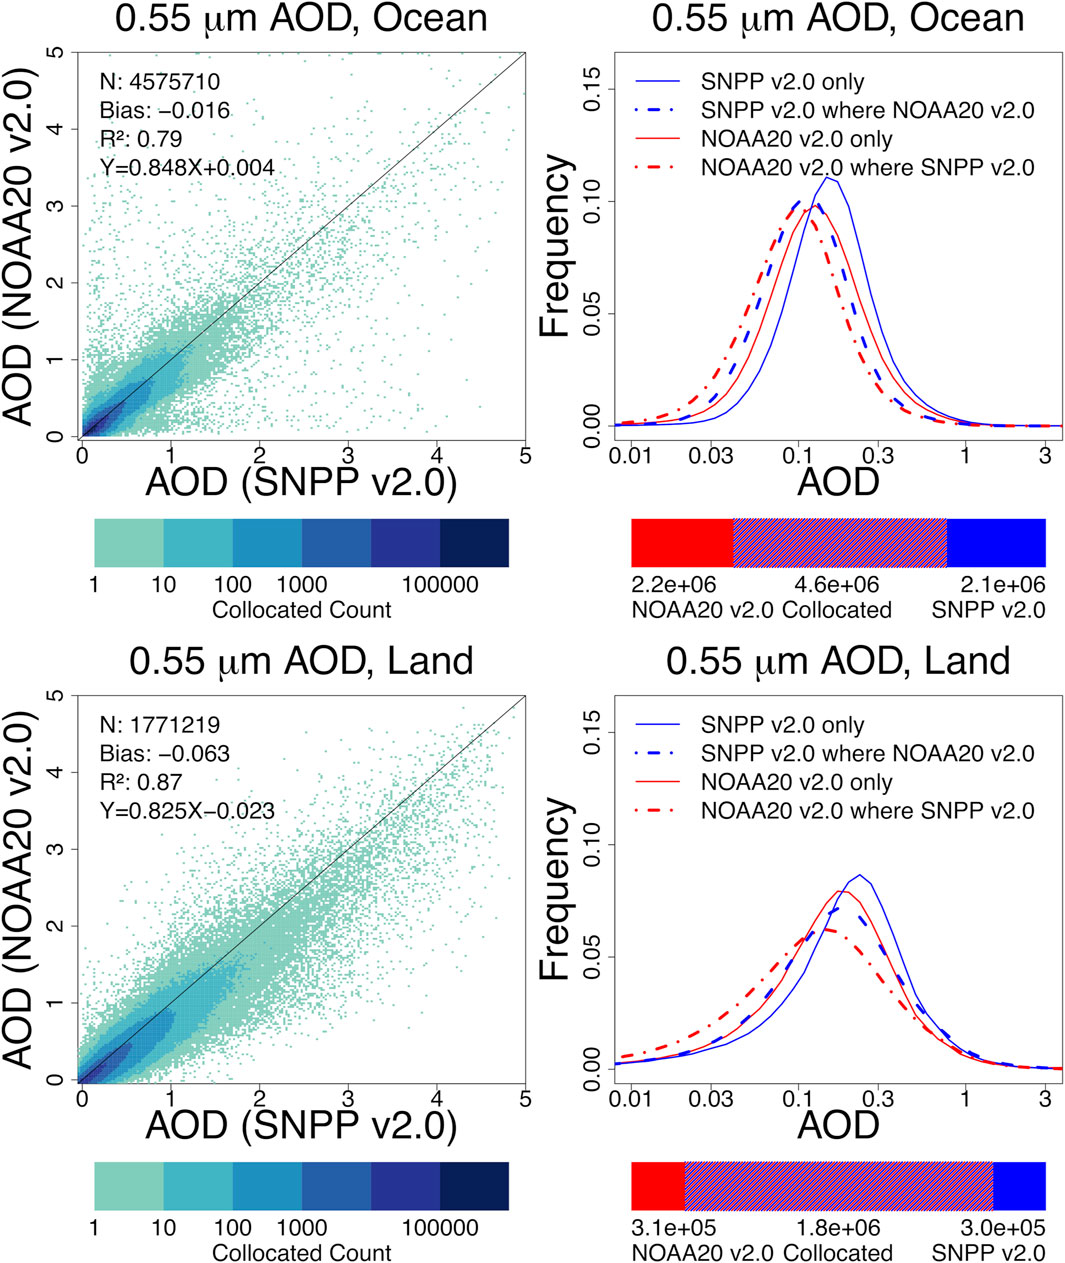
Figure 2. Comparison of daily average 1°×1° gridded AOD between version 2.0 for VIIRS SNPP and VIIRS NOAA-20, also for all days in 2019. Left, scatterplots of collocated grid cells; right, histogram frequencies where both sensors have a valid retrieval (dotted lines) and where only one sensor does (solid lines). The horizontal bar on the right indicates the number of collocated and non-collocated grid cells. Top, over ocean; bottom, over land.
From the gridded L3, we can conclude that V2.0 for SNPP VIIRS likely reduces overall AOD slightly from V1.1, and that NOAA 20 has lower overall AOD values than SNPP. However, the only way to assess whether V2.0 is an improvement and whether either SNPP or NOAA-20 is “biased” is to compare with ground truth. Here, we compare with the global network of ground based AERONET (Giles et al., 2019). Note that since no calibration updates have been applied to SNPP in V2.0 (although they will be in V2.1, to be discussed in section 5) we expect the overall high bias compared to AERONET (Sawyer et al., 2020) to remain. For the analyses presented here, we evaluate the separately derived land and ocean retrievals as well as the combined QA-filtered product, using a 2-year (2019-2020) subset of the data from both sensors.
Table 1 shows the statistical results of validation using collocation with AERONET sites. Shi et al. (2024) conducted new sensitivity studies for validation involving the geostationary imagers ABI and AHI, which have much higher temporal resolution than MODIS and VIIRS. Although the collocation criteria of ±30 min and 27.5 km used in previous studies is still appropriate for VIIRS, here we use a smaller window suitable for validation among all four sensors. A satellite AOD retrieval is therefore considered collocated if it occurs within ±15 min and 20 km of an AERONET site.

Table 1. AERONET validation statistics for SNPP v1.1, SNPP v2.0, and NOAA-20 v2.0, separated over ocean and over land.
The expected error (EE) is defined as ±(0.05 + 15%) of the AERONET AOD; N is the number of collocated points; and the coefficient of determination (R2), bias, and root mean square error (RMSE) are calculated relative to the linear regression between satellite and AERONET AODs.
The analysis is done separately for land and ocean, collocating satellite retrievals over ocean with coastal or island AERONET sites; sample sizes are therefore larger for the land retrievals. Compared with version 1.1, version 2.0 for SNPP shows a greater number of individual collocated retrievals and reduced bias over ocean, and slightly improved overall performance over land. NOAA-20 shows consistently lower bias compared to AERONET than SNPP, and it keeps a higher percentage of retrievals within the expected error.
3 Global trends
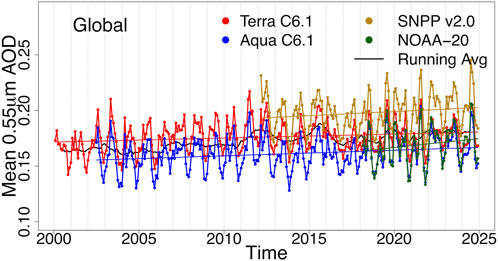
Daily gridded average AODs for MODIS and VIIRS are aggregated into monthly gridded averages to analyze long-term trends, using similar logic to the MODIS level 3 daily and monthly products as described in Sawyer et al. (2020). On an area-weighted global average, AOD shows seasonal variation, but only slight upward trends over the length of the MODIS records; the VIIRS records are still too short for statistical significance (Figure 3). Each sensor is offset from the others by an amount that remains relatively constant over time.
However, the globally averaged AOD can obscure trends that occur on regional scales, especially if aerosol is increasing in some parts of the world and decreasing in others. In Figure 4, a simple linear regression is taken for the monthly average AOD in each 1° × 1° grid cell, starting from the beginning of the Aqua data record in July 2002 and ending with the monthly average for June 2023. This ensures that the Terra and Aqua trends are compared over the same period and that all four seasons are represented equally. The slope of the regression, which measures the change in AOD per year over the 21-year period, is plotted only if the linear regression also meets a significance threshold of p ≤ 0.01. We chose a strict p-test threshold to compensate for the temporal autocorrelation of the AOD record, which may cause linear regression to return overly confident trends (Ives et al., 2021). Despite the differences between Terra and Aqua and a data record that is still several years short of the GCOS minimum, the two sensors agree on the spatial extent and even the magnitude of many regional aerosol trends.
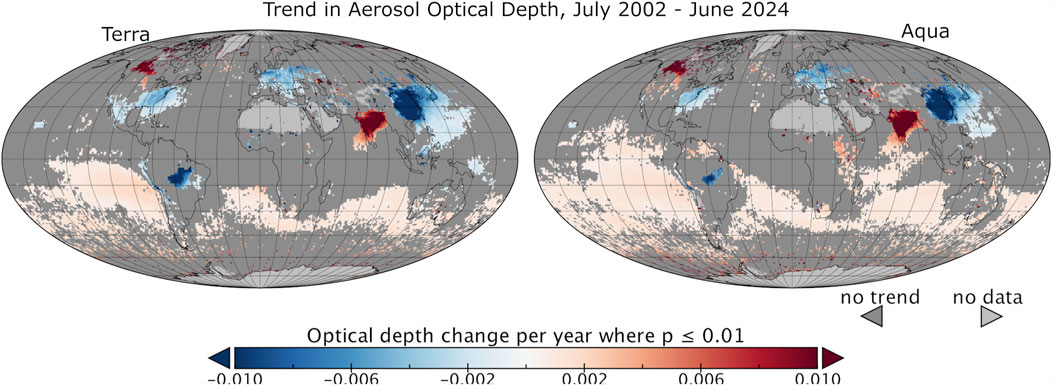
Figure 4. Regional trends in AOD for Terra (left) and Aqua (right) over the period from the start of the Aqua record through June 2023. Grid cells where p > 0.01 are plotted in darker gray than grid cells where there were no retrievals. High-latitude trends are plotted despite sample sizes that may be very small.
It would be useful to know whether these regional trends in AOD correspond to trends in other aerosol parameters, such as particle size, which would provide insight on possible changes in aerosol composition or type as well as aerosol loading. The Ångström exponent (AE) is an indicator of aerosol size based on the spectral dependence of AOD, which in turn depends on the modeled aerosol mixture that best fits the signal; the Dark Target retrieval reports AE over ocean based on the AOD at 0.55 μm and 0.86 μm. Gridded average values are calculated by applying the AE equation to gridded average AODs, not by averaging level 2 AE values. Although land has higher uncertainty, for the purposes of this study we have calculated AE over land based on the AOD at 0.47 μm (MODIS) or 0.48 μm (VIIRS) and 0.67 μm. A trend toward larger AE values over time would imply a trend toward finer particles, whereas a trend toward smaller AE values would imply coarser particles over time. In Figure 5 we perform an analysis of trends in AE as we did for AOD, with the linear regression in each 1° × 1° grid cell.
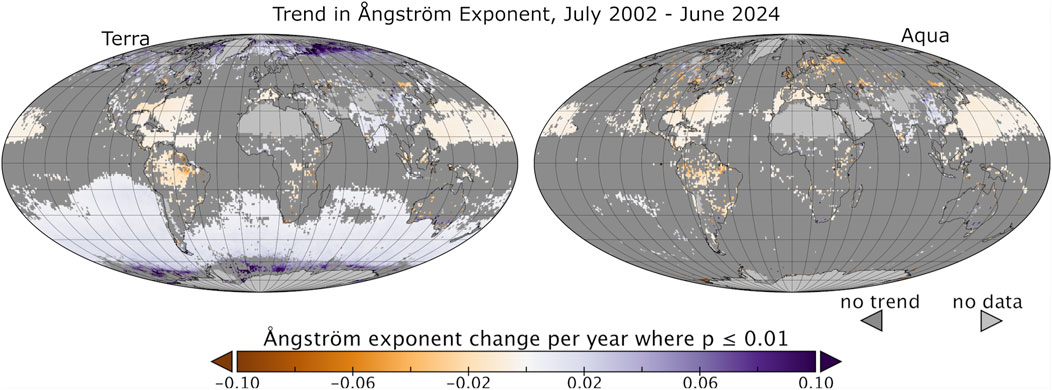
Figure 5. Regional trends in Ångström exponent for Terra (left) and Aqua (right) over the period from the start of the Aqua record through June 2023.
There are regions in which the two sensors agree. Both identify a shift from fine particles to coarse particles over the ocean adjacent to the North American east coast and Caribbean Sea. This could be a decrease in pollution particles, giving way to domination by larger particles such as sea salt and transported Saharan dust. Both see other shifts to larger particles (or decrease in smaller particles), namely, South America and a band across the north subtropical Pacific Ocean. Both sensors note the opposite trend of shifting to smaller particles over southeast Asia and to a lesser extent over India. However, there is less agreement in AE trends overall than for AOD trends. The areas of disagreement include Europe, northern boreal Asia and adjoining oceans and most glaring, the Southern Ocean. Because AE is calculated from nuanced difference in the retrievals of two wavelength channels, the parameter is especially sensitive to instrument calibration of these two channels. The uncertainty in the calibration of each wavelength contributes to the spread of the points in the single wavelength AOD validation plots of Figures 1, 2, but as we see from those plots that the spread of those points is manageable. Nevertheless, there will be much greater uncertainty in the retrievals of the spectral dependence of the AOD, which translates into much greater uncertainty in the AE and trends of AE, especially when AOD and aerosol signal is low.
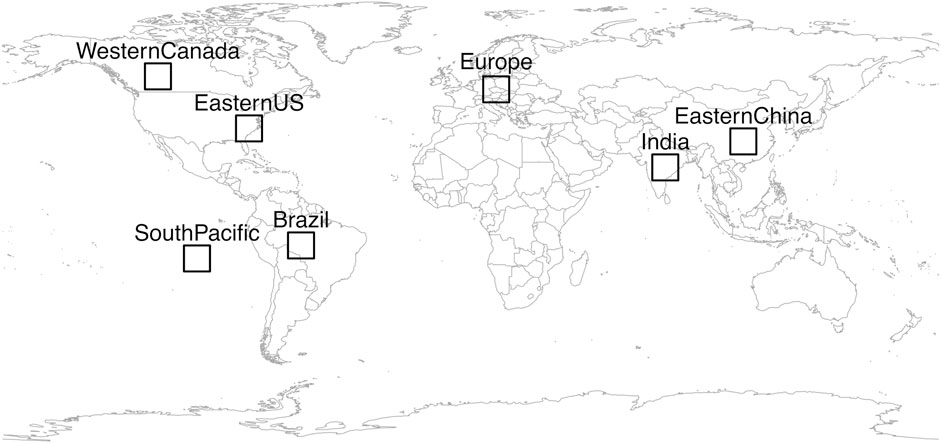
In addition to maps of global trends, six regions with significant trends are chosen for further investigation. For each region shown in Figure 6, a 10° × 10° area is averaged together to produce time series of AOD over land and ocean. To keep the sampled area consistent between regions, we use the QA-filtered combined land and ocean product for this analysis.
4 Regional trends
4.1 Seasonal trends
Aerosol composition and loading are often driven by seasonal events, and it is not surprising that the regional AOD trends shown in Figure 4 also vary by season. As with the full-year trend analysis, Figures 7, 8 show that Terra and Aqua show good agreement on the location and magnitude of seasonal AOD trends. However, the division into seasons suggests a way to group the regional trends listed in Figure 6. For western Canada and for Brazil, the annual AOD trend is dominated by trends during the regions’ respective wildfire or biomass burning seasons (albeit with somewhat spotty sampling early in the Canadian spring, as shown in Figure 10B) while for the eastern US and for much of Europe, the AOD trend comes from trends in boreal spring and summer. Eastern China and India are the only two regions that show strong AOD trends across more than two seasons.
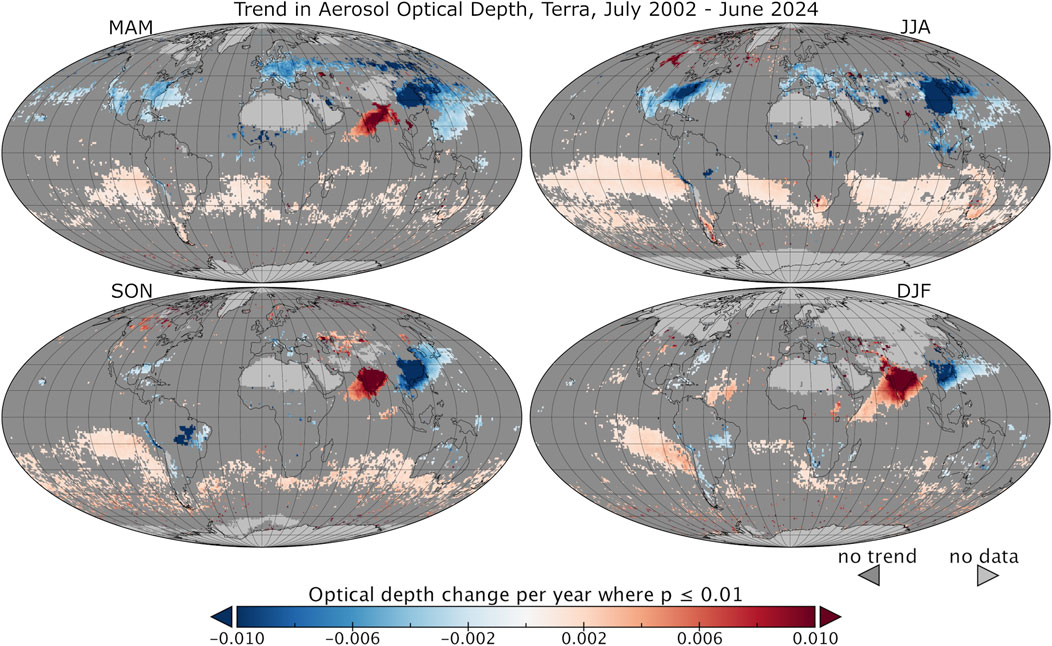
Figure 7. Regional trends in AOD for Terra, divided by season: MAM = March-May, JJA = June-August, SON = September-November, and DJF = December-February.
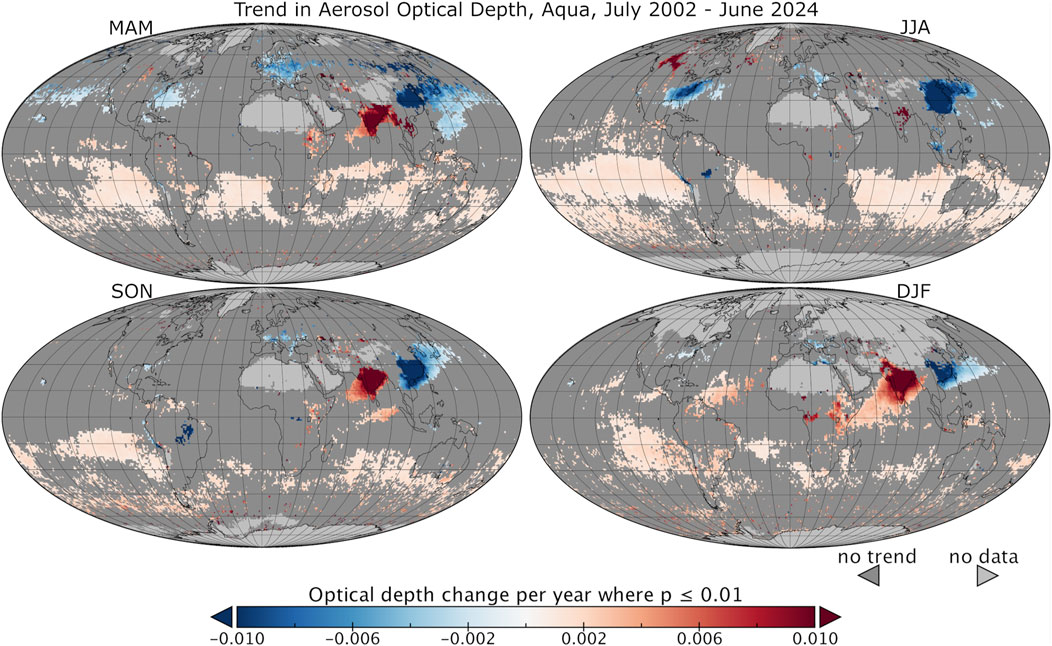
Figure 8. Regional trends in AOD for Aqua, divided by season: MAM = March-May, JJA = June-August, SON = September-November, and DJF = December-February.
4.2 Trends since SNPP
The VIIRS SNPP record begins in April 2012, approximately halfway through the period since the beginning of the MODIS Aqua record. Because there are half as many months from which to draw trends, Figure 9 shows fewer regions meeting the significance threshold, generally those that have the fastest rates of change in the MODIS record. However, regional trends since the start of the Aqua record do not necessarily follow the same linear slope throughout, and the 12-year trend may be very different from the 22-year trend from the same region. Individual regional timeseries can more accurately show when changes in aerosol have begun. The timeseries can also include VIIRS NOAA-20, which has too short a record so far to show trends of its own, but which follows the last few years of the other sensors.
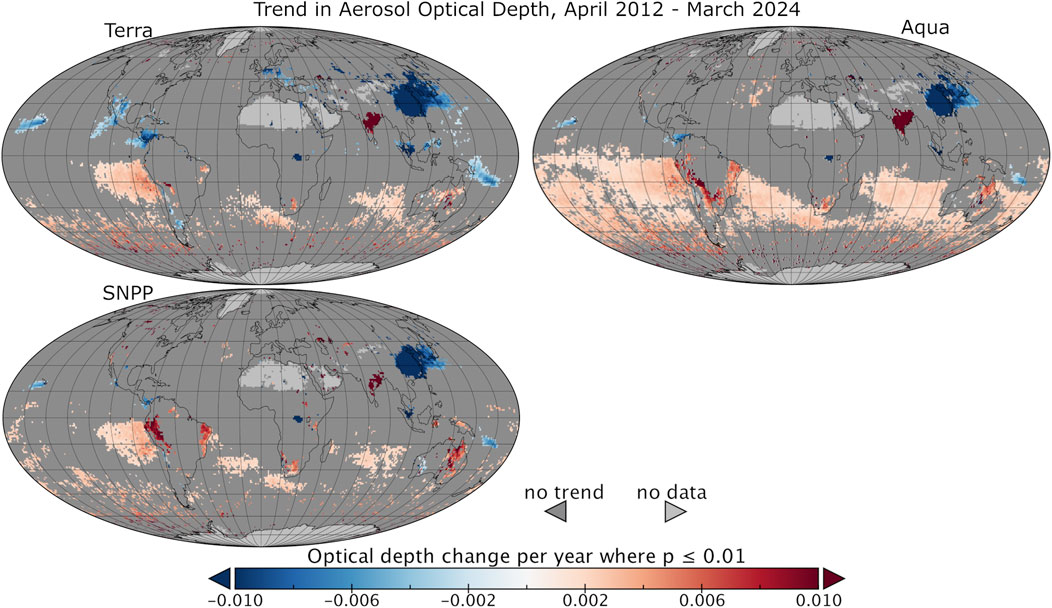
Figure 9. Regional trends in AOD for Terra, Aqua, and SNPP over the 12-year period from the start of the SNPP record through March 2023.
There are only two widescale trends seen during the VIIRS SNPP era: a strong decrease of aerosol in China and a modest but broad increase of aerosol over the southern hemisphere oceans. The decrease of AOD in China since 2012 is a well-reported phenomena (Aas et al., 2019; Wang et al., 2019; Gupta et al., 2023) that is linked directly to Chinese air pollution policies that were first defined in 2006 and implemented in each subsequent year (Zhao et al., 2017). The VIIRS SNPP time series kicks in just as China’s air pollution policies become fully effective and thus catches the strongest downward trends of the 21-year record (Sogacheva et al., 2020). The increase in aerosol over the southern hemisphere oceans is less obvious and will be discussed further in Section 4.6.
The fact that only two areas of aerosol trend are seen during the SNPP time series but others are seen in the longer time series indicate that much of the change in the aerosol system has happened during the first half of the Terra/Aqua record. Some of that can be attributed to U.S. and Europe pollution controls that were implemented early in the Terra/Aqua record and have been steadily curtailing emissions of particle pollution precursors ever since. This will be discussed further in Section 4.4. India’s strong positive trend seen consistently in all long-term trend analyses is less conspicuous in the truncated time series that begins in 2011. That could be due to insufficient signal to meet the significance threshold, but it could also indicate that aerosol loading over India, like China in 2006, has reached a peak and is beginning to decrease due to implementation of air quality regulations (Chowdhury et al. (2019). This will be discussed further in Section 4.5.
South America provides a most interesting case in which the sign of its aerosol trend changes from negative to positive, depending on whether the 22-year or 12-year time series is examined. This points to the strong interannual variability rather than linear trend of the region’s biomass burning (Koren et al., 2007; Pérez-Ramírez, 2017).
4.3 Fire seasons
Trends where smoke from wildfire or biomass burning drives the regional aerosol are visible only during fire seasons, which are austral spring for Brazil and boreal summer for western Canada (Figure 10). In both regions, autumn and winter remain nearly flat over the 20-year MODIS/VIIRS period, and the fire seasons show high interannual variability. In these regions trends are dominated by clusters of years with extreme smoke-producing seasons and are created by factors that either enhance or decrease the probability of having an extreme smoke season. These factors include interannually varying meteorological conditions, and to a lesser extent, governmental policy that enforces regulations on agricultural burning (Koren et al., 2007) and wildfire mitigation efforts. In Brazil, a cluster of extremely smoky years in the early period of the time series have been followed by much less frequent and less extreme seasons, thus, producing a negative trend over the Terra/Aqua time series but a weakly positive time series over the SNPP time period.
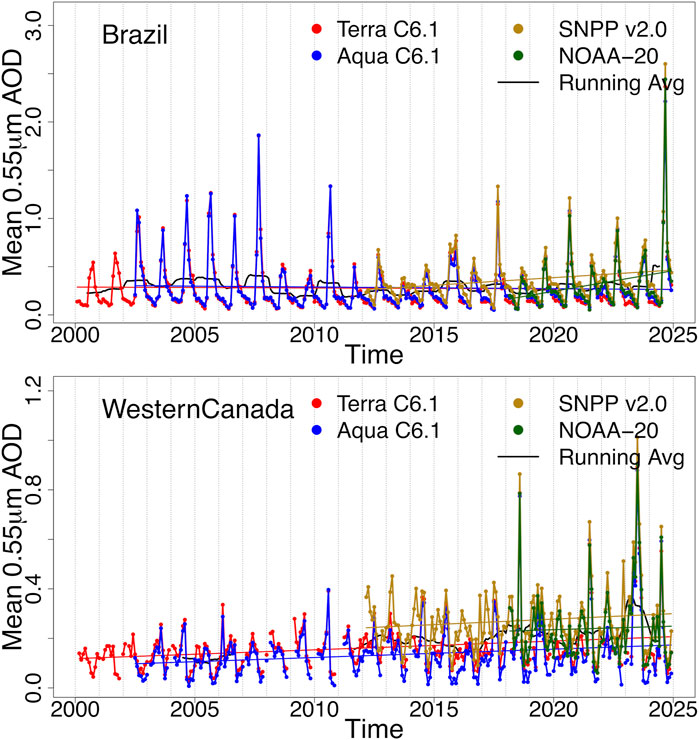
Figure 10. Monthly average aerosol optical depth at 0.55 μm and its linear regression over Brazil (top, 5°–15° S and 55°–65° W) and western Canada (bottom, 50°–60° N and 110°–120° W) for Terra, Aqua, SNPP, and NOAA-20, and the 12-month running average for all available sensors.
In western Canada, the extreme years are found towards the end of the time series, creating a positive trend. While some question the role of climate change having a controlling influence on the frequency and severity of wildfires (Doerr and Santín, 2016), others have attributed the increase of wildfires in western Canada to climate change factors including warmer temperatures, lower humidity and stronger surface winds (Cunningham et al., 2024). If climate change is indeed a controlling factor then the positive trend in smoke aerosol from temperate and boreal forest fires should continue forward, but the unpredictability of the interannual meteorological circumstances conducive to fires lessens confidence.
4.4 Steady industrial reductions
The eastern US and Europe (Figure 11) were once dominated by sulfate aerosols produced by burning fossil fuels from industrial and transportation sources. Over the past 70 years government regulations in both regions have imposed and enforced air quality standards that have substantially reduced emissions over time. In the U.S. stronger standards imposed since the year 2000 have resulted in noticeable improved air quality, including particulate pollution following (https://www.epa.gov/clean-air-act-overview/progress-cleaning-air-and-improving-peoples-health#pollution). In Europe, the time series covers the period (2004) in which ten new countries from the former eastern bloc joined the European Union (EU), putting themselves under EU air quality standards for the first time, which contributed to strong decreases in particulate emissions. This steady March towards cleaner air show steadier trends in AOD than the variable fire seasons elsewhere in the world. Both eastern U.S. and Europe show the most significant downward trends in spring and summer (Figures 7, 8) because of the association between humid conditions and hygroscopic growth of the sulfate aerosols—since AOD is related more closely to the cross-sectional area of the particles than the number of particles, aerosol has decreased more significantly during the summer. Interannual variability is less than that seen in smoke regions and less than the typical difference between seasons within the same year. Both regions have reduced industrial emissions since before the MODIS record began in 2000, but a flattening in each timeseries since about 2010 explains the lack of a significant trend for either region in the SNPP record (Figure 9). Unusually high AODs in the summer of 2021 may be due to transported wildfire smoke affecting both regions (Farruggia et al., 2024).
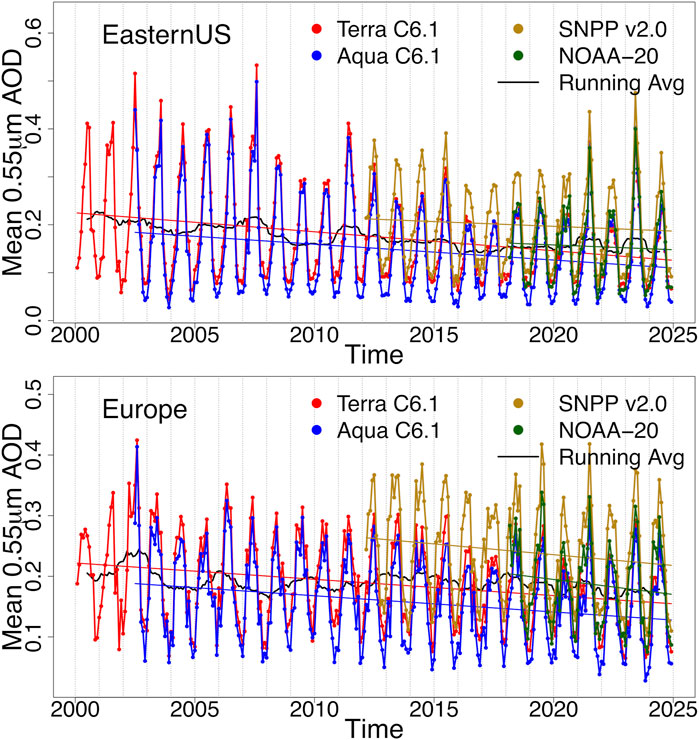
Figure 11. Monthly average time series and linear regression for the eastern United States (top, 30°–40° N and 75°–85° W) and for Europe (bottom, 45°–55° N and 10°–20° E).
4.5 China and India
Unlike the regions already discussed in sections 4.3 and 4.4, eastern China and India (Figure 12) show significant trends in AOD across all four seasons and in both the 22-year trend since 2002 and the 12-year trend since 2012. Although AOD is still generally lower in autumn and winter than in spring and summer, the seasonal cycles are less regular than they are for other regions. As before we note the strong downward trend of AOD in China following the implementation of the 11th (2006–2010) and 12th (2011–2015) 5-year plans that called for a reduction in air pollution (Zhao et al., 2017). MODIS suggests that AOD has a generally upward trend from 2000 to 2006, a plateau during implementation of two 5-year plans, and then trends down from 0.6 to 0.4 during 2014–2022. This AOD is still significantly higher than the ∼0.15 seen in the eastern U.S. and Europe, suggesting that China still has room to improve air quality. Thus, the downward trend seen since 2014 could continue into future decades, depending on policy rather than meteorological factors.
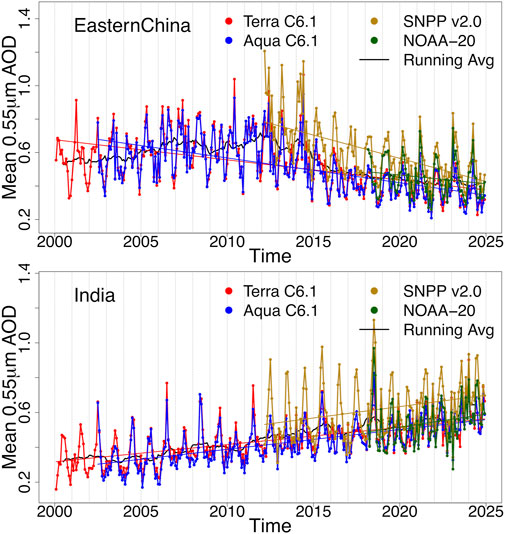
Figure 12. Monthly average time series and linear regression for eastern China (top, 25°–35° N and 105°–115° E) and for India (bottom, 15°–25° N and 75°–85° E).
India’s story may be similar to China’s but lagging by 10 years. MODIS shows that India experienced a continued upward trend of AOD between early 2000s and late 2010s, rising from ∼0.35 to ∼0.5. This rise appears as the strong regional linear trend in Figures 4, 7, 8 in every season except JJA when summer monsoons both clean the air and obscure satellite views of the aerosols. Since about 2018, the mean AOD has generally plateaued. This may indicate that Indian policy initiatives encouraging a switch from domestic use of solid fuels to cleaner fuels and electrification of rural villages (Chowdhury et al., 2019) is affecting the AOD. If so, the steep upward trend seen in AOD over the Indian subcontinent over the Terra/Aqua satellite record may be permanently ending.
4.6 Southern hemisphere ocean
The modest upward trend of AOD that covers much of the southern hemisphere oceans, is both consistent and surprising. The trend appears similarly in the 12-year record for both Aqua and SNPP, and to a lesser extent on an annual basis in Terra (Figure 9). The trend appears in Aqua’s 22-year record and even appears widespread in Terra’s MAM and JJA record (Figures 3, 7, 8). Although all have different sampling methods over different study periods and groupings of sensors, previous studies have shown AOD trends in this region. Quaas et al. (2022) see the oceanic AOD trend clearly in their analysis of MODIS time series (Terra and Aqua sensors averaged together, 2000–2019) but find the opposite trend over the southern hemisphere oceans in their parallel analysis of data from the Multi-angle Imaging Spectroradiometer (MISR) that orbits along with MODIS on the Terra platform. Gui et al. (2021) also find a modest negative trend over parts of the oceans in MISR’s 2001–2018 time series. Sogacheva et al. (2020) see a modest increase of AOD over the global oceans from 2000 to 2017 using their merged product that includes data from 16 different aerosol products, MODIS and MISR included. Interestingly, the Quaas et al. (2022) analysis attribute the increase of oceanic total AOD to an increase of fine mode. From Figure 5, Terra seems to indicate an increase in fine mode AOD but not Aqua.
To further explore this puzzling trend in the Dark Target product, a time series for a region representative of the trend in the South Pacific is shown in Figure 13. The region is to the west of the South American coast, with the coordinates 10°–20° S and 95°–105° W. A positive trend of ∼13% is seen in the Terra and Aqua 22-year time series and ∼20% in the 12-year SNPP record.
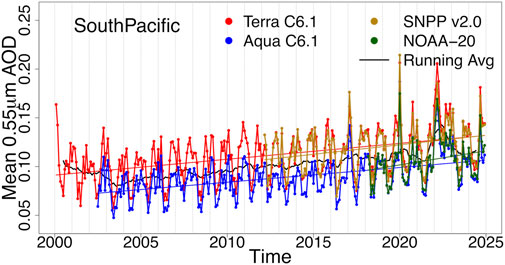
Figure 13. Monthly average time series and linear regression for a 10° × 10° region over the South Pacific (10°–20° S and 95°–105° W).
There are several possibilities that could explain this widespread, modest trend in AOD. The first is a satellite artifact such as calibration drift. Such a drift could affect a single wavelength band, creating an illusion of greater spectral dependence that would be interpreted by the algorithm as an increase in fine mode AOD. However, it would be odd, although not impossible, for all three sensors to suffer from the same artifact. Alternatively, the trend may be a physical reality. This could be an actual increase in aerosol, or it could be something else, such as cloud changes or ocean reflectance changes that masquerade as an increase in aerosol in the AOD product.
If the calculated trends were a true increase in aerosol, then carefully selected long term AERONET stations should also measure a trend. There are very few AERONET stations with a long-term record situated on islands or on the coast intersecting the satellite-identified positive trend. We examined four of those stations (Reunion St Denis, Amsterdam Island, San Cristobal, American Samoa) some on the periphery of the satellite-defined positive trend zone, two with records that began in the SNPP era and only two with longer records that might be compared with Terra or Aqua. We focused on the June-July-August season, since that season appeared to have the most widespread and strongest signal across all satellites. None of the four AERONET stations showed a statistically significant linear trend in AOD no matter when we began or ended the time series. This suggests but does not prove that there has been no true AOD increase across the southern hemisphere oceans. We note that although the AERONET analysis was inconclusive, AERONET seasonal mean AOD at 500 nm for June-July-August is higher than other years. For example, at Reunion St Denis in the Indian ocean, off the coast of Madagascar, the 2022 value is 0.079 as compared to an average of 0.049 for the 10 years preceding 2022. This is insufficient to create a statically significant trend in the AERONET time series but is still notable. The AERONET analysis makes no suggestion concerning the possibility of physical changes that may be affecting the retrieval such as changes to clouds or to ocean color. The AERONET analysis is limited to only four locations, some only marginally intersecting the zone of positive AOD trend in the satellite data.
To understand the trend in the Southern Hemisphere ocean, we consider the time series as two sections, the 12-year time period of the SNPP time series (2012–2024) and the 10-year time series previous to this period when only Terra and Aqua were flying (2002–2012). Both periods exhibit an upward trend. The trend in the latter period is driven by spikes appearing at the end of the time series (e.g., 2020), and then the 2022–2023 period when the seasonal low AOD completely disappears resulting in much higher annual mean AOD. The spikes can be attributed to smoke transport from severe Australian wildfires inputting particles into the stratosphere (Hirsch and Koren, 2021) while the 2022–2023 period corresponds to the eruption of the underwater volcano Hunga-Tonga-Ha’apai located at (21°S, 175°W). The volcanic eruption also sent tons of volcanic material into the stratosphere (Carr et al., 2022; Legras et al., 2022). The sulfur and water vapor combined to create a stratospheric plume of sulfate aerosol that circumnavigated the earth and by May had spread out latitudinally from the equator to 60oS (Legras et al., 2022; Zhu et al., 2022), persisting to at least October 2022 (Zhu et al., 2022).
While elevated aerosol in the stratosphere from severe Australian fires (Hirsch and Koren, 2021) and the Hunga Tonga volcanic explosion (Carr et al., 2022; Legras et al., 2022) are likely explanations for the widespread positive trends seen by all three sensors in their 2012–2024 time series, these latter day events cannot explain the slow upward trends found by satellite analysis that conclude before 2020 (Sogacheva et al., 2020; Quaas et al., 2022). The fact that the two MODIS sensors (Terra and Aqua) see an upward trend while the Terra MISR sensor registers a downward trend (Quaas et al., 2022; Gui et al., 2021) for the same time period suggests a calibration drift common to the MODIS characterization procedures and perhaps a different one employed by the independent MISR team. However, this is speculation. At this point we have no conclusive explanation for the upward trend in AOD for the 2002 to 2012 period. Information from other sensors may provide needed perspective.
5 Discussion and conclusion
Although the Terra and Aqua MODIS time series has exceeded all expectations in terms of length of service, their decommissionings will disrupt the possibility for a 30+ year time series of aerosol loading from a single sensor. Even before the end of their data records, beginning in 2021, the equatorial crossing times for Terra and Aqua are both drifting farther from solar noon. We expect that sampling and retrieval statistics should also begin to show drift regardless of true trends.
However, the Dark Target aerosol product will not end with Terra and Aqua, because the algorithm applied to VIIRS inputs can continue the time series with sufficient consistency. Although there are currently offsets in AOD between the different sensors (NOAA-20 closely matching Aqua, Terra offset higher by ∼0.015 and SNPP highest of all), the overall picture of the aerosol system, its seasonal fluctuations and its long-term trends will not change. For applications such as CERES that require a single self-consistent aerosol record, it is important to decide on a period of overlap between MODIS and VIIRS (Aqua and NOAA-20 having the best correspondence to AERONET) to determine true continuity of observations. Future calibration updates (on the order of 2% or less) should remove most remaining offsets. Thus, as we move into the 2030s and beyond, we have high confidence that NOAA-21, JPSS-3, and JPSS-4 can sufficiently continue the long-term record for AOD to enable monitoring continuing changes to the aerosol loading on a changing planet.
Daily and monthly gridded average data will soon be available as a level 3 VIIRS product. Unlike the MOD08/MYD08 products for MODIS, VIIRS Dark Target will have its own level 3 products separate from other atmospheric retrievals that have made the port from MODIS to VIIRS.
In addition, version 2.1 of the level 2 VIIRS Dark Target product is nearing release. Kim et al. (2024) details a more sophisticated surface reflectance parameterization that is added to the algorithm for all sensors. Combined with cross-calibration coefficients to bring the input reflectances closer to MODIS Aqua, this reduces the high bias in the SNPP record compared to AERONET. Version 2.1 will also retrieve aerosol from VIIRS NOAA-21, which launched in 2019 in the same orbit: NOAA-21 is now a half-orbit (about 50 min) ahead of NOAA-20, with SNPP midway between the other two spacecraft. For consistency among sensors, the same algorithm updates used in VIIRS Version 2.1 will be included when the MODIS record is reprocessed for Collection 7.
The Ångström exponent and any other size parameter that relies on spectral dependence for its signal are much more susceptible to small deviations in calibration of individual bands. We are less confident that there can be a smooth transition from the MODIS era to the VIIRS era for aerosol size parameters.
With the time series we have now, 22 years for Terra/Aqua MODIS and 12 years for SNPP VIIRS, we clearly see the regional distribution of AOD trends. With only half as long a record to draw from, fewer trends are visible in the record since the beginning of SNPP than since the beginning of Aqua. Regional trends that meet the significance threshold over the shorter period tend to be those that show changes in AOD throughout the year rather than restricted to one or two seasons.
Much of the globe does not show significant trends over either period, which includes most of the traditional dusty regions. This may mean that although there is heavy variability of dust source availability and meteorology, the process that activates, transports and transforms dust particles have not exhibited any changes in either the 22-year or 12-year data records. Urban/industrial aerosol from the developed world showed strong decreases during the first 10 years of the 22-year record and then plateaued at very low aerosol loadings. Meanwhile, during those first 10 years, China began the process to clean up its air pollution so that a strong downward trend ensued during the later 12-year time period. Concurrently, India saw aerosol loading growing as a result of economic development. However, during the last few years, there are signs that India is plateauing, and we could be watching for a decrease in AOD in India over the next decade. Fire regions show interannual variability, which appears to dominate over trending. However, western Canada clearly shows larger AOD spikes near the end of the record.
The AOD over the southern hemisphere oceans remains puzzling. The stratospheric aerosol input by the Hunga Tong eruption and the 2019–2020 bushfire season may contribute, especially for the shorter time series that begins with the SNPP record, but is likely not the full story. Calibration drift could be possible for the Terra and Aqua sensors. The southern hemisphere oceanic 22-year upward trend is noted but will remain a puzzle at this time. Other factors that may affect aerosol sampling or retrieval, such as changes in cloud cover—and in the frequency of aerosol retrieval at cloud edges—during the MODIS record, may shed more light on the apparent regional trend.
Fire smoke aerosol is the portion of the aerosol system to keep an eye on in coming decades. Interannual variability in smoke regions is so strong that it is too soon to identify a true climate change in smoke frequency or loading despite popular media reporting on increasing frequency of smoke events, locally. Tropical biomass burning such as in South America and Africa is linked to agricultural practices and is thereby under some human control and governmental policy. We have seen how policy can introduce cessation of upward trends and institution of downward trends on the order of decades for urban/industrial aerosol. Similar willful policy might change smoke aerosol production in these tropical regions. Wildfire smoke originating in temperate and boreal forests is less controllable. The five strongest smoke seasons in western Canada have all occurred since 2018, suggesting the possibility of either an upward trend or a step function of increase in AOD in that area.
Knowing aerosol trends well enough to make decadal-long forecasts into the future is an essential component of estimating the severity and timing of climate change. As most aerosol trends have been downward over the length of the satellite record and because aerosols generally impose a cooling on the planet, an important negative forcing has been eliminated. This may have contributed to the acceleration of the increase in global temperature in recent decades. As we move forward, we need to monitor aerosol changes and trends on a global basis but from a regional perspective, keeping an eye out for changes in policies and natural processes that may create aerosol changes. Here we have shown that the satellite record on aerosol loading can be continued into the VIIRS era, so that we have the tools to continue this important monitoring.
Data availability statement
The original contributions presented in the study are publicly available. This data can be found here: NASA's LAADS DAAC, https://ladsweb.modaps.eosdis.nasa.gov/.
Author contributions
VS: Writing – review and editing, Writing – original draft, Software, Visualization, Formal Analysis. RL: Funding acquisition, Writing – review and editing, Conceptualization. SM: Data curation, Writing – review and editing, Software. YS: Validation, Writing – review and editing. MK: Writing – review and editing, Formal Analysis. LR: Writing – review and editing. GC: Resources, Data curation, Writing – review and editing.
Funding
The author(s) declare that financial support was received for the research and/or publication of this article. Maintenance of the MODIS aerosol product is funded by: NASA’s Terra and Aqua Senior Review: Algorithm Maintenance. Work on VIIRS is supported by: NASA’s NNH20ZDA001N-SNPPSP: A.52 NASA Suomi National Polar-Orbiting Partnership (NPP) and the Joint Polar Satellite System (JPSS) Satellites Standard Products for Earth System Data Records.
Acknowledgments
The GEOS data used in this study have been provided by the Global Modeling and Assimilation Office (GMAO) at NASA Goddard Space Flight Center. Thank you to the MODIS Adaptive Processing System (MODAPS at NASA Goddard) and the Atmosphere-Science Investigator-led Processing System (A-SIPS at the University of the Wisconsin) for standard-product MODIS and VIIRS processing, and to NASA’s Level-1 and Atmosphere Archive and Distribution System Distributed Active Archive Center (LAADS DAAC) for hosting the products.
Conflict of interest
The authors declare that the research was conducted in the absence of any commercial or financial relationships that could be construed as a potential conflict of interest.
Generative AI statement
The author(s) declare that no Generative AI was used in the creation of this manuscript.
Publisher’s note
All claims expressed in this article are solely those of the authors and do not necessarily represent those of their affiliated organizations, or those of the publisher, the editors and the reviewers. Any product that may be evaluated in this article, or claim that may be made by its manufacturer, is not guaranteed or endorsed by the publisher.
References
Aas, W., Mortier, A., Bowersox, V., Cherian, R., Faluvegi, G., Fagerli, H., et al. (2019). Global and regional trends of atmospheric sulfur. Sci. Rep.-UK 9, 953. doi:10.1038/s41598-018-37304-0
Aryal, Y. N., and Evans, S. (2021). Global dust variability explained by drought sensitivity in CMIP6 models. J. Geophys. Res. Earth Surf. 126, e2021JF006073. doi:10.1029/2021JF006073
Bao, Z., Zhu, C., Hulugalla, R., Gu, J., and Di, G. (2008). Spatial and temporal characteristics of aerosol optical depth over East Asia and their association with wind fields. Metall. Apps 15, 455–463. doi:10.1002/met.87
Bauer, S. E., Tsigaridis, K., Faluvegi, G., Nazarenko, L., Miller, R. L., Kelley, M., et al. (2022). The turning point of the aerosol era. J. Adv. Model. Earth Syst. 14, e2022MS003070. doi:10.1029/2022MS003070
Carr, J. L., Horváth, Á., Wu, D. L., and Friberg, M. D. (2022). Stereo plume height and motion retrievals for the record-setting Hunga Tonga-Hunga Ha'apai eruption of 15 January 2022. Geophys. Res. Lett. 49, e2022GL098131. doi:10.1029/2022GL098131
Cherian, R., and Quaas, J. (2020). Trends in AOD, clouds, and cloud radiative effects in satellite data and CMIP5 and CMIP6 model simulations over aerosol source regions. Geophys. Res. Lett. 47, e2020GL087132. doi:10.1029/2020GL087132
Chin, M., Diehl, T., Tan, Q., Prospero, J. M., Kahn, R. A., Remer, L. A., et al. (2014). Multi-decadal aerosol variations from 1980 to 2009: a perspective from observations and a global model. Atmos. Chem. Phys. 14 (7), 3657–3690. doi:10.5194/acp-14-3657-2014
Chowdhury, S., Dey, S., Guttikunda, S., Pillarisetti, A., Smith, K. R., and Di Girolamo, L. (2019). Indian annual ambient air quality standard is achievable by completely mitigating emissions from household sources. Proc. Natl. Acad. Sci. U.S.A. 116, 10711–10716. doi:10.1073/pnas.1900888116
Cunningham, C. X., Williamson, G. J., and Bowman, D. M. J. S. (2024). Increasing frequency and intensity of the most extreme wildfires on Earth. Nat. Ecol. Evol. 8, 1420–1425. doi:10.1038/s41559-024-02452-2
Doelling, D. R., Haney, C., Khakurel, P., Bhatt, R., Scarino, B., and Gopalan, A. (2024). Advanced Libya-4 radiometric and atmospheric characterization utilizing moderate resolution imaging spectroradiometer and visible infrared imaging radiometer suite full-scan reflective solar band measurements. J. Appl. Remote Sens. 18 (3). doi:10.1117/1.jrs.18.034511
Doerr, S. H., and Santín, C. (2016). Global trends in wildfire and its impacts: perceptions versus realities in a changing world. Phil. Trans. R. SocB 371, 20150345. doi:10.1098/rstb.2015.0345
Farruggia, M. J., Brahney, J., Tanentzap, A. J., Brentrup, J. A., Brighenti, L. S., Chandra, S., et al. (2024). Wildfire smoke impacts lake ecosystems. Glob. Change Biol. 30, e17367. doi:10.1111/gcb.17367
GCOS (2012). Systematic observation requirements for satellite-based data products for climate: 2011 Update. Geneva, Switzerland World Meteorological Organization. Available online at: http://www.wmo.int/pages/prog/gcos/Publications/gcos-154.pdf.
GCOS (2017). The global observing system for climate: implementation needs. Guayaquil, Ecuador WMO. Available online at: https://library.wmo.int/opac/doc_num.php?explnum_id=3417.
Giles, D. M., Sinyuk, A., Sorokin, M. G., Schafer, J. S., Smirnov, A., Slutsker, I., et al. (2019). Advancements in the Aerosol Robotic Network (AERONET) Version 3 database – automated near-real-time quality control algorithm with improved cloud screening for Sun photometer aerosol optical depth (AOD) measurements. Atmos. Meas. Tech. 12, 169–209. doi:10.5194/amt-12-169-2019
Gui, K., Che, H., Zheng, Y., Wang, Y., Zhang, L., Zhao, H., et al. (2021). Seasonal variability and trends in global type-segregated aerosol optical depth as revealed by MISR satellite observations. Sci. Total Environ. 787, 147543. doi:10.1016/j.scitotenv.2021.147543
Gupta, G., Ratnam, M. V., Madhavan, B. L., and Jayaraman, A. (2023). Global trends in the aerosol optical, physical, and morphological properties obtained using multi-sensor measurements. Atmos. Environ. 295, 119569. doi:10.1016/j.atmosenv.2022.119569
Gupta, P., Levy, R. C., Mattoo, S., Remer, L. A., and Munchak, L. A. (2016). A surface reflectance scheme for retrieving aerosol optical depth over urban surfaces in MODIS Dark Target retrieval algorithm. Atmos. Meas. Tech. 9, 3293–3308. doi:10.5194/amt-9-3293-2016
Gupta, P., Levy, R. C., Mattoo, S., Remer, L. A., Zhang, Z., Sawyer, V., et al. (2024). Increasing aerosol optical depth spatial and temporal availability by merging datasets from geostationary and sun-synchronous satellites. Atmos. Meas. Tech. 17, 5455–5476. doi:10.5194/amt-17-5455-2024
Hammer, M. S., van Donkelaar, A., Li, C., Lyapustin, A., Sayer, A. M., Hsu, N. C., et al. (2020). Global estimates and long-term trends of fine particulate matter concentrations (1998–2018). Environ. Sci. and Technol. 54 (13), 7879–7890. doi:10.1021/acs.est.0c01764
Hand, J. L., Schichtel, B. A., Malm, W. C., Copeland, S., Molenar, J. V., Frank, N., et al. (2014). Widespread reductions in haze across the United States from the early 1990s through 2011. Atmos. Environ. 94, 671–679. ISSN 1352-2310. doi:10.1016/j.atmosenv.2014.05.062
Hand, J. L., Schichtel, B. A., Malm, W. C., and Pitchford, M. L. (2012). Particulate sulfate ion concentration and SO2 emission trends in the United States from the early 1990s through 2010. Atmos. Chem. Phys. 12, 10353–10365. doi:10.5194/acp-12-10353-2012
Hirsch, E., and Koren, I. (2021). Record-breaking aerosol levels explained by smoke injection into the stratosphere. Science 371, 1269–1274. doi:10.1126/science.abe1415
IPCC (2021). in Climate change 2021: the physical science basis. Contribution of working group I to the sixth assessment report of the intergovernmental panel on climate change. Editors V. Masson-Delmotte, P. Zhai, A. Pirani, S. L. Connors, C. Péan, and S. Berger, (Cambridge, United Kingdom and New York, NY, USA: Cambridge University Press). doi:10.1017/9781009157896
Ives, A. R., Zhu, L., Wang, F., Zhu, J., Morrow, C. J., and Radeloff, V. C. (2021). Statistical inference for trends in spatiotemporal data. Remote Sens. Environ. 266, 112678. doi:10.1016/j.rse.2021.112678
Kanamitsu, M. (1989). Description of the NMC global data assimilation and forecast system. Weather Forecast 4, 335–342. doi:10.1175/1520-0434(1989)004<0335:dotngd>2.0.co;2
Kaufman, Y. J., Tanre, D., Remer, L. A., Vermote, E. F., Chu, A., and Holben, B. N. (1997). Operational remote sensing of tropospheric aerosol over land from EOS moderate resolution imaging spectroradiometer. J. Geophys. Res. 102, 17051–17067. doi:10.1029/96JD03988
Keeling, C. D., Piper, S. C., Bacastow, R. B., Wahlen, M., Whorf, T. P., Heimann, M., et al. (2001). “Exchanges of atmospheric CO2 and 13CO2 with the terrestrial biosphere and oceans from 1978 to 2000. I. Global aspects,” in SIO reference series, No. 01-06. 88 pages. San Diego: Scripps Institution of Oceanography. Available online at: http://escholarship.org/uc/item/09v319r9.
Kim, M., Levy, R. C., Remer, L. A., Mattoo, S., and Gupta, P. (2024). Parameterizing spectral surface reflectance relationships for the Dark Target aerosol algorithm applied to a geostationary imager. Atmos. Meas. Tech. 17 (7), 1913–1939. doi:10.5194/amt-17-1913-2024
Koren, I., Remer, L. A., and Longo, K. (2007). Reversal of trend of biomass burning in the Amazon. Geophys. Res. Lett. 34, L20404. doi:10.1029/2007GL031530
Kumar, M., Parmar, K. S., Kumar, D. B., Mhawish, A., Broday, D. M., Mall, R. K., et al. (2018). Long-term aerosol climatology over Indo-Gangetic Plain: trend, prediction and potential source fields. Atmos. Environ. 180, 37–50. doi:10.1016/j.atmosenv.2018.02.027
Legras, B., Duchamp, C., Sellitto, P., Podglajen, A., Carboni, E., Siddans, R., et al. (2022). The evolution and dynamics of the Hunga Tonga–Hunga Ha'apai sulfate aerosol plume in the stratosphere. Atmos. Chem. Phys. 22, 14957–14970. doi:10.5194/acp-22-14957-2022
Levy, R., Mattoo, S., Munchak, L., Remer, L., Sayer, A., Patadia, F., et al. (2013). The Collection 6 MODIS aerosol products over land and ocean. Atmos. Meas. Tech. 6, 2989–3034. doi:10.5194/amt-6-2989-2013
Levy, R. C., Leptoukh, G. G., Kahn, R., Zubko, V., Gopalan, A., and Remer, L. A. (2009). A critical look at deriving monthly aerosol optical depth from satellite data. IEEE Trans. Geoscience Remote Sens. 47 (8), 2942–2956. doi:10.1109/TGRS.2009.2013842
Levy, R. C., Mattoo, S., Sawyer, V., Shi, Y., Colarco, P. R., Lyapustin, A. I., et al. (2018). Exploring systematic offsets between aerosol products from the two MODIS sensors. Atmos. Meas. Tech. 11, 4073–4092. doi:10.5194/amt-11-4073-2018
Levy, R. C., Remer, L. A., and Dubovik, O. (2007a). Global aerosol optical properties and application to Moderate Resolution Imaging Spectroradiometer aerosol retrieval over land. J. Geophys. Res. 112, D13210. doi:10.1029/2006JD007815
Levy, R. C., Remer, L. A., Kleidman, R. G., Mattoo, S., Ichoku, C., Kahn, R., et al. (2010). Global evaluation of the Collection 5 MODIS dark-target aerosol products over land. Atmos. Chem. Phys. 10, 10399–10420. doi:10.5194/acp-10-10399-2010
Levy, R. C., Remer, L. A., Mattoo, S., Vermote, E. F., and Kaufman, Y. J. (2007b). Second-generation operational algorithm: retrieval of aerosol properties over land from inversion of Moderate Resolution Imaging Spectroradiometer spectral reflectance. J. Geophys. Res. 112, D13211. doi:10.1029/2006JD007811
Loeb, N. G., and Manalo-Smith, N. (2005). Top-of-Atmosphere direct radiative effect of aerosols over global oceans from merged CERES and MODIS observations. J. Clim. 18, 3506–3526. doi:10.1175/JCLI3504.1
Lucchesi, R. (2015). File specification for GEOS-5 FP-it. GMAO Off. Note No. 2 (Version 1.3), 60. Available online at: http://gmao.gsfc.nasa.gov/pubs/office_notes.
Lyapustin, A., Smirnov, A., Holben, B., Chin, M., Streets, D. G., Lu, Z., et al. (2011). Reduction of aerosol absorption in Beijing since 2007 from MODIS and AERONET. Geophys. Res. Lett. 38, L10803. doi:10.1029/2011GL047306
Lyapustin, A., Wang, Y., Choi, M., Xiong, X., Angal, A., Wu, A., et al. (2023). Calibration of the SNPP and NOAA 20 VIIRS sensors for continuity of the MODIS climate data records. Remote Sens. Environ. 295, 113717. 0034-4257. doi:10.1016/j.rse.2023.113717
Patadia, F., Levy, R. C., and Mattoo, S. (2018). Correcting for trace gas absorption when retrieving aerosol optical depth from satellite observations of reflected shortwave radiation. Atmos. Meas. Tech. 11, 3205–3219. doi:10.5194/amt-11-3205-2018
Pérez-Ramírez, D., Andrade-Flores, M., Eck, T. F., Stein, A. F., O'Neill, N. T., Lyamani, H., et al. (2017). Multi year aerosol characterization in the tropical Andes and in adjacent Amazonia using AERONET measurements. Atmos. Environ. 166, 412–432. doi:10.1016/j.atmosenv.2017.07.037
Quaas, J., Jia, H., Smith, C., Albright, A., Aas, W., Bellouin, N., et al. (2022). Robust evidence for reversal of the trend in aerosol effective climate forcing. Atmos. Chem. Phys. 22, 12221–12239. doi:10.5194/acp-22-12221-2022
Remer, L. A., Kaufman, Y. J., Tanré, D., Mattoo, S., Chu, D. A., Martins, J. V., et al. (2005). The MODIS aerosol algorithm, products, and validation. J. Atmos. Sci. 62, 947–973. doi:10.1175/JAS3385.1
Remer, L. A., Kleidman, R. G., Levy, R. C., Kaufman, Y. J., Tanré, D., Mattoo, S., et al. (2008). Global aerosol climatology from the MODIS satellite sensors. J. Geophys. Research-Atmospheres 113, D14S07. doi:10.1029/2007JD009661
Richardson, D., Black, A. S., Irving, D., Matear, R. J., Monselesan, D. P., Risbey, J. S., et al. (2022). Global increase in wildfire potential from compound fire weather and drought. Clim. Atmos. Sci. 5, 23. doi:10.1038/s41612-022-00248-4
Sawyer, V., Levy, R. C., Mattoo, S., Cureton, G., Shi, Y., and Remer, L. A. (2020). Continuing the MODIS dark target aerosol time series with VIIRS. Remote Sens. 12 (2), 308. doi:10.3390/rs12020308
Shaheen, A., Wu, R., and Aldabash, M. (2020). Long-term AOD trend assessment over the Eastern Mediterranean region: a comparative study including a new merged aerosol product. Atmos. Environ. 238, 117736. doi:10.1016/j.atmosenv.2020.117736
Shi, Y. R., Levy, R. C., Remer, L. A., Mattoo, S., and Arnold, G. T. (2024). Investigating the spatial and temporal limitations for remote sensing of wildfire smoke using satellite and airborne imagers during FIREX-AQ. J. Geophys. Res. Atmos. 129, e2023JD039085. doi:10.1029/2023JD039085
Sogacheva, L., Popp, T., Sayer, A. M., Dubovik, O., Garay, M. J., Heckel, A., et al. (2020). Merging regional and global aerosol optical depth records from major available satellite products. Atmos. Chem. Phys. 20, 2031–2056. doi:10.5194/acp-20-2031-2020
Song, Q., Zhang, Z., Yu, H., Ginoux, P., and Shen, J. (2021). Global dust optical depth climatology derived from CALIOP and MODIS aerosol retrievals on decadal timescales: regional and interannual variability. Atmos. Chem. Phys. 21, 13369–13395. doi:10.5194/acp-21-13369-2021
Uprety, S., Cao, C., Blonski, S., and Shao, X. (2018). Evaluating NOAA-20 and S-NPP VIIRS radiometric consistency. Proc. SPIE 10781, Earth Observing Missions Sensors Dev. Implement. Charact. V, 107810V. doi:10.1117/12.2324464
Wang, Y., Trentmann, J., Pfeifroth, U., Yuan, W., and Wild, M. (2019). Improvement of air pollution in China inferred from changes between satellite-based and measured surface solar radiation. Remote Sens. 11 (24), 2910. doi:10.3390/rs11242910
Yu, H., Yang, Y., Wang, H., Tan, Q., Chin, M., Levy, R. C., et al. (2020). Interannual variability and trends of combustion aerosol and dust in major continental outflows revealed by MODIS retrievals and CAM5 simulations during 2003–2017. Atmos. Chem. Phys. 20, 139–161. doi:10.5194/acp-20-139-2020
Zhang, J., and Reid, J. S. (2010). A decadal regional and global trend analysis of the aerosol optical depth using a data-assimilation grade over-water MODIS and Level 2 MISR aerosol products. Atmos. Chem. Phys. 10, 10949–10963. doi:10.5194/acp-10-10949-2010
Zhao, B., Jiang, J. H., Gu, Y., Diner, D., Worden, J., Liou, K. N., et al. (2017). Decadal-scale trends in regional aerosol particle properties and their linkage to emission changes. Environ. Res. Lett. 12, 054021. doi:10.1088/1748-9326/aa6cb2
Keywords: multispectral satellite remote sensing, MODIS, VIIRS, continuity, dark target algorithm, aerosol optical depth (AOD), trends
Citation: Sawyer V, Levy RC, Mattoo S, Shi YR, Kim M, Remer LA and Cureton G (2025) An updated VIIRS dark target aerosol product for continuity with MODIS: assessing regional aerosol trends. Front. Environ. Sci. 13:1602145. doi: 10.3389/fenvs.2025.1602145
Received: 28 March 2025; Accepted: 26 May 2025;
Published: 17 June 2025.
Edited by:
Alexander Kokhanovsky, German Research Centre for Geosciences, GermanyReviewed by:
Xin Su, China University of Geosciences Wuhan, ChinaHongyu Liu, National Institute of Aerospace, United States
Chao Y., Chinese Academy of Sciences (CAS), China
Copyright © 2025 Sawyer, Levy, Mattoo, Shi, Kim, Remer and Cureton. This is an open-access article distributed under the terms of the Creative Commons Attribution License (CC BY). The use, distribution or reproduction in other forums is permitted, provided the original author(s) and the copyright owner(s) are credited and that the original publication in this journal is cited, in accordance with accepted academic practice. No use, distribution or reproduction is permitted which does not comply with these terms.
*Correspondence: Virginia Sawyer, dmlyZ2luaWEuci5zYXd5ZXJAbmFzYS5nb3Y=
 Virginia Sawyer
 Robert C. Levy
 Shana Mattoo1,2
 Yingxi R. Shi
 Mijin Kim
 Lorraine A. Remer
 Geoff Cureton