 Xin Li
 Zeming Chen
 Yanqin Gao
 Wenkang Tu
 Li-Min Wang
- State Key Laboratory of Metastable Materials Science and Technology, College of Materials Science and Engineering, Yanshan University, Qinhuangdao, Hebei, China
The explanation of the dielectric dynamics in methanol would offer knowledge of the Debye relaxation in supercooled monoalcohols. However, due to the fast crystallization, it is hard to attain the dynamics of pure methanol in the deeply supercooled region. In this paper, we studied the dynamics of methanol – 2-ethyl-1-hexanol mixtures with methanol concentration up to 80 mol% using dielectric and calorimetric measurements. Two main relaxations are detected in the dielectric spectra of the mixtures, and the slower one generally reproduces the Debye relaxation features reported in earlier studies of other monoalcohols. The validity of the ideal mixing law is verified for the relaxation time of the slower dynamics in the mixtures. The results suggest that the Debye relaxation is present in the dielectric spectra of methanol. The temperature dependence of the Debye relaxation time is constructed for the supercooled methanol.
Introduction
Common to glass-forming monoalcohols is the extra Debye type relaxations in dielectric spectra, manifested by the slower dynamics than the structural (α-) relaxation, which associates with liquid viscosity and calorimetric glass transitions (Hassion and Cole, 1955; Dannhauser, 1968; Kudlik et al., 1997; Petong et al., 1999; Johari et al., 2001; Wang and Richert, 2004; Fragiadakis et al., 2010; Pawlus et al., 2010; Gainaru et al., 2011; Power et al., 2011). A number of unique dynamic characters have been discovered for the Debye relaxation (Hansen et al., 1997; Wang and Richert, 2005a; Wang et al., 2005; Huth et al., 2007; Power et al., 2007; Jakobsen et al., 2008; Gainaru and Böhmer, 2010). The understanding of the Debye relaxation has been developed in the latest decades, and the chain-like associations imposed by intermolecular hydrogen-bond (H-bond) are considered to be responsible for the Debye relaxation, although the special relaxation might not be the direct signature of the overall reorientation of the associations as a whole (Fragiadakis et al., 2010; Gainaru et al., 2011; Singh and Richert, 2012). However, a complete understanding of the Debye relaxation is still unclear and, in particular, the formation of the associations (or clusters) corresponding to the Debye relaxation in H-bond liquids and the relation between the Debye and α-relaxations have not yet been solved.
The studies of the dielectric dynamics in supercooled monoalcohols with small molecular size are expected to extend the structural knowledge (clusters) associated with the Debye relaxation. The exploration of the possibility that similar chain-like associations are present in methanol would consequently be of particular interest because of the smallest size among monoalcohols. Yet, the rapid crystallization in supercooled methanol near the glass transition region impedes the accurate determination of the dynamics and the glass transition temperature, Tg (Souda, 2004). Recent studies of the dielectric relaxation in supercooled ethanol found that it is not straightforward to confirm the Debye relaxation as the main relaxation becomes broader than pure Debye dynamics (Brand et al., 2002), especially when the plastic crystal is involved in ethanol.
In order to learn the dynamics of methanol, a common practice is to study the dynamics of binary mixtures of methanol (Sun et al., 2011). In the past few decades, aqueous solutions of methanol have been explored extensively; however, much less experimental studies are available for the dynamics in glass-forming mixtures composed of methanol and well-defined Debye liquids (Denney and Cole, 1955). Our recent studies of the mixtures composed of two monoalcohols suggest that the main relaxation in the dielectric spectra of the mixtures is still Debye typed, while the Debye relaxation disappears in monoalcohols diluted by non-Debye liquids at a specific mole fraction (Wang and Richert, 2005b; Wang et al., 2005). In this paper, we examine the dielectric behaviors in the glass-forming solutions of methanol mixed with 2-ethyl-1-hexanol, a typical Debye liquid featured by the separated Debye and α-relaxations and high glass-forming ability (Murthy, 1996; Wang and Richert, 2004; Wang et al., 2005; Jakobsen et al., 2008; Fragiadakis et al., 2010; Bauer et al., 2013). A broad composition range is explored up to 80 mol% methanol, and the main dielectric relaxation with the slowest dynamics in the mixtures is focused. The dynamic features of the Debye relaxation in supercooled liquids are identified.
Experimental
Broadband dielectric relaxation measurements of the mixtures of methanol (Sigma Aldrich, 99%) and 2-ethyl-1-hexanol (2E1H, Alfa Aesar, 99%) are made in a Novocontrol broadband dielectric spectrometer (Concept 80) equipped with a liquid nitrogen cooling system (Chen et al., 2009). The dielectric relaxation is isothermally measured at each temperature by holding liquids between two separated brass electrodes by Teflon strips of thickness 25 μm. The scanning frequency range spans from 0.01 Hz to 10 MHz. The temperature is controlled by a Novocontrol Quatro controller with temperature accuracy within 0.1 K. The dielectric data are analyzed to obtain the dynamic parameters in terms of Havriliak–Negami (HN) expressions (Havriliak and Negami, 1967),
where ε∞ is the high-frequency dielectric constant, Δεi dielectric strength, τi dielectric relaxation time, and αi and γi profile shape factors of the relaxation dispersion for the ith dynamics. With α = 1, the HN equation becomes the Cole–Davidson (CD) equation, while γ = 1 leads to the Cole–Cole (CC) equation. σdc is the dc conductivity.
The calorimetric glass transition of the mixtures is recorded in a Perkin–Elmer (PE) Diamond differential scanning calorimetry (DSC) at fixed cooling and heating rates of 20 K/min. The instrument is calibrated by indium and cyclohexane for the high and low temperature, following a previous procedure described elsewhere (Wang et al., 2002). The glass transition temperatures, Tg–cal, are determined by the onset temperatures of the heat capacity jumps from glasses to supercooled liquids.
Results
The dielectric loss spectra measured for the methanol – 2E1H mixtures are shown in Figure 1. In Figures 1A,B, two relaxations I and II are easily seen in the isothermal spectra of the mixtures with 10 and 30 mol% methanol (i.e., 10M–90H and 30M–70H), in analogy to the dielectric behaviors of pure 2E1H (Wang and Richert, 2004). The slow relaxation is consequently expected to be Debye typed. Fits to the loss peaks of the 10M–90H mixtures show a CD type profile for the Debye relaxation with γI = 1, while the α-relaxation shows typical HN profile, giving typical values of αII~ 0.75 and γII ~ 0.55. As the concentration of methanol increases, the CC type profiles for the slow relaxation are favored based on the comparison of the fitting quality. In Figure 1B, a fitting with αI = 0.9 and γI = 1 for the 163 K curve of the 30M–70H mixture well explains the main relaxation, while the shape parameters of the α-relaxation are comparable with those in the 10M–90H mixture. The dielectric spectra obtained in the mixtures with 60 mol% methanol are presented in Figure 1C. It is difficult to distinguish two dynamics, and apparently one HN equation seems to basically explain the loss spectra. Figure 1D shows the dielectric spectra of the mixtures with 80 mol% methanol, and two relaxations are resolved and the CC equation is also proven to be suitable for the slow relaxation.
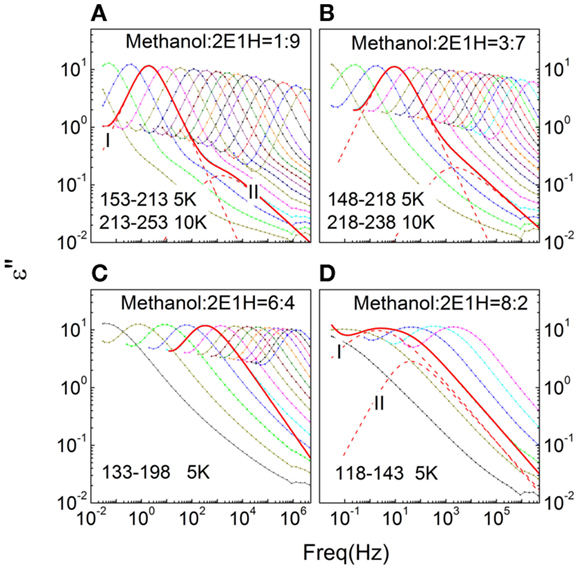
Figure 1. Frequency-dependent dielectric loss (ε″) spectra of methanol – 2-ethyl-1-haxanol (2E1H) mixtures with four mole fractions (A–D). The fits of Havriliak–Negami equation to the representative curves are shown.
Figure 2 presents a close inspection of the relaxation dispersion profiles of the mixtures with the loss spectra normalized by the loss maxima positioned at 1–10 Hz. It is seen that as the fraction of methanol increases, the slope of the low-frequency flank of the slow relaxation reduces continuously from unity. Further analyses of the relaxation dispersion parameters (see Figure 4) suggest that the continuous broadening of the relaxation I cannot be explained by the interference of the relaxation II, although the dynamic separation is reduced between the two relaxations.
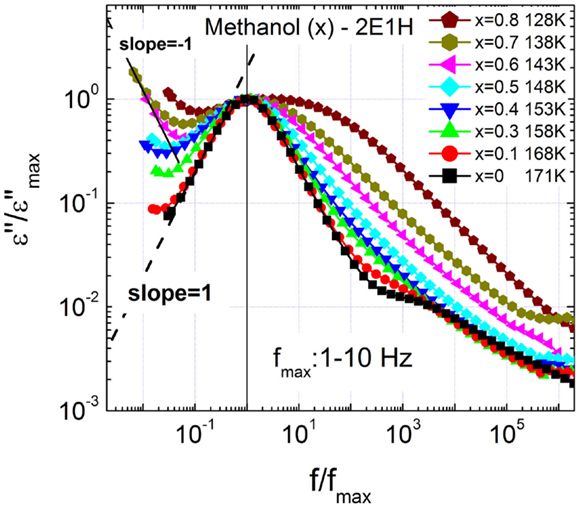
Figure 2. Normalized dielectric loss spectra of methanol – 2-ethyl-1-haxanol (2E1H) mixtures, showing increasing broadening of the slow relaxation. The data fitting show Cole–Cole equation explains the slow relaxation with higher fitting quality.
The relaxation strength and relaxation dispersion of the dynamics I and II are presented in Figures 3 and 4. It is seen that in the range of the methanol mole fraction below 0.7, the total relaxation strength slightly increases, while for the higher fraction, the large enhancement in the relaxation strength is observed, in particular when the dielectric data of pure methanol (Denney and Cole, 1955) is added. The similar case is also observed for the relaxation strength of the relaxation I. The numerical comparison finds that the relaxation I basically explains the total relaxation strength for all the mixtures, suggesting that the relaxation II is relatively weak. A close inspection of the relaxation II also finds a continuous increase of the relaxation strength with increased concentration of methanol. Figure 4 shows the relaxation dispersion parameters of the two relaxations, and the CC type character is revealed for the relaxation I of the mixtures as the methanol mole fraction exceeds 0.3. αI is observed to continuously reduce, indicative of increased broadening of the relaxation I. In contrast, the relaxation dispersion parameters, αII and γII, of the relaxation II basically keep constant, consistent with the temperature dependence of the α-relaxation dispersion in generic liquids, where the relaxation width either keeps constant or decreases in the supercooled regions as temperature increases (Dixon et al., 1990; Olsen et al., 2001; Wang and Richert, 2007).
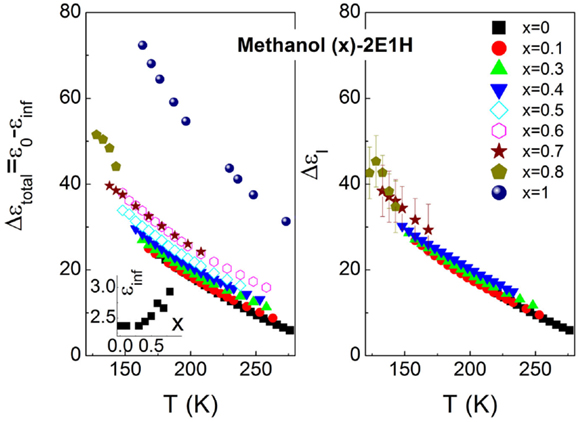
Figure 3. Total dielectric relaxation strength (left panel) and relaxation strength of the relaxation I (right panel). The high-frequency dielectric constant is shown in the inset.
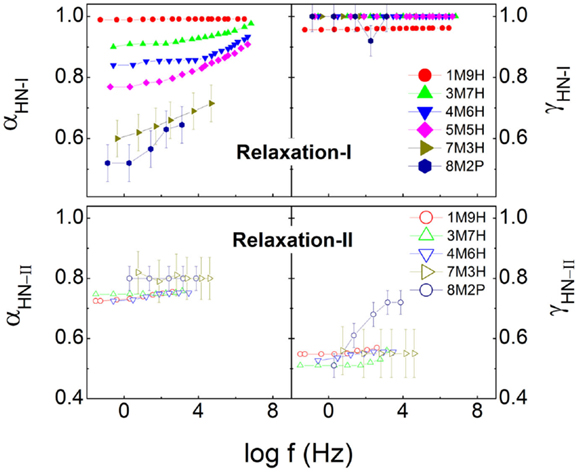
Figure 4. Relaxation dispersion parameters, αHN and γHN in Havriliak–Negami equation for relaxations I and II.
Figure 5 presents the reciprocal temperature dependence of the relaxation times for the relaxations I and II of the mixtures. The Vogel–Fulcher–Tammann (VFT) equation, log10τ = A + B/(T – T0), where τ is the relaxation time and A, B, and T0 are constants, is used to analyze the data. The kinetic glass transition temperature, Tg–kin is usually defined by a temperature where the relaxation time approaches 100 s (Angell et al., 2000). And thus, two Tg–kin values can be obtained for the methanol-deficit mixtures, denoted by for the relaxation I and for the relaxation II. Tg can also be determined from calorimetric measurements, and Figure 6 presents the calorimetric results of the mixtures with Tg–cal defined by the onset transition temperature in the heatflow curves from glassy to supercooled liquid states. Only one glass transition is clearly identified, and this suggests that no phase separation occurs in the mixtures.
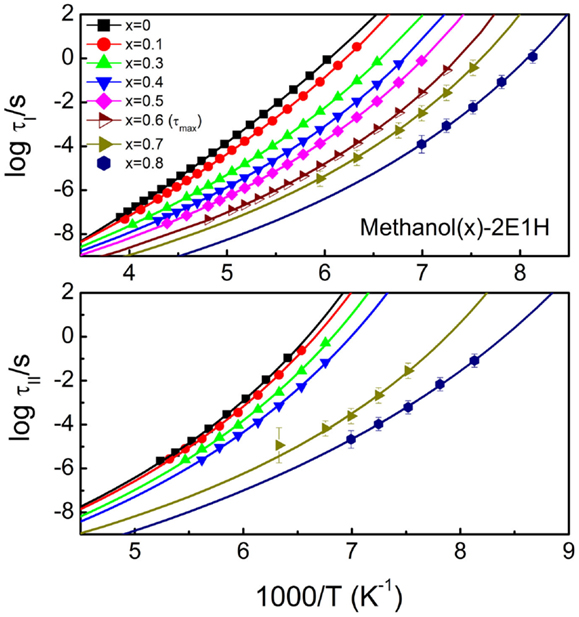
Figure 5. Activation plots for the relaxations I (upper panel) and II (lower panel) of methanol – 2-ethyl-1-haxanol (2E1H) mixtures. The relaxation time is obtained from Havriliak–Negami equation except for the mixture with 60 mol% methanol where the time corresponding to the loss maximum is used since two relaxations can not be separated. The fits of the Vogel–Fulcher–Tammann equation to the relaxation times of the two relaxations are presented by the lines. x is the mole fraction of methanol.
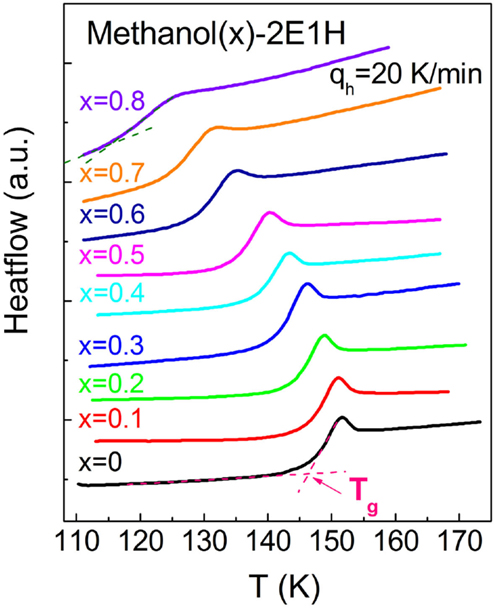
Figure 6. Glass transition heat capacity curves measured at the heating rate of 20 K/min for the methanol – 2-ethyl-1-haxanol (2E1H) mixtures quenched at the same cooling rate. The calorimetric glass transition temperature, Tg–cal, is defined. x is the mole fraction of methanol.
Discussion
Two relaxations are observed in the dielectric spectra of the methanol–2E1H mixtures at the methanol-rich and 2E1H-rich compositions. For the 2E1H-rich compositions, it can be easily concluded that the relaxation I is of the same nature as the Debye relaxation detected in pure 2E1H, since the Debye relaxation has been proven not to disappear in the diluted monoalcohols until a certain concentration (Wang et al., 2005; El Goresy and Böhmer, 2008). In contrast, the identification of the slow relaxation (I) in the methanol-rich compositions might not be straightforward. Fortunately, the unique dynamic features in supercooled states found in earlier publications can be used to serve as the basic criteria to distinguish the Debye relaxation from α-relaxation in pure liquids or liquid mixtures (Wang and Richert, 2005a). Naturally, two prominent dynamic features of the Debye relaxation will be examined for the methanol-rich mixtures, one being the difference between the kinetic Tg in terms of the Debye relaxation time and the calorimetrically measured Tg (Wang and Richert, 2005a; Wang et al., 2008) and the other the ideal mixing law of the Debye relaxation time in the binary mixtures of two primary monoalcohols (Wang and Richert, 2005b).
Calorimetric and Kinetic Tg
For generic (non-Debye) molecular liquids, Tg–kin derived from the dielectric α-relaxation is found to relate closely to the calorimetric Tg–cal, which is defined by a thermal procedure with fixed cooling and subsequently heating rates, typically 20 K/min, and, generally, Tg–kin of generic liquids is constantly 0–3 K lower than Tg–cal (Wang et al., 2008; Li et al., 2014). Instead, for Debye liquids, if the Debye relaxation time τD is used to define Tg–kin, Tg–kin would exceed Tg–cal, and in some cases, the difference can be as large as 7 K (Wang et al., 2008). The calorimetric and kinetic Tg values of the methanol – 2E1H mixtures are compared in Figure 7, where Tg–kin are calculated by the relaxations I and II, respectively. It is seen that is fundamentally greater than Tg–cal, while is smaller than Tg–cal in the whole composition range, similar to the relation between the kinetic and calorimetric Tg’s of Debye liquids. It is observed that the difference between and is relatively large at both methanol-rich and methanol-deficit compositions for the methanol–2E1H mixtures, and a minimum is expected at an intermediate composition of 50–60 mol%. The inset of Figure 7 presents the Tg results of the mixtures of two primary monoalcohols, 2E1H and 2-methyl-1-butanol (2M1B) (Wang and Richert, 2005b), revealing the similar minimum of and difference at a composition range of 30–50 mol% of 2M1B. When comparing the two mixing systems of methanol vs. 2E1H and 2E1H vs. 2M1B, the difference is obvious that the broadening of the relaxation I in the dielectric spectra of the former system is much more pronounced, in particular at methanol-rich compositions and, in contrast, only tiny broadening is shown in the latter system occurring at the intermediate compositions. The larger broadening in the methanol–2E1H mixtures might be attributed to the large size difference between the two constituents. The composition dependence of calorimetrical Tg of the mixtures allows to evaluate roughly Tg of methanol, yielding a value of ~100 K, which is comparable with the reported value of 103 K of a hyperquenched glass (Sugisaki et al., 1968).
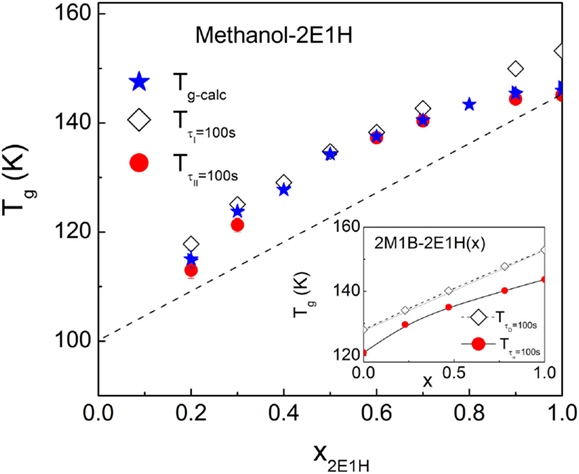
Figure 7. Comparison of the glass transition temperatures defined in calorimetric and kinetic measurements for the methanol – 2E1H mixtures. Calorimetric Tg–cal is defined as the onset temperature in the heat capacity jump from the glassy to liquid states as shown in Figure 4, while kinetic of the relaxation I and of the relaxation II are determined by a temperature at which the dielectric relaxation time is 100 s. and in the mixtures composed of 2E1H and 2-methyl-1-butanol (2M1B) from Wang and Richert (2005b) are plotted in the inset. x is the mole fraction of 2E1H.
Ideal Mixing Law of the Debye Relaxation Time
Recent dielectric relaxation studies of mixtures composed of two primary monoalcohols found that the Debye relaxation time follows the ideal mixing law, i.e., log τx = xlog τD1 + (1 − x)log τD2, where τx is the Debye relaxation of the mixture at a mole fraction of x, τDi is the Debye relaxation time of the ith primary monoalcohol (Wang and Richert, 2005b). In order to clarify whether the ideal mixing rule applies to the methanol–2E1H mixtures in the deeply supercooled regimes, a reliable practice is to compare the calculated Debye relaxation times of pure methanol at a temperature yielded in terms of the ideal mixing rule of the data of pure 2E1H and a specified mixture, and if the Debye relaxation is not present in the dielectric spectra of pure methanol, the calculated values would not match well. Figure 8 reproduces the experimental data in upper panel of Figure 5, and the validity of the ideal mixing law is tested at a few representative temperatures at which the reliable experimental data of 2E1H and the mixtures are achieved. Interestingly, the calculated Debye relaxation times of pure methanol at each temperature are found to be comparable with small fluctuation, indicated by the error bars. The averaged times are denoted by the purple pentagons in Figure 8.
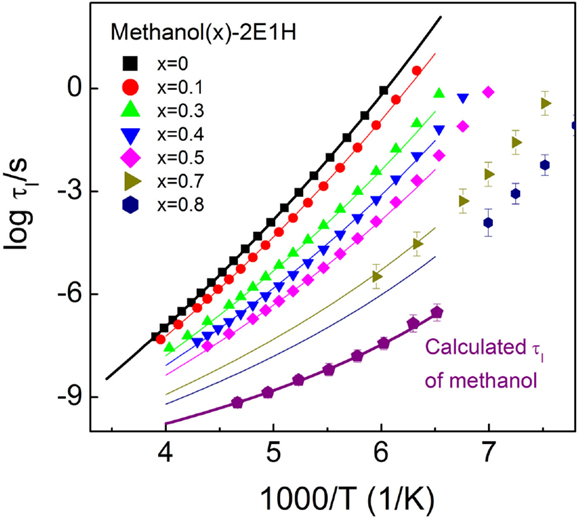
Figure 8. Temperature dependence of the relaxation time of the relaxation I for the methanol – 2-ethyl-1-haxanol (2E1H) mixtures. Purple pentagon denotes the average Debye relaxation time of pure methanol, which is calculated when the ideal mixing law is verified. The thin lines are the calculated relaxation time for the mixtures in terms of the ideal mixing law based on the data of pure methanol and 2E1H (thick lines).
Based on the calculated Debye relaxation times of methanol, the temperature dependence of the Debye relaxation time is expressed by a VFT equation of log τD = 12.4 + 459.4/(T − 74.1), as shown by the thick purple line in Figure 8. The fit of the VFT equation to the temperature dependence of the Debye relaxation time for 2E1H gives log τD = 15.9 + 1738.7/(T − 56.1). Using the two VFT equations of methanol and 2E1H, the Debye relaxation time of each mixture is yielded, as denoted by the thin lines. It is seen that the calculated lines basically agree with the experimental data for each mixture. The validity of the ideal mixing law is consequently verified for the dielectric relaxation of the methanol–2E1H mixtures, suggesting the dynamics in the methanol–2E1H mixtures shares the same feature of the ideal mixing law as observed in earlier study of the mixtures of two primary monoalcohols. The results offer new evidence for the presence of the Debye relaxation in the dielectric spectra of pure methanol. Two main relaxations have been reported in the dielectric relaxations of ethanol (Brand et al., 2000) and propanol (Hansen et al., 1997), and it appears that the slow relaxations are of the Debye relaxation character. Further, it is inferred that similar intermolecular structures (clusters) form in the monoalcohols, which are responsible for the Debye relaxation.
The activation plot of the Debye relaxation time of methanol is presented in Figure 9, covering the normal and supercooled liquid regimes. The data reported in earlier studies derived from the high-frequency measurements are also given in Figure 9. One can see that the Debye relaxation times calculated in the present study are consistent with most of the earlier measurements (Jordan et al., 1978; Bertolini et al., 1983; Barthel et al., 1990), except for the data reported by Denney and Cole (1955), which shows an obvious discrepancy from others. It should be noticed that the relaxation time in the study by Denney and Cole (1955) was determined using two or three additive Debye relaxations to analyze the CC (ε′ vs. ε″) plots of the dielectric spectra, while the data reported in the latter publications are obtained from the frequent-dependent isothermal dielectric spectra measurements. The fits to the Debye relaxation times from our work and reported by Jordan et al. (1978), Bertolini et al. (1983), and Barthel et al. (1990) are attempted in Figure 9 using the VFT equation and Mauro–Yue–Ellison–Gupta–Allan equation of log τD = A + K/T × exp(C/T) (Mauro et al., 2009), where A, K, and C are constants, showing excellent consistency.
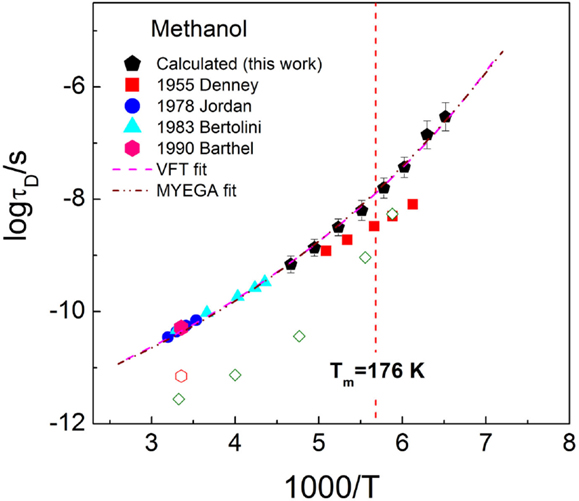
Figure 9. Activation plot of methanol in temperature range covering normal and supercooled liquids. The data from earlier studies are also shown. The lines are guides for the eye, represented by the Vogel–Fulcher–Tammann equation of log τD = − 12.4 + 459.4/(T − 74.1) (pink dash line) and Mauro–Yue–Ellison–Gupta–Allan equation of log τD = − 12.2 + 335.3/T × exp(144.5/T) (green short dash line). The faster α-relaxation times are shown from Barthel et al. (1990) (experimental, open hexagon) and Ngai and Roland (1997) (MD, open diamond).
The α-relaxation time of methanol at temperature around the melting point was analyzed using dynamic simulation by Ngai and Roland (1997). The data are represented in Figure 9 by the open diamond, and the data are comparable with the time of the faster relaxation determined experimentally in the study by Barthel et al. (1990), as denoted by the open hexagon. The increased separation between the Debye and α-relaxation times with temperature is visible. When comparing the MD α-relaxation time with the Debye relaxation time reported in the study by Denney and Cole (1955), it appears that the latter data might be subjected to considerable error.
Kirkwood Factors
The Kirkwood factor is a crucial quantity to obtain the knowledge of liquid structures, which can be calculated in terms of the Kirkwood–Fröhlich equation (Kirkwood, 1939).
where εs is the static permittivity, ε∞ is the permittivity in the limit of high frequencies as defined in eq. (1). NA is Avogadro’s number, ρ the density of the liquid at a temperature T, μ0 the dipole moment of the isolated molecule, ε0 the absolute permittivity of vacuum, M the molecular weight, and kB Boltzmann’s constant. Experimentally determined gK can explain additional dipole correlations generated by interactions such as H-bond in alcohols (Singh and Richert, 2012; Li et al., 2014). gK = 1 means the absence of any additional correlation, and gK > 1 denotes an enhancement of the effective dipole moment induced by the parallel alignment, while gK < 1 reflects antiparallel alignment due to dipole cancelation effects (Wang and Richert, 2005a). For binary mixtures, a rough approximation for the average dipole moment μ0 can be referred to (Lu et al., 2009),
νi is the volume fraction of component i.
The dipole moments of methanol and 2E1H were reported to be 1.69 D (Caldwell and Kollman, 1995) and 1.74 D (McClellan, 1963), and the temperature dependences of the densities are available in literatures for the two monoalcohols. (Nikam et al., 1998; Zorębski et al., 2011) Three mixtures are chosen to calculate the gK factors at temperatures near the glass transitions using the dielectric relaxation strength shown in Figure 3. The gK factors of 4.56, 4.06, and 4.05 are yielded for the 40M-60H (158K), 60M-40H (158K), and 80M-20H (143K) mixtures, respectively, similar to the high values reported for the Debye relaxations in Debye liquids (Wang and Richert, 2005a). According to the explanation of the Debye relaxations (Fragiadakis et al., 2010; Gainaru et al., 2010, 2011; Singh and Richert, 2012; Pawlus et al., 2013), the high gK factors suggest the formation of the chain-like intermolecular associations in the mixtures driven by the H-bond among methanol and 2E1H molecules. The structural studies of liquid and solid methanol indeed argued the formation of the intermolecular H-bonded chains (Sindzingre and Klein, 1992; Guo et al., 2003).
Conclusion
The dynamic analyses together with the calculation of the Kirkwood factors of the methanol–2E1H mixtures suggest that the Debye relaxation is present in the dielectric spectra of pure methanol. The conclusion is also supported by a recent study of the comparison of the dielectric and low-frequency Raman spectra of methanol, finding that the slow dielectric dynamics, which is the Debye relaxation, does not correspond to the Raman spectrum, and the faster processes reflect common microscopic dynamics (Fukasawa et al., 2005). The validity of the ideal mixing law for the Debye relaxation time of the mixtures advances the construction of the temperature dependence of the Debye relaxation time of the pure methanol, which will facilitate the evaluation of the dynamics in deeply supercooled methanol. In addition, broadened Debye relaxation is expected in the dielectric spectra of the methanol, and this is quite different from earlier observation of the Debye liquids.
Conflict of Interest Statement
The authors declare that the research was conducted in the absence of any commercial or financial relationships that could be construed as a potential conflict of interest.
Acknowledgments
This work was supported by National Basic Research Program of China (973 Program No. 2015CB856805), NSFC (Grant No. 51131002/51421091/51271160/11474247), and Natural Science Foundation of Hebei Province (No. A2014203260).
References
Angell, C. A., Ngai, K. L., McKenna, G. B., McMillan, P. F., and Martin, S. W. (2000). Relaxation in glassforming liquids and amorphous solids. J. Appl. Phys. 88, 3113–3157. doi: 10.1063/1.1286035
Barthel, J., Bachhuber, K., Buchner, R., and Hetzenauer, H. (1990). Dielectric spectra of some common solvents in the microwave region water and lower alcohols. Chem. Phys. Lett. 165, 369–373. doi:10.1016/0009-2614(90)87204-5
Bauer, S., Wittkamp, H., Schildmann, S., Frey, M., Hiller, W., Hecksher, T., et al. (2013). Broadband dynamics in neat 4-methyl-3-heptanol and in mixtures with 2-ethyl-1-hexanol. J. Chem. Phys. 139, 134503. doi:10.1063/1.4821229
Bertolini, D., Cassettari, M., and Salvetti, G. (1983). The dielectric properties of alcohols–water solutions. I. The alcohol rich region. J. Chem. Phys. 78, 365–372. doi:10.1063/1.444510
Brand, R., Lunkenheimer, P., and Loidl, A. (2002). Relaxation dynamics in plastic crystals. J. Chem. Phys. 116, 10386–10401. doi:10.1063/1.1477186
Brand, R., Lunkenheimer, P., Schneider, U., and Loidl, A. (2000). Excess wing in the dielectric loss of glass-forming ethanol: A relaxation process. Phys. Rev. E 62, 8878–8883. doi:10.1103/PhysRevB.62.8878
Caldwell, J. W., and Kollman, P. A. (1995). Structure and properties of neat liquids using nonadditive molecular dynamics: Water, methanol, and N-methylacetamide. J. Phys. Chem. 99, 6208–6219. doi:10.1021/j100016a067
Chen, Z. M., Zhao, Y., and Wang, L.-M. (2009). Enthalpy and dielectric relaxations in supercooled methyl m-toluate. J. Chem. Phys. 130, 204515. doi:10.1063/1.3142142
Dannhauser, W. (1968). Dielectric relaxation in isomeric octyl alcohols. J. Chem. Phys. 48, 1918–1923. doi:10.1063/1.1668990
Denney, D. J., and Cole, R. H. (1955). Dielectric properties of methanol and methanol-1-propanol solutions. J. Chem. Phys. 23, 1767–1772. doi:10.1063/1.1740577
Dixon, P. K., Wu, L., Nagel, S. R., Williams, B. D., and Carini, J. P. (1990). Scaling in the relaxation of supercooled liquids. Phys. Rev. Lett. 65, 1108–1111. doi:10.1103/PhysRevLett.65.1108
El Goresy, T., and Böhmer, R. (2008). Diluting the hydrogen bonds in viscous solutions of n-butanol with n-bromobutane: A dielectric study. J. Chem. Phys. 128, 154520. doi:10.1063/1.2903403
Fragiadakis, D., Roland, C. M., and Casalini, R. (2010). Insights on the origin of the Debye process in monoalcohols from dielectric spectroscopy under extreme pressure conditions. J. Chem. Phys. 132, 144505. doi:10.1063/1.3374820
Fukasawa, T., Sato, T., Watanabe, J., Hama, Y., Kunz, W., and Buchner, R. (2005). Relation between dielectric and low-frequency Raman spectra of hydrogen-bond liquids. Phys. Rev. Lett. 95, 197802. doi:10.1103/PhysRevLett.95.197802
Gainaru, C., and Böhmer, R. (2010). Coupling of the electrical conductivity to the structural relaxation, absence of physical aging on the time scale of the Debye process, and number of correlated molecules in the supercooled monohydroxy alcohol 2-ethylhexanol. J. Non Cryst. Solids 356, 542–546. doi:10.1016/j.jnoncrysol.2009.07.030
Gainaru, C., Kastner, S., Mayr, F., Lunkenheimer, P., Schildmann, S., Weber, H. J., et al. (2011). Hydrogen-bond equilibria and lifetimes in a monohydroxy alcohol. Phys. Rev. Lett. 107, 118304. doi:10.1103/PhysRevLett.107.118304
Gainaru, C., Meier, R., Schildmann, S., Lederle, C., Hiller, W., Rössler, E. A., et al. (2010). Nuclear-magnetic-resonance measurements reveal the origin of the Debye process in monohydroxy alcohols. Phys. Rev. Lett. 105, 258303. doi:10.1103/PhysRevLett.105.258303
Guo, J.-H., Luo, Y., Augustsson, A., Kashtanov, S., Rubensson, J.-E., Shuh, D. K., et al. (2003). Molecular structure of alcohol-water mixtures. Phys. Rev. Lett. 91, 157401. doi:10.1103/PhysRevLett.91.157401
Hansen, C., Stickel, F., Berger, F. T., Richert, R., and Fischer, E. W. (1997). Dynamics of glass-forming liquids. III. Comparing the dielectric α- and β-relaxation of 1-propanol and o-terphenyl. J. Chem. Phys. 107, 1086–1092. doi:10.1063/1.474456
Hassion, F. X., and Cole, R. H. (1955). Dielectric properties of liquid ethanol and 2-propanol. J. Chem. Phys. 23, 1756–1761. doi:10.1063/1.1740575
Havriliak, S., and Negami, S. (1967). A complex plane representation of dielectric and mechanical relaxation processes in some polymers. Polymer 8, 161–210. doi:10.1016/0032-3861(67)90021-3
Huth, H., Wang, L.-M., Schick, C., and Richert, R. (2007). Comparing calorimetric and dielectric polarization modes in viscous 2-ethyl-1-hexanol. J. Chem. Phys. 126, 104503. doi:10.1063/1.2539105
Jakobsen, B., Maggi, C., Christensen, T., and Dyre, J. C. (2008). Investigation of the shear-mechanical and dielectric relaxation processes in two monoalcohols close to the glass transition. J. Chem. Phys. 129, 184502. doi:10.1063/1.3007988
Johari, G. P., Kalinovskaya, O. E., and Vij, J. K. (2001). Effects of induced steric hindrance on the dielectric behavior and H bonding in the supercooled liquid and vitreous alcohol. J. Chem. Phys. 114, 4634–4642. doi:10.1063/1.1346635
Jordan, B. P., Sheppard, R. J., and Szwarnowski, S. (1978). The dielectric properties of formamide, ethanediol and methanol. J. Phys. D Appl. Phys. 11, 695–701. doi:10.1088/0022-3727/11/5/013
Kirkwood, J. G. (1939). The dielectric polarization of polar liquids. J. Chem. Phys. 7, 911–919. doi:10.1063/1.1750343
Kudlik, A., Tschirwitz, C., Benkhof, S., Blochowicz, T., and Rössler, E. (1997). Slow secondary relaxation process in supercooled liquids. Europhys. Lett. 40, 649–654. doi:10.1209/epl/i1997-00518-y
Li, X., Chen, Z. M., Li, Z. J., Gao, Y. Q., Tu, W. K., Li, X. Q., et al. (2014). Comparative study of dynamics in glass forming mixtures of Debye-type N-ethylacetamide with water, alcohol, and amine. J. Chem. Phys. 141, 104506. doi:10.1063/1.4895066
Lu, Z. J., Manias, E., Macdonald, D. D., and Lanagan, M. (2009). Dielectric relaxation in dimethyl sulfoxide/water mixtures studied by microwave dielectric relaxation spectroscopy. J. Phys. Chem. A 113, 12207–12214. doi:10.1021/jp9059246
Mauro, J. C., Yue, Y. Z., Ellison, A. J., Gupta, P. K., and Allan, D. C. (2009). Viscosity of glass-forming liquids. Proc. Natl. Acad. Sci. U.S.A. 24, 19780–19784. doi:10.1073/pnas.0911705106
McClellan, A. L. (1963). Tables of Experimental Dipole Moments, Vol. 3. San Francisco, CA: W.H. Freeman and Co.
Murthy, S. S. N. (1996). Dielectric relaxation in monohydroxy alcohols and its connection to the glass transition process. J. Phys. Chem. 100, 8508–8517. doi:10.1021/jp953596z
Ngai, K. L., and Roland, C. M. (1997). Short-time relaxational dynamics of the “strong” glass-former methanol. J. Phys. Chem. B 101, 4437–4441. doi:10.1021/jp963352u
Nikam, P. S., Shirsat, L. N., and Hasan, M. (1998). Density and viscosity studies of binary mixtures of acetonitrile with methanol, ethanol, propan-1-ol, propan-2-ol, butan-1-ol, 2-methylpropan-1-ol, and 2-methylpropan-2-ol at (298.15, 303.15, 308.15, and 313.15) K. J. Chem. Eng. Data 43, 732–737. doi:10.1021/je980028e
Olsen, N. B., Cristensec, T., and Dyre, J. C. (2001). Time-temperature superposition in viscous liquids Phys. Rev. Lett. 86, 1271–1274. doi:10.1103/PhysRevLett.86.1271
Pawlus, S., Klotz, S., and Paluch, M. (2013). Effect of compression on the relationship between viscosity and dielectric relaxation time in hydrogen-bonded primary alcohols. Phys. Rev. Lett. 110, 173004. doi:10.1103/PhysRevLett.110.173004
Pawlus, S., Paluch, M., and Dzida, M. (2010). Molecular dynamics changes induced by hydrostatic pressure in a supercooled primary alcohol. J. Phys. Chem. Lett. 1, 3249–3253. doi:10.1021/jz101288v
Petong, P., Pottel, R., and Kaatze, U. (1999). Dielectric relaxation of H-bonded liquids. Mixtures of ethanol and n-hexanol at different compositions and temperatures. J. Phys. Chem. A 103, 6114–6121. doi:10.1021/jp991046l
Power, G., Nagaraj, M., Vij, J. K., and Johari, G. P. (2011). Debye process and dielectric state of an alcohol in a nonpolar solvent. J. Chem. Phys. 134, 044525. doi:10.1063/1.3543713
Power, G., Vij, J. K., and Johari, G. P. (2007). Relaxations and nano-phase-separation in ultraviscous heptanol-alkyl halide mixture. J. Chem. Phys. 126, 034512. doi:10.1063/1.2409929
Sindzingre, P., and Klein, M. L. (1992). A molecular dynamics study of methanol near the liquid-glass transition. J. Phys. Chem. 96, 4681–4692. doi:10.1063/1.462805
Singh, L. P., and Richert, R. (2012). Watching hydrogen-bonded structures in an alcohol convert from rings to chains. Phys. Rev. Lett. 109, 167802. doi:10.1103/PhysRevLett.109.167802
Souda, R. (2004). Glass transition and intermixing of amorphous water and methanol. Phys. Rev. Lett. 93, 235502. doi:10.1103/PhysRevLett.93.235502
Sugisaki, M., Suga, H., and Seki, S. (1968). Calorimetric study of the glassy state. III. Novel type calorimeter for study of glassy state and heat capacity of glassy methanol. Bull. Chem. Soc. Jpn 41, 2586–2591. doi:10.1246/bcsj.41.2586
Sun, M., Wang, L.-M., Tian, Y., Liu, R., Ngai, K. L., and Tan, C. (2011). Component dynamics in miscible mixtures of water and methanol. J. Phys. Chem. B 115, 8242–8248. doi:10.1021/jp202893v
Wang, L.-M., and Richert, R. (2004). Dynamics of glass-forming liquids. IX. Structural versus dielectric relaxation in monohydroxy alcohols. J. Chem. Phys. 121, 11170–11176. doi:10.1063/1.1811072
Wang, L.-M., and Richert, R. (2005). Debye type dielectric relaxation and the glass transition of alcohols. J. Phys. Chem. B 109, 11091–11094. doi:10.1021/jp051965d
Wang, L.-M., and Richert, R. (2005a). Identification of dielectric and structural relaxations in glass-forming secondary amides. J. Chem. Phys. 123, 054516. doi:10.1063/1.1997135
Wang, L.-M., and Richert, R. (2005b). Ideal mixing behavior of the Debye process in supercooled monohydroxy alcohols. J. Phys. Chem. B 109, 8767–8773. doi:10.1021/jp050342x
Wang, L.-M., and Richert, R. (2007). Primary and secondary relaxation time dispersions in fragile supercooled liquids. Phys. Rev. B 76, 064201. doi:10.1103/PhysRevB.76.064201
Wang, L.-M., Shahriari, S., and Richert, R. (2005). Diluent effects on the Debye-type dielectric relaxation in viscous monohydroxy alcohols. J. Phys. Chem. B 109, 23255–23262. doi:10.1021/jp054542k
Wang, L.-M., Tian, Y., Liu, R., and Richert, R. (2008). Calorimetric versus kinetic glass transitions in viscous monohydroxy alcohols. J. Chem. Phys. 128, 084503. doi:10.1063/1.2840357
Wang, L.-M., Velikov, V., and Angell, C. A. (2002). Direct determination of kinetic fragility indices of glassforming liquids by differential scanning calorimetry: kinetic versus thermodynamic fragilities. J. Chem. Phys. 117, 10184–10192. doi:10.1063/1.1517607
Keywords: dielectric relaxation, glass transition, supercooled liquids, hydrogen-bond liquids, Debye relaxation, methanol
Citation: Li X, Chen Z, Gao Y, Tu W and Wang L-M (2015) Probing the Debye dielectric relaxation in supercooled methanol. Front. Mater. 2:41. doi: 10.3389/fmats.2015.00041
Received: 01 March 2015; Accepted: 04 May 2015;
Published: 03 June 2015
Edited by:
Lothar Wondraczek, University of Jena, GermanyReviewed by:
Bruno Poletto Rodrigues, Otto-Schott-Institute of Materials Research, GermanyRoger Jay Loucks, Alfred University, USA
Kia L. Ngai, National Research Council, Italy
Copyright: © 2015 Li, Chen, Gao, Tu and Wang. This is an open-access article distributed under the terms of the Creative Commons Attribution License (CC BY). The use, distribution or reproduction in other forums is permitted, provided the original author(s) or licensor are credited and that the original publication in this journal is cited, in accordance with accepted academic practice. No use, distribution or reproduction is permitted which does not comply with these terms.
*Correspondence: Li-Min Wang, State Key Laboratory of Metastable Materials Science and Technology, College of Materials Science and Engineering, Yanshan University, 438 West Hebei Avenue, Qinhuangdao, Hebei 066004, China,bGltaW5fd2FuZ0B5c3UuZWR1LmNu