 Yuanzheng Yue1,2*
- 1State Key Laboratory of Silicate Materials for Architectures, Wuhan University of Technology, Wuhan, China
- 2Department of Chemistry and Bioscience, Aalborg University, Aalborg, Denmark
It is a challenge to calorimetrically determine the glass transition temperature (Tg) of vitreous silica. Here, we demonstrate that this challenge mainly arises from the extremely high sensitivity of the Tg to the hydroxyl content, but also from decrease of the Tg with repeating the calorimetric scans. It is known that the liquid fragility (i.e., the speed of the viscous slow-down of a supercooled liquid at its Tg during cooling) has impact on enthalpy relaxation in glass. Here, we find that vitreous silica (as a strong system) exhibits striking anomalies in both glass transition and enthalpy relaxation compared to fragile oxide systems. The anomalous enthalpy relaxation of vitreous silica is discovered by performing the hyperquenching-annealing-calorimetry experiments. We argue that the strong systems like vitreous silica and vitreous Germania relax in a structurally cooperative manner, whereas the fragile ones do in a structurally independent fashion. We discuss the origin of the anomalous enthalpy relaxation in the HQ vitreous silica.
Introduction
Vitreous silica is of special importance for advanced technology, e.g., for communication and semiconductor technologies, due to its excellent mechanical, thermal, and optical properties simultaneously connected with excellent chemical resistance (Bateson, 1958; Thomas, 1958; Brückner, 1971; Doremus, 2002; Mei et al., 2007; Lascaris et al., 2014). Despite its simple chemical identity, vitreous silica is one of the most interesting and complicated glass formers regarding its structure, dynamics, and properties. In a review paper (Brückner, 1971), Brückner has described physical anomalies of vitreous silica with regard to the volume relaxation, thermal expansion, specific heat capacity, and transport phenomena. The diffusion and viscous flow in silica have been discussed by Doremus (2002). Anomalous behaviors of liquid silica have also been found, e.g., the fragile-to-strong liquid transition and the polyamorphism in the energy landscape (Saika-Voivod et al., 2001), liquid–liquid critical point (Lascaris et al., 2014). Recently, the role of the structural disorder in the thermodynamics and atomic dynamics of glasses has been revealed by comparing the atomic vibrational dynamics of compressed vitreous silica with that of various kinds of corresponding crystals (Chumakov et al., 2014). Despite progress in understanding anomalous physical behaviors of vitreous silica, some crucial questions still remain open. For instance, what is the calorimetric glass transition temperature (Tg) of a perfectly pure vitreous silica? Why does the Tg of vitreous silica vary with the number of calorimetric scans in contrast to that of other glass formers? How can one get the true Tg of pure vitreous silica? How does the enthalpy of hyperquenched (HQ) vitreous silica evolve during sub-Tg annealing? In this paper we attempt to answer these questions, at least to some extent.
Calorimetric studies of enthalpy relaxation in HQ glasses (e.g., those cooled at >104 K/s) is helpful for understanding the nature of glass and glass transition (Huang and Gupta, 1992; Yue, 2002; Yue et al., 2002a,b; Angell et al., 2003; Yue and Angell, 2004; Monaco et al., 2006; Hornbøll and Yue, 2008a; Hu et al., 2011). Such studies have provided insights into the energetic and structural heterogeneities in supercooled liquids and their glass states (Yue et al., 2002a; Zhang et al., 2013a,b; Zhou et al., 2015), which would be difficult to be attained by other means. The principle of the experimental approach of these studies is to trap the high potential energy state of a liquid by hyperquenching, and subsequently discharge the excessive energy by annealing at a certain temperature (Ta) below Tg for a certain period of time (ta), and then upscanning the annealed HQG in a differential scanning calorimeter (DSC). Liquid structure can be frozen-in by hyperquenching and thereby a higher fictive temperature (Tf) compared to Tg will be generated in glass state (Yue et al., 2002b; Kiczenski and Stebbins, 2006; Mauro et al., 2009a). With proceeding of the relaxation process, the Tf gradually decreases with increasing Ta and ta. By annealing, we observe a gradual shift of enthalpy release peak of the calorimetric upscan curve toward higher temperatures, implying that there is a distribution of configurational states of the liquid at Tf. This also indicates that the liquid at T = Tf is energetically and structurally heterogeneous (Yue and Angell, 2004). The direct comparative studies about the enthalpy relaxation and the evolution of the vibrational density of states in HQ glasses during annealing has enhanced the understanding of the atomic vibrational dynamics in glass from different angles (Angell et al., 2003; Monaco et al., 2006).
According to previous reports (Hornbøll and Yue, 2008b; Mauro and Loucks, 2008), the liquid fragility has an impact on the enthalpy relaxation in glass. Numerous experimental and modeling studies have been done on the enthalpy relaxation of HQ fragile oxide systems (Huang and Gupta, 1992; Yue, 2002, 2004; Yue et al., 2002a,b; Angell et al., 2003; Guo et al., 2012; Zhang et al., 2013a,b,c), but to our best knowledge, almost no investigations have been conducted on the HQ prototypical strong glass former – HQ vitreous silica. It is expected that the enthalpy relaxation in HQ vitreous silica differs from HQ fragile glass formers owing to their structural differences in terms of both short-range and medium-range order. The former one has well-developed structure units with a higher degree of short-range order, covalence-dominant bonds, and higher network connectivity, whereas the former ones possess less well-developed structure units with a lower degree of short-range order, more ionic bonds, and lower network connectivity. It should be noted that the liquid fragility mentioned here refers to the dynamic nature of a glass forming liquid, i.e., the viscous slow-down speed of a supercooled liquid at Tg upon cooling, and is physically different from the mechanical fragility of a glass. Concerning the relaxation behavior of the strong system – vitreous silica, some experimental results have been reported, which deal with, e.g., surface relaxation (Agarwal and Tomozawa, 1997; Koike and Tomozawa, 2006), structural anisotropy relaxation, and volume relaxation (Murach and Brückner, 1997), but no results deal with the enthalpy relaxation of the HQ vitreous silica. In this work, we focus on the enthalpy response of the HQ vitreous silica (HQSiO2) to sub-Tg annealing, and compare it with that of the HQ fragile oxide systems such as HQ basaltic glass (HQBas) (Yue and Angell, 2004) and calcium metaphosphate glass (HQCmP) (Yue, 2002), and also with that of the HQ strong vitreous GeO2 (HQGeO2) (Hornbøll and Yue, 2008b).
In this paper, we provide the experimental evidence for the striking differences in enthalpy relaxation between strong and fragile glass systems by performing hyperquenching-annealing-calorimetry experiments on two strong systems and two fragile systems. We explore the anomalous enthalpy relaxation behavior of HQSiO2 and discuss its origin in terms of the potential energy landscape. To identify the universal feature of the enthalpy relaxation of strong glass formers, we compare the relaxation of HQSiO2 with that of HQGeO2 (Hornbøll and Yue, 2008b; Hu and Yue, 2008). Besides its fundamental importance, the investigation of the enthalpy relaxation in HQ strong glass formers is also of technological significance, since the annealing process has strong impact on the physical performances of those glasses. Such studies could give insight into the physical origin of liquid fragility.
Experimental
Samples
The bulk vitreous silica used for the Tg study was obtained from Heraeus Holding GmbH. The sample was produced by using electric fusion process, which enabled the hydroxyl content to be <1 ppm. The thus-prepared vitreous silica contains total metallic impurities below ~20 ppm. The impurities consist primarily of Al2O3 with much smaller amounts of alkali oxide, Fe2O3, TiO2, MgO, and ZrO2. These impurities play a role primarily as network modifiers that depolymerize the structural network of glass. The vitreous silica used for the viscosity measurements of Urbain et al. (1982) contains <10 ppm hydroxyl and <60 ppm metallic impurities.
The HQ vitreous silica (HQSiO2) samples used for the relaxation study were obtained from Technical University of Berlin, which were the continuous fibers with an average diameter of 8.5 μm and a hydroxyl content of 1021 ppm (Murach and Brückner, 1997). The fibers were drawn from a cylindrical preform of vitreous silica (diameter: 8 mm) at 2703 K (Murach and Brückner, 1997). The vitreous silica preform was fabricated by Heraeus Holding GmbH by means of a synthetic process. The thus-derived vitreous silica contains a much lower amount of metallic impurities (<1 ppm), compared to the vitreous silica obtained by a fusion process.
Both HQ GeO2 glass (HQGeO2) and HQ CaP2O6 glass (i.e., HQ calcium metaphosphate – HQCmP) were produced as continuous fibers using the crucible technique (Yue, 2002; Hornbøll and Yue, 2008b). The HQ basalt (HQBas) was produced as wool fibers by using the centrifugal force cascade process (Yue et al., 2002a) and provided by Rockwool International A/S. The chemical composition (mol%) of HQBas is 47.5 SiO2, 9.1 Al2O3, 6.6 FeO, 15.9 CaO, 16.9 MgO, 2.0 Na2O, 0.7 K2O. The cooling rates of all the fiber samples were estimated using our previously established method (Yue et al., 2004). The characteristic parameters (such as Tg, average fiber diameter, approximate cooling rate) and preparation methods of the four kinds of fiber samples (HQSiO2, HQGeO2, HQBas, and HQCmP) are listed in Table 1. Note that HQGeO2, HQBas, and HQCmP contains hydroxyl group (<300 ppm). The Tg values of fragile glass systems also drops with increasing hydroxyl content (Deubener et al., 2003), but in the range of low hydroxyl content they are much less sensitive to hydroxyl than those of vitreous silica.
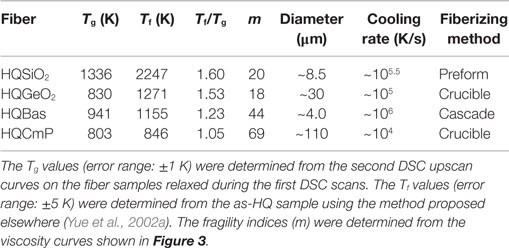
Table 1. Characteristic parameters and preparation methods of the HQ glass fibers.
Differential Scanning Calorimetry
The isobaric heat capacities (Cp) of both bulk and HQ fiber vitreous silica samples were measured by the present author by using the differential scanning calorimetry (DSC) (Netzsch STA 449C Jupiter). To determine the Cp curves of the samples, both the baseline (blank) and the reference sample (sapphire) were measured. The samples for the enthalpy relaxation studies were upscanned in the DSC in argon from 333 K to a temperature above Tg at 20 K/min and subsequently downscanned to room temperature (298 K) at the same rate. Using the same procedure, they were then scanned in DSC for the second time. The Tg values were determined as the onset temperatures of glass transition from the Cp curve of the second DSC upscan. Tg is assigned as the temperature at the cross point between the extrapolated line of the glass Cp and the line of the rapidly rising Cp. The thus-obtained Tg values are in a good agreement with that determined by the enthalpy-matching method (Moynihan et al., 1976; Yue et al., 2002a; Yue, 2008). The Cp curves of HQGeO2, HQBas, and HQCmP were adopted from the literature (Yue, 2002; Yue et al., 2002a; Hornbøll and Yue, 2008b, respectively), which were used for studying the differences in enthalpy relaxation between the fragile and the strong glass systems (particularly vitreous silica). The Tg values of GeO2, basalt, and CaP2O6 glasses were measured using DSC on bulk samples at 10 K/min equal to the first downscan rate. The Tg of vitreous silica was measured at 20 K/min equal to the first downscan rate (see Figures 1 and 2). The fictive temperatures (Tf) were determined using the method proposed by Yue et al. (2002), and are listed in Table 1. The Tf/Tg ratios are also given in Table 1.
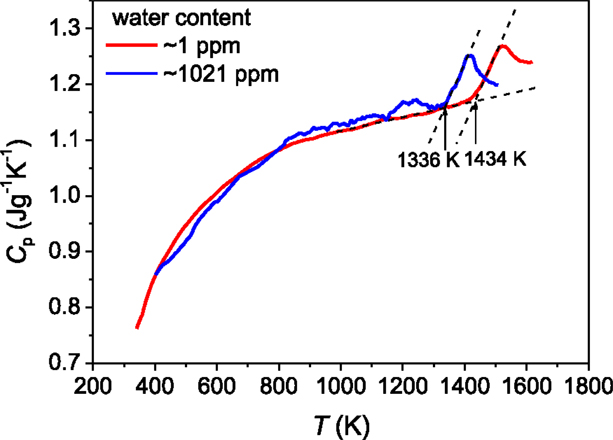
Figure 1. Isobaric heat capacity (Cp) measured during the second DSC upscan as a function of temperature (T) for both the bulk vitreous silica with ~1 ppm hydroxyl (red line) and the vitreous silica fibers (HQSiO2) with 1021 ppm hydroxyl (blue line). The DSC upscan rate is equal to the prior downscan rate of 20 K/min.
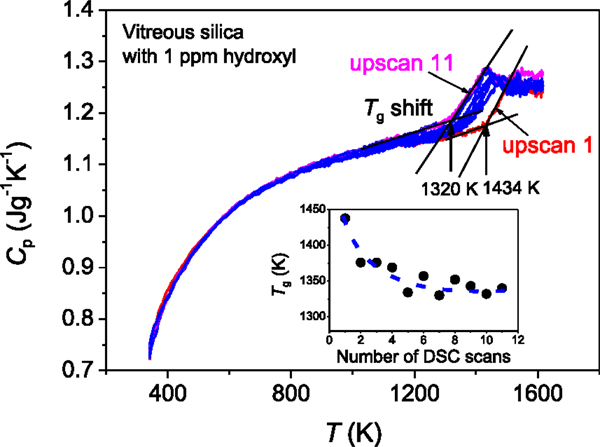
Figure 2. Shift of the onset temperature of glass transition with repeating the DSC up- and downscan at 20 K/min. The upscan curves 1–11 for the bulk vitreous silica with 1 ppm hydroxyl are shown and the downscan curves are not shown. Inset: the Tg drop trend with increasing the number of DSC scans. The dashed line is guide for eyes.
Here, it is important to stress that the Tg values of vitreous silica shown in this paper refer to the onset temperatures of the calorimetric glass transition, but are not the true Tg (instead, apparent Tg), since the samples contain hydroxyl (Figure 1) and were subjected to repeated DSC scans (Figure 2).
Viscosity and Liquid Fragility
The viscosity data of silica (with <10 ppm hydroxyl and a Tg value of 1406 K) were adopted from the literature (Urbain et al., 1982). The viscosity (η)– temperature (T) relations for both GeO2 and CaP2O6 were determined in our previous studies (Yue, 2002; Hornbøll and Yue, 2008b). The η–T relation of the basalt system was measured in the present work. The viscosity data in the range of high T were acquired using a concentric cylinder viscometer consisting of a measuring head (Physical Rheolab MC1 Paar Physica) and a high temperature furnace (HT7 Scandia Ovnen), while those at low T (near glass transition) were measured using a micro-penetration viscometer with a vertical dilatometer (Model VIS 405, Bähr-Termoanalyse). The details of both methods can be found elsewhere (Solvang et al., 2004). The viscosity data were fitted to the viscosity model [Eq. (1)] proposed by Mauro et al., (2009b) to determine the liquid fragility index (m) of SiO2, GeO2, basalt, and CaP2O6 as shown in Table 1.
Sub-Tg Annealing
The annealing experiments were performed on the HQ samples in an electric furnace at various temperatures below Tg under atmospheric atmosphere. The samples were directly put into the furnace at the given annealing temperature Ta. This means that the samples underwent a rapid heating to Ta. Upon annealing for time ta, the samples were directly taken out from the furnace at Ta, giving a cooling rate of about 100 K/s. Thus, the additional annealing time for the temperature range of T < Ta can be neglected compared to the isothermal annealing time.
Glass Transition Temperature of Vitreous Silica
It is challenging to determine the glass transition temperature (Tg) of vitreous silica (Nascimento and Zanotto, 2007). In the present paper, we show the two major factors that cause difficulty in getting the real Tg value of vitreous silica. First, the incorporation of hydroxyl groups into the glass network is difficult to be avoided during production of vitreous silica and it is almost impossible to produce “absolutely dry” vitreous silica. Even 1 ppm hydroxyl could drastically reduce the Tg of vitreous silica. The Tg of 1438 K of the bulk vitreous silica with 1 ppm OH (Figure 1) is lower than that of the vitreous silica with <1 ppm hydroxyl) reported in the literature, i.e., 1480 K) (Richet et al., 1982). To the best of our knowledge, the so-far reported calorimetric Tg values of vitreous silica are lower than 1480 K. This implies that the vitreous silica with Tg = 1480 K is close to the “perfectly dry” state. Second, the calorimetric standard Tg is determined as the onset temperature of the glass transition peak of the Cp curve obtained from the second DSC upscan at a rate equal to that of the prior downscan rate (Yue, 2008). The thus-obtained Tg agrees with the Tg determined using the enthalpy-matching method from the second upscan Cp curve (Moynihan et al., 1976; Yue et al., 2002a). However, different from silicate glasses, vitreous silica is rather sensitive to the repeated dynamic heating–cooling cycles in terms of glass structure. During the first DSC up- and downscans, vitreous silica has already gone structure changes due to structural relaxation, and leads to a decrease of Tg (Figure 2). For example, the Tg of the sample subjected to one heating–cooling circle in DSC is lower than that of the as-produced sample.
Figure 1 shows the calorimetric glass transition of vitreous silica, which is characteristic of a much smaller jump in isobaric heat capacity Cp (ΔCp = 0.07 Jg−1K−1) from glass to liquid state compared to that of normal oxide glass systems. The small Cp jump indicates that vitreous silica is thermodynamically strong (Angell, 1995). It has been reported that Tg of vitreous silica is 1480 K (Richet et al., 1982). The striking phenomenon for vitreous silica is that Tg is extremely sensitive to hydroxyl content (Figure 1). The HQSiO2 studied in this work contains 1021 ppm hydroxyl and, hence, has a significantly lower Tg (1336 K) than that (1434 K) of the vitreous silica with 1 ppm hydroxyl. Increasing hydroxyl content from 1 to 1021 ppm leads to a drastic increase of non-bridging oxygen fraction, which depolymerizes the structural network of glass, and consequently lowers Tg and viscosity (η). In addition, with increasing hydroxyl content, the logη ~1/T relation of molten silica becomes slightly non-Arrhenian, i.e., the liquid fragility becomes higher than those of SiO2 with 1 ppm. Based on the Adam–Gibbs relation (Adam and Gibbs, 1965; Mauro et al., 2009b), the increase in non-Arrhenian degree of relaxation is due to the fact that the configurational entropy (Sc) becomes more dependent on temperature. This means that the incorporation of hydroxyl into the structural network leads to an increase of Sc at a given T. In this work, the HQSiO2 glass with 1021 ppm hydroxyl can still be considered to be a strong system, since its viscosity–temperature relation is close to the Arrhenian one (Murach and Brückner, 1997).
To further check whether the Tg decrease of vitreous silica with hydroxyl content is indeed caused by the role of hydroxyl in depolymerizing the structural network, we compare the metallic impurity level between the fiber and bulk samples since the impurities depolymerize the structural network as well. As stated in the experimental section, the bulk sample with 1 ppm hydroxyl contains ~ <20 ppm metallic impurity, whereas the fiber sample with 1021 ppm has <1 ppm impurity. The fiber sample with lower impurity would have a higher Tg than the bulk sample with higher impurity, if the hydroxyl level were the same. Figure 1 shows that the fiber sample has a lower Tg than the bulk sample. This clearly indicates that the hydroxyl content is the governing factor causing the Tg drop displayed in Figure 1.
Figure 2 demonstrates how sensitive the Tg of silica is to the repeated heating protocol, i.e., to the repeated DSC scans (from scan 1 to 11) at the same up- and downscan rate (20 K/min). We observe a considerable drop in Tg with repeating the DSC scans. From the Cp curves, it is identified that all the 11 upscan Cp curves overlap with each other below Tg, indicating that the vibrational entropy does not vary with the repeating the DSC scan. This implies that the configurational entropy change in the sample from scan 1 to 11 is mainly responsible for the shift of the glass transition peak to lower temperature with repeating DSC scans. In other words, the onset temperature of the jump from vibrational to configurational heat capacity is lowered by repeating the DSC scans. The inset of Figure 2 shows a non-linear Tg decrease with repeating the DSC scan. It is seen that Tg decreases sharply from DSC scan 1 to 2, and afterwards gently falls to a constant value with increasing the DSC scan number. This implies that the structure of vitreous silica may relax to an equilibrium state upon repeated heating–cooling cycles.
Vitreous silica exhibits numerous anomalies, e.g., anomalous thermal expansion, volume relaxation (Brückner, 1971), and liquid–liquid transition (Lascaris et al., 2014). Now we also see the anomalous enthalpy relaxation caused by repeating the heating–cooling circle. Upon the repeated DSC scans, the atomic bonding between structural units (SiO4 tetrahedra) becomes looser. The topological origin of the Tg shift is that the topological constraints are weakened by the repeated heating–cooling cycles, and thereby the onset temperature for the constraints to become rigid upon cooling is lowered (Smedskjaer et al., 2010). However, a quantitative description about the topological and structural origin of the Tg shift is missing. To do so, a detailed structural analysis needs to be done in the future work.
It should be mentioned that there is a tendency for cristobalite to form on the surface of vitreous silica upon DSC upscanning to 1623 K (Jensen et al., 2009). But this type of surface crystallization should not be the reason for the Tg decrease of silica with increasing the number of upscan. If this were the case, the Cp curve in the temperature range below Tg would decline with repeating the DSC scan. Thus, the internal structure change of vitreous silica, instead of the surface crystallization, must be responsible for the Tg shift to lower temperature. The Tg shift phenomenon of vitreous silica is strongly in contrast to the behavior of other glass formers such as low Tg silicate glasses. For instance, the glass transition peak of low Tg silicate glasses remains unchanged and reproducible with repeating the DSC scan. This means that the structure of vitreous silica is much more sensitive to the repeated heating–cooling cycles compared to normal glass formers.
Now we know that the difficulty in determining the true Tg of vitreous silica lies in the fact that the Tg is extremely sensitive to both the hydroxyl content and the number of the heating–cooling cycles. This remind us that when we adopt the Tg value of vitreous silica from the literature, we should always be aware of the two factors, i.e., the hydroxyl content of the sample and the number of the DSC scans for determining Tg. Otherwise, the Tg value would be of high uncertainty for vitreous silica. However, despite the experimental difficulty, we expect that it is still possible to obtain the real Tg of vitreous silica. To do so, it is necessary to do the following experiments in the future work. First, we need to prepare a series of vitreous silica samples covering a large range of hydroxyl contents, measure their Tg values, and then find the relation between Tg and hydroxyl content. Based on this relation, we can extrapolate the Tg trend to the Tg value at 0 hydroxyl content. Second, we need to find the quantitative dependence of the Tg of vitreous silica on the number of the repeated DSC upscan, and then extrapolate it to the 0 scan. The thus-derived Tg can be regarded as the true glass transition temperature of vitreous silica. Implementing the above-mentioned procedures, we expect that the Tg value would approach the true Tg value of dry vitreous silica. An alternative way for determining the standard Tg of vitreous silica is to measure the temperature dependence of viscosity in a large range of temperatures, and thereby to find the temperature corresponding to the viscosity of 1012 Pa s (Yue, 2008). However, it is not straightforward to measure the accurate viscosity data of silica, since rather high temperatures are needed, where chemical disassociation could occur. The viscosity measurements should be conducted within a short period of time.
Enthalpy Relaxation
Figure 3 illustrates the fragility diagram (Angell, 1995) of the four glass-forming systems. The measured viscosity data were fitted to the following equation that describes the Tg-scaled temperature dependence of viscosity (Mauro et al., 2009b):
where η∞ is the high temperature limit of viscosity and m is the fragility index (Angell, 1995). The viscosity at Tg is equal to 1012 Pa s for inorganic glass formers (Yue, 2008, 2009). The m values are listed in Table 1. The solid lines are the fit of the measured data to Eq. (1). It is seen that the fragility index m has the following sequence: GeO2 < SiO2 < Basalt < Ca(PO3)2. Here, the question is how the relaxation behavior in HQ glasses relates to their liquid fragility. This will be answered below.
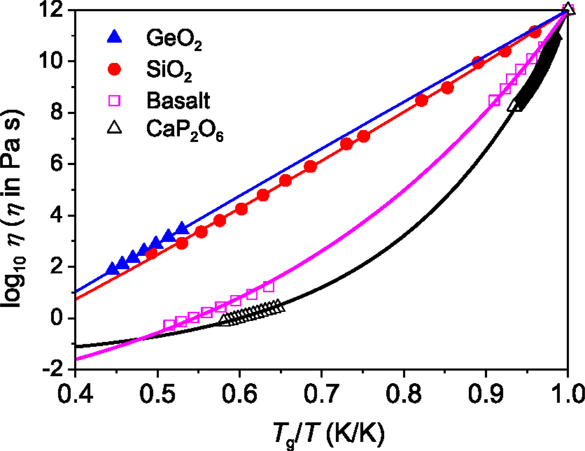
Figure 3. Fragility plots (viscosity η versus the Tg-scaled temperature T) of the four systems. Symbols represent the measured viscosity data of GeO2 (Hornbøll and Yue, 2008b), SiO2 (Urbain et al., 1982), basalt (this work), and CaP2O6 (Yue, 2002). Solid lines show the fits of the measured data to the Eq. (1). The Tg values of GeO2, basalt, and CaP2O6 are given in Table 1, and the Tg value of silica (Urbain et al., 1982) is 1406 K. The fragility index m was found to be 18, 20, 44, and 69 for GeO2, SiO2, Basalt, and CaP2O6, respectively.
Figures 4A,B show the Tg normalized temperature dependences of the isobaric heat capacities (Cp) for the HQBas and HQSiO2, respectively, for both the first and the second DSC upscans, i.e., Cp1 and Cp2 curves. The deviation of Cp1 from Cp2, i.e., the broad exothermic peak, indicates that the energy is released from the HQ samples upon dynamic heating (Yue et al., 2002b). The energy release from the samples is an enthalpy recovery process, i.e., a recovery from the enthalpy of HQ glass to that of standard glass. Standard glass refers to the glass subjected to cooling at 20 K/min, and to subsequent reheating at 20 K/min. The area embraced by Cp1 and Cp2 is the recovered enthalpy, which is equal to the energy trapped in glass by hyperquenching. The enthalpy relaxation of both HQBas and HQSiO2 is clearly seen in Figures 4A,D. To analyze the details of the relaxation process, the excess heat capacity, Cp,exc = Cp2 − Cp1, is plotted against the Tg normalized temperature, T/Tg, as shown in Figures 4C,D. The total excess energy could be estimated by integrating the excess heat capacity Cp,exc over the entire temperature range of the DSC scan.
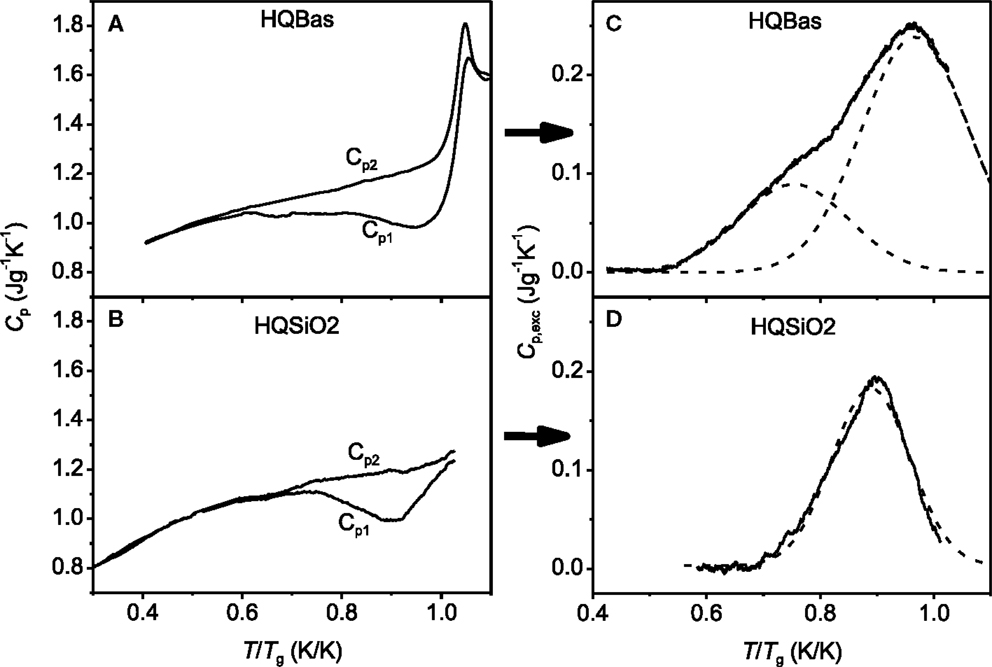
Figure 4. Left panel: Comparison in the isobaric heat capacity (Cp) as a function of the Tg-normalized temperature (T/Tg) between (A) HQBas (hyperquenched basaltic glass) (Yue et al., 2002a) and (B) HQSiO2 (this work). The Tg values are given in Table 1. Cp1 is the heat capacity of the HQ samples measured during the first DSC upscan at 20 K/min. Cp2 is the heat capacity of the samples relaxed during the first downscan at 20 K/min and measured during the second upscan at 20 K/min. Right panel: Comparison in the excess heat capacity Cp,exc (= Cp2 − Cp1) as a function of T/Tg between (C) HQBas and (D) HQSiO2. Solid lines represent the measured Cp,exc curves, while the dashed lines represent the Gaussian fits. The Cp,exc peak of HQBas is the sum of two Gaussian peaks, whereas that of HQSiO2 is described by one Gaussian peak.
Comparing HQBas with HQSiO2 in Figures 4C,D, we detect two striking differences in the enthalpy relaxation. First, the HQBas exhibits a broader and less symmetrical Cp,exc peak compared to HQSiO2. This suggests that the distribution of the excitation kinetic energy for HQBas, which induces release of the trapped potential energy, is broader and more complex than for HQSiO2. The difference in the Cp,exc peak between the two systems implies that strong glass systems have less the configurational microstates than fragile ones. The structural origin of the difference could be described as follows. The structure of the HQB contains various chemical bonding types such as Si–O, Al–O, Na (K)–O, Ca (Mg, Fe)–O, whereas that of the HQSiO2 mainly consists of only Si-O bonds but with different potentials. The width of the Cp,exc peak of the HQ glasses could be associated with the distribution of the chemical bond angle, length, and strength of glass. This distribution determines the overall structural arrangement, and hence the distribution of potential energy in glass. As shown in Figure 4D, the relatively symmetrical Cp,exc peak of HQSiO2 indicates that one type of chemical bond, i.e., the Si–O bonds are involved, but there exists a distribution of the bond angles and bond lengths, and hence a distribution of potential energy, and the latter is narrower than that of multi-component oxide glasses. The distribution of potential energy in a glass becomes broader with increasing its Tf by raising the cooling rate. A higher Tf glass is subjected to a higher degree of the network distortion. As long as the upscan or annealing time is shorter than the relaxation time, the distorted state of network would remain. When the former is close to or longer than the latter, the distorted network would recover, resulting in an energy release.
Second, the Cp,exc(T) peak of the HQBas consists of a “shoulder” and a primary peak (Figure 4C), whereas that of the HQSiO2 consists of only one primary peak (Figure 4D). The relaxation peak of HQBas is deconvoluted into two Gaussian ones in low and high temperature regions, respectively (dashed lines in Figure 4C). The existence of the “shoulder” suggests that there are two distributions of relaxation time that overlap to some extent in the temperature range below Tg. The smaller Gaussian distribution at low temperatures could be associated with relaxation of the bonds between oxygen and modifiers with lower field strength, and also with a higher distortion degree of the oxygen-modifier bonds with higher potential energy. By contrast, the larger primary peak at high temperatures is correlated with relaxation of the bonds between network former and oxygen (i.e., Si-O and Al-O bonds). However, the Cp,exc(T) peak of HQSiO2 can be described by one Gaussian distribution. This implies that the single relaxation peak of HQSiO2 is associated with only one distribution of relaxation time. This Gaussian distribution could be attributed to the distribution of the Si-O-Si bond angles, leading to a distribution of potential energy. The higher the cooling rate is, the higher is the frozen-in degree of the disorder of the SiO4 network, the broader is the distribution of the bond angles, and the larger is the Cp,exc(T) peak.
It has been reported that the potential energy landscape of a strong system may consists of a single metabasin, whereas that of a fragile system displays a proliferation of two well-separated metabasins (Debenedetti and Stillinger, 2001). From the kinetic fragility diagram (Figure 3) and Table 1, we know that the basaltic system is more fragile than SiO2. Accordingly, the two different distributions of relaxation time of the HQBas could relate to a diversity of deep landscape traps and of the pathways of configurational space that connect them, while the single distribution of relaxation time of the HQSiO2 could be linked to a much less diversity of those in the single metabasin of a strong system (Debenedetti and Stillinger, 2001). The silica liquid exhibits almost constant activation energy of 540 kJ/mol (calculated from Figure 4). This constancy indicates that the underlying mechanism, e.g., breaking and reformation of Si–O bonds, applies throughout the entire landscape. During the sub-Tg annealing, those bonds influence with each other when they break and reform. This is attributed to the high network connectivity of vitreous silica. By contrast, a fragile glass former like basalt exhibits a non-Arrhenius flow behavior, and hence a heterogeneous landscape. This could be the reason for the occurrence of the asymmetrical enthalpy relaxation peak in the basaltic glass (Figure 4D).
Figures 5A,B show the effect of the annealing temperature Ta on the enthalpy relaxation of the two fragile systems: basaltic system and calcium metaphosphate system, respectively. By contrast, Figures 5C,D show the annealing effect on the relaxation of the two strong systems: SiO2 and GeO2, respectively. For the fragile systems, with increasing Ta below Tg for 12 h the Cp,exc peak gradually disappears from lower to higher temperature until the entire Cp,exc peak vanishes. The left side of the peak shifts to higher temperature, whereas the right side remains unchanged. In comparison, with increasing Ta (below Tg) for 24 h, HQSiO2 gradually releases its excess energy in the entire temperature range that the Cp,exc peak covers, and this phenomenon manifests itself as a decrease in the peak height. This indicates that a single annealing temperature (representing the kinetic energy) can induce the release of the excessive potential energy of all the excited structural units (e.g., SiO4 tetrahedra) in HQSiO2. Such relaxation feature again implies that there exists only a single metabasin in strong systems (Debenedetti and Stillinger, 2001), which consists of basins with different depths (e.g., different bond energies). The basin depth is distributed over the collective configurational coordinates. A single annealing temperature, i.e., a given single excitation energy kTa for a given ta, can cause the structural units to relax successively by sampling basins from shallow to deep ones. Increasing Ta for a given ta leads to an increase in the degree of relaxation by sampling deeper basins. The energy release of HQSiO2 at any Ta (below Tg) is accompanied by the relaxation of the hyperquenching excited Si-O bonds upon sub-Tg annealing. Driven by the thermal kinetic energy, the SiO4 tetrahedra and the rings consisting of SiO4 tetrahedra collaboratively adjust themselves from their original positions to more stable position. During this process, these structural units are still connected with each other and therefore are influenced by each other. A similar enthalpy relaxation mode is also observed in HQGeO2, indicating that the cooperative relaxation is a universal feature of strong glass formers. The Johari–Goldstein (JG) relaxation has been detected in HQGeO2 by using the hyperquenching-annealing-calorimetric scanning approach although the JG relaxation is difficult to be isolated from the primary relaxation (Hu and Yue, 2008).
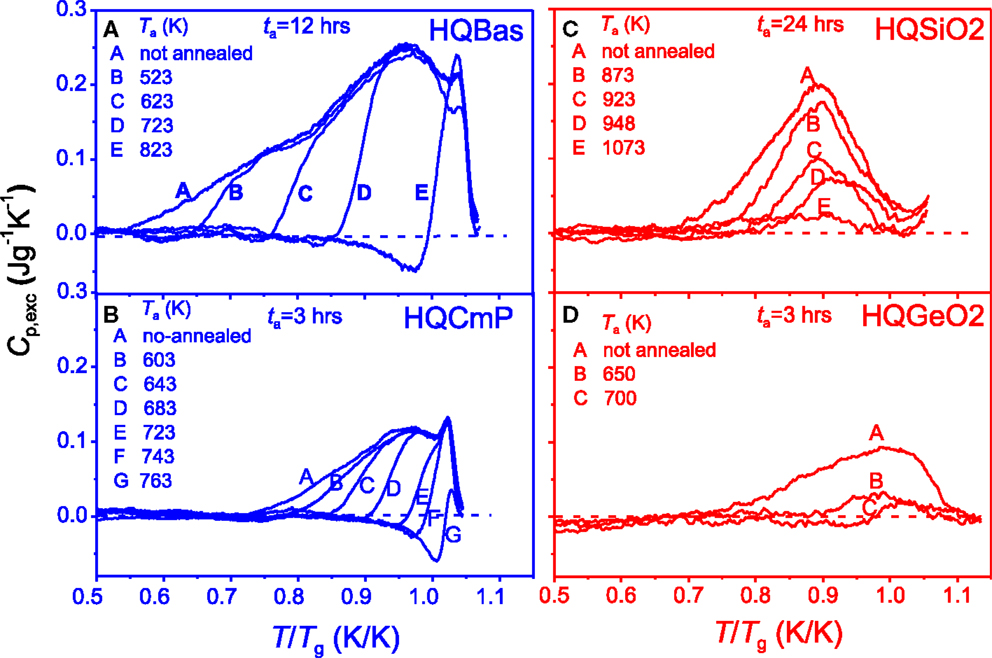
Figure 5. Effect of the annealing temperature Ta on the Cp,exc as a function of T/Tg for a given annealing duration ta. The Tg values are given in Table 1. Left panel (fragile systems): (A) HQBas (Yue et al., 2002a); (B) HQCmP (Yue, 2002). Right panel (strong systems): (C) HQSiO2 containing 1021 ppm hydroxyl (this work); (D) HQGeO2 (Hornbøll and Yue, 2008b). The dashed lines represent the Cp,exc peak (as reference) obtained on the samples cooled at 20 K/min.
Figures 5A,B could indicate the relaxation of the fragile systems during annealing at a given temperature proceeds in the manner that the excess energy release first starts from highly untestable structural domains and ends in the slightly unstable ones. This relaxation feature can be explained in terms of the energy landscape of fragile systems as mentioned above. The difference in relaxation behavior between strong and fragile systems also indicates that the energetic and structural heterogeneities in both HQBas and HQCmP at a given Tf are higher than those of HQSiO2 and HQGeO2 (Yue and Angell, 2004). In addition, Figures 5A–D exhibit another pronounced difference in the enthalpy recovery between the fragile systems and strong systems. In the annealed HQBas and HQCmP glasses, an endothermic pre-peak (i.e., the peaks under zero lines of Cp,exc) is observed prior to the exothermic energy release peak, when Ta is sufficiently high (but below Tg). The extent of the pre-peak can be enhanced by raising Ta. Such a pre-peak is a consequence of the non-exponentiality of enthalpy relaxation, reflecting the energy heterogeneity in HQ fragile glass samples (Yue and Angell, 2004). However, the pre-peak is not observed in HQSiO2 and HQGeO2 (see Figures 5C,D). The lack of the pre-peak in the Cp,exc spectra is another evidence for the lower energetic and structural heterogeneities in strong glass formers.
Here, it is important to point out that for a comparable cooling rate the Tf/Tg ratios of the HQ strong glass systems (HQSiO2 and HQGeO2) are significantly higher than those of the HQ fragile ones (HQBas and HQCmP) as shown in Table 1. This is expected since a strong liquid have a much smaller configurational heat capacity than a fragile one. In other words, compared to a fragile system, a strong one undergoes a smaller configurational entropy jump when its glass state is transformed into a metastable liquid state. This is due to the fact that the structural difference in both short-range order and medium-range order between glass and liquid at Tg is smaller for a strong system than for a fragile one. As a consequence, a similar amount of configurational enthalpy should be trapped at a higher Tf/Tg ratio for a strong system than a fragile one when both are quenched at the same rate if the enthalpy-matching method for determining both the Tg and the Tf of HQ glasses is used (Moynihan et al., 1976; Yue et al., 2002a). In addition, the structural rearrangement in strong liquids during cooling is rather sluggish and, hence, is more readily frozen-in at a higher Tg-normalized temperature compared to fragile ones.
In Figures 6A–D, the Cp,exc is plotted against T/Tg for the four HQ glasses, showing the effect of ta on the enthalpy relaxation at a comparable Ta/Tg ratio. Similar to the Ta effect, an increase of ta results in the shift of the Cp,exc peak from lower to higher temperature for both HQBas and HQCmP (Figures 6A,B), whereas it causes gradual flattening of Cp,exc peak for both HQSiO2 and HQGeiO2 (Figures 6C,D). This indicates that the way of configurational sampling within the potential energy landscape of the strong systems differs from that of fragile ones. For HQBas and HQCmP, at a fixed annealing temperature, i.e., fixed kinetic energy, extending ta increases the probability for a certain type of the chemical bonds (e.g., modifier-oxygen bonds) to escape from higher to lower basins within the potential energy landscape, until all the bonds of the same type fall below the energy level corresponding to Ta. When a basin is sampled, its neighbored basin is influenced and sampled. In other words, the neighbored basins are sampled one after another. During annealing, highly distorted modifier-oxygen ions in HQBas and HQCmP are gradually restored, whereas the distorted bonds remain unaffected. This implies that the structural relaxation of fragile systems is of more heterogeneous nature. By contrast, upon annealing, the relaxation in HQSiO2 is of more cooperative nature. The cooperative relaxation is associated with the coupled rotations of SiO4 tetrahedra (Buchenau et al., 1984) and interaction between different bonds (i.e., bonds with different potentials) due to the high network connectivity of vitreous silica. At a single Ta the coupled motion of bonds from non-equilibrated or heavily distorted state to relatively equilibrated state causes relaxation of the entire network structure. That is why the relaxation of the HQSiO2 takes place in the entire temperature range that the Cp,exc peak covers.
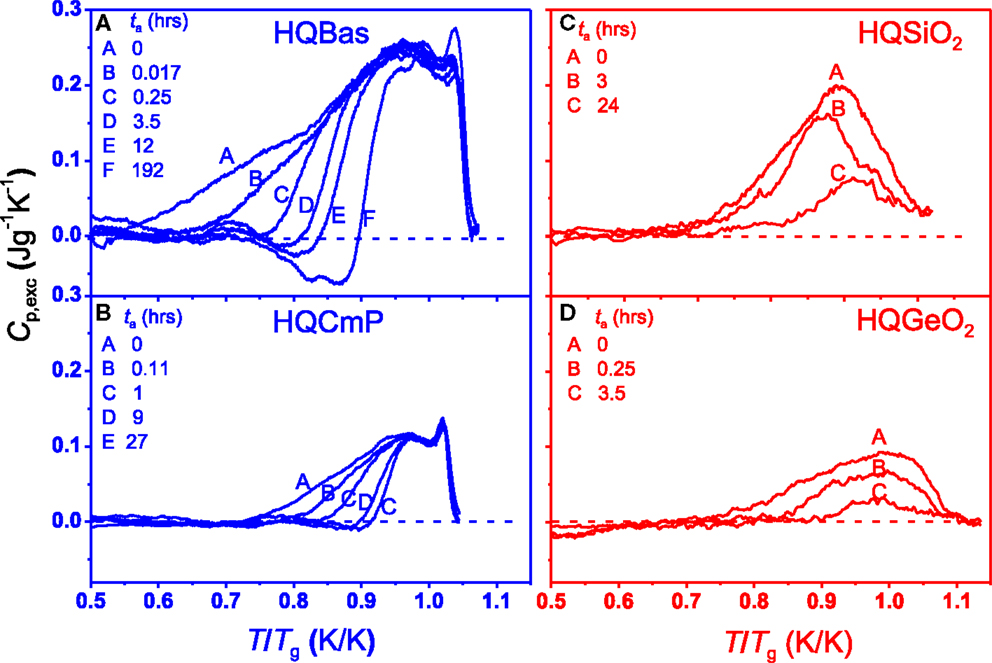
Figure 6. Effect of annealing time (ta) on Cp,exc of HQ glasses as a function of T/Tg at a given annealing temperatures (Ta). The Tg values are given in Table 1. Left panel (fragile systems): (A) HQBas annealed at Ta = 723 K (0.77 Tg) (Yue et al., 2002a); (B) HQCmP annealed at Ta = 614 K (0.77 Tg) (Yue, 2002). Right panel (strong systems): (C) HQSiO2 annealed at Ta = 973 K (0.75 Tg) (this work); (D) HQGeO2 annealed at Ta = 650 K (0.78 Tg) (Hornbøll and Yue, 2008b).
The relaxation of local structural units takes place between the basins via breaking and reforming of bonds. Different local minima can be identified as different bonding types and then energy of minimum coincides with the potential energy of the configuration, i.e., with the number of bonds (Moreno et al., 2005). The structural change caused by extending ta is a kinetic process, during which a gradual increase occurs in population of the basic structural units that participate in jumping from higher to lower minima. Such jumps are dependent on each other.
Furthermore, at the comparable annealing degree (i.e., similar Ta/Tg) the pre-peaks appear in HQBas and HQCmP, whereas they are not present in HQSiO2 and HQGeO2 (Figures 5A–D–6A–D). This confirms again that during annealing the structural relaxation is of more cooperative nature in the strong system compared to the fragile systems. The finding of such features is of both scientific importance and technological importance. The optical and mechanical properties of SiO2 fibers are strongly influenced by their thermal history (e.g., cooling rate and the degree of annealing), the repeated heating–cooling cycles and mechanical history (e.g., drawing stress) (Martin et al., 2005; Hornbøll et al., 2006; Ya et al., 2008). The outcome of this work is useful for optimizing both forming conditions and annealing process of vitreous silica fibers with respect to their optical and mechanical performances.
Here, it should be noted that, during sub-Tg annealing, not only bulk enthalpy relaxation takes place in glass fibers, but also other types of relaxation proceed, e.g., surface relaxation and axial drawing stress relaxation. According to previous studies (Agarwal and Tomozawa, 1997; Koike and Tomozawa, 2006), the surface structural relaxation of silica glass fiber is faster than that of the silica glass plate. This means that the so-called size effect occurs regarding the surface structural relaxation kinetics, i.e., smaller sized samples exhibit faster relaxation kinetics (Koike and Tomozawa, 2006). The size effect was also found for the tensile strength of glass fibers (Lund and Yue, 2010). The surface structural relaxation of vitreous silica may be the mechanism of the mechanical fatigue (Tomozawa and Hepburn, 2004). However, the enthalpy relaxation of HQ glasses during annealing is a bulk effect, not a surface effect and this is confirmed by the matching between experimental observations and physical modeling of the bulk relaxation (Hornbøll et al., 2010). The effect of the surface absorbed water on the enthalpy relaxation pattern could be ruled out since similar relaxation patterns are also observed in HQ metallic glasses that do not have chemically bonded surface water (Hu et al., 2011). Furthermore, the enthalpy enhancement in glass fibers induced by mechanical stretching is much weaker than that induced by hyperquenching, and this is verified by the sub-Tg relaxation studies (Martin et al., 2005; Hornbøll et al., 2006). All this implies that the enthalpy relaxation peaks of HQSiO2 (Figures 5C and 6C) arise mainly from the release of the excessive enthalpy trapped in the samples by hyperquenching, but neither from surface relaxation nor from the stretching stress relaxation. This is also the case for HQ GeO2 (Figures 5D and 6D). Thus, the anomalous enthalpy relaxation in HQSiO2 is a general feature of the HQ strong glass formers. The results of this work have also indirectly confirmed the finding of Mauro and Loucks (2008) that fragile systems have a greater free energy barriers for structural relaxation compared to strong systems. However, a more quantitative study about the relation between enthalpy relaxation and energy landscape need to be carried out in the future.
Conclusion
Tg of vitreous silica is extremely sensitive to both the hydroxyl content and the repeated heating–cooling cycles. This is why a generally accepted Tg value for silica, based on DSC experiments, is still missing in the literature. We suggest that the true Tg value of vitreous silica should be obtained by extrapolating the Tg~hydroxyl content relation to 0 ppm, and by extrapolating the repeated DSC scans to 0 scan.
In comparison to fragile oxide systems, the prototypical strong system – HQ vitreous silica exhibit several striking anomalies in enthalpy relaxation. First, the excess heat capacity peak (Cp,exc) of the HQ strong systems can be described by a single Gaussian pattern, whereas that of the HQ fragile systems can be deconvoluted into two Gaussian patterns at low and high temperatures, respectively. Second, the excess enthalpy trapped in fragile glasses by hyperquenching is successively released with Ta, whereas that of the HQ strong glasses is simultaneously released in the entire temperature range below Tg. Third, an endothermic pre-peak appears in the HQ fragile systems, whereas it does not appear in the HQ strong systems. The HQ GeO2 also shows such anomalies in enthalpy relaxation. This suggests that those anomalies in enthalpy relaxation are a universal feature of strong glass formers. These anomalies could be qualitatively explained in terms of the potential energy landscape, and they reflect a significant difference in structural rearrangement between the strong and fragile systems. The anomalies also imply that the bond relaxations of different types of bonds in HQ fragile systems are of independent nature, while those in HQ strong systems are of cooperative nature. Fragile systems possess a higher degree of energetic and structural heterogeneity than the strong ones. With increasing the annealing temperature and time, the excess enthalpy of the HQ vitreous silica relaxes throughout the entire energy landscape.
Conflict of Interest Statement
The author declares that the research was conducted in the absence of any commercial or financial relationships that could be construed as a potential conflict of interest.
Acknowledgments
This work was financially supported by Danish Research Council under the Grant no. 26-03-0096. The authors would like to thank J. Murach for providing vitreous silica fibers and R. Müller for measuring hydroxyl content in vitreous silica fibers.
References
Adam, G., and Gibbs, J. H. (1965). On the temperature dependence of cooperative relaxation properties in glass forming liquids. J. Chem. Phys. 43, 139–146. doi: 10.1063/1.1696442
Agarwal, A., and Tomozawa, M. (1997). Surface and bulk structural relaxation kinetics of silica glass. J. Non Cryst. Solids 209, 264–272. doi:10.1016/S0022-3093(96)00570-4
Angell, C. A. (1995). Formation of glasses from liquids and biopolymers. Science 267, 1924–1935. doi:10.1126/science.267.5206.1924
Angell, C. A., Yue, Y. Z., Wang, L. M., Copley, J. R. D., Borick, S., and Mossa, S. (2003). Potential energy, relaxation, vibrational dynamics and the boson peak, of hyperquenched glasses. J. Phys. Condens. Matter 15, S1051–S1068. doi:10.1088/0953-8984/15/11/327
Bateson, S. (1958). Critical study of the optical and mechanical properties of glass fibers. J. Appl. Phys. 29, 13. doi:10.1063/1.1722934
Brückner, R. (1971). Properties and structure of vitreous silica. II. J. Non Cryst. Solids 5, 177–216. doi:10.1016/0022-3093(71)90032-9
Buchenau, U., Nücker, N., and Dianoux, A. J. (1984). Neutron scattering study of the low-frequency vibrations in vitreous silica. Phys. Rev. Lett. 53, 2316. doi:10.1103/PhysRevLett.53.2316
Chumakov, A. I., Monaco, G., Fontana, A., Bosak, A., Hermann, R. P., Bessas, D., et al. (2014). Role of disorder in the thermodynamics and atomic dynamics of glasses. Phys. Rev. Lett. 112, 025502. doi:10.1103/PhysRevLett.112.025502
Debenedetti, P. G., and Stillinger, F. H. (2001). Supercooled liquids and the glass transition. Nature 410, 259–267. doi:10.1038/35065704
Deubener, J., Müller, R., Behrens, H., and Heide, G. (2003). Water and the glass transition temperature of silicate melts. J. Non Cryst. Solids 330, 268–273. doi:10.1016/S0022-3093(03)00472-1
Guo, X. J., Mauro, J. C., Potuzak, M., and Yue, Y. Z. (2012). Structural relaxation in annealed hyperquenched basaltic glasses: Insights from calorimetry. J. Non Cryst. Solids 358, 1356–1361. doi:10.1016/j.jnoncrysol.2012.03.009
Hornbøll, L., Knudsen, T., Yue, Y. Z., and Guo, X. J. (2010). Heterogeneous enthalpy relaxation in glasses far from equilibrium. Chem. Phys. Lett. 494, 37–40. doi:10.1016/j.cplett.2010.05.077
Hornbøll, L., Lonnroth, N., and Yue, Y. Z. (2006). Energy release in isothermally stretched silicate glass fibers. J. Am. Ceram. Soc. 89, 70–74. doi:10.1111/j.1551-2916.2005.00736.x
Hornbøll, L., and Yue, Y. Z. (2008a). Enthalpy relaxation of hyperquenched glasses and its possible link to α and β-relaxations. J. Non Cryst. Solids 354, 350–354. doi:10.1016/j.jnoncrysol.2007.06.101
Hornbøll, L., and Yue, Y. Z. (2008b). Enthalpy relaxation in hyperquenched glasses of different fragility. J. Non Cryst. Solids 354, 1862–1870. doi:10.1016/j.jnoncrysol.2007.10.023
Hu, L. N., and Yue, Y. Z. (2008). Secondary relaxation behavior in a strong glass. J. Phys. Chem. B 112, 9053–9057. doi:10.1021/jp711696p
Hu, L. N., Yue, Y. Z., and Zhang, C. Z. (2011). Abnormal sub-Tg enthalpy relaxation in the CuZrAl metallic glasses far from equilibrium. Appl. Phys. Lett. 98, 081904. doi:10.1063/1.3556659
Huang, J., and Gupta, P. K. (1992). Enthalpy relaxation in thin glass fibers. J. Non Cryst. Solids 151, 175–181. doi:10.1016/0022-3093(92)90026-G
Jensen, M., Keding, R., Höche, T., and Yue, Y. Z. (2009). Biologically formed mesoporous amorphous silica. J. Am. Chem. Soc. 131, 2717–2721. doi:10.1021/ja808847y
Kiczenski, T. J., and Stebbins, J. F. (2006). The development of a rapid quenching device for the study of the dependence of glass structure on fictive temperature. Rev. Sci. Instrum. 77, 013901. doi:10.1063/1.2162751
Koike, A., and Tomozawa, M. (2006). Size effect on surface structural relaxation kinetics of silica glass sample. J. Non Cryst. Solids 352, 3787–3793. doi:10.1016/j.jnoncrysol.2006.06.020
Lascaris, E., Hemmati, M., Sergey, V., Buldyrev, S. V., Stanley, H. E., and Angell, C. A. (2014). Search for a liquid-liquid critical point in models of silica. J. Chem. Phys. 140, 224502. doi:10.1063/1.4879057
Lund, M. D., and Yue, Y. Z. (2010). Impact of drawing stress on the tensile strength of oxide glass fibers. J. Am. Ceram. Soc. 93, 3236–3243. doi:10.1111/j.1551-2916.2010.03879.x
Martin, B., Wondraczek, L., Deubener, J., and Yue, Y. Z. (2005). Mechanically induced excess enthalpy in inorganic glasses. Appl. Phys. Lett. 86, 121917. doi:10.1063/1.1895483
Mauro, J. C., and Loucks, R. J. (2008). Impact of fragility on enthalpy relaxation in glass. Phys. Rev. E 78, 021502. doi:10.1103/PhysRevE.78.021502
Mauro, J. C., Allan, D. C., and Potuzak, M. (2009a). Nonequilibrium viscosity of glass. Phys. Rev. B 80, 094204. doi:10.1103/PhysRevB.80.094204
Mauro, J. C., Yue, Y. Z., Ellison, A. J., Gupta, P. K., and Allan, D. C. (2009b). Viscosity of glass-forming liquids. Proc. Natl. Acad. Sci. U.S.A. 106, 19780–19784. doi:10.1073/pnas.0911705106
Mei, Q., Benmore, C. J., and Weber, J. K. R. (2007). Structure of liquid SiO2: a measurement by high-energy x-ray diffraction. Phys. Rev. Lett. 98, 057802. doi:10.1103/PhysRevLett.98.057802
Monaco, A., Chumakov, A. I., Yue, Y. Z., Monaco, G., Comez, L., Fioretto, D., et al. (2006). Density of vibrational states of a hyperquenched glass. Phys. Rev. Lett. 96, 205502. doi:10.1103/PhysRevLett.96.205502
Moreno, A. J., Buldyrev, S. V., La Nave, E., Saika-Voivod, I., Sciortino, F., Tartaglia, P., et al. (2005). Energy landscape of a simple model for strong liquids. Phys. Rev. Lett. 95, 157802. doi:10.1103/PhysRevLett.95.157802
Moynihan, C. T., Easteal, A. J., Debolt, M. A., and Tucker, J. (1976). Dependence of the fictive temperature of glass on cooling rate. J. Am. Ceram. Soc. 59, 12–16. doi:10.1111/j.1151-2916.1976.tb09376.x
Murach, J., and Brückner, R. (1997). Preparation and structure-sensitive investigations on silica glass fibers. J. Non Cryst. Solids 211, 250–261. doi:10.1016/S0022-3093(96)00635-7
Nascimento, M. L. F., and Zanotto, E. D. (2007). Diffusion processes in vitreous silica revisited. Phys. Chem. Glasses Eur. J. Glass. Sci. Technol. B 48, 201–217.
Richet, P., Bottinga, Y., Denielou, L., Petitet, J. P., and Tequi, C. (1982). Thermodynamic properties of quartz, cristobalite and amorphous SiO2: drop calorimetry measurements between 1000 and 1800 K and a review from 0 to 2000 K. Geochim. Cosmochim. Acta 46, 2639–2658. doi:10.1016/0016-7037(82)90383-0
Saika-Voivod, I., Poole, P. H., and Sciortino, F. (2001). Fragile-to-strong transition and polyamorphism in the energy landscape of liquid silica. Nature 412, 514–517. doi:10.1038/35087524
Smedskjaer, M. M., Mauro, J. C., Sen, S., and Yue, Y. Z. (2010). Quantitative design of glassy materials using temperature-dependent constraint theory. Chem. Mater. 22, 5358–5365. doi:10.1021/cm1016799
Solvang, M., Yue, Y. Z., Jensen, S. L., and Dingwell, D. B. (2004). Rheological and thermodynamic behaviors of different calcium aluminosilicate melts with the same non-bridging oxygen content. J. Non Cryst. Solids 336, 179–188. doi:10.1016/j.jnoncrysol.2004.02.009
Tomozawa, M., and Hepburn, R. W. (2004). Surface structural relaxation: a possible mechanism of mechanical fatigue. J. Non Cryst. Solids 345, 449–460. doi:10.1016/j.jnoncrysol.2004.08.065
Urbain, G., Bottinga, Y., and Richet, P. (1982). Viscosity of liquid silica, silicates and alumino-silicates. Geochim. Cosmochim. Acta 46, 1061–1072. doi:10.1016/0016-7037(82)90059-X
Ya, M., Deubener, J., and Yue, Y. Z. (2008). Enthalpy and anisotropy relaxation of glass fibers”. J. Am. Ceram. Soc. 91, 745–752. doi:10.1111/j.1551-2916.2007.02100.x
Yue, Y. Z. (2002). Fragility of a calcium phosphate melt and relaxation of its glass fibers. Phosphorus Res. Bull. 13, 39–49. doi:10.3363/prb1992.13.0_39
Yue, Y. Z. (2004). Influence of physical ageing on the excessive heat capacity of hyperquenched silicate glass fibers. J. Non Cryst. Solids 348, 72–77. doi:10.1016/j.jnoncrysol.2004.08.128
Yue, Y. Z. (2008). Characteristic temperatures of enthalpy relaxation in glass. J. Non Cryst. Solids 354, 1112–1118. doi:10.1016/j.jnoncrysol.2006.11.027
Yue, Y. Z. (2009). The iso-structural viscosity, configurational entropy and fragility of oxide liquids. J. Non Cryst. Solids 355, 737–744. doi:10.1016/j.jnoncrysol.2009.01.032
Yue, Y. Z., and Angell, C. A. (2004). Clarifying the glass-transition behaviour of water by comparison with hyperquenched inorganic glasses. Nature 427, 717–720. doi:10.1038/nature02295
Yue, Y. Z., Jensen, S. L., and Christiansen, J. deC. (2002a). Physical aging in a hyperquenched glass. Appl. Phys. Lett. 81, 2983–2985. doi:10.1063/1.1514386
Yue, Y. Z., Christiansen, J. deC., and Jensen, S. L. (2002b). Determination of the fictive temperature for a hyperquenched glass. Chem. Phys. Lett. 357, 20–24. doi:10.1016/S0009-2614(02)00434-7
Yue, Y. Z., von der Ohe, R., and Jensen, S. L. (2004). Fictive temperature, cooling rate and viscosity of glasses. J. Chem. Phys. 120, 8053–8059. doi:10.1063/1.1689951
Zhang, Y. F., Hu, L. N., Liu, S. J., Zhu, C. F., and Yue, Y. Z. (2013a). Sub-Tg enthalpy relaxation in an extremely unstable oxide glass and its implication for structural heterogeneity. J. Non Cryst. Solids 381, 23–28. doi:10.1016/j.jnoncrysol.2013.09.018
Zhang, Y. F., Yang, G., and Yue, Y. Z. (2013b). Calorimetric signature of structural heterogeneity in a ternary silicate glass. J. Am. Ceram. Soc. 96, 3035–3037. doi:10.1111/jace.12562
Zhang, Y. F., Guo, X. J., and Yue, Y. Z. (2013c). Effect of the initial stage of annealing on modeling of enthalpy relaxation in a hyperquenched glass. J. Non Cryst. Solids 378, 121–125. doi:10.1016/j.jnoncrysol.2013.06.029
Keywords: vitreous silica, glass transition temperature, enthalpy relaxation, hyperquenching, annealing
Citation: Yue Y (2015) Anomalous enthalpy relaxation in vitreous silica. Front. Mater. 2:54. doi: 10.3389/fmats.2015.00054
Received: 08 April 2015; Accepted: 15 July 2015;
Published: 07 August 2015
Edited by:
Ashutosh Goel, Rutgers, The State University of New Jersey, USAReviewed by:
Minoru Tomozawa, Rensselaer Polytechnic Institute, USAPrabhat K. Gupta, The Ohio State University, USA
Jeetendra Sehgal, Sterlite Technologies Limited, India
Yaqoot Shaharyar, Rutgers, The State University of New Jersey, USA
Copyright: © 2015 Yue. This is an open-access article distributed under the terms of the Creative Commons Attribution License (CC BY). The use, distribution or reproduction in other forums is permitted, provided the original author(s) or licensor are credited and that the original publication in this journal is cited, in accordance with accepted academic practice. No use, distribution or reproduction is permitted which does not comply with these terms.
*Correspondence: Yuanzheng Yue, Fredrik Bajers Vej 7H, Aalborg, Denmark,eXlAYmlvLmFhdS5kaw==