 Katherine L. Aughenbaugh
 Paul Stutzman2
 Maria C. G. Juenger
- 1Petroleum and Geosystems Engineering, The University of Texas at Austin, Austin, TX, USA
- 2National Institute of Standards and Technology, Gaithersburg, MD, USA
- 3Civil, Architectural and Environmental Engineering, The University of Texas at Austin, Austin, TX, USA
In this study, four Class F fly ashes were studied with a scanning electron microscope; the glassy phases were identified and their compositions quantified using point compositional analysis with k-means clustering and multispectral image analysis. The results showed that while the bulk oxide contents of the fly ashes were different, the four fly ashes had somewhat similar glassy phase compositions. Aluminosilicate (AS) glasses, calcium aluminosilicate (CAS) glasses, a mixed glass, and, in one case, a high iron glass were identified in the fly ashes. Quartz and iron crystalline phases were identified in each fly ash as well. The compositions of the three main glasses identified, AS, CAS, and mixed glass, were relatively similar in each ash. The amounts of each glass were varied by fly ash, with the highest calcium fly ash containing the most of calcium-containing glass. Some of the glasses were identified as intermixed in individual particles, particularly the calcium-containing glasses. Finally, the smallest particles in the fly ashes, with the most surface area available to react in alkaline solution, such as when mixed with Portland cement or in alkali-activated fly ash, were not different in composition than the large particles, with each of the glasses represented. The method used in the study may be applied to a fly ash of interest for use as a cementing material in order to understand its potential for reactivity.
Introduction
Fly ash is a byproduct of coal burning power plants frequently used in concrete construction as a replacement for Portland cement or, more recently, as the powder precursor to alkali-activated cements, also called geopolymers. Fly ash is formed from combustion of coal for electric power generation and its composition and morphology are largely products of the parent coal and the operating conditions of the boiler (McCarthy et al., 1989). The material is mostly glassy, composed of 50–90% amorphous material as found by XRD studies (Ward and French, 2006). The remaining portion of the fly ash is made up of crystalline material, typically quartz, iron oxides, mullite, lime, and periclase (Roy et al., 1984; Hemmings and Berry, 1987). It is known that there are multiple glassy phases within a given fly ash (Hemmings and Berry, 1987). The glasses are mainly ASs that take the tetrahedral form of the pure silicate (Si + O) glass structure (Hemmings and Berry, 1987). Network modification from the ideal glass structure may occur when network substitutions (Fe, B, P, etc.) or network modifiers in the form of cations (Na+, K+, Ca2+, Mg2+) are introduced to the structure. Both mechanisms of disorder affect free energy and reactivity in alkaline solutions relevant to cementitious systems, and both occur in fly ash. In fly ash, calcium contributes to the disordered nature of the glassy phases, which can increase the reactivity of the raw material (Hemmings and Berry, 1987). For use as a partial Portland cement replacement, ASTM C618-12 (2012) classifies fly ash as either Class C or Class F, with the former specified to have a lower sum of SiO2, Al2O3, and Fe2O3 and, thus, a higher CaO content. Since the CaO content in a fly ash can increase the disorder of the glasses in the fly ash, the reactivity of the fly ash is also impacted by such compositional differences. However, bulk compositional information alone is not sufficient to predict reactivity and further characterization must be completed.
An important predictor of whether a fly ash will successfully react in the high pH solutions present in both Portland cement systems (after initial cement dissolution) and in geopolymers (from alkaline activators) is the proportion of the fly ash that exists in glassy phase (Williams and van Riessen, 2010), but the individual glasses are difficult to identify. The bulk fraction of glassy phase can be measured in a fly ash using X-ray powder diffraction to quantify the crystalline phases and, thus, the glass fraction by subtraction (Young, 1993). Characterization of the individual glasses in this bulk glassy phase becomes more complicated. Two capabilities of the SEM have been used to collect this information: point X-ray analysis, which calculates the actual composition of a point in the fly ash image using standards-based or standardless algorithms, and X-ray mapping using energy dispersive spectroscopy (EDS), which maps the location and relative concentration of individual elements in the fly ash (but does not typically give actual compositional data, depending on the software package used). Several researchers (Williams et al., 2005; Chancey et al., 2010; Bumrongjaroen et al., 2011; Kruse, 2012; Dhole et al., 2013; Durdziński et al., 2015) have used SEM X-ray point-counting methods to establish the chemical composition of the various glasses within fly ash in an attempt to better understand its internal structure and potential for reactivity. Investigations on interparticle and intraparticle chemical differences in fly ashes have been completed using EDS mapping (Joshi et al., 1984; Stevenson and Huber, 1986; Qian and Glasser, 1987; Williams et al., 2005; Chancey et al., 2010; Bumrongjaroen et al., 2011; Durdziński et al., 2015). The collected EDS maps can be analyzed using multispectral image analysis (MSIA), in which the maps of individual elements taken over the same field of view are stacked on top of each other and the image is assessed for regional differences using the stack of all element maps at each pixel location. In the case of fly ash, the information contained in the stacked maps corresponds to crystalline and glassy phases in the fly ash. Coupled with the point-counting method to define the glassy phase composition for each glass, a more specific understanding of the fly ash composition is achieved using MSIA. Other methods that have been used to characterize glasses in fly ash include the location of the fly ash’s vitreous halo in X-ray diffraction (Hemmings and Berry, 1987; Kilgour and Diamond, 1987; Duxson and Provis, 2008), the fly ash’s vitreous alumina content (Fernández-Jiménez and Palomo, 2003), and the morphology and size of the fly ash particles.
Given the complexity of fly ash glass composition, analyzing the data collected using point compositional analysis can be difficult. One method that has strong potential to be widely used in fly ash compositional analysis is k-means clustering of point compositions from a large number of points in the fly ash sample. The k-means clustering algorithm was introduced in the 1970s and is a method in which a matrix of M points in N dimensions is clustered using K cluster centers in N dimensions (Hartigan and Wong, 1979). When applied to fly ash, the (M–N) coordinates analyzed in k-means analysis take on the dimensions of the amount of each element measured in each point in the fly ash, and clustering results in classes of similar compositional features. This method has been used in fly ash characterization by Bumrongjaroen et al. (2011) in a study on defining glass compositions found in commercial fly ashes. The researchers studied over 10,000 points and used k-means clustering to define the various phases in the fly ash. In the k-means data analysis process, the operator must select the number of clusters, K, that best defines phases in a fly ash; the empirical nature of this process was noted by Bumrongjaroen et al. (2011). Nevertheless, it is a useful method for identifying particles of fly ash with similar compositions, which can be used as the training classes in the MSIA data processing technique.
The work presented in this paper uses SEM point counts and X-ray maps, k-means clustering, and MSIA characterization methods to assess whether fly ashes of various bulk compositions have similar glassy phases. The paper describes a modification to the method published by Chancey et al. (2010) to analyze fly ashes for glassy phase composition using SEM coupled with MSIA. K-means analysis was employed to help in the MSIA phase segmentation process. The glassy phase compositional results for four Class F fly ashes are given. The four fly ashes in the study were selected because they had somewhat different compositions; in particular the amount of CaO in each varied, and they represented a range of fineness. The phases identified are presented here, including the compositions of those phases, how the phases compared to the bulk oxide analysis for each fly ash, the spatial correlation of phases within particles, and the morphology of the fly ash particles in relation to their compositions. Class F fly ashes were examined because they are commonly used as partial Portland cement replacements and as AS precursors for geopolymer cements. Previous works have applied MSIA to a single Class F fly ash (Chancey et al., 2010) or several Class C fly ashes (Durdziński et al., 2015), so this work extends these studies by examining several Class F fly ashes in a similar way. By characterizing fly ash glasses, it may be possible to predict their reactivity in the highly alkaline environments of Portland or geopolymer cements.
Materials and Methods
Fly Ashes
Four Class F (ASTM C618-12, 2012) fly ashes were characterized in this study. The oxide analyses as provided by the manufacturers are given in Table 1. The values do not add up to 100% due to the presence of other oxides not typically reported for the ASTM classification. Each fly ash was obtained from a different source; three of the four fly ashes were produced in Texas, with the fourth originating in California. Each fly ash was given a nickname for reporting purposes. Despite being Class F fly ashes, several of these fly ashes had relatively high CaO contents. The CC fly ash had the highest CaO content of these fly ashes at ~13%. The FO fly ash had relatively low-calcium compared to the other three ashes with 5.6% CaO, while the ML and LEGS fly ashes contained around 10% CaO. Table 2 shows the particle sizes (in micrometer) below which 10, 50, and 90% (d10, d50, and d90) of the particles in each of the fly ashes fall (as measured by a laser particle size analyzer, Malvern Instruments).1 , 2 The CC and ML fly ashes were relatively fine, while the FO and LEGS fly ashes were coarser.
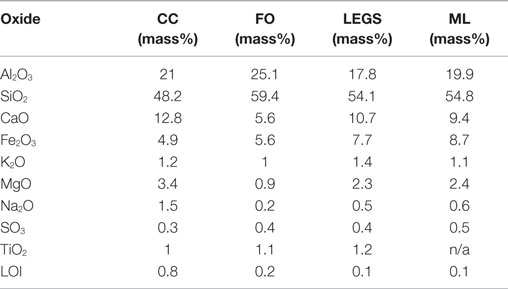
Table 1. Oxide analysis (mass%) provided by manufacturer, based on a single analysis.
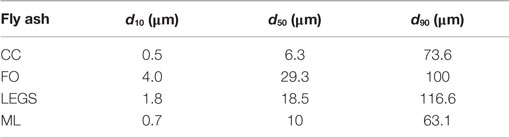
Table 2. Fly ash particle size distributions as measured by laser particle size analysis, based on a single analysis.
Compositional Analysis
Sample Preparation
For SEM analysis, fly ashes were mounted in epoxy, cured, and ground and polished to a smooth surface. Sample preparation procedures are summarized here, and additional details may be found in Chancey et al. (2010) and Aughenbaugh (2013). Epoxy blanks measuring ~32 mm in diameter × 14 mm thick were cast and cured following the epoxy manufacturer’s directions. Eight millimeter wells were drilled into the blanks, and fly ash samples were mixed with epoxy at a 2:1 weight ratio and placed in each well. After curing for 24 h at 40°C and 24 h at room temperature (23–25°C), the samples were ground with a series of silicon carbide papers of increasing fineness, then polished with diamond pastes of increasing fineness applied to a twill cloth and secured on a rotating platen. This ensured a microscopic level of flatness in the sample for accurate EDS analysis. The samples were coated with carbon at about 0.25–0.30 nm thickness as measured by the brass substrate method (Kerrick, et al., 1973) prior to analysis in the SEM.
SEM Imaging and Compositional Data Collection
Scanning electron microscopy was completed with a FEI Quanta 6003 (tungsten filament) at 10 kV accelerating voltage, and the electron beam current was maintained at 2.5 nA and monitored between data sets using a Faraday cup. Backscattered electron (BSE) images were collected for each fly ash using a two-pole solid-state backscattered detector mounted directly above the specimen. Dual EDS detectors (Bruker Quantax)4 were employed to collect X-ray signals for quantitative analysis and X-ray maps. X-ray maps and BSE images were collected using a slow 256 μs dwell time per pixel and line averaging of 2 with a 1024 × 768 map size. Each sweep required ~6 min to collect with four sweeps summed to complete data collection, requiring ~24 min for each data set. The data were saved as 16-bit TIFF files, which allowed for preservation of the actual X-ray counts for each element at each pixel. Maps of Ca, Si, Al, Fe, Na, Mg, K, Ti, O, S, and C were collected for each fly ash.
In addition to images, quantitative X-ray microanalysis was performed for an average of 60 discrete points per imaging field of view in order to quantitatively measure the compositions at individual points in the fly ash particles. Standards-based EDS analysis was completed using three reference standards, the NBS 1716 glass, NIST K412 glass, and rhyolite mineral5 from the Smithsonian (Jarosewich, 2002) to calibrate the EDS system. The collection conditions were 45 s (real time) collection time at each point, and automatic ZAF correction and analysis after compositional data acquisition.
Clustering
K-means analysis was used to help define the phases found in each fly ash. This method used the point compositional data taken for each fly ash and clustered similar points as a particular phase. The built-in k-means algorithm in MATLAB6 was used. In the work done here, the distance parameter to be minimized for each cluster was set to use the squared Euclidean distance similar to Bumrongjaroen et al. (2011). The number of clusters, k, must be specified in the algorithm, although the code can be written such that multiple k-values are run successively so that the researcher can then select the best value based on the number of phases empirically identified in the fly ash. A sample of the clustered data for the ML ash is given in Figure 1, which shows plots of the clustered points (each cluster, k = 5, was denoted by different colors) showing the relative calcium, silicon, and aluminum in each phase. When an element was plotted relative to itself, the resultant plot was a line with slope = 1. The other plots give the researcher insight into how a phase was likely clustered (i.e., calcium–silicon or calcium–aluminum). If phases appear to have too great a range of any of the elements, for example the range of calcium in the particles is large while the range of other elements is small, then it is likely a greater number of clusters should be considered. Because the compositions of glasses in fly ash are less discrete and more continuous in nature, the number of phases in the ash is a decision that is made with the help of the researcher’s interpretation of the plots.
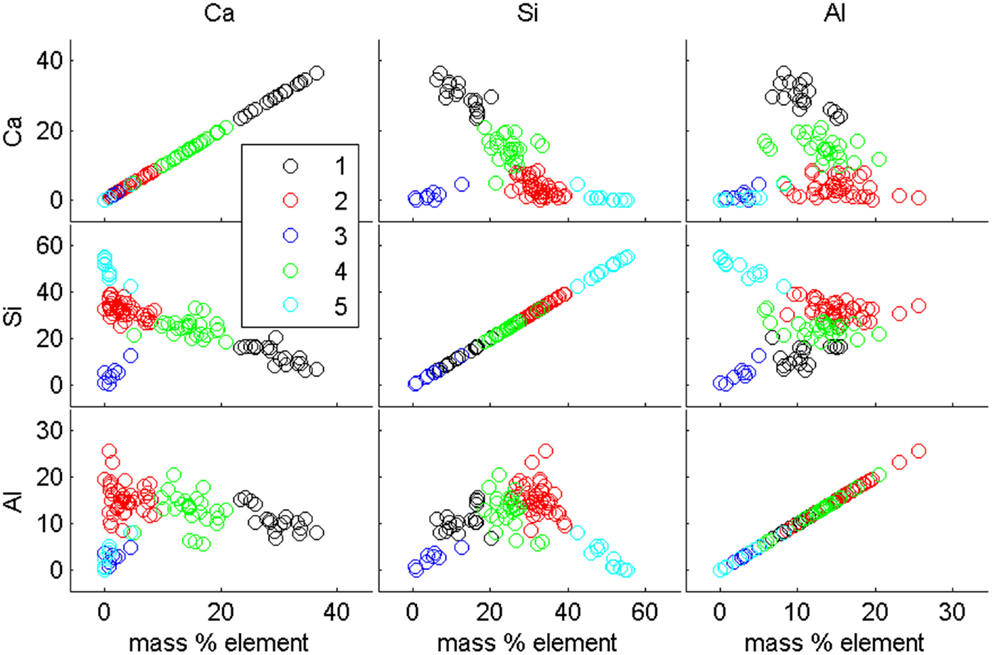
Figure 1. K-means cluster result for the ML fly ash showing just the calcium, silicon, and aluminum plotted against one another with five clusters as the selected k-value.
Two fields of view for each fly ash were used for defining the phase compositions by k-means analysis. Approximately 120 points per fly ash were used in the k-means clustering, 60 in each field of view. It is worth noting here that these are a small number of data points for comprehensive characterization of fly ash, and Bumrongjaroen et al. (2011) reported using ~10,000 point compositional measurements per fly ash. However, the purpose of this clustering algorithm was to aid in training class selection for MSIA, so the large number of points used in the referenced work was not necessary in this case. After classification, the clusters were reviewed to find a range of the major constituent compositions, primarily calcium, silicon, or aluminum, present in each phase in the fly ash, since these were the dominant elements in most particles. However, a few particles of iron-rich maghemite, magnetite, or hematite were identified in some fly ashes. Fly ashes are generally a continuum of glass compositions, rather than discrete easily defined phases, so the defined phases typically had relatively large compositional ranges.
Multispectral Image Analysis
Multispectral image analysis has been described for minerals (Lydon, 2005) and fly ash (Chancey et al., 2010). The method used X-ray maps of the fly ashes to estimate quantities of each phase as defined by k-means analysis of the compositional data. The X-ray maps were pre-processed using ImageJ7 and MATLAB. The processed images were saved as 16-bit TIFF files to preserve raw data values and were converted to 8-bit TIFF files using MATLAB. Pixel value scaling was unnecessary since no pixel value in any X-ray map exceeded 255, which is the maximum value for 8-bit pixels. The images often looked black when opened in ImageJ due to low counts for that particular element. To better view the images, the display image could be modified in ImageJ by adjusting the high end of brightness from 255 down to the maximum pixel value in the image. This did not change the raw data values. ImageJ was used to perform any smoothing operations necessary to make particle edges more clear and remove noise from the images. Often, a median filter of radius = 1 was used for this purpose. This filter replaced all pixel values in the image by finding the median value of pixels at a user-defined neighborhood surrounding each pixel. Thus, for a radius = 1 median filter, the software only looked at the pixels immediately touching the center pixel. The thresholded blur filter (available as a plugin) was another smoothing filter used, and it was similar to the median filter but included additional parameters in recalculating pixel values. Thresholded blur allowed for more control over the strength of the filter. Finally, the low-end pixels deemed noise were replaced with 0 values using MATLAB. The noise cutoff value was determined visually using ImageJ and the adjust brightness/contrast function. These steps were used only as necessary on an image-by-image basis, and the minimum pre-processing was used.
The images were stacked digitally using MultiSpec8 in order to conduct MSIA. Three maps were viewed simultaneously as red, green, and blue channels; changing which elemental maps were turned on provides the means to visualize the spatial distribution of the composition. A sample image is shown in Figure 2 with red showing the aluminum map, green showing the silicon map, and blue showing the calcium map. The various colors in the image represent blended phases of glass and/or crystalline material. From this type of map, groups of pixels were then selected in regions of different composition and were defined as the training field for each phase in the fly ash. The k-means analysis results, which were derived from the quantitative point compositional data, were used in this step by selecting pixels in the particles that were grouped together by k-means as the training pixels for the phases in MSIA analysis. The MultiSpec program then assigned every pixel in the image to the most likely of the defined fields from which an area percentage of each phase was calculated. In this work, the Fisher linear discriminant method was used, as it gave the best results for these data sets and was suggested as an appropriate classification method for geological samples by Lydon (2005). The initial number of clusters was set to 9, which meant that the program randomly placed nine cluster centers from which to classify the pixels in the image.
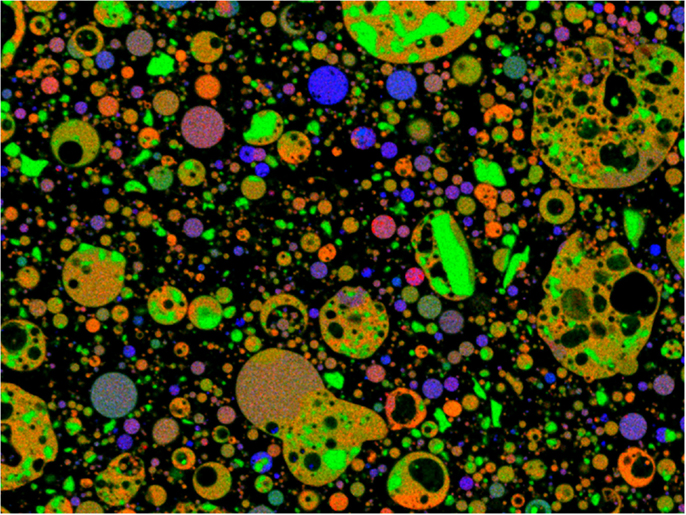
Figure 2. ML fly ash displayed as viewed in MultiSpec with red for aluminum; green for silicon; and blue for calcium; blended phases are represented by colors, such as orange, purple, and brown.
The multispectral image results for one field of view were completed for each fly ash. To fully characterize a particular fly ash, multiple fields of view in more than one sample of the fly ash would need to be completed in order to improve the accuracy of the glassy phase results. It would also allow for averaging of the amount of each phase across a greater cross-section of the fly ash in order to find a more accurate quantity of each phase. Therefore, the data collected in this study give an indication of the similarities in phases identified across fly ashes and offer a method for identifying and quantifying compositions but are not meant to precisely calculate the compositions or amounts of each phase in the fly ashes studied.
Results
The MSIA results are presented for each fly ash, with the average composition of each glassy phase given in Tables 3–6 and representative phase assignment images shown in Figures 3–6. In general, the fly ashes consisted of AS phases with <5% calcium, CAS phases with average calcium contents in the range of 10 to 20%, a mixed glass phase with a high calcium content between 29 and 36%, by mass, and other very minor phases. The mixed glass was so named due to its relatively large inclusion of elements other than calcium, aluminum, and silicon, particularly iron and magnesium. MSIA does not distinguish between glassy and crystalline phases, so the crystalline phases were included in the analysis. From the X-ray diffraction data, which were presented for each fly ash in Aughenbaugh et al. (2014), crystalline phases present in these ashes include quartz, lime, and iron-bearing phases, such as maghemite, magnetite, or hematite. The compositions of the crystalline phases are not listed in the tables, as they correspond to those for crystalline quartz (SiO2), lime (CaO), or iron oxides, such as hematite, magnetite, or maghemite (Fe2O3 or Fe3O4). Other than quartz, it is unlikely that most crystalline phases measured using X-ray diffraction could be identified visually, since they often form as finely disseminated grains within a glassy matrix as micro- or nano-crystalline materials (Hemmings and Berry, 1987). Each fly ash’s compositional analysis for a single field of view is presented next.
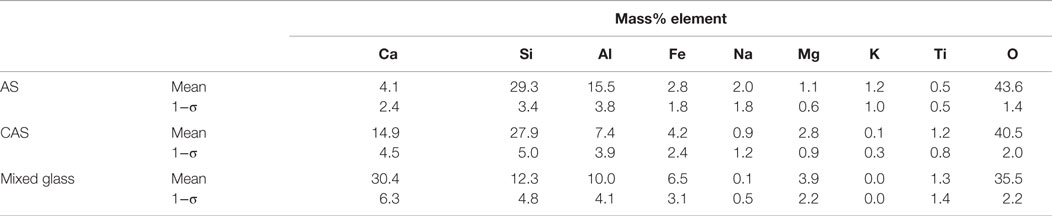
Table 3. Phase compositions and uncertainties expressed as a single SD (σ) for n ≥ 3 analyses of glasses in a single sample of CC fly ash.
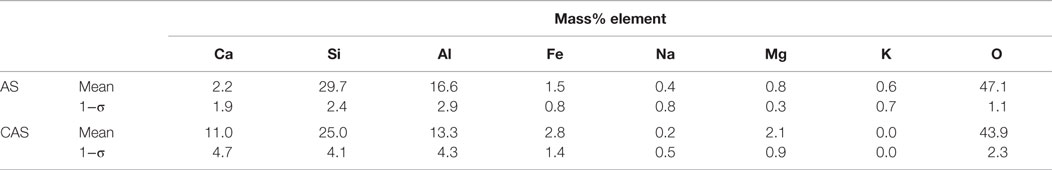
Table 4. Phase compositions and uncertainties, expressed as a single SD (1−σ), for n ≥ 3 glass measurements in a single sample of FO fly ash.
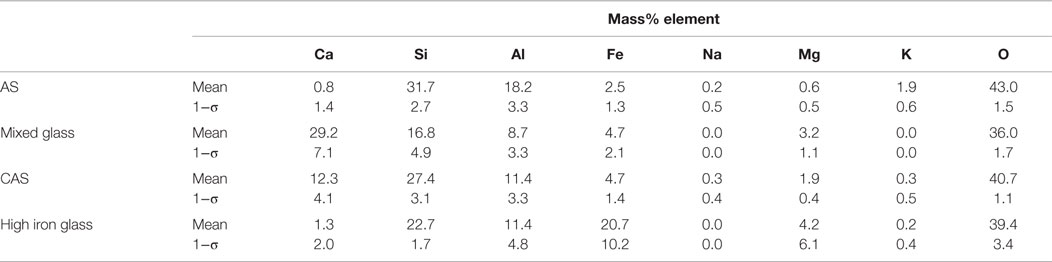
Table 5. Phase compositions and uncertainties, expressed as a single SD (1−σ) for n ≥ 3 analyses of glasses in a single sample of LEGS fly ash.
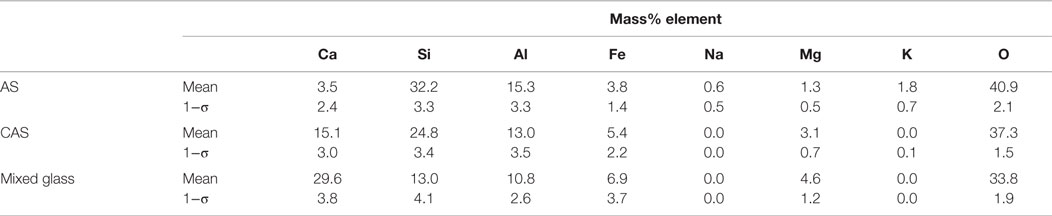
Table 6. Phase compositions and uncertainties, expressed as a single SD (1−σ) for n ≥ 3 analyses of glasses in a single sample of ML fly ash.
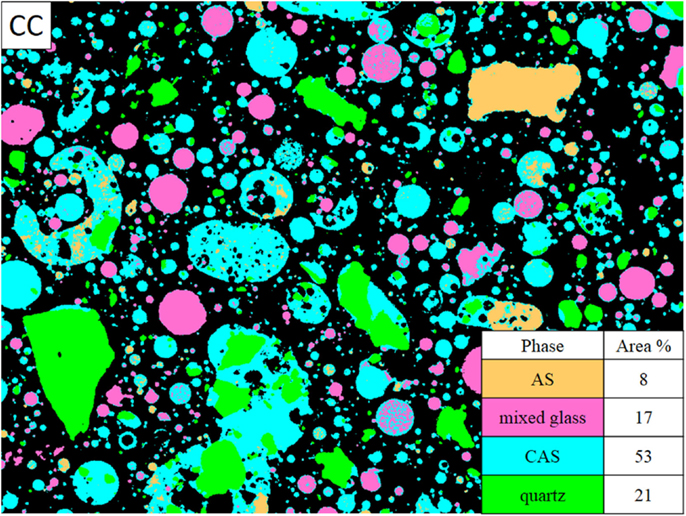
Figure 3. Phase assignment image of CC fly ash.
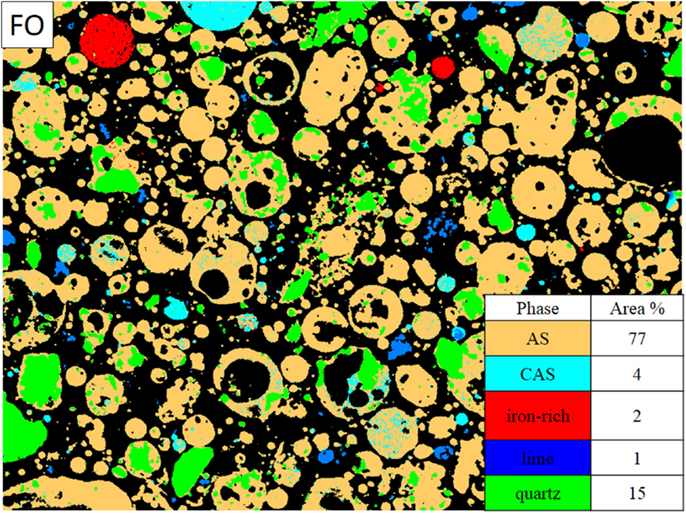
Figure 4. Phase assignment image of FO fly ash.
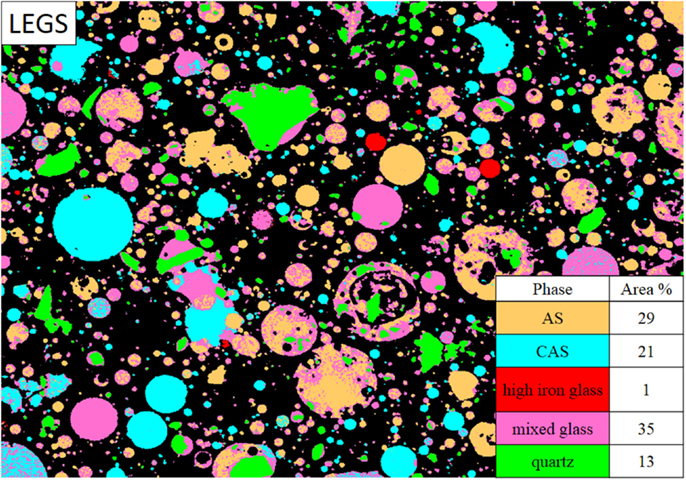
Figure 5. Phase assignment image of the LEGS fly ash.
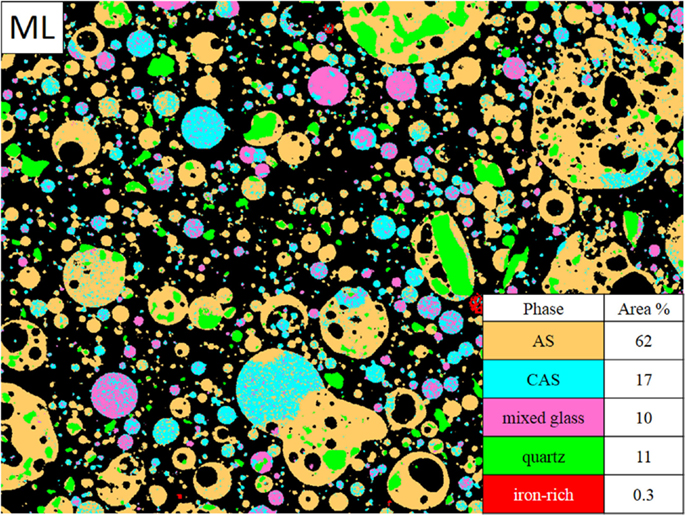
Figure 6. Phase assignment image for ML fly ash.
The CC fly ash maps were smoothed using a median filter of radius = 1. All of the maps for the CC fly ash required thresholding to remove noise. All seven element maps collected were used in the segmentation process and a representative phase assignment image is shown in Figure 3. The image shown in Figure 3, the CC fly ash consisted of mainly CAS glass at 53 area%, quartz at 21 area%, mixed glass at 17 area%, and AS at 8 area%. The compositions of these phases are presented in Table 3. The relatively large amount of quartz in this particular image was likely skewed slightly by the several large quartz particles in the field of view, which were identified as quartz based on composition and morphology. From the image, we can also see that the smallest sized particles in this sample of CC fly ash were typically CAS or mixed glass. The larger particles were typically either CAS or AS.
The FO fly ash imaging data were pre-processed with a median filter of radius = 1. Sodium, magnesium, and potassium were left out of the phase analysis since they were present in very small quantities (Table 1). The FO fly ash consisted of mostly the AS phase (Figure 4), which composed 77 area% of the sample. This was not unexpected, since this fly ash contained the smallest amount of CaO of any of the fly ashes at 5.6% CaO (Table 1). The sample shown in Figure 4 also contained ~15 area% quartz, 4 area% CAS, 2 area% of iron-bearing crystalline phase, and 1 area% lime (CaO). The AS phase clearly made up the majority of particles across different sizes and morphologies in the FO fly ash image shown.
The LEGS fly ash X-ray maps were pre-processed using a median filter of radius = 1. The low-end signal was thresholded using MATLAB for each map. All seven of the maps were used in the segmentation process. The average glass phase compositions are given in Table 5. The LEGS fly ash contained several phases, with the mixed glass phase present in greatest quantity at 35 area% in the image shown in Figure 5. The AS phase was also present in high amounts at 29 area%, followed by the CAS glass at 21 area%. Quartz was identified at 13 area%, while the iron-rich glass (identified as a glass due to its 20 mass% Fe compared to ~70 mass% Fe in the iron-bearing minerals) was just 1 area% of the sample. Observation of the smallest sized particles showed several phases, including CAS, AS, and the mixed glass phase. This was expected since these phases accounted for 75% of the fly ash area.
The ML fly ash element maps were pre-processed using a median filter of radius = 1. Some of the maps required thresholding, in which the low intensity values were replaced by 0 values using MATLAB. All seven maps collected were used for the segmentation process. The average phase compositions are given in Table 6. The ML fly ash in Figure 6 contained mainly AS phase, which accounted for 68 area% of the sample image. The CAS phase followed with 20 area%, while quartz was present at 11 area% of the image. A few particles (covering only 0.3 area%) were identified as iron-rich crystalline phase. The fly ash consisted of several large cenospheres of mixed composition. The smallest particles were either AS, CAS, or mixed glass. Quartz was commonly found embedded in AS particles in this fly ash.
Discussion
The data showed that the compositions of the phases identified across the fly ashes were quite similar. The CAS phases in each fly ash had a relatively small range of average composition in the three major elements: calcium, aluminum, and silicon. Similarly, the AS phase identified in each fly ash consisted of <7% calcium, and similar amounts of silicon and aluminum. However, the compositional SDs are somewhat large, indicating that the phases have relatively large compositional ranges for each particular fly ash. The broadness of defined phases in MSIA is one drawback of this method since it is a generalization of glass composition; however, identifying a large number of highly precise phases does not necessarily result in additional useful information for a researcher interested in potential reactivity. For example, understanding how much of the fly ash is made up of highly modified glasses (i.e., those with many elements that greatly modify the ideal silicate glass structure) may offer an indication of reactivity without further detailed classification.
Comparison of Bulk Fly Ash Oxide Composition and Glassy Phase Distribution
All fly ashes for use in concrete materials are classified following the ASTM C618 standard using bulk oxide compositions to group them as either Class F or Class C. However, these classifications or the bulk oxide composition are not an indicator of fly ash reactivity, which is why further characterization of the phases in fly ash is needed. The MSIA and bulk oxide analyses for the fly ashes are compared here. One clear observation from MSIA was that the FO fly ash, with the least amount of calcium (5.6% CaO by XRF) and as a result of the highest silicon and aluminum, had a very high percentage of AS phase (77 area%). However, the ML fly ash, which had 9.4 wt.% CaO, was also mostly composed of the AS phase (62 area%). This shows that despite having a somewhat large difference in bulk CaO, the amount of the AS phase can still be relatively close for two fly ashes. The ML fly ash had two other calcium-containing phases, which composed 27 area% of the fly ash, while the FO fly ash did not contain a calcium-containing mixed glass phase and had only 4 area% CAS. It has been noted in other work that low calcium content in fly ashes often corresponds to a small amount of crystalline phases (McCarthy, 1987), and this work showed that the same holds true for the glassy phases (i.e., there were a small number of glassy phases in the low-calcium FO fly ash).
The average compositions of the CAS phase across the fly ashes and the mixed glass phase across the fly ashes were remarkably similar despite the variety of fly ash compositions in the four fly ashes studied. The calcium-containing phases in these ashes included CAS and mixed glass. The lowest-calcium fly ash, FO, had the least amount of the CAS phase, as would be expected, and the mixed glass phase was not identified for FO. The CC fly ash, which had the highest CaO, was mostly made up of mixed glass and CAS with ~70 area% of these two calcium-containing phases. The LEGS fly ash had ~56 area% of calcium-containing phases, while the ML fly ash had ~27 area% of calcium-containing glasses. The amount of calcium-modified glasses identified in each fly ash tracked with the amount of bulk CaO content reported for each fly ash in Table 1; the highest CaO content and amount of calcium-modified glass was measured in the CC fly ash, followed by the LEGS fly ash, the ML fly ash, and the FO fly ash. These data suggest good reactivity in alkaline solutions for these fly ashes, since the two calcium-containing phases are highly modified glasses, differing greatly from the ideal silicate glass structure as described earlier and by Hemmings and Berry (1987). The mixed glass phase is modified to a greater extent than the CAS phase due to its iron content, which means that it has significant amounts of three network modifiers (calcium, aluminum, and iron) to introduce disorder to the ideal silicate glass structure as discussed by Hemmings and Berry (1987).
Iron-rich phase was identified at <2 area% for any of the fly ashes. Each fly ash contained between 3 and 7 mass% Fe2O3 as reported in Table 1, but the higher density of iron-containing phases means that a larger mass% corresponds to a smaller area% in the fly ash compared to other lighter elements. Therefore, the small amount of iron-rich phase was expected. The iron-containing phases were observed in a few dispersed particles for any given fly ash. The microscope operating conditions were not ideal for iron mapping because the accelerating voltage was optimized for the other low energy elements of interest. This meant that the iron was generally only observed in MSIA maps in the particles where it was most concentrated. These particles were assumed to contain the crystalline iron oxides since the phases such as hematite, maghemite, and magnetite contained around 70 mass% iron, which would exhibit high intensities in the iron maps. Indeed, X-ray microanalyses of the Fe-rich phase estimated around 70 mass% iron in the iron-rich phase in LEGS fly ash, and over 60 mass% iron on average for the iron-rich phases in FO and CC fly ashes. In the ML fly ash, the iron concentration in the Fe-rich phase was much lower than 60 mass%. This could have been for several reasons. First, the crystalline phase may not have been present in the specific point location where data were collected. Alternately, the iron may have been substituted into a crystalline or glassy phase in sufficient quantity to result in a strong intensity in the X-ray map; substitution into crystalline phases, such as mullite and network-former substitution, in glasses frequently occurs in fly ash with elemental iron (Hemmings and Berry, 1987; McCarthy, 1987).
The minor elements as defined by oxide analysis included magnesium, potassium, and sodium and were often dispersed throughout the ash particles and typically had low counts. Through visual observations of the X-ray maps, magnesium was often found within particles that were also high in calcium, and was nearly exclusively left out of AS phases. This was particularly true in the mixed glass phase identified in three of the four fly ashes. Additionally, while several other elements were observed in the iron-rich phases, magnesium rarely occurred within these grains. The potassium was almost exclusively identified in the AS phase for all of the fly ashes. Typically a small amount of potassium was identified (1–2%) in the AS phase of each fly ash. The bulk K2O amount in the fly ashes was <1.5% for all ashes, which explains this small amount in the glassy phase. None of the fly ashes contained significant amounts of sodium in any phase. The AS phase of the CC fly ash contained the most at 2% Na2O, but the remaining ashes contained <1% in either the AS phase or the CAS phase. The CC fly ash contained the greatest amount of bulk oxide Na2O (1.5%) as shown in Table 1, likely explaining why its AS phase contained the most sodium.
Intra-Particle Compositions
It has long been known that there is intra-particle heterogeneity in fly ash (Hemmings and Berry, 1987; Qian et al., 1987), but the use of XRF and MSIA to identify phase compositions for these intermixed glasses in fly ash particles was not developed until more recently (Williams et al., 2005; Chancey et al., 2010). Synthesis of the information given by the various elemental maps of an epoxy-mounted, polished fly ash specimen allows for better explanation of how the bulk composition is distributed into particles, which vary in size and morphology. Additionally, while interparticle heterogeneity could be explained by the collection of fly ash particles over time and made by burning coal that is also inherently heterogeneous, intra-particle heterogeneity is caused by localized differences in composition in the molten glasses. The results are discussed here by phase to relate composition to morphology and to note whether the phases that were found in particles with multiple phases had similarities in composition.
The two calcium-containing glasses were sometimes intermixed with other phases in the fly ashes. In the CC fly ash, the mixed glass and CAS phases were intermixed in some particles, while the CAS and AS phases were intermixed in others. Similarly, the mixed glass phase was identified intermixed with CAS in the ML fly ash. CAS and AS were intermixed or agglomerated in some of the largest particles of the ML fly ash, and quartz was embedded in the AS phase in other larger particles. The LEGS fly ash was composed of several phases (AS, CAS, and mixed glass), which were intermixed in some of the larger particles in the fly ash, and identified in individual spherical particles of the smaller size fraction. From these data, it appeared that multiple calcium-containing glasses can exist simultaneously in some particles depending on the cooling conditions. Immiscibility of glass phases in the melt has been described by Hemmings and Berry (1987), which could lead to such intraparticle inhomogeneity. When the calcium-containing glasses were identified in particles with the AS glass, the particles typically had the irregular shape of an agglomerated particle, indicating that they attached to each other during cooling.
The AS glass was typically not intermixed with other phases in the FO or ML fly ashes in which this glass formed the greatest fraction. In the FO fly ash, the AS glass had some embedded quartz particles. In the ML fly ash, larger agglomerates with CAS phase were identified.
Of the more minor phases, quartz was not intermixed with other phases, but was identified as inclusions in larger particles. The iron-rich phase, whether glassy or in crystalline form based on its oxide analysis, was never intermixed with other phases. Lime appeared in small, angular particles that did not intermix with other phases and was only identified in the FO fly ash.
Distribution of Glasses by Particle Size and Morphology
Since the smallest particles in fly ash are thought to be the most reactive due to their larger surface area compared to bigger size fractions, it is interesting to examine the glasses in each fly ash that comprised the smaller size fraction. The mixed glass and CAS phases were identified in the smallest particles in the CC fly ash, LEGS fly ash, and the ML fly ash. The FO fly ash consisted primarily of AS, so the AS phase was identified in the smallest particles for this fly ash, as well as in the LEGS and ML fly ashes. In general, the smallest particles in all of the fly ashes took the form of one of these glasses, and crystalline phases were not present in the small particles as resolved using the methods described here.
The large, vesicular particles identified in each fly ash were often of mixed composition. In the fly ashes with high AS content, FO, and ML, these large particles were typically of the AS composition. In the CC fly ash, CAS phase was identified in vesicular and irregularly shaped particles. The larger particles in the FO fly ash were not just large, vesicular particles but cenospheres, as well. Of the visible cenospheres in the ML fly ash image, all but one were AS in composition.
The iron-rich phase was identified in the FO, LEGS, and ML fly ashes. The Fe-rich phase, which varied in composition by fly ash, was identified in only a few distinct particles in each fly ash, which were medium-to-small in size, and they were always circular in morphology.
Quartz was also identified in all fly ashes, and in general was homogeneous in terms of its composition. In many instances, it was included in large and small particles of other compositions, while in other cases it was identified as discrete particles. In most cases, the smallest quartz particles were inclusions in larger particles, but larger quartz particles typically existed as individual particles. However, very small quartz particles were identified as individual particles in the ML fly ash as well. The quartz was angular in morphology in all cases, though in some the edges were more rounded. Hemmings and Berry (1987) noted that the quartz can be polished by the boiler flame even though it does not reach its melting point, which would lead to the rounded edges observed in some of the data.
Discussion of Methodology
The methods used in this study are a slightly modified version of the methods presented by Chancey et al. (2010). The use of k-means analysis to aid in training class pixel selection is a new step in the method, which helps take some subjectivity out of the process. However, it is important to note that the method of segmenting fly ash compositions using MSIA has several limitations. First, fly ash glass composition is a continuum, and drawing distinctions between phases can be difficult. This is one reason that somewhat generic phases, such as AS or CAS, must be used, without further breaking down differences in these phases, such as Ca/Si ratio or Si/Al ratio. However, the degree of glass modification from that of the ideal silicate glass does give some indication of potential fly ash reactivity, so identifying a large amount of highly modified or substituted glass (i.e., by incorporation of calcium, magnesium, iron, etc.) is likely to be helpful in identifying reactive ashes.
Another limitation of this method is the need for very precise X-ray maps and very accurate backscattered images. The X-ray maps must be collected under the same conditions, but this is not always ideal for the individual element as in the case of iron as described previously in this paper. Furthermore, the data must be saved such that they are not scaled or otherwise modified by the software or else comparisons cannot be made across fly ashes, which can be tricky to do depending on the software package used to collect the data. In addition, one aid in segmentation is differences in the relative brightness of backscattered images, which can only be compared if taken under the same conditions and adjusted for brightness/contrast in the same way. This requires a very skilled operator.
In the segmentation process, the edge pixels are often quite hard to segment properly due to partial volume averaging, in which the influence of surrounding material elements (i.e., the epoxy or a different glassy phase) affects the measured intensity of the elements in the particle’s edge pixels. This may alter the results of the segmentation process, particularly if the edge pixels are all assigned to a phase in the fly ash that is different than the bulk of the particle (i.e., a ring around the particle). Therefore, the results of the method when applied to fly ash offer a broad idea of the amount of each phase present in the fly ash.
Conclusion
The process of identifying glassy phases in fly ash using k-means clustering of point compositions combined with MSIA of X-ray maps has identified compositional similarities across four fly ashes with different bulk compositions. The data showed that the main phases in these four Class F fly ashes included:
• AS with very low calcium and some alkali modification.
• CAS with a moderate amount of calcium.
• mixed glass with a high amount of calcium and also with iron as a modifier.
These phases were found to be intermixed in some cases but not others. The AS phase primarily existed in particles individually, but when CAS phase was identified in the same particles as AS, the particles were typically agglomerated and larger in size. The CAS and mixed glass phases were identified as intermixed, which implies the presence of inhomogeneous or immiscible glasses in the melt that were preserved through the cooling process.
The ranges of each element in the phases identified were somewhat high and errors were typically relatively large. However, the degree of disorder in a particular glass has implications for its potential reactivity, and knowing how much of these modified glasses exist in a fly ash is useful to predicting fly ash reactivity. Further work classifying greater numbers of particles in individual fly ashes using this method is recommended for an even more accurate assessment of the compositions of fly ashes of interest for use in a particular application.
Author Contributions
KA: conducted the experimental work, performed the data analysis, and wrote the paper. PS: assisted with the experimental work, data analysis, and preparation of the manuscript. MJ: supervised the research and preparation of the manuscript.
Conflict of Interest Statement
The authors declare that the research was conducted in the absence of any commercial or financial relationships that could be construed as a potential conflict of interest.
Acknowledgments
The authors gratefully acknowledge financial support from the National Science Foundation (Grant # CMMI 0926627).
Footnotes
- ^Certain commercial equipment, instruments, or materials are identified in this report in order to specify the experimental procedure adequately. Such identification is not intended to imply recommendation or endorsement by the National Institute of Standards and Technology nor is it intended to imply that the materials or equipment identified are necessarily the best available for the purpose.
- ^Malvern Instruments Ltd., http://www.malvern.com/en/
- ^FEI, http://www.fei.com/products/sem/
- ^https://www.bruker.com
- ^NIST K412 was part of now out of stock SRM 470 glasses for microanalysis. K1716 was a trial reference glass and the rhyolite glass was obtained from the Smithsonian microbeam reference collection as USNM 72854.
- ^http://www.mathworks.com/products/matlab/
- ^ImageJ, http://rsbweb.nih.gov/ij/
- ^Multispec, https://engineering.purdue.edu/~biehl/MultiSpec/
References
ASTM C618-12. (2012). Specification for Coal Fly Ash and Raw or Calcined Natural Pozzolan for Use in Concrete. ASTM International. Available at: http://www.astm.org/Standards/C618.htm
Aughenbaugh, K. L. (2013). Fly Ash-Based Geopolymers: Identifying Reactive Glassy Phases in Potential Raw Materials [Dissertation]. Austin, Texas: The University of Texas at Austin.
Aughenbaugh, K. L., Williamson, T., and Juenger, M. C. G. (2014). Critical evaluation of strength prediction methods for alkali-activated fly ash. Mater. Struct. 48, 607–620. doi: 10.1617/s11527-014-0496-z
Bumrongjaroen, W., Muller, I., Livingston, R., and Davis, J. (2011). “A performance-based fly ash classification system using glassy particle chemical compositional data,” in World of Coal Ash (WOCA) Conference (Denver, CO). Available at: http://www.flyash.info
Chancey, R. T., Stutzman, P., Juenger, M. C. G., and Fowler, D. W. (2010). Comprehensive phase characterization of crystalline and amorphous phases of a class F fly ash. Cem. Concr. Res. 40, 146–156. doi:10.1016/j.cemconres.2009.08.029
Dhole, R., Thomas, M. D. A., Folliard, K. J., and Drimalas, T. (2013). Characterization of fly ashes for sulfate resistance. ACI Mater. J. 110, 159–168.
Durdziński, P. T., Dunant, C. F., Haha, M. B., and Scrivener, K. L. (2015). A new quantification method based on SEM-EDS to assess fly ash composition and study the reaction of its individual components in hydrating cement paste. Cem. Concr. Res. 73, 111–122. doi:10.1016/j.cemconres.2015.02.008
Duxson, P., and Provis, J. L. (2008). Designing precursors for geopolymer cements. J. Am. Ceram. Soc. 91, 3864–3869. doi:10.1111/j.1551-2916.2008.02787.x
Fernández-Jiménez, A., and Palomo, A. (2003). Characterisation of fly ashes. Potential reactivity as alkaline cements. Fuel 82, 2259–2265. doi:10.1016/S0016-2361(03)00194-7
Hartigan, J. A., and Wong, M. A. (1979). Algorithm AS 136: a k-means clustering algorithm. J. R. Stat. Soc. Ser. C Appl. Stat. 28, 100–108.
Hemmings, R. T., and Berry, E. E. (1987). On the glass in coal fly ashes: recent advances. MRS Online Proc. Libr. 113, 3. doi:10.1557/PROC-113-3
Jarosewich, E. (2002). Smithsonian microbeam standards. J. Res. Natl. Inst. Stand. Technol. 107, 681–686. doi:10.6028/jres.107.054
Joshi, R. C., Natt, G. S., Day, R. L., and Tilleman, D. D. (1984). Scanning electron microscopy and X-ray diffraction analysis of various size fractions of fly ash. MRS Online Proc. Libr. 43, 31. doi:10.1557/PROC-43-31
Kerrick, D. M., Bminhizer, L. B., and Villaume, J. F. (1973). The role of carbon film thickness in electron microprobe analysis. Am. Mineral. 58, 920–925.
Kilgour, C. I., and Diamond, S. (1987). The internal structure of a low-calcium fly ash. MRS Online Proc. Libr. 113, 65. doi:10.1557/PROC-113-65
Kruse, K. (2012). Characterization of High-Calcium Fly Ash for Evaluating the Sulfate Resistance of Concrete. Austin, Texas: Thesis, The University of Texas at Austin.
Lydon, J. W. (2005). The measurement of the modal mineralogy of rocks from SEM imagery: the use of MultiSpec and ImageJ freeware. Geol. Surv. Can. Open File 4941, 37. doi:10.4095/220706
McCarthy, G. J. (1987). X-ray powder diffraction for studying the mineralogy of fly ash. MRS Proc. 113, 75–86. doi:10.1557/PROC-113-75
McCarthy, G. J., Solem, J. K., Manz, O. E., and Hassett, D. J. (1989). Use of a database of chemical, mineralogical and physical properties of North American fly ash to study the nature of fly ashand its utilization as a mineral admixture in concrete. MRS Proc. 178, 3. doi:10.1557/PROC-178-3
Qian, J. C., and Glasser, F. P. (1987). Bulk composition of the glassy phase in some commercial PFA’s. MRS Online Proc. Libr. 113, 39. doi:10.1557/PROC-113-39
Qian, J. C., Lachowski, E. E., and Glasser, F. P. (1987). Microstructure and chemical variation in class F fly ash glass. MRS Proceedings 114, 307. doi:10.1557/PROC-113-45
Roy, D. M., Luke, K., and Diamond, S. (1984). Characterization of fly ash and its reactions in concrete. MRS Online Proc. Libr. 43, 3. doi:10.1557/PROC-43-3
Stevenson, R. J., and Huber, T. P. (1986). SEM study of chemical variations in western U.S. fly ash. MRS Online Proc. Libr. 86, 99. doi:10.1557/PROC-86-99
Ward, C. R., and French, D. (2006). Determination of glass content and estimation of glass composition in fly ash using quantitative X-ray diffractometry. Fuel 85, 2268–2277. doi:10.1016/j.fuel.2005.12.026
Williams, P. J., Biernacki, J. J., Rawn, C. J., Walker, L., and Bai, J. M. (2005). Microanalytical and computational analysis of class F fly ash. ACI Mater. J. 102, 330–337.
Williams, R. P., and van Riessen, A. (2010). Determination of the reactive component of fly ashes for geopolymer production using XRF and XRD. Fuel 89, 3683–3692. doi:10.1016/j.fuel.2010.07.031
Young, R. A. (1993). “Introduction to the Rietveld method,” in The Rietveld Method (Oxford University Press), 1–38. Available at: https://global.oup.com/academic/product/the-rietveld-method-9780198559122?q=young%20rietveld%20method&lang=en&cc=us#
Keywords: fly ash, glass composition, SEM–EDS, multispectral imaging, k-means analysis
Citation: Aughenbaugh KL, Stutzman P and Juenger MCG (2016) Identifying Glass Compositions in Fly Ash. Front. Mater. 3:1. doi: 10.3389/fmats.2016.00001
Received: 25 September 2015; Accepted: 11 January 2016;
Published: 28 January 2016
Edited by:
Wenhui Duan, Monash University, AustraliaReviewed by:
Yonghao Fang, Hohai University, ChinaMauricio Lopez, Pontificia Universidad Catolica de Chile, Chile
Copyright: © 2016 Aughenbaugh, Stutzman and Juenger. This is an open-access article distributed under the terms of the Creative Commons Attribution License (CC BY). The use, distribution or reproduction in other forums is permitted, provided the original author(s) or licensor are credited and that the original publication in this journal is cited, in accordance with accepted academic practice. No use, distribution or reproduction is permitted which does not comply with these terms.
*Correspondence: Maria C. G. Juenger, bWp1ZW5nZXJAbWFpbC51dGV4YXMuZWR1