 Mouritz N. Svenson1
 Lynn M. Thirion2
 Randall E. Youngman2
 John C. Mauro2
 Mathieu Bauchy3
 Sylwester J. Rzoska4Michal Bockowski4
 Morten M. Smedskjaer1*
- 1Department of Chemistry and Bioscience, Aalborg University, Aalborg, Denmark
- 2Science and Technology Division, Corning Incorporated, Corning, New York, NY, USA
- 3Department of Civil and Environmental Engineering, University of California Los Angeles, Los Angeles, CA, USA
- 4Institute of High Pressure Physics, Polish Academy of Sciences, Warsaw, Poland
Glasses can be chemically strengthened through the ion exchange process, wherein smaller ions in the glass (e.g., Na+) are replaced by larger ions from a salt bath (e.g., K+). This develops a compressive stress (CS) on the glass surface, which, in turn, improves the damage resistance of the glass. The magnitude and depth of the generated CS depend on the thermal and pressure histories of the glass prior to ion exchange. In this study, we investigate the ion exchange-related properties (mutual diffusivity, CS, and hardness) of a sodium aluminosilicate glass, which has been densified through annealing below the initial fictive temperature of the glass or through pressure quenching from the glass transition temperature at 1 GPa prior to ion exchange. We show that the rate of alkali interdiffusivity depends only on the density of the glass, rather than on the applied densification method. However, we also demonstrate that for a given density, the increase in CS and increase in hardness induced by ion exchange strongly depend on the densification method. Specifically, at constant density, the CS and hardness values achieved through thermal annealing are larger than those achieved through pressure quenching. These results are discussed in relation to the structural changes in the environment of the network modifiers and the overall network densification.
Introduction
Chemically strengthened glasses have been widely used in personal portable electronic devices, such as smartphones, tablets, and laptops. The damage resistance of these devices and the associated cover glass is of the utmost importance (Sehgal and Ito, 1999; Wondraczek et al., 2011). Chemical strengthening of glass is achieved through the ion exchange process, which involves the replacement of smaller ions (typically Na+) by larger ones (typically K+) in the glass surface layer (Karlsson et al., 2010; Varshneya, 2010a,b). This is usually achieved by submersion of the glass in a molten salt bath (typically KNO3) at elevated temperature. This substitution of larger K+ ions into sites originally occupied by smaller Na+ ions induces a compressive stress (CS) over tens of micrometers from the surface, limiting the propagation of existing flaws in the glass and the introduction of new flaws when subjected to tension.
Increasing the magnitude of the generated CS through ion exchange is vital for improvement of the practical glass strength and scratch resistance, while maintaining a thin (<1 mm) glass sheet. In addition to compositional variation, posttreatment of the glass may be used to increase the CS that results from ion exchange. For example, isostatic compression of the glass at temperatures around the glass transition temperature (Tg) can cause permanent densification and property modification (e.g., increase in glass hardness) even at moderate pressures (~1 GPa) in large sample specimens (square centimeter) (Uhlmann, 1973; Wondraczek et al., 2007; Wu et al., 2009; Striepe et al., 2013; Svenson et al., 2014a,b; Aakermann et al., 2015; Smedskjaer et al., 2015a,b; Østergaard et al., 2015). In a recent study, we investigated the effect of isostatic compression on the ion exchange characteristics (magnitude and depth of the CS layer and hardness) of a commercial aluminosilicate glass using sub-Tg compression temperatures (Svenson et al., 2014a). Subjecting the glass to isostatic compression before the ion exchange treatment was found to significantly increase the generated CS. However, compression at temperatures at or below 450°C prevented the subsequent ion exchange from effectively increasing the hardness of the glass. Based on 23Na magic-angle spinning (MAS) nuclear magnetic resonance (NMR) spectroscopy measurements, the latter finding was attributed to a structural modification of the sodium environment during compression, which in turn led to a modification of the structural setting of the potassium ions incorporated during subsequent ion exchange. By increasing the compression temperature to 600°C (Tg = 652°C), this structural modification was reversed, and a significant increase in hardness was observed (Svenson et al., 2014a).
To obtain an improved understanding of the chemical strengthening behavior of densified glass samples, we here compare glasses of identical composition densified through isostatic compression at elevated temperature or through ambient pressure thermal annealing. These permanently densified glasses are subsequently ion exchanged at three different temperatures in order to quantify differences in mutual Na+–K+ diffusivity, CS, and hardness. Only a few comparative studies exist regarding the equivalence or non-equivalence of glass properties induced by temperature or pressure treatments, respectively (Charles, 1962; Wondraczek and Behrens, 2007; Wondraczek et al., 2007; Smedskjaer et al., 2015c). Densification achieved through annealing at temperatures below the initial fictive temperature (Tf) of the glass has previously been found to yield the same qualitative changes in properties as isostatic compression (e.g., increase in hardness and decrease in crack resistance) (Li et al., 1995; Koike and Tomozawa, 2006; Smedskjaer et al., 2010a) but they are not quantitatively identical (Smedskjaer et al., 2015c). For example, the change in hardness, electrical conductivity, and Tf is more pronounced when a density increase is obtained through thermal annealing rather than through pressure quenching (Charles, 1962; Wondraczek et al., 2007). Structural studies on glasses with identical density have also reported differences in glass structures depending on the densification method (Guerette et al., 2015; Smedskjaer et al., 2015c). However, the BO3-to-BO4 coordination change is equivalent irrespective of the densification method (Wondraczek et al., 2007). The comparison performed in this study regarding the effects of thermal and pressure histories on the ion exchange characteristics can shed light on the structural features governing the Na+–K+ interdiffusivity, CS, and glass hardness, which is fundamental for the development of new damage-resistant glasses.
Materials and Methods
The object of our study is a commercial sodium–magnesium aluminosilicate glass with 15.0 mol% Na2O and Tg = 652°C (Dejneka et al., 2013), identical to the one used in our recent study (Svenson et al., 2014a). The glass was prepared by the fusion draw method, giving rise to a high initial value of Tf (~700°C), chemical homogeneity, and excellent surface quality, making it well suited for hardness and CS analyses (Allan et al., 2012, 2013). Samples (20 mm × 20 mm × 1 mm) were then subjected to either sub-Tg annealing or isostatic compression. Annealing was done at Ta = 578°C (0.92Tg) for durations ta of 2, 24, and 168 h by placing the samples in the furnace at the target temperature for the predetermined annealing time and then rapidly quenching the glass. Isostatic compression was performed at 0.5 and 1 GPa at the ambient pressure Tg value (652°C), using a nitrogen gas pressure chamber (Smedskjaer et al., 2014). The setup consists of a multizone cylindrical furnace, which is placed inside a gas pressure reactor with nitrogen as the compression medium. During compression, the samples were heated at a constant rate of 600 K/h to their ambient pressure Tg value, and then the pressure was increased to 0.5 or 1 GPa. The samples were kept under these conditions for 30 min before the temperature was decreased to room temperature at a rate of 60 K/min, followed by decompression at a rate of 30 MPa/min. We note that the glass transition temperature is a function of pressure (Drozd-Rzoska et al., 2007), but the change is expected to be small within this pressure regime (Bagdassarov et al., 2004). X-ray diffraction analyses showed no sign of crystallization.
Density (ρ) and Vickers hardness (HV) of the samples were determined on as-prepared and densified glasses. Density was measured using Archimedes’ principle with water as the immersion medium, and each measurement of sample weight was repeated at least 10 times. Hardness was measured using a Vickers microindenter (Duramin 5, Struers A/S) with a load of 0.5 N and an indentation holding time of 5 s. A minimum of 30 indents were measured on each sample in air at room temperature. Error bars for density and hardness in the figures all represent the SD across the measured values of hardness and density.
Following isostatic compression and thermal annealing, the samples were subjected to ion exchange treatment by submerging them in a molten KNO3 salt bath at 370, 410, or 450°C for 10 h. Afterward, the Vickers hardness and density were measured again. In addition, the generated surface CS and the depth of the compressive layer [depth of layer (DOL)] were determined using an FSM-6000 instrument (Orihara Industrial Co., Ltd.). The K+-for-Na+ ion exchange gives the glass surface a higher refractive index than the interior, i.e., the surface can act as a waveguide. This is utilized in the FSM instrument to record optical fringe patterns, giving an upper set of fringes corresponding to the TM mode of light propagation and a lower set of fringes corresponding to the TE mode. The offset in position between the first TM and TE fringes gives the birefringence, which when multiplied by the stress-optic coefficient yields the surface CS of the glass. DOL is calculated from the number of fringes and the width of the fringe pattern based on the TM mode data. A total of eight FSM measurements were performed on each sample.
27Al and 23Na MAS and multiple quantum MAS (MQMAS) NMR experiments were conducted on samples compressed at 1 GPa or annealed at 0.92Tg for 168 h and subsequently ion exchanged in molten KNO3 at 410°C for 10 h. A 16.4-T magnetic field was used in conjunction with a commercial spectrometer (Agilent) and 1.6 mm MAS NMR probe. The resonance frequencies at this external magnetic field were 182.34 and 185.12 MHz for 27Al and 23Na, respectively. Samples were crushed and loaded into 1.6 mm zirconia rotors, which gave a small 27Al background signal that was identified by running duplicate MAS NMR experiments on the empty rotors. This extraneous signal was removed using spectral subtraction. Sample spinning was controlled to 25 ± 0.01 kHz. MAS data for 27Al (23Na) were collected using short radio-frequency pulses of 0.6 μs (π/12 tip angle), 1-s (0.5) recycle delays, and signal averaging of 2000 scans. Data were processed without apodization and shift referenced to aqueous Al(NO3)3 and aqueous NaCl, both at 0.0 ppm. 27Al MAS NMR spectra were fit with DMFit and the Czjzek model to account for distributions in quadrupolar coupling parameters (Massiot et al., 2002).
MQMAS NMR spectra were collected for 27Al (23Na) using the three pulse, zero quantum filtering method (Amoureux et al., 1996). The hard 3π/2 and π/2 pulse widths were calibrated to 1.9 (2.4) and 0.7 (1) μs, and the soft reading pulse of the z-filter was optimized to 10 μs. In the case of 27Al, 240 scans were collected for each of 128 t1 points, using a recycle delay of 1 s. For 23Na, 120 scans with a 1-s recycle delay were used to collect 40 t1 points. Spectra were processed using commercial software (VNMRJ, Agilent), and modest line broadening (100 Hz) was used only in processing the 23Na 3QMAS NMR data. For each resonance in the 3QMAS NMR spectra, the centers of gravity in the MAS and isotropic dimensions, and , are used to calculate the isotropic chemical shift (δCS) and the quadrupolar coupling product (Pq) according to
and
where f(S) = 10.244 for spin 5/2 nuclei (27Al) or 5.122 for spin 3/2 nuclei (23Na), and ν0 is the resonance frequency of the quadrupolar nucleus in megahertz (Amoureux et al., 1996). Pq from Eq. 2 can be related to the quadrupolar coupling constant (Cq) as , where ηq is the quadrupolar coupling asymmetry parameter. Pq and Cq are often used interchangeably, with small errors introduced when neglecting the contribution of ηq.
Results
Density
The densities of the samples before ion exchange are plotted as a function of annealing time and applied isostatic pressure in Figure 1. As the glass is annealed below its initial fictive temperature, the fictive temperature decreases with increasing annealing time, and the density, therefore, increases with increasing annealing duration as the glass network relaxes and compacts. Inelastic densification also occurs when the glass is subjected to isostatic compression at the glass transition temperature at 0.5 and 1.0 GPa, followed by quenching under pressure and relaxation at ambient temperature. The extent of pressure densification depends on the compression temperature. By including the density values from our recent study on sub-Tg compression of the same glass composition (Svenson et al., 2014a), the temperature dependence of pressure densification can be illustrated. This is done in Figure 2, which shows the density of the glass compressed at 1 GPa at different compression temperatures after being ion exchanged at 410°C for 10 h. The degree of densification increases significantly as the temperature is increased from 400 to 600°C, whereas the further increase in temperature to 652°C (Tg) does not significantly change the density. This is in agreement with recent results for a sodium borosilicate glass, showing a similar density dependence on compression temperature (Østergaard et al., 2015).
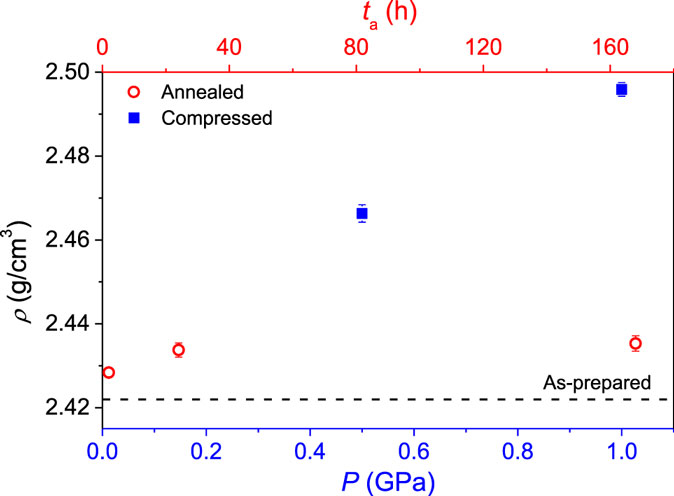
Figure 1. Dependence of density (ρ) on the thermal and pressure histories prior to ion exchange. Annealing duration (ta) and maximum pressure (P) are varied to obtain a wide range of density values. The density value prior to annealing or pressure quenching is indicated by the dashed line.
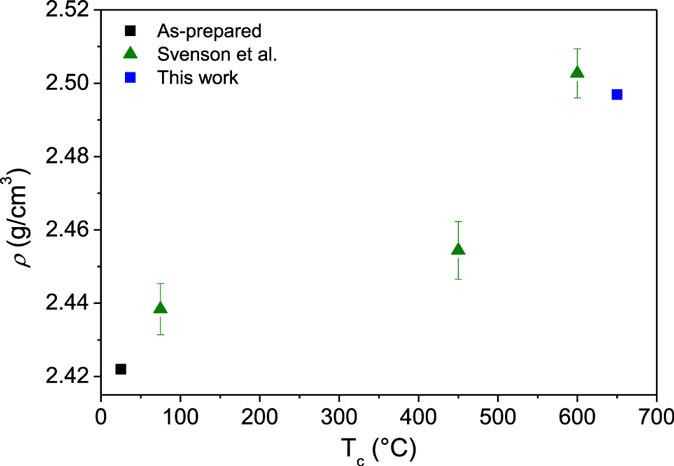
Figure 2. Density (ρ) as a function of the compression temperature (Tc) at 1 GPa. The as-prepared sample has not been compressed or ion exchanged, whereas the other samples have all been ion exchanged at 410°C for 10 h after the isostatic compression. Data are included from Svenson et al. (2014a).
The densities of both thermally annealed and compressed samples after ion exchange treatment are shown in Figure 3. Ion exchange is found to slightly increase the density of both the thermally annealed (Figure 3A) and compressed glasses (Figure 3B). The change in density as a result of ion exchange is plotted as a function of the depth of the CS layer (DOL) across the different samples in Figure 4. We find an approximate linear dependence for each ion exchange temperature. This indicates that density has increased due to the K-for-Na ion exchange with an additional temperature effect, i.e., the higher temperature ion exchange leads to a larger increase in density. Annealing of glasses below their initial fictive temperature causes densification, and the rate of the underlying relaxation process increases with increasing temperature. Increasing the ion exchange temperature could, therefore, increase the extent of densification when the ion exchange time is constant (Varshneya, 2016). However, sub-Tg annealing of compressed glasses at ambient pressure causes relaxation of the densified structure, i.e., density relaxation (Smedskjaer et al., 2015a). Therefore, structural relaxation during ion exchange should have caused a decrease in the density of the compressed samples. As such, structural relaxation during ion exchange cannot explain the observed density changes.
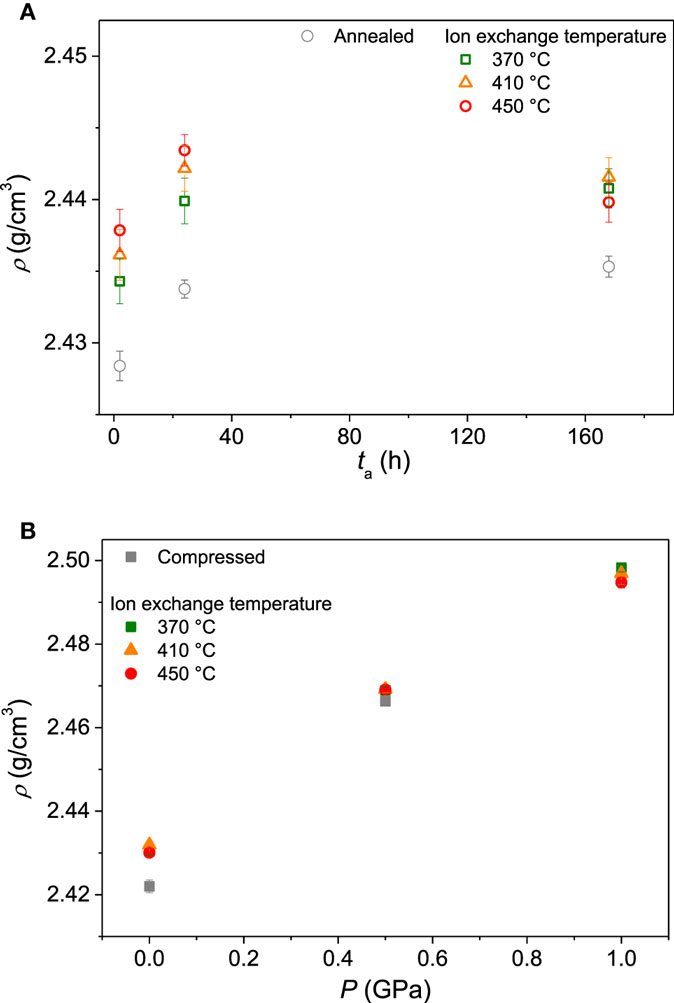
Figure 3. Density (ρ) of the glasses before ion exchange (gray symbols) and after ion exchange (colored symbols) treatment at three different temperatures (370, 410, and 450°C). (A) Samples annealed at different durations (ta) at 0.92Tg. (B) Samples isostatically compressed at different applied pressures (P) at Tg.
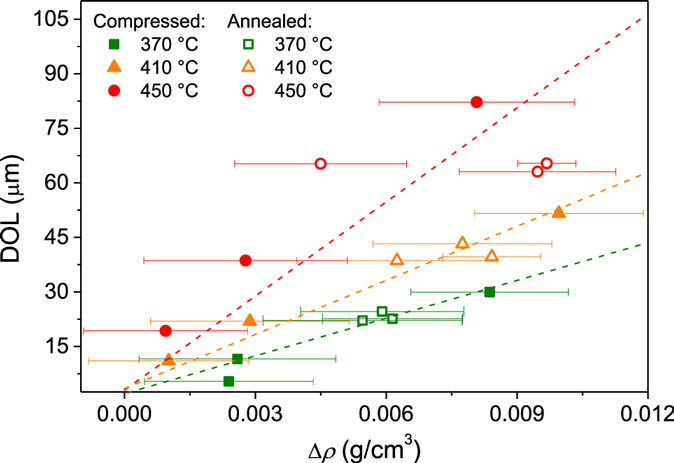
Figure 4. Depth of the ion exchanged layer (DOL) as function of the change in density as a result of ion exchange (Δρ) for both the as-prepared, thermally annealed, and compressed samples ion exchanged at three different temperatures (370, 410, and 450°C). An approximate linear dependence is found for each ion exchange temperature. Dashed lines are guides for the eye.
Interdiffusivity and Compressive Stress
The depth of layer is determined by the penetration depth of the potassium ions, which are incorporated into the glass surface due to the K+-for-Na+ interdiffusion process. Thus, the concentration of sodium ions in the glass surface decreases proportionally to the increase in the concentration of potassium ions. Figure 5 shows DOL plotted against density for both annealed and compressed samples at the three different salt bath temperatures (370, 410, and 450°C). The mutual diffusivity is found to increase with increasing ion exchange temperature and decrease with increasing density, independent of whether the density increase has been obtained through annealing or compression.
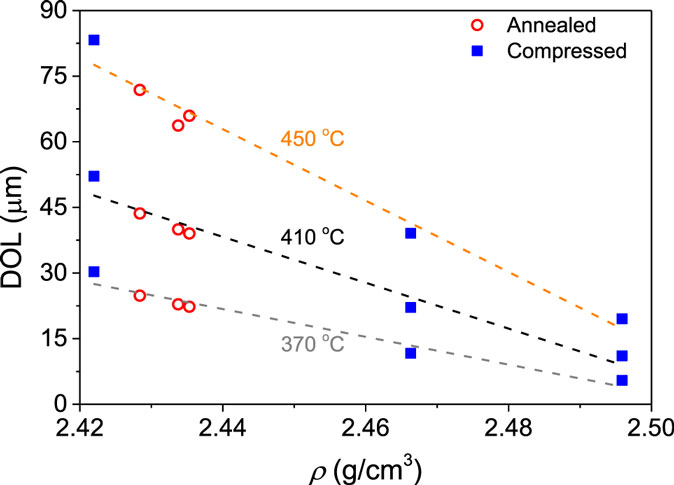
Figure 5. Dependence of depth of layer (DOL) on density (ρ) for the samples ion exchanged at three different temperatures (370, 410, and 450°C). The range of density values has been obtained by annealing and isostatic compression.
Based on the potassium diffusion depth (DOL) and the interdiffusion time (10 h), we estimate an average or effective interdiffusion coefficient as a constant for a given diffusion profile (Varshneya and Milberg, 1974). The temperature (T) dependence of is then studied by fitting the data to an Arrhenius equation,
where Ea, and R are the activation energy, pre-exponential factor, and gas constant, respectively. For each glass, we find good agreement with the Arrhenius equation for the studied temperature range (not shown). The derived activation energy is plotted against density in Figure 6. Ea for the compressed glasses increase approximately linearly with density and Ea for the annealed glasses appear to follow to the same trend. This indicates that diffusion is governed by the overall network compaction, rather than the specific structural changes facilitating densification during annealing or isostatic compression.
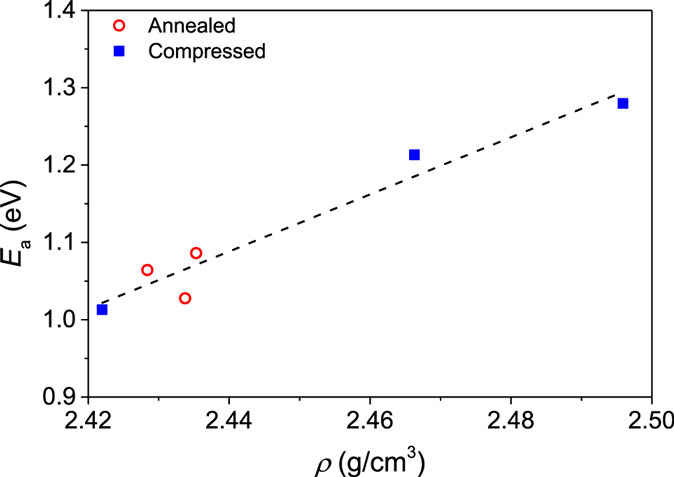
Figure 6. Activation energy (Ea) of the Na+–K+ interdiffusivity as a function of density (ρ). The range of density values has been obtained by annealing and isostatic compression. The dashed line is a guide for the eye.
Figure 7 shows the dependence of surface CS on density. CS increases with density for each ion exchange temperature, i.e., there is a larger strain per unit of ions exchanged after densification. Figure 7 also shows that the annealed glasses exhibit a much larger increase in CS upon an equivalent volume densification than the compressed glasses. Figure 8 shows CS as a function of DOL. An approximately linear relation is found between CS and DOL for the non-densified (as-prepared) samples. The compressed glasses appear to follow the same linear relation between CS and DOL, with exception of the two samples ion exchanged at 450°C, i.e., ion exchange at high temperature has affected the relation between CS and DOL. Since there is no density relaxation of the compressed glasses during the ion exchange process (Figure 3B), the source of the change in the CS vs. DOL relation is unclear. For the annealed glasses, the relation between CS and DOL is not the same as that of the non-densified samples (Figure 8). That is, the annealed glasses exhibit a higher value of CS for a given DOL.
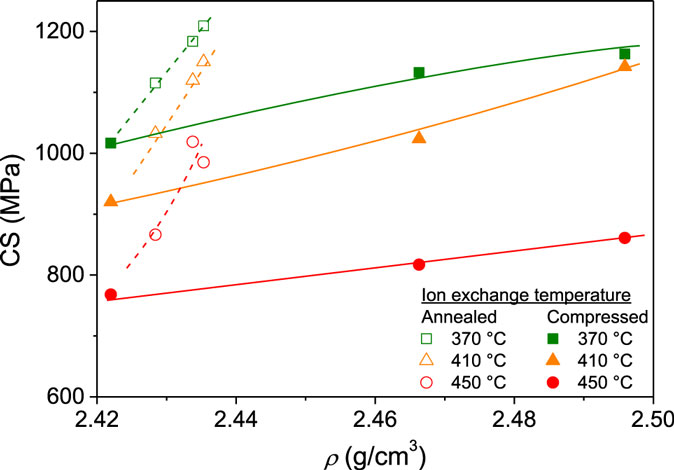
Figure 7. Compressive stress (CS) as a function of density (ρ) for glasses ion exchanged at three different temperatures (370, 410, and 450°C) after annealing (open symbols) or compression (filled symbols). Lines are guides for the eye.
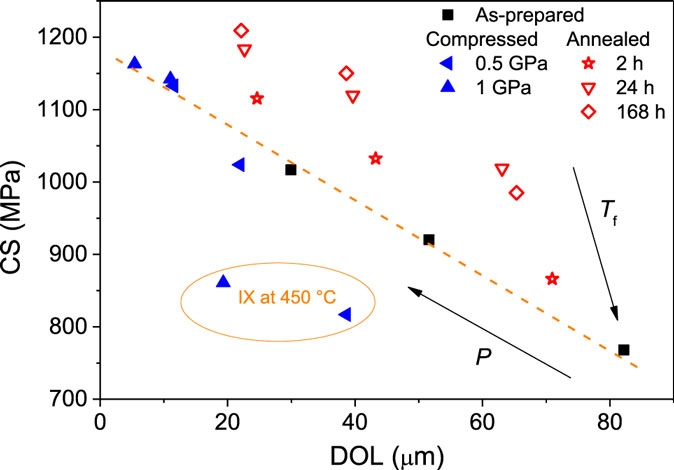
Figure 8. Compressive stress (CS) as a function of depth of layer (DOL) for glasses compressed or annealed and then ion exchanged at three different temperatures (370, 410, and 450°C). Arrows denote directions of increasing applied isostatic pressure (P) and increasing fictive temperature (Tf) due to compression and sub-Tg annealing, respectively. The dashed orange line is a guide for the eye, showing the relation between CS and DOL for the as-prepared glasses. The orange circle encloses compressed samples ion exchanged at 450°C, as these data do not align with the trend of the other compressed samples.
Hardness
The dependence of Vickers hardness (HV) on density for the annealed and compressed samples before and after ion exchange is shown in Figure 9. Prior to ion exchange, HV increases as a result of both annealing and compression due to a decrease in the contribution of densification to the indentation deformation (Aakermann et al., 2015). There is a larger increase in hardness with increasing applied pressure and thus degree of densification. However, an increase in density has a larger impact on hardness for the annealed samples relative to the compressed samples (Figure 9), which is in agreement with recent findings for an alkaline earth aluminosilicate glass (Smedskjaer et al., 2015c).
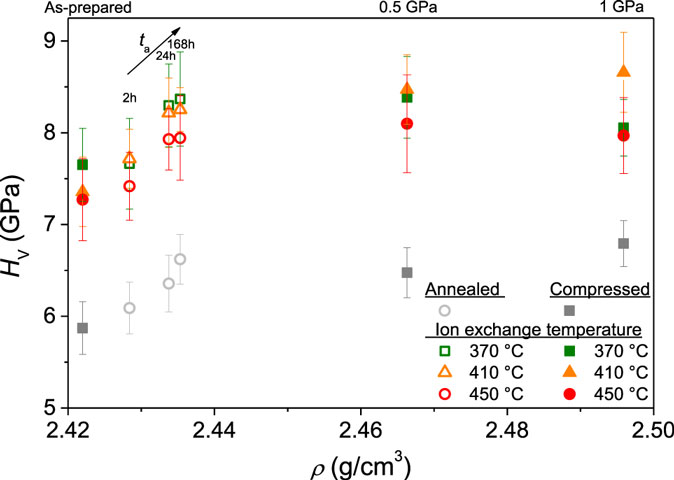
Figure 9. Vickers hardness (HV) as a function of density (ρ) for the annealed (open symbols) and compressed samples (filled symbols) before ion exchange (gray symbols) and after ion exchange (colored symbols). Inserted labels denote the treatment prior to ion exchange, i.e., applied isostatic pressure or annealing duration.
After the samples have been ion exchanged, the hardness increases further for all samples (Figure 9). The relative difference in HV of annealed and compressed samples remains the same after the ion exchange treatment. However, as an exception, the hardness of the samples ion exchanged at 370 and 450°C following compression at 1 GPa is lower than that of the samples ion exchanged at the same temperatures but compressed at 0.5 GPa. For the sample compressed at 1 GPa and ion exchanged at 370°C, this may be explained by the fact that this sample has the smallest DOL of all samples (5.5 μm). The Vickers indenter penetrates ~1.5 μm into the surface of this sample (calculated as 1/7 of the impression diagonal length due to indenter geometry). K+ concentration and CS rapidly decrease with increasing depth, and for low K+ surface concentrations, the hardness may not be effectively increased by the K+-for-Na+ substitution. The sample compressed at 1 GPa and ion exchanged at 450°C has a relatively large DOL (see Figure 5) but exhibits a lower CS value compared to the two other samples compressed at 1 GPa (see Figure 7). Figure 10 shows the increase in Vickers hardness due to the ion exchange treatment (ΔHV) as a function of the generated CS. A positive correlation between ΔHV and CS is observed, supporting the suggestion that the sample compressed at 1 GPa and ion exchanged at 450°C exhibits a lower hardness value due to its lower value of CS.
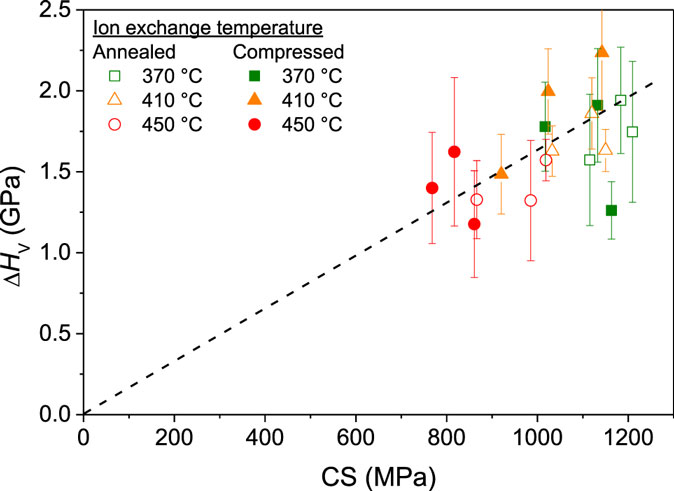
Figure 10. The increase in Vickers hardness due to the ion exchange treatment (ΔHV) as a function of the generated compressive stress (CS) for glasses annealed (open symbols) or compressed (filled symbols) and then ion exchanged at three different temperatures (370, 410, and 450°C). The dashed line is a guide for the eye.
NMR Spectroscopy
As seen in Figures 7 and 9, the changes in CS and hardness do not only depend on density but also on the densification method. This indicates that different structural changes occur during densification following compression and annealing. To investigate these structural changes, we have performed both 27Al and 23Na MAS NMR measurements on two glasses ion exchanged at 410°C: one compressed at 1 GPa and 650°C and one annealed for 168 h at 0.92Tg at ambient pressure. 27Al MAS NMR spectra for these two samples and the ion exchanged as-prepared glass are shown in Figure 11. A single, asymmetric resonance assigned to Al in fourfold coordination (AlIV) is observed. The corresponding 23Na MAS NMR spectra are shown in Figure 12, where a slight downfield shift for the glass compressed at 1 GPa can be observed.
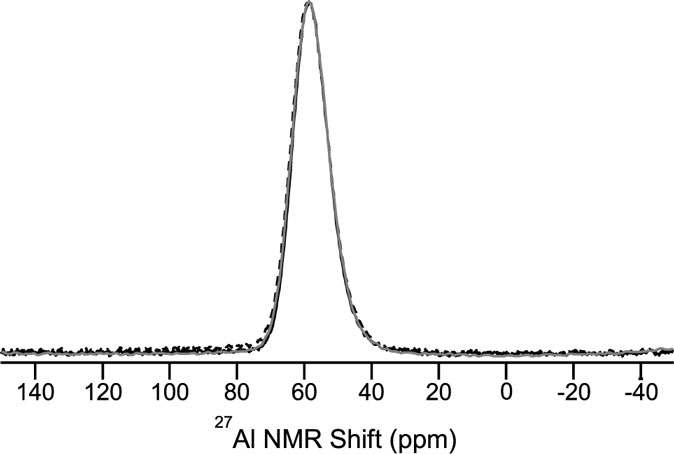
Figure 11. 27Al MAS NMR spectra of three different aluminosilicate glasses ion exchanged at 410°C: as-prepared (gray line), compressed at 1 GPa and 650°C (dashed black line), and annealed for 168 h at 0.92Tg (solid black line).
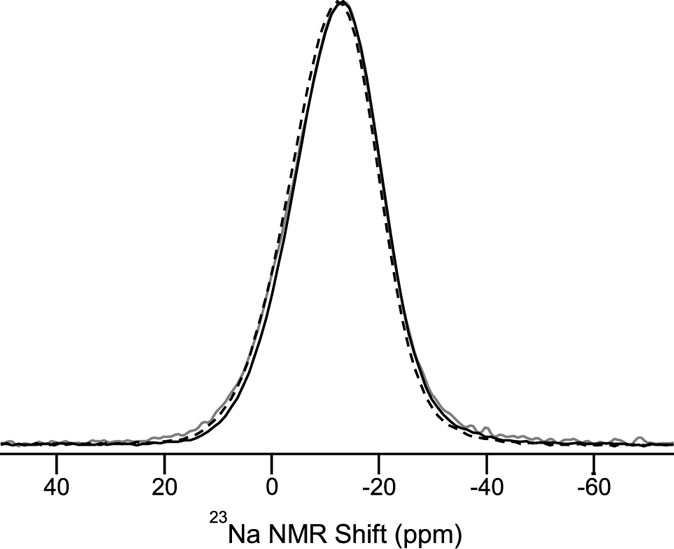
Figure 12. 23Na MAS NMR spectra of three different aluminosilicate glasses ion exchanged at 410°C: as-prepared (gray line), compressed at 1 GPa and 650°C (dashed black line), and annealed for 168 h at 0.92Tg (solid black line).
The 23Na MAS NMR shift from Figure 12 is plotted against density in Figure 13 together with the same data for the glasses in our recent study (Svenson et al., 2014a). We find that pressure densification causes an increase in the 23Na MAS NMR shift, whereas annealing causes a decrease in the 23Na MAS NMR shift. This implies that different structural changes occur as a result of isostatic compression and sub-Tg annealing, respectively. Due to the nature of the 23Na nucleus (spin 3/2), the MAS NMR shift is a combination of the isotropic chemical shift and quadrupolar coupling-induced shift. Therefore, one or both of these may account for the changes in Figure 12.
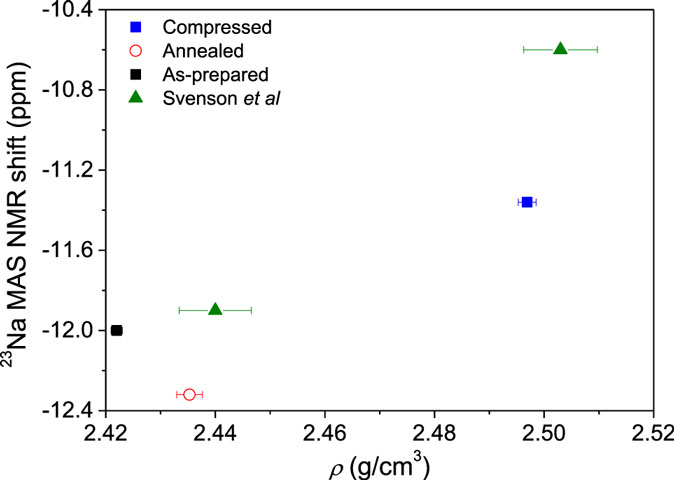
Figure 13. 23Na MAS NMR shift of as-prepared, compressed, and annealed glasses as a function of density (ρ). Data are included from Svenson et al. (2014a) for glasses compressed at room temperature and 600°C.
To better understand the small changes in the 23Na MAS NMR peak position, high-resolution data are collected using the 3QMAS NMR technique. Contour plots for the two compressed and annealed glasses are given in Figure 14, where a single resonance is observed for both samples. The position of this peak in the MAS and isotropic shift dimensions is used to extract the average isotropic chemical shift (δCS) and quadrupolar coupling product (Pq). These parameters are listed in Table 1. The change in 23Na MAS NMR peak position (Figure 13) is consistent with the measured difference in isotropic chemical shift, which has previously been correlated to an overall shortening of the Na–O distances in compressed glasses (Wu et al., 2009; Svenson et al., 2014a,b), while the small differences in PQ are not a significant factor in these MAS NMR peak position changes with glass treatment.
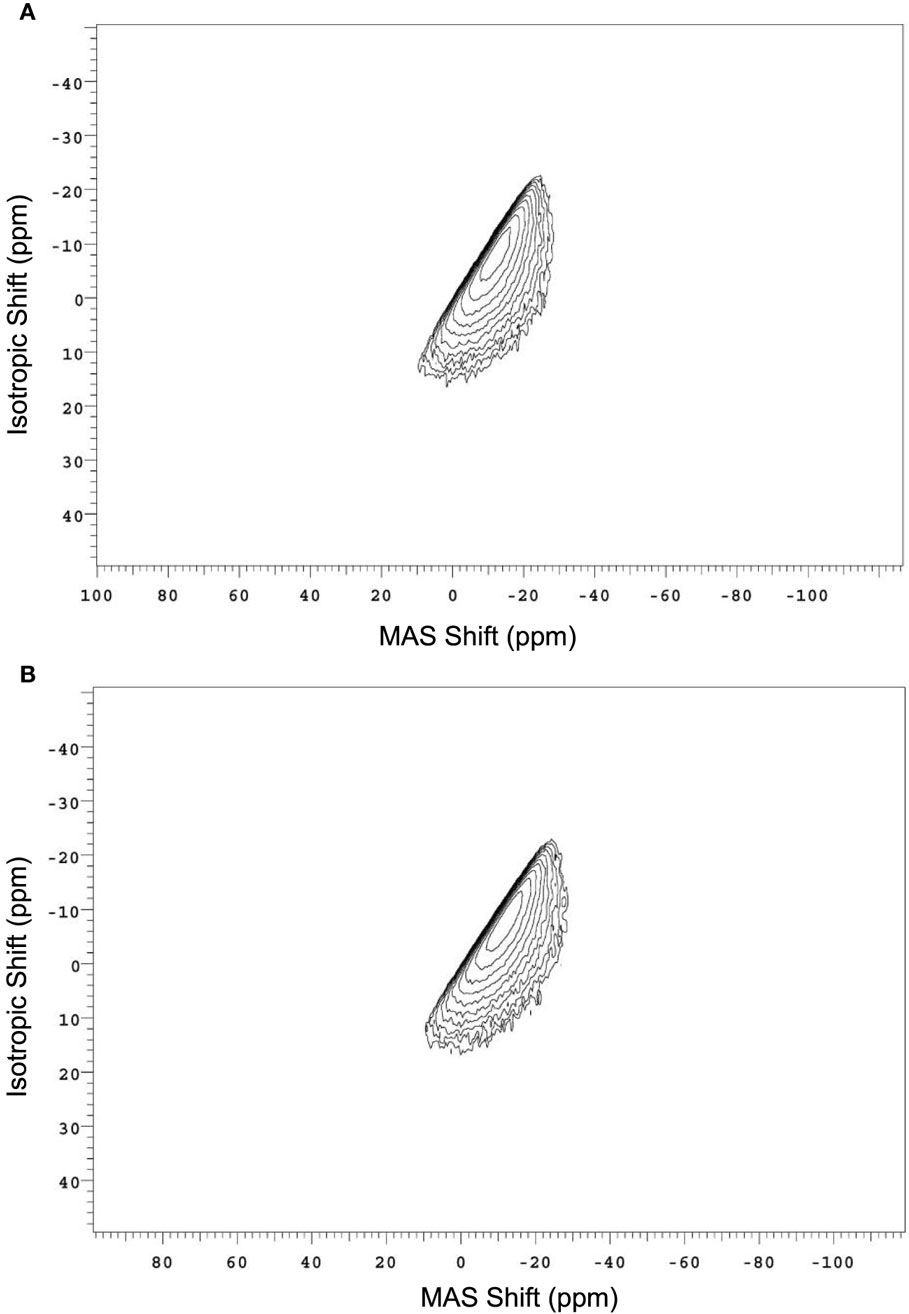
Figure 14. 23Na 3QMAS NMR spectra of the aluminosilicate glass (A) annealed for 168 h at 0.92Tg and (B) compressed at 1 GPa and 650°C after ion exchange at 410°C. Peak positions in the two dimensions are used to calculate δCS and Pq, as described in the text.
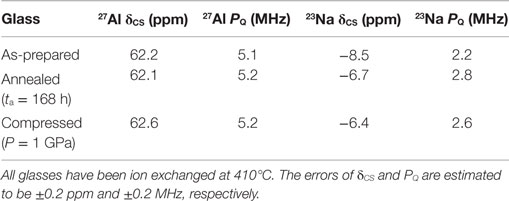
Table 1. Isotropic chemical shift (δCS) and quadrupolar coupling constant (PQ) derived from the 3QMAS NMR data of the as-prepared glass and the glasses compressed at 650°C at 1 GPa or annealed at 0.92Tg for 168 h.
The 27Al MAS NMR spectra show that all 27Al is found in tetrahedral configuration. Only minor changes in NMR parameters are observed after compression (see Table 1 and Figure 11) and no coordination changes are observed. This indicates a stable 27Al environment insensitive to pressure compaction within the error range of the data, which is expected in aluminosilicate glasses with low content of non-bridging oxygen (Bista et al., 2015).
Discussion
Our results show that in samples of identical composition and density, the degree of Na+–K+ interdiffusion (Figure 5) and its activation energy (Figure 6) are identical independent of whether the samples have been annealed or compressed. In 1954, Anderson and Stuart (1954) proposed a model to calculate the activation energy for ionic conduction in silica glass, building on a concept of two independent contributions. That is, the electrostatic binding energy between anions and the diffusing cation and the strain energy, which is the energy required to elastically dilate a pathway from one ion site to another. Various expressions for the strain energy have later been proposed, providing better approximations for experimental activation energies, but the basic concept that the diffusion activation energy is governed by electrostatic and strain energies has remained unchallenged (Shelby, 2005). In related studies on Na+–K+ interdiffusivity, the activation energy has been found to scale with the atomic packing fraction (free volume) in borosilicate glasses with varying SiO2/B2O3 ratio (Smedskjaer et al., 2015d) and in boroaluminosilicate glasses with varying SiO2/Al2O3 ratio and different types of alkaline earth cations (Potuzak and Smedskjaer, 2014). A positive correlation between volume expansion and increasing ionic conductivity has also been found in salt-doped borate, phosphate, and molybdate glasses (Swenson and Börjesson, 1996). Therefore, we infer that the free volume and thus the strain energy contribution govern the composition dependence of alkali interdiffusion. This is in agreement with our finding that density alone appears to govern the activation energy, independent of densification method (Figure 6).
Unlike diffusivity, the generated CS exhibits a strong dependence on the densification method for samples of constant density. That is, the CS of the annealed glasses increases more effectively as a function of density (Figure 7) and exhibits a larger value for a given DOL (Figure 8) compared to the compressed samples, analogous to the difference in hardness between annealed and compressed samples (Figure 9). Therefore, for industrial optimization of chemically strengthened glasses, where high values of both CS and DOL are desired, thermal annealing appears more attractive than isostatic compression (Allan et al., 2012, 2013) The ion exchange-induced CS is governed by three parameters: (a) concentration of exchanged alkali ions, (b) elastic moduli (Young’s modulus and Poisson’s ratio), and (c) network dilation coefficient (Tandia et al., 2012a,b; Vargheese et al., 2014). The compressed and annealed samples exhibit identical DOL vs. density relationships for a given ion exchange temperature (Figure 5). Therefore, parameter (a) can be ruled out. Young’s modulus and Poisson’s ratio are expected to increase upon densification but not to an extent to solely account for the increase in CS with density (Aakermann et al., 2015). Therefore, a combination of a difference in network dilation coefficient and elastic moduli is expected to cause the difference in CS among the compressed and annealed samples. Recent molecular dynamics simulations on the structural changes in isostatically compressed and thermally annealed aluminosilicate glasses reported that annealing causes a higher degree of short-range ordering (sharper bond angle distribution) when comparing glasses of identical density (Smedskjaer et al., 2015c). On the other hand, the compressed glasses exhibit larger changes in the medium-range order. According to the composition-dependent hardness model of Smedskjaer et al. (2010b,c), hardness scales with the total number of intact two-body bond-stretching and three-body bond-bending constraints, which in turn depend on the coordination numbers, i.e., short-range order. Thus, hardness increases more with density in annealed relative to compressed samples, since annealing increases the rigidity of the bond angles, while compression mostly affects the medium-range order. This could possibly also explain the dependence of CS on density, since CS should depend on the local environment of the incorporated K+ ions.
To understand the relation between the changes in hardness and CS, we note that an approximate linear dependence of the hardness increase due to ion exchange (ΔHV) on CS is found across the different densification methods and ion exchange temperatures (Figure 10). This is the case even though the generated CS not only depends on density but also on the densification method (Figure 7). These results imply that a cause–effect relation exists between CS and ΔHV, irrespective of the underlying structural state of the glass, in agreement with earlier findings (Jang, 2009) In our recent study, the variation of 23Na δCS (as obtained from 3QMAS NMR data) suggested a modification of the Na+ environment upon low-temperature compression (<600°C) (Svenson et al., 2014a). Such modification of the Na environment was assumed to result in a modification of the K+ environment after K+-for-Na+ ion exchange, which in turn affected ΔHV. 23Na δCS has previously been reported to show a negative correlation with the Na–O bond length as a function of composition (Xue and Stebbins, 1993; Maekawa et al., 1997) and temperature (George and Stebbins, 1995; Maekawa et al., 1997) in silicate, aluminosilicate, borate, and germanate crystals. Furthermore, a decrease in 23Na δCS has previously been found as a result of compression in glasses (Wu et al., 2009; Svenson et al., 2014a,b). To elaborate on our previous findings, 23Na δCS values of selected samples from the current and earlier study (Svenson et al., 2014a) are plotted as a function of hardness in Figure 15. A positive correlation between 23Na δCS and Vickers hardness of the samples prior to ion exchange is observed. This correlation also holds for the hardness increase after ion exchange, supporting the hypothesis that modification of the Na+ environment influences the effect ion exchange treatment has on hardness. However, δCS cannot alone explain all of the observed results, since the non-densified (as-prepared) sample does not exhibit the same trend line as the densified samples (Figure 15), indicating that other parameters also play a role in controlling the hardness value of this sample.
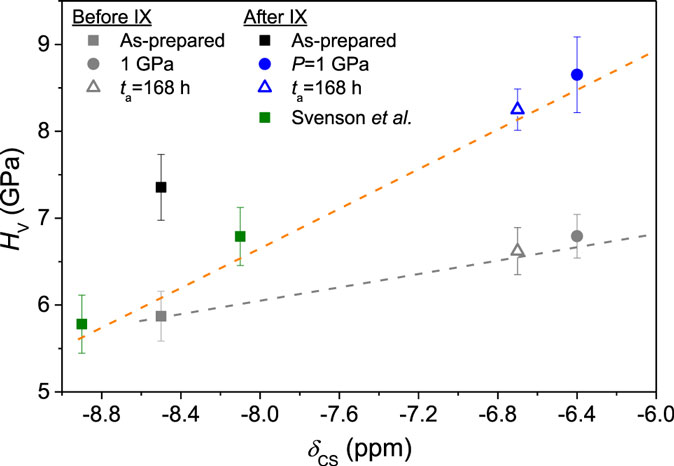
Figure 15. Vickers hardness (HV) as a function of 23Na chemical shift (δCS) for samples before (gray symbols) and after ion exchange at 410°C (colored symbols). HV of samples from Svenson et al. (2014a) have been re-measured at 0.5 N to be comparable with the values in the current study. δCS is only measured on ion-exchanged samples, and δCS of the samples before ion exchange is, therefore, represented by the δCS value of their ion-exchanged analogs. The assumption that ion exchange does not significantly affect the local Na+ environment (i.e., the value of δCS) is based on MD simulations of ion exchanged glasses (Tandia et al., 2012b). The dashed lines are guides for the eye, illustrating a positive correlation between HV and δCS for the densified samples.
Figure 15 also shows that the positive relation between 23Na δCS and hardness applies for samples densified through both compression and sub-Tg annealing. This is interesting, since the annealed samples exhibit a different hardness vs. density relation compared to the compressed samples (Figure 9). Therefore, it appears that the chemical shift does not only depend on density, but rather on specific structural changes. Multiple structural changes may occur during densification through annealing and compression, and δCS may represent a group of these closely related to hardness.
Conclusion
We have studied the chemical strengthening of sodium aluminosilicate glasses of identical chemical composition and density brought about by variation of thermal or pressure history. Variation of both thermal and pressure histories causes an increase in the generated CS and hardness and decrease in alkali interdiffusivity with increasing density. Prior to ion exchange, annealing has a larger impact than compression on glass hardness for fixed density, indicating a difference in the structural mechanisms facilitating densification during annealing and compression at elevated temperature. Ion exchange causes a further increase in hardness of all investigated samples. CS increased more efficiently as a function of density when the densification has been obtained through annealing, and a positive relation between CS and the hardness increase induced by ion exchange has been found across the different samples.
Structurally, we have found that densification increases 23Na δCS, which is interpreted as a shortening of the Na–O bond distance. A positive correlation between 23Na δCS and hardness before and after ion exchange is found for all the densified samples, indicating that 23Na δCS represents structural changes governing the effect of ion exchange on hardness. However, the non-densified, ion exchanged glass does not follow this trend, indicating that other structural features are also responsible for governing the hardness of this sample. On the other hand, the Na–K interdiffusivity is governed simply by the overall network compaction rather than the specific structural changes facilitating densification during annealing or compression. Therefore, our study suggests that thermal and pressure treatments (besides chemical composition) can be used as valuable degrees of freedom to tailor chemically strengthened glasses.
Author Contributions
The manuscript was written through contributions of all authors. All authors have given approval to the final version of the manuscript.
Conflict of Interest Statement
The authors declare that the research was conducted in the absence of any commercial or financial relationships that could be construed as a potential conflict of interest.
Funding
MNS and MMS acknowledge financial support from the Danish Council for Independent Research under Sapere Aude: DFF-Starting Grant (1335-00051A). SR acknowledges financial support from the National Science Center of Poland under grant UMO-2011/03/B/ST3/02352.
References
Aakermann, K. G., Januchta, K., Pedersen, J. A. L., Svenson, M. N., Rzoska, S. J., Bockowski, M., et al. (2015). Indentation deformation mechanism of isostatically compressed mixed alkali aluminosilicate glasses. J. Non Cryst. Solids 426, 175–783. doi:10.1016/j.jnoncrysol.2015.06.028
Allan, D. C., Bowden, B. F., Guo, X., Mauro, J. C., and Potuzak, M. (2012). Method for Fusion Drawing Ion-Exchangeable Glass. US Patent Application 20130255314 A1.
Allan, D. C., Ellison, A. J., and Mauro, J. C. (2013). Heat Treatment for Strengthening Glasses. US Patent Application 20130260154 A1.
Amoureux, J., Fernandez, C., and Steuernagel, S. (1996). Z filtering in MQMAS NMR. J. Magn. Reson. Ser. A 123, 116–118. doi:10.1006/jmra.1996.0221
Anderson, O., and Stuart, D. (1954). Calculation of activation energy of ionic conductivity in silica glasses by classical methods. J. Am. Ceram. Soc. 37, 573–580. doi:10.1111/j.1151-2916.1954.tb13991.x
Bagdassarov, N., Maumus, J., Poe, B., Slutskiy, A., and Bulatov, V. (2004). Pressure dependence of Tg in silicate glasses from electrical impedance measurements. Phys. Chem. Glasses 45, 197–214.
Bista, S., Stebbins, J. F., Hankins, W. B., and Sisson, T. W. (2015). Aluminosilicate melts and glasses at 1 to 3 GPa: temperature and pressure effects on recovered structural and density changes. Am. Mineral. 100, 2298–2307. doi:10.2138/am-2015-5258
Charles, R. J. (1962). Structural state and diffusion in a silicate glass. J. Am. Ceram. Soc. 45, 105–113. doi:10.1111/j.1151-2916.1962.tb11094.x
Dejneka, M., Ellison, A., and Mauro, J. C. (2013). Ion Exchangable Glass with High Compressive Stress. US Patent 20,130,004,758.
Drozd-Rzoska, A., Paluch, S. R. M., Imre, A., and Roland, C. (2007). On the glass transition temperature under extreme pressures. J. Chem. Phys. 126, 164504. doi:10.1063/1.2721044
George, A. M., and Stebbins, J. F. (1995). High-temperature 23Na MAS NMR data for albite: comparison to chemical shift models. Am. Mineral. 80, 878–884. doi:10.2138/am-1995-9-1002
Guerette, M., Ackerson, M. R., Thomas, J., Yuan, F., Watson, B. E., Walker, D., et al. (2015). Structure and properties of silica glass densified in cold compression and hot compression. Sci. Rep. 5, 15343. doi:10.1038/srep15343
Jang, J. (2009). Estimation of residual stress by instrumented indentation: a review. J. Ceram. Process. Res. 10, 391–400.
Karlsson, S., Jonson, B., and Stålhandske, C. (2010). The technology of chemical glass strengthening – a review. Glass. Technol.: Eur. J. Glass Sci. Technol. A 51, 41–54. doi:10.1111/j.2041-1294.2010.00010.x
Koike, A., and Tomozawa, M. (2006). Fictive temperature dependence of subcritical crack growth rate of normal glass and anomalous glasses. J. Non Cryst. Solids 352, 5522–5530. doi:10.1016/j.jnoncrysol.2006.09.023
Li, H., Agarwal, A., and Tomozawa, M. (1995). Effect of fictive temperature on dynamic fatigue behavior of silica and soda-lime glasses. J. Am. Ceram. Soc. 78, 1393–1396. doi:10.1111/j.1151-2916.1995.tb08502.x
Maekawa, H., Nakao, T., Shimokawa, S., and Yokokawa, T. (1997). Coordination of sodium ion in NaAlO2-SiO2 melts: a high temperature 23Na NMR study. Phys. Chem. Miner. 24, 53–65. doi:10.1007/s002690050017
Massiot, D., Fayon, F., Capron, M., King, I., Le Calvé, S., Alonso, B., et al. (2002). Modelling one- and two-dimensional solid-state NMR spectra. Magn. Reson. Chem. 40, 70–76. doi:10.1002/mrc.984
Østergaard, M., Youngman, R. E., Svenson, M. N., Rzoska, S. J., Bockowski, M., Jensen, L. R., et al. (2015). Temperature-dependent densification of sodium borosilicate glass. RSC Adv. 5, 78845–78851. doi:10.1039/C5RA16219J
Potuzak, M., and Smedskjaer, M. M. (2014). Alkali diffusivity in alkaline earth sodium boroaluminosilicate glasses. Solid State Ionics. 263, 95–98. doi:10.1016/j.ssi.2014.05.015
Sehgal, J., and Ito, S. (1999). Brittleness of glass. J. Non Cryst. Solids 253, 126–132. doi:10.1016/S0022-3093(99)00348-8
Shelby, J. (2005). Introduction to Glass Science and Technology. Cambridge: Royal Society of Chemistry.
Smedskjaer, M., Rzoska, S., Bockowski, M., and Mauro, J. C. (2014). Mixed alkaline earth effect in the compressibility of aluminosilicate glasses. J. Chem. Phys. 140, 054511. doi:10.1063/1.4863998
Smedskjaer, M. M., Jensen, M., and Yue, Y. (2010a). Effect of thermal history and chemical composition on hardness of silicate glasses. J. Non Cryst. Solids 356, 893–897. doi:10.1016/j.jnoncrysol.2009.12.030
Smedskjaer, M. M., Mauro, J. C., and Yue, Y. Z. (2010b). Prediction of glass hardness using temperature-dependent constraint theory. Phys. Rev. Lett. 105, 115503. doi:10.1103/PhysRevLett.105.115503
Smedskjaer, M. M., Mauro, J. C., Sen, S., Deubener, J., and Yue, Y. Z. (2010c). Impact of network topology on cationic diffusion and hardness of borate glass surfaces. J. Chem. Phys. 133, 154509. doi:10.1063/1.3497036
Smedskjaer, M. M., Youngman, R. E., Striepe, S., Potuzak, M., Bauer, U., Deubener, J., et al. (2015a). Irreversibility of pressure induced boron speciation change in glass. Sci. Rep. 4, 3770. doi:10.1038/srep03770
Smedskjaer, M. M., Rzoska, S. J., Bockowski, M., and Mauro, J. C. (2015b). Mixed alkaline earth effect in the compressibility of aluminosilicate glasses. J. Chem. Phys. 140, 054511. doi:10.1063/1.4863998
Smedskjaer, M. M., Bauchy, M., Mauro, J. C., Rzoska, S. J., and Bockowski, M. (2015c). Unique effects of thermal and pressure histories on glass hardness: structural and topological origin. J. Chem. Phys. 143, 164505. doi:10.1063/1.4934540
Smedskjaer, M. M., Mauro, J. C., and Yue, Y. (2015d). Cation diffusivity and the mixed network former effect in borosilicate glasses. J. Phys. Chem. B 119, 7106–7115. doi:10.1021/acs.jpcb.5b03520
Striepe, S., Smedskjaer, M. M., Deubener, J., Bauer, U., Behrens, H., Potuzak, M., et al. (2013). Elastic and micromechanical properties of isostatically compressed soda-lime-borate glasses. J. Non Cryst. Solids 364, 44–52. doi:10.1016/j.jnoncrysol.2013.01.009
Svenson, M., Thirion, L., Youngman, R., Mauro, J. C., Rzoska, S., Bockowski, M., et al. (2014a). Pressure-induced changes in interdiffusivity and compressive stress in chemically strengthened glass. ACS Appl. Mater. Interfaces. 6, 10436–10444. doi:10.1021/am5019868
Svenson, M., Bechgaard, T., Fuglsang, S., Pedersen, R., Tjell, A., Østergaard, M., et al. (2014b). Composition-structure-property relations of compressed borosilicate glasses. Phys. Rev. Appl. 2, 024006. doi:10.1103/PhysRevApplied.2.024006
Swenson, J., and Börjesson, L. (1996). Correlation between free volume and ionic conductivity in fast ion conducting glasses. Phys. Rev. Lett. 77, 3569.
Tandia, A., Vargheese, K. D., Mauro, J. C., and Varshneya, A. K. (2012a). Atomistic understanding of the network dilation anomaly in ion-exchanged glass. J. Non Cryst. Solids 358, 316–320. doi:10.1016/j.jnoncrysol.2011.09.034
Tandia, A., Vargheese, D., and Mauro, J. C. (2012b). Elasticity of ion stuffing in chemically strengthened glass. J. Non Cryst. Solids 358, 1569–1574. doi:10.1016/j.jnoncrysol.2012.04.021
Uhlmann, D. R. (1973). Densification of alkali silicate glasses at high pressure. J. Non Cryst. Solids 13, 89–99. doi:10.1016/0022-3093(73)90038-0
Vargheese, K. D., Tandia, A., and Mauro, J. C. (2014). Molecular dynamics simulations of ion-exchanged glass. J. Non Cryst. Solids 403, 107–112. doi:10.1016/j.jnoncrysol.2014.07.025
Varshneya, A. K. (2010a). The physics of chemical strengthening of glass: room for a new view. J. Non Cryst. Solids 356, 2289–2294. doi:10.1016/j.jnoncrysol.2010.05.010
Varshneya, A. K. (2010b). Chemical strengthening of glass: lessons learned and yet to be learned. Int. J. Appl. Glass Sci. 1, 131–142. doi:10.1111/j.2041-1294.2010.00010.x
Varshneya, A. K. (2016). Mechanical model to simulate buildup and relaxation of stress during glass chemical strengthening. J. Non Cryst. Solids 433, 28–30. doi:10.1016/j.jnoncrysol.2015.11.006
Varshneya, A. K., and Milberg, M. E. (1974). Ion exchange in sodium borosilicate glass. J. Am. Ceram. Soc. 57, 165–169. doi:10.1111/j.1151-2916.1974.tb10846.x
Wondraczek, L., and Behrens, H. (2007). Molar volume, excess enthalpy, and Prigogine-Defay ratio of some silicate glasses with different (P, T) histories. J. Chem. Phys. 127, 154503. doi:10.1063/1.2794745
Wondraczek, L., Mauro, J. C., Eckert, J., Kühn, U., Horbach, J., Deubener, J., et al. (2011). Towards ultrastrong glasses. Adv. Mater. 23, 4578–4586. doi:10.1002/adma.201102795
Wondraczek, L., Sen, S., Behrens, H., and Youngman, R. E. (2007). Structure-energy map of alkali borosilicate glasses: effects of pressure and temperature. Phys. Rev. B 76, 014202. doi:10.1103/PhysRevB.76.014202
Wu, J. S., Deubener, J., Stebbins, J. F., Grygarova, L., Behrens, H., Wondraczek, L., et al. (2009). Structural response of a highly viscous aluminoborosilicate melt to isotropic and anisotropic compressions. J. Chem. Phys. 131, 104504. doi:10.1063/1.3223282
Keywords: glass, chemical strengthening, ion exchange, annealing, compression
Citation: Svenson MN, Thirion LM, Youngman RE, Mauro JC, Bauchy M, Rzoska SJ, Bockowski M and Smedskjaer MM (2016) Effects of Thermal and Pressure Histories on the Chemical Strengthening of Sodium Aluminosilicate Glass. Front. Mater. 3:14. doi: 10.3389/fmats.2016.00014
Received: 25 January 2016; Accepted: 02 March 2016;
Published: 16 March 2016
Edited by:
Lothar Wondraczek, University of Jena, GermanyReviewed by:
Yann Gueguen, University of Rennes 1, FranceGarth W. Scannell, Rensselaer Polytechnic Institute, USA
Copyright: © 2016 Svenson, Thirion, Youngman, Mauro, Bauchy, Rzoska, Bockowski and Smedskjaer. This is an open-access article distributed under the terms of the Creative Commons Attribution License (CC BY). The use, distribution or reproduction in other forums is permitted, provided the original author(s) or licensor are credited and that the original publication in this journal is cited, in accordance with accepted academic practice. No use, distribution or reproduction is permitted which does not comply with these terms.
*Correspondence: Morten M. Smedskjaer, bW9zQGJpby5hYXUuZGs=