 Susanne Krüger
 Joachim Deubener*
- Institute of Non-Metallic Materials, Clausthal University of Technology, Clausthal-Zellerfeld, Germany
The present study explores the temperature and time dependence of heterogeneous (HET) crystal nucleation in a lithium disilicate glass using the stochastic approach. In particular, a single lithium disilicate sample was repeatedly (284 runs) undercooled to 1173 K in a PtRh-crucible and the crystallization onset time during an isothermal hold was detected in each run. The statistical distribution of the times elapsed before crystallization is described by a first-order reaction with a HET crystal nucleation rate of (9.19 ± 0.04) × 10−4 s−1 while individually shaped crystallization exotherms of each run were recorded, which indicate growth of a single or only few crystals during crystallization of the entire volume. The data were used together with results of previous stochastic experiments and those of double-stage heat treatments to calculate the crystallization time of a fraction of 10−4 percent for all temperatures between glass transition and melting. The derived TTT diagram shows a double-nose of crystallization in the volume at large undercoolings (0.53–0.61 Tm) and crystallization at the surface at small undercoolings (0.62–0.92 Tm) initiated by homogeneous and HET crystal nucleation, respectively. The critical cooling rate at the HET nose is approximately 73 K s−1.
Introduction
In the last 40 years, crystal nucleation in silicate glasses has been addressed by counting crystal number densities in the volume of glass specimens subjected to double-stage heat treatments (Fokin et al., 2006). The techniques bears the advantage of direct determination of the crystal nucleation rate from calculating the first time derivative of the number density curve but has the drawback that it is limited to a narrow temperature range near the glass transformation temperature (Tg ≤ T ≤ 1.2 Tg) where driving forces are high and crystal nucleation is occurring frequently in the volume. Another drawback is the dissolution of nuclei that are critical at the first stage but subcritical at the second stage. In the case of surface crystallization, the accessible temperature range becomes broader but the time period of crystal nucleation is mostly limited due to fast saturation of active sites. A short nucleation period merely allows for an indirect determination of the crystal nucleation rate. Thus, birth- (from crystal size distribution) (Müller et al., 2000) and impingement-times (Krüger and Deubener, 2015a) of crystals at the surface have been analyzed to deduce their rates of nucleation. In each of these methods (and also for analyzing high-temperature X-ray diffraction data (Dressler et al., 2011, 2014), an ensemble of crystals is analyzed in order to derive nucleation parameters. The criterion applies for large undercoolings but becomes ineffective at higher temperatures where crystal grow rates are generally high and the entire liquid volume is shortly consumed by the first nucleated crystal. In consequence, nucleation data for temperatures T > 1.2 Tg are lacking for both binary/ternary model glasses and for technical multi-component glass systems. The occurrence of a substantial gap in the reported nucleation data is surprising and unexpected if one recalls the large number of glasses produced in industrial practice by forming during quench. Furthermore, the analysis of a crystal ensemble does not allow to prove randomness in the nucleation events, a necessary condition in the framework of CNT. By contrast, the observation of single crystal events helps in discriminating partition of long-range diffusion fluxes (Kelton, 2000).
In the light of the above, this study aims at establishing nucleation kinetics by its time average of repeated single crystal nucleation events rather than using the ensemble average of crystals of double-stage heat treatments. The so-called stochastic approach to crystal nucleation has been introduced for undercooled low viscous (mPa s) liquids, such as metals and hydrous suspensions (Toschev and Markov, 1967; Toschev and Gutzow, 1972; Toschev et al., 1972; Toschev, 1973; Morton et al., 1994; Barlow and Haymet, 1995; Uttormark et al., 1997; Heneghan et al., 2001, 2002; Heneghan and Haymet, 2002; Wilson et al., 2005; Wilde et al., 2006, 2009; Yang et al., 2009, 2011, 2013). Our results show that it is applicable to high viscous (kPa s) silicate melts and it results in heterogeneous (HET) crystal nucleation rates from which TTT representations and critical cooling rates can be derived.
The formation of supercritical nuclei is a stochastic process. Nucleation events occur randomly and independent from each other. Already in the 1960s, Toschev and Markov (1967) showed that the electrolytic deposition of cadmium on platinum single crystal electrodes follows a Poisson distribution. Thereby, both the number of nuclei in a given time interval and the time necessary to form a certain number of nuclei are linked to probability distributions (Toschev and Gutzow, 1972; Toschev et al., 1972; Toschev, 1973).
Later probability distribution functions in the formation of the first supercritical nucleus have been studied for other liquid metals, such as niobium and zirconium (Morton et al., 1994), aluminum (Uttormark et al., 1997), gold and copper (Wilde et al., 2006, 2009), and tin (Yang et al., 2009, 2011, 2013) but also in water (pure and seeded) (Barlow and Haymet, 1995; Heneghan et al., 2001, 2002; Heneghan and Haymet, 2002; Wilson et al., 2005) and in gas hydrates (Maeda et al., 2011, 2012). In all these experiments, a single sample was repeatedly undercooled from above the melting temperature, while either the time (at an isothermal hold) or the temperature (at an isochronal cooling) of crystallization was detected. These experiments provided primary information on the average lag time and the mean undercooling, from which the crystal nucleation rate and the critical cooling rate can be derived. Secondary information include the activity of seeds and the purification of the liquid upon thermal cycling. Especially the ALTA (“automated lag time apparatus”) concept developed for studying the freezing behavior of water (Barlow and Haymet, 1995) is acknowledged since it has been designed to permit time-saving through a feed-back control that heats the sample immediately upon freezing.
In the past years, non-adiabatic fast scanning calorimetry has been developed to in situ measure the response of single metallic drops to temperature changes in a large range of cooling rate spanning four orders of magnitude (Yang et al., 2009, 2011, 2013). In these experiments, a small drop (volume ≈ 10−6 mm3) is repeatedly heated and cooled on a thin film sensor with rates up to 104 K s−1. Unfortunately, current technology of the so-called flash- or chip-calorimeters is limited to a maximum sensor temperature of about 700 K, which is much lower than the liquidus temperature of lithium disilicate glass [1306 K (Kracek, 1930)].
Glasses in the binary Li2O–SiO2 system, such as lithium disilicate (Li2Si2O5) have been the object of extensive research (see, for example, Tomozawa, 1972, 1973; Matusita and Tashiro, 1973; James, 1974, 1985; Fokin et al., 1981; Weinberg and Neilson, 1985; Barker et al., 1988; Deubener et al., 1993; Ota et al., 1997; Burgner and Weinberg, 2001; Nascimento et al., 2011) since their crystal nucleation and growth rates are relatively low at high undercoolings (T < 1.2 Tg) and thus conveniently measurable from crystal number densities and crystal sizes of optical microscopy images (James, 1974, 1989; Rowlands and James, 1979). Furthermore, detailed thermodynamic data are available for this system (Takahashi and Yoshio, 1973) which allow to test the validity of basic nucleation models from comparisons of predicted rates with measured data (Neilson and Weinberg, 1979; Rowlands and James, 1979; Zanotto and James, 1985; Weinberg and Zanotto, 1989; Fokin et al., 2010a).
Li2Si2O5 crystals nucleate homogeneously in the volume (James et al., 1978; James, 1985; Zanotto and James, 1985; Zanotto, 1987; Barker et al., 1988) disregarding the controversy of metastable phase formation prior to the crystallization of stable Li2Si2O5 crystals (Hench et al., 1971; Tomozawa, 1972; Barker et al., 1988; Deubener et al., 1993; Zanotto, 1997; Burgner et al., 1999; Iqbal et al., 1999) but also heterogeneously at suspended particles, such as platinum (Cronin and Pye, 1986; Narayan et al., 1996; Ray and Day, 1996; Ray et al., 1996; Mishima et al., 2006; Ranasinghe et al., 2007) and at the surfaces with the surrounding gas atmosphere (James, 1989; Ray and Day, 1996; Ray et al., 1996; Ranasinghe et al., 2007; Fokin et al., 2010b). Ranasinghe et al. (2007) performed heat treatments on pure and platinum doped Li2Si2O5 glasses and found that the critical cooling rate increases and the activation energy of crystallization decreases when Li2Si2O5 glass is heated in a container as compared to containerless processing (levitation) and that in both cases platinum promotes the crystallization of lithium disilicate glasses. However, the temperature dependence of preferred HET crystal nucleation leading to observable “coast-island” microstructures [see Fig. 1C in Krüger and Deubener (2015a) and Fig. 14 in Fokin et al. (2010b)] is not well understood with respect to isothermal heat treatments and for ramping at constant rates from above melting temperature and below glass transformation temperature, respectively.
The present paper reports on novel experiments of HET crystal nucleation, which have been performed by the stochastic approach under isothermal conditions at small undercooling (1.6 Tg). In particular, the time elapsed before the formation of the first supercritical nucleus is detected from repeated measurements in a PtRh-crucible and the HET steady-state nucleation rate is derived from the first-order kinetics of the probability distribution function. Using previous data (Krüger and Deubener, 2014, 2015a), a TTT diagram is produced from which the HET and homogeneous (HOM) crystallization can be clearly distinguished. The TTT curves of lithium disilicate help in understanding the development of coast-island microstructures observed in practice during cooling from above the liquidus temperature. We assume that the here established method is able to clarify also the crystallization mechanisms in other glass-forming systems.
Experimental
A glass of nominal composition Li2Si2O5 was prepared by melting a batch of the raw materials SiO2 and Li2CO3 (both of analytical grade). The batch was mixed and melted three times in a platinum crucible at 1673 K for 1 h under ambient conditions. The melt was subsequently quenched between two steel plates, which resulted in cooling rates of ~150–250 K min−1. The glass was analyzed by X-ray fluorescence (S4 Pioneer; Bruker AXS, Karlsruhe, Germany) while the Li2O content was determined by atomic emission spectroscopy (ICP-OES Vista MPX; Varian). The analyzed chemical composition was 77.4 SiO2, 21.0 Li2O, and 1.6 impurities (all in percent by weight), which slightly deviates from the nominal stoichiometry of Li2Si2O5.
A chip (= 21.4 mg) of the glass was inserted in a lidded PtRh-crucible and subjected to high-temperature differential scanning calorimetry (DSC 404 F3 Pegasus; Netzsch, Selb, Germany) under nitrogen atmosphere. A scheme of the operating mode of the DSC with the characteristic repeatedly performed heating-dwelling–cooling-dwelling cycles (red dashed-dotted line) is shown in Figure 1. In particular, the glass chip was heated at 0.167 K s−1 to a temperature of 1353 K, which is 47 K above Tm [Tm = 1306 K (Kracek, 1930)], dwelled for 300 s to ensure fully melting of the sample, cooled by ~1.25 K s−1 to the dwell temperature of 1173 K (undercooling ΔT = 133 K) and dwelled for 3360 s [the dwell time was set to ca. 1 h, a reasonable time in accordance with the results of Krüger and Deubener (2014)]. After dwelling the sample was immediately heated again to start the next run. In total 284 (= N0) runs were performed. In each run, the time elapsed before the first supercritical nucleus is formed (δN and δN+1) was calculated by subtracting the beginning of the isothermal hold (tb(N) and tb(N+1)) from the crystallization onset time (tN and tN+1) of the isothermal exothermal DSC signal (blue solid line in Figure 1). We assume that the recorded crystallization onset times follow the same distribution as δN and δN+1 since the time for crystal growth is negligible at this high temperature.
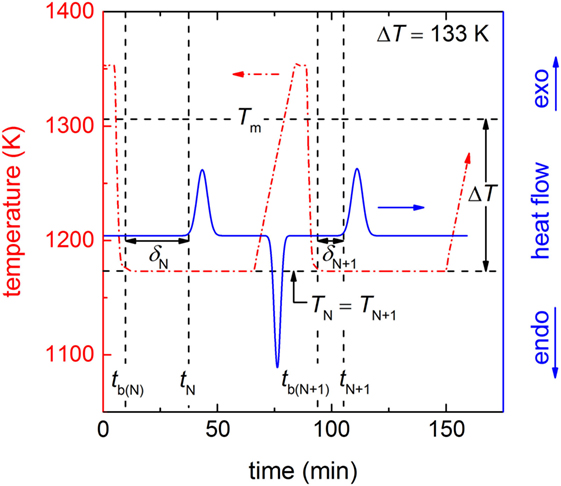
Figure 1. Scheme of the DSC protocol for two subsequent cooling-dwelling runs (N and N + 1) in the isothermal operating mode (ΔT = 133 K). The red dashed-dotted line shows the progression of the temperature of the heating-dwelling–cooling-dwelling cycles. The black horizontal dashed lines are Tm and the nucleation temperature of the runs N and N + 1 with TN = TN+1 = 1173 K, thus ΔT = 133 K (black double arrow). The black vertical dashed lines show the times of the beginning of the isothermal hold of the runs N and N + 1 with tb (N) and tb (N+1), respectively and the times of the start of the crystallization of both runs with tN and tN+1. Herein, the beginning of the crystallization equals the onset of the exothermal peak in the DSC signal (blue solid line). The time of the formation of the first supercritical nucleus in each run (black horizontal double arrows) δN (for run N) and δN + 1 (for run N + 1) is calculated by tN − tb (N) and tN+1 − tb (N+1), respectively.
Results
The basic result of our experiment is a histogram of the time of the formation of the first supercritical nucleus for each run δN in dependence of the run number N (Figure 2). This histogram provides the following information: first, 26 runs were crystallized before the dwell temperature at ΔT = 133 K was reached (δN < 0 s, blue dashed-dotted line of Figure 2) and 21 runs remained uncrystallized due to the programmed maximum dwell time of 3360 s (δN > 3360 s, red dashed-dotted line of Figure 2). Second, the histogram shows a random distribution of δN which indicates that the preferred HET nucleation site is continuously active during the entire experiment. A fast Fourier transformation (not shown) proved absence of any diurnal or other periodic behavior. One may assume that the crystal nucleates at the three-phase boundary between the silicate melt, the crucible wall, and the nitrogen atmosphere, but this is not known. Furthermore, the silhouette of Figure 2 (black outline of the time elapsed before the first supercritical nucleus is formed) seems to be horizontal, which indicates that compositional changes of the melt due to possible nitrogen dissolution and lithium evaporation at the surface are negligible. Furthermore, no shift in the integrated signal values was observed (not shown) which confirms the absence of any traceable mass loss during the entire period of the experiment.
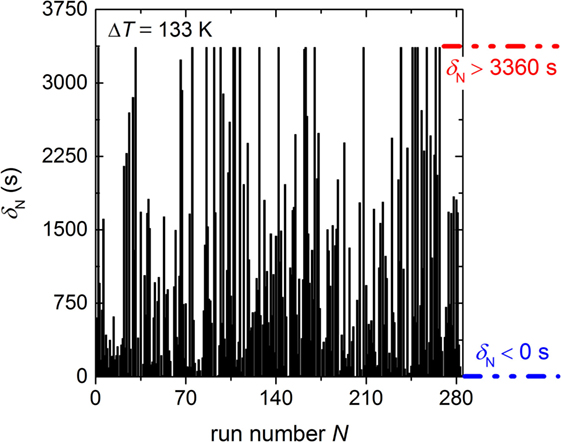
Figure 2. Time of formation of the first supercritical nucleus δN in dependence of the run number for the undercooling of 133 K. It has to be noted that 26 runs crystallized during cooling to the dwell temperature (δN < 0 s; blue dashed-dotted line) and 21 runs were not crystallizing within the dwell time 3360 s (δN > 3360 s; red dashed-dotted line).
In order to determine the HET steady-state nucleation rate I0 (HET) from this isothermal experiment, the relative frequencies of the number of runs remained unfrozen after a certain time are calculated. The procedure is similar to the calculation of the survival curve in Barlow and Haymet (1995) and Krüger and Deubener (2014). The δN data of Figure 2 are first arranged according to their length. At the shortest δN (= 0 s), there are 258 runs uncrystallized (26 runs crystallized during cooling to the dwell temperature). In all other runs, crystallization occurred at larger δN. For δN = 0, the uncrystallized fraction is N(δN = 0)/N0 = 258/284 = 0.908. For the second shortest δN, the fraction uncrystallized is 257/284 = 0.905 and so on. The last N(δN)/N0 fraction calculated in that way is 21/284 = 0.074 at δN = 3342 s since 21 runs were still uncrystallized at the end of the programmed isothermal hold. This fraction is set to 0. The calculated fractions N(δN)/N0 are plotted as a function of δN (Figure 3). The distribution curve shows a simple exponential decay that illustrates an increase in the nucleation probability with longer δN. The nucleation probability can be described by a simple first-order rate equation
and its logarithmic form
where the constant A accounts for the initially crystallized fraction at δN = 0. Equation 2 is shown by the insert of Figure 3. The apparently linear dependence of the data on δN confirmed first-order reaction kinetics, and fitting the data (green solid line in Figure 3) results in a HET crystal nucleation rate of I0 (HET) = (9.19 ± 0.04) × 10−4 s−1. We note that exclusion of the 26 runs crystallized before the isothermal hold is reached results in the same value of I0 (HET) but the parameter A of Eq. 1 will become unity. However, we think that the consideration of all data points in the probability distribution as shown in Figure 3 is the most appropriate linking to the stochastic experiment.
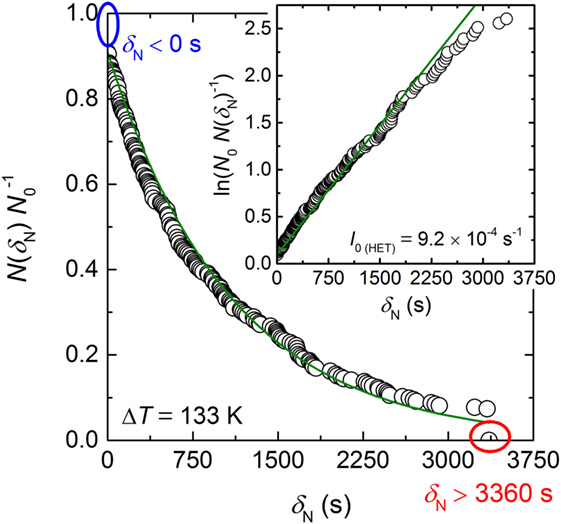
Figure 3. Probability distribution of the fraction of runs uncrystallized (N(δN) N0−1) in dependence of δN. The ovals (blue and red) correspond to the dashed-dotted lines of Figure 2. The insert shows the logarithmic Eq. 2. I0 (HET) is given as the slope of the linear dependence. The green solid line is the best linear fit through the data with a regression coefficient R2 = 0.995.
Discussion
The most striking feature of the results is that the found exponential decay of Figure 3 is similar to those reported for seeded water (Barlow and Haymet, 1995; Heneghan et al., 2001, 2002). This underlines the fundamental character of crystal nucleation as a stochastic process obeying first-order reaction kinetics. However, one should note that due to the experimental constraints, such as the limited cooling rate to reach the dwell temperature and the restricted dwell time of 3360 s, 47 of the 248 runs are not captured by the probability distribution. Thus, a second crystal nucleation mechanism might be active with characteristic time scales tN < tb (N) and tN > δN (3360 s). This assumption is supported by the fact that the long time fractions of Figure 3 show a negative deviation from the proposed linearity. On the other hand, the negative deviation can also arise from an insufficient number of cooling runs preventing good statistics and, therefore, underestimating N(δN)/N0 at long times.
In order to exclude memory effects between adjacent runs of the histogram (Figure 2), a Pearson correlation test (Barlow and Haymet, 1995; Heneghan et al., 2001) was performed (not shown). A Pearson correlation coefficient r = 0.01 was obtained, which confirms that the probability of having correlation between adjacent runs is close to 0. The exclusion of memory effects is illustrated by different onset times of adjacent runs (Figure 4). Herein, the runs 6 and 7 exhibit significantly different crystallization onset times. Moreover, the individual evolution of the heat release of each run of Figure 4 reveals growth of one or only few crystals (Krüger and Deubener, 2014). A larger ensemble of growing crystals would lead to an averaged signal shape (Gaussian) as it is typical for heating lithium disilicate glasses in DTA/DSC experiments from temperatures below glass transformation (Krüger et al., 2013).
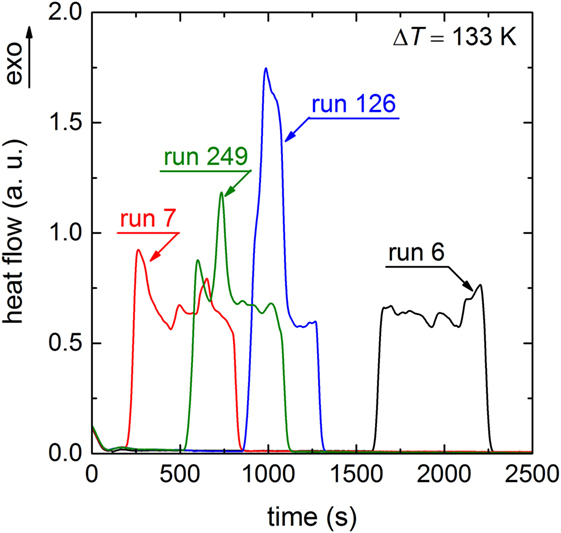
Figure 4. DSC crystallization peaks of runs 6, 7, 126, and 249 during dwelling at ΔT = 133 K.
Additionally to the visual inspection of the signal’s shape the broadness is analyzed. As an example, the signal of run 249 exhibits a broadness of 600 s (Figure 4). Assuming only one growing crystal and a crystal size that corresponds to the circumference of the crucible (the final geometry of the crystal after 284 runs is ring-shaped due to wetting of the crucible walls by the Li2Si2O5 melt) leads to a crystal growth rate of 3.4 × 10⁻⁵ m s−1. The approximated growth rate from the signal’s length is very close to the reported value (5.1 × 10⁻⁵ m s−1) of Burgner and Weinberg (2001) for the same temperature that supports the assumption that the entire liquid volume is consumed by only one or few crystals. Few crystals would result in a somewhat smaller broadness (see, e.g., run 126 of Figure 4). A low number of crystals growing simultaneously at the surface are further supported by the observations of Ranasinghe et al. (2007). They found that only up to two crystals were simultaneously growing at the surface of levitated Li2Si2O5 drops. Thus, in accordance with our DSC protocol (Figure 1), assigning the onset time of the crystallization peak to the time of the formation of the first supercritical nucleus seems to be reasonable.
In order to link I0 (HET) to our previous stochastic experiment (Krüger and Deubener, 2014), which was run under constant cooling conditions (cooling rate = 0.083 K s−1), nucleation rate data have to be derived from the undercooling-dependent N(ΔT)/N0 vs. ΔT distribution curve (Figure 5). In this case, the probability curve with the fractions of runs remaining unfrozen N(ΔT)/N0 at a certain undercooling is deconvoluted considering the temperature-dependent I0 (HET):
where C1 and C2 are temperature-independent constants and η is the viscosity of the Li2Si2O5 melt. In order to determine C1 and C2 from the isochronal experiment, Eq. 3 is inserted in Eq. 1 and the parameter A is set to unity. By doing so, we assume that the crystal nucleation process is independent on the cooling rate. Rearranging the equation and taking the logarithm results in:
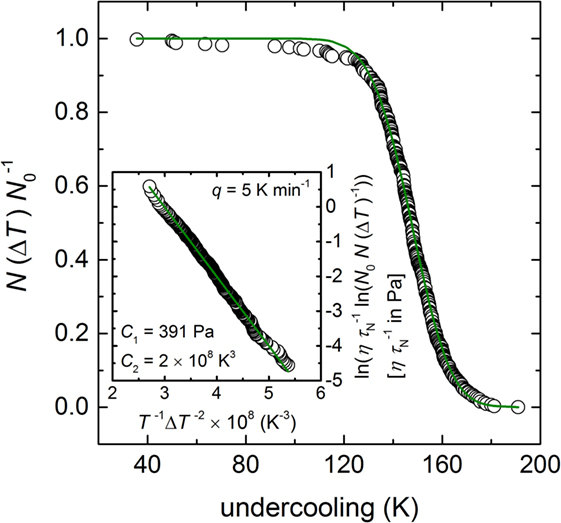
Figure 5. Probability distribution of the fraction of runs uncrystallized (N(ΔT) N0−1) in dependence of the undercooling taken from Krüger and Deubener (2014) and deconvoluted to determine the temperature-dependent nucleation rate curve (insert). The green solid line of the insert shows the best fit of Eq. 4 through the data points using the adjustable parameters C1 = 391 Pa and C2 = 2 × 10⁸ K3. Note the renaming τN ≡ δN.
By applying Eq. 4 to the already published data of Krüger and Deubener (2014) and the temperature-dependent viscosity of Krüger and Deubener (2015b), the adjustable parameter C1 = 391 Pa and C2 = 2 × 10⁸ K3 were determined (green solid line in the insert of Figure 5). We note the small deviation from the fitted trend of the runs of ΔT < 120 K that is either an artifact of an insufficient number of cooling runs or an indication of a second crystal nucleation mechanism as already discussed in case of the isothermal experiment.
Plotting together the HET nucleation rate curve of the above calculation in the range 0.62–0.92 Tm (red solid line), I0 (HET) of the isothermal experiment at T = 0.898 Tm (red circle), I0 (HET) of single-stage experiments in the range 0.64–0.68 Tm (Krüger and Deubener, 2015a) (red squares), and the HOM nucleation rates of double-stage experiments in the range 0.53–0.61 Tm (James, 1974; Zanotto and James, 1985; Barker et al., 1988; Deubener et al., 1993) (blue circles) on the reduced temperature scale T/Tm reveals that the HET nucleation rate curve is well separated from the HOM one. Maximum nucleation rates are found at Tmax (HOM) = 0.55 Tm and Tmax (HET) = 0.82 Tm for the HOM and the HET crystal nucleation, respectively (Figure 6). The equations of the classical nucleation theory and the material-specific input parameters listed in Tables 1 and 2 were used to fit these experimental data (OriginPro 9.0.0G; OriginLab Corp.). In order to calculate crystal nucleation rates (blue and red dashed-dotted lines in Figure 6) in the dimension of a frequency, HOM and HET nucleation rates were multiplied by the sample volume and the surface area, respectively. The liquid–crystal interfacial energy was treated as an adjustable parameter for which a linear temperature dependence in accordance with James (1985) was anticipated (Tables 1 and 2). The coordination number of the moving particle (CN = 2) and the number of atoms in a structural unit (n = 9) both entering the Eyring equation to adopt diffusivity to viscous flow where utilized from a previous study (Krüger and Deubener, 2015b). In case of the HET nucleation rate curve, additionally the number of active nucleation sites nS = (0.023 ± 0.001) m−2 and the wetting angle θ = (26.4 ± 0.1)° were adjusted to fit the data best. The resulting curves emphasize that at Tmax the HET crystal nucleation rate is about two orders of magnitude smaller than the HOM one. The sum of both rates is the effective crystal nucleation rate that is highlighted by the black solid line in Figure 6. We note that possible sources of the small deviation between I0 (HET) of the isothermal and the isochronal statistical experiment are differences in the glass composition and changes in the quality of the crucible used in the two studies.
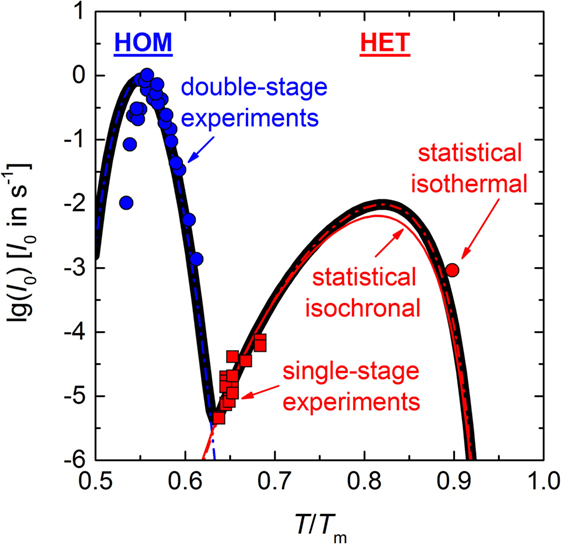
Figure 6. Temperature-dependent homogeneous (HOM) and heterogeneous (HET) nucleation rate curves (blue and red dashed-dotted lines, respectively) and the effective nucleation rate curve (black solid line). Data: surface nucleation rate calculated by Eq. 3 and using the constants C1 and C2 as determined in Figure 5 (red solid line), I0 (HET) of the isothermal experiment of Figure 3 (red circle), I0 (HET) as determined from impingement times of single-stage experiments (Krüger and Deubener, 2015a) (red squares). Homogeneous nucleation rates of double-stage experiments (James, 1974; Zanotto and James, 1985; Barker et al., 1988; Deubener et al., 1993) (blue circles).
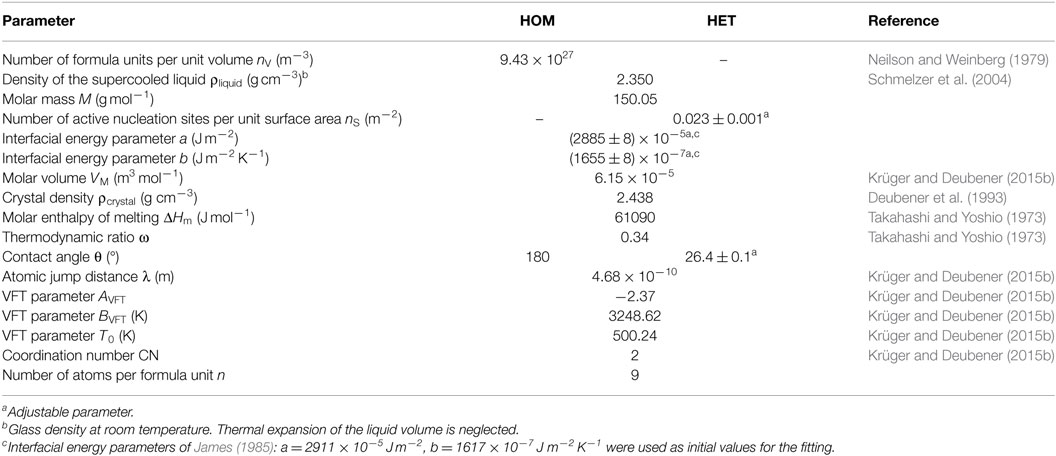
Table 1. Parameters of the calculation of the homogeneous (HOM) and heterogeneous (HET) nucleation rate of Li2Si2O5 crystals in lithium disilicate melt.
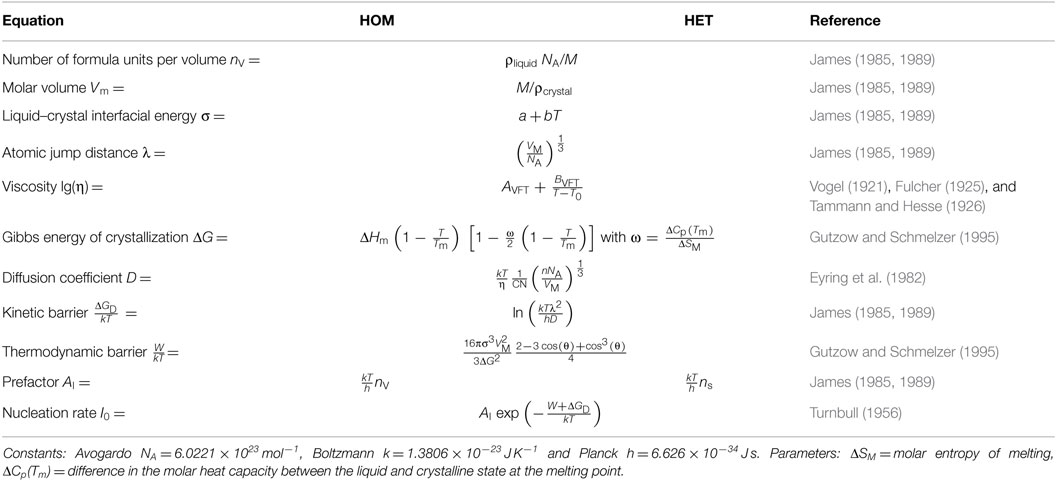
Table 2. Equations of the calculation of the homogeneous (HOM) and heterogeneous (HET) crystal nucleation rate.
With regard to the large difference in Tmax between surface and volume crystal nucleation in lithium disilicate, it is interesting to compute a TTT diagram for the crystalline fraction α = 10−6 (Uhlmann, 1972) using the following two equations (Zanotto, 1996):
and
In Equations 5 and 6, tV and tS are the times necessary to crystallize 10−4 percent of the glass in the volume and at the surface, respectively. U is the crystal growth rate that is utilized from the data compilation of Burgner and Weinberg (2001). Figure 7 shows that crystallization initiated by HET surface nucleation (red dashed-dotted line) and HOM volume nucleation (blue dashed-dotted line) overlap only partially. In order to calculate the overall crystallization time, Eq. 6 was used, while I0 (HOM) was converted to a surface nucleation rate [I0 (HOM, S) = I0 (HOM, V)2/3 × tV−1/3 (Krüger and Deubener, 2015a), the uncertainty of the conversion is less than 1%] and added to the HET nucleation rate. The shape of the overall time with a “double-nose” (black solid line) resembles those of an aqueous lithium chloride solution (MacFarlane et al., 1983) and of polybutylene terephthalate (Androsch et al., 2015). The double-nose diagram helps to explain the formation of a coast-island microstructure if lithium disilicate glass is heated at low rates from below Tg in practice. In agreement with the microstructures shown for different heating rates in Krüger and Deubener (2015a), larger heating rates suppress HOM volume nucleation of crystals and allow for surface crystallization only. By contrast, if a lithium disilicate glass sample is subjected at the first stage of the double-stage heat treatment to a temperature in the HOM nucleation range dwelling will form initially crystal nuclei in the volume (James, 1974). Additionally, the distinct HET nose of the TTT diagram emphasizes that cooling a lithium disilicate melt from above Tm always leads to a crystallized surface and dictates the critical cooling rate in this system. The latter is estimated by the so-called nose method using the simple calculus Rc = (Tn − Tm)/tn (Uhlmann, 1972). With the coordinates of the nose Tn = 1122 K and tn = 2.51 s, the critical cooling rate is ca. 73 K s−1 (green dotted line in Figure 7).
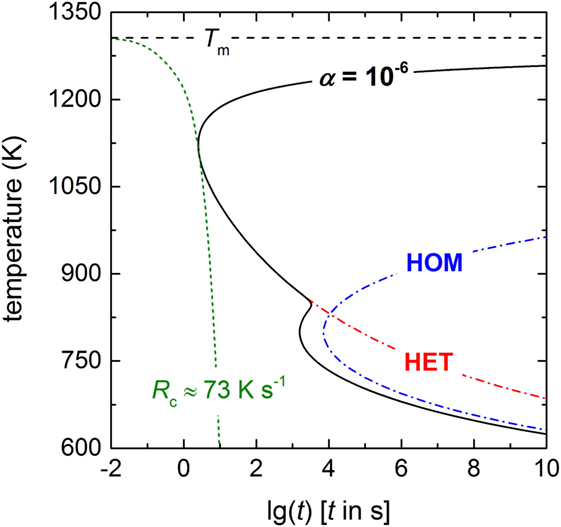
Figure 7. TTT diagram of lithium disilicate for a crystallized fraction of α = 10−6 (black solid line), including both homogeneous crystallization in the volume (blue dashed-dotted line, HOM) and heterogeneous crystallization at the surface (red dashed-dotted line, HET) using Equations 5 and 6. The critical cooling rate Rc is ~73 K s−1 (green dotted line).
We are fully aware that Rc is overestimated by the TTT representation (Xu et al., 2013). A TTT diagram has to be converted to a CCT diagram to calculate the critical cooling rate more exactly (Grange and Kiefer, 1941; Zhu et al., 2006). However, it was shown by Davies (1976), Ramachandrarao et al. (1977), Uhlmann and Yinnon (1983), and Scherer (1991) that Rc calculated from a TTT diagram meets the experimental result within one order of magnitude. A first attempt to determine TTT and CCT diagrams in lithium disilicate was performed by Zhu et al. (2006) 10 years ago. They spotted a small glass volume on the tip of a Pt-thermocouple and measured the onset temperature and time of the crystallization peak in isochronal and isothermal mode of operation. By comparison to Figure 7, their single nose can be clearly identified as the HET part of the overall crystallization leading to exclusively surface crystallization.
Conclusion
The most striking outcome of the present study is the “double-nose” TTT diagram of lithium disilicate due to a decoupling of the nucleation mechanisms of HOM volume nucleation of crystals at large undercoolings (0.53–0.61 Tm) and HET surface nucleation of crystals at smaller undercoolings (0.62–0.92 Tm). This behavior is the origin for the evolution of coast-island microstructures of lithium disilicate in practice. Due to the stochastic experiments at small undercoolings HET nucleation is measurable and the corresponding rate with a maximum at 1071 K is quantified for the first time. Based on the calculated TTT diagram the critical cooling rate is about 73 K s−1.
The results emphasize that exploring the time average of nucleation events by thermal cycling is a novel and highly attractive route to study HET crystal nucleation in silicate glasses. In particular, they point out that the rare data on HET nucleation rates and critical cooling rates that are based on one-time cooling experiments have to be reconsidered to include statistical certainty.
Author Contributions
SK performed experiments. SK and JD prepared manuscript.
Conflict of Interest Statement
The authors declare that the research was conducted in the absence of any commercial or financial relationships that could be construed as a potential conflict of interest.
Acknowledgments
We acknowledge support by Open Access Publishing Fund of Clausthal University of Technology.
References
Androsch, R., Rhoades, A. M., Stolte, I., and Schick, C. (2015). Density of heterogeneous and homogeneous crystal nuclei in poly (butylene terephthalate). Eur. Polym. J. 66, 180–189. doi: 10.1016/j.eurpolymj.2015.02.013
Barker, M. F., Wang, T.-H., and James, P. F. (1988). Nucleation and growth kinetics of lithium disilicate and lithium metasilicate in lithia-silica glasses. Phys. Chem. Glasses 29, 240–248.
Barlow, T. W., and Haymet, A. D. J. (1995). ALTA: an automated lag-time apparatus for studying the nucleation of supercooled liquids. Rev. Sci. Instrum. 66, 2996–3007. doi:10.1063/1.1145586
Burgner, L. L., and Weinberg, M. C. (2001). An assessment of crystal growth behavior in lithium disilicate glass. J. Non-Cryst. Solids 279, 28–43. doi:10.1016/S0022-3093(00)00325-2
Burgner, L. L., Weinberg, M. C., Lucas, P., Soares, P. C. Jr., and Zanotto, E. D. (1999). XRD investigation of metastable phase formation in Li2O-2SiO2 glass. J. Non-Cryst. Solids 255, 264–268. doi:10.1016/S0022-3093(99)00376-2
Cronin, D., and Pye, L. D. (1986). Platinum catalyzed crystallization of Li2O⋅2SiO2 glass. J. Non-Cryst. Solids 84, 196–205. doi:10.1016/0022-3093(86)90778-7
Deubener, J., Brückner, R., and Sternitzke, M. (1993). Induction time analysis of nucleation and crystal growth in di- and metasilicate glasses. J. Non-Cryst. Solids 163, 1–12. doi:10.1016/0022-3093(93)90638-E
Dressler, M., Rüdinger, B., and Deubener, J. (2011). An in situ high-temperature X-ray diffraction study of early-stage crystallization in lithium alumosilicate glass-ceramics. J. Am. Ceram. Soc. 94, 1421–1426. doi:10.1111/j.1551-2916.2010.04252.x
Dressler, M., Rüdinger, B., and Deubener, J. (2014). Crystallization kinetics in a lithium alumosilicate glass using SnO2 and ZrO2 additives. J. Non-Cryst. Solids 389, 60–65. doi:10.1016/j.jnoncrysol.2014.02.008
Eyring, H., Henderson, D., Stover, B. J., and Eyring, E. M. (1982). Statistical Mechanics and Dynamics, 2nd Edn. New York, NY: Wiley.
Fokin, V. M., Kalinina, A. M., and Filipovich, V. N. (1981). Nucleation in silicate glasses and effect of preliminary heat treatment on it. J. Cryst. Growth 52, 115–121. doi:10.1016/0022-0248(81)90178-0
Fokin, V. M., Zanotto, E. D., and Schmelzer, J. W. P. (2010a). On the thermodynamic driving force for interpretation of nucleation experiments. J. Non-Cryst. Solids 356, 2185–2191. doi:10.1016/j.jnoncrysol.2010.07.040
Fokin, V. M., Cabral, A. A., Reis, R. M. C. V., Nascimento, M. L. F., and Zanotto, E. D. (2010b). Critical assessment of DTA-DSC methods for the study of nucleation kinetics in glasses. J. Non-Cryst. Solids 356, 358–367. doi:10.1016/j.jnoncrysol.2009.11.038
Fokin, V. M., Zanotto, E. D., Yuritsyn, N. S., and Schmelzer, J. W. P. (2006). Homogeneous crystal nucleation in silicate glasses: a 40 years perspective. J. Non-Cryst. Solids 352, 2681–2714. doi:10.1016/j.jnoncrysol.2006.02.074
Fulcher, G. S. (1925). Analysis of recent measurements of the viscosity of glasses. J. Am. Ceram. Soc. 8, 789–794. doi:10.1111/j.1151-2916.1925.tb16731.x
Grange, R. A., and Kiefer, J. M. (1941). Transformation of austenite on continuous cooling and its relation to transformation at constant temperature. Trans. ASM 29, 85.
Gutzow, I., and Schmelzer, J. (1995). Nucleation in Glass-Forming Systems, The Vitreous State. Berlin: Springer, 218–281.
Hench, L. L., Frieman, S. W., and Kinser, D. L. (1971). Early stages of crystallisation in a Li2O-2SiO2 Glass. Phys. Chem. Glasses 12, 58–63.
Heneghan, A. F., and Haymet, A. D. J. (2002). Liquid-to-crystal nucleation: a new generation lag-time apparatus. J. Chem. Phys. 117, 5319–5327. doi:10.1063/1.1497635
Heneghan, A. F., Wilson, P. W., and Haymet, A. D. J. (2002). Heterogeneous nucleation of supercooled water, and the effect of an added catalyst. Procs. Nat. Acad. Sci. U.S.A. 99, 9631–9634. doi:10.1073/pnas.152253399
Heneghan, A. F., Wilson, P. W., Wang, G., and Haymet, A. D. J. (2001). Liquid-to-crystal nucleation: automated lag-time apparatus to study supercooled liquids. J. Chem. Phys. 115, 7599–7608. doi:10.1063/1.1407290
Iqbal, Y., Lee, W. E., Holland, D., and James, P. F. (1999). Crystal nucleation in P2O5-doped lithium disilicate glasses. J. Mater. Sci. 34, 4399–4411. doi:10.1023/A:1004668701163
James, P. F. (1974). Kinetics of crystal nucleation in lithium silicate-glasses. Phys. Chem. Glasses 15, 95–105.
James, P. F. (1985). Kinetics of crystal nucleation in silicate glasses. J. Non-Cryst. Solids 73, 517–540. doi:10.1016/0022-3093(85)90372-2
James, P. F. (1989). “Volume nucleation in silicate glasses,” in Glasses and Glass-Ceramics, ed. M. H. Lewis (New York: Chapman and Hall), 59–105.
James, P. F., Scott, B., and Armstrong, P. (1978). Kinetics of crystal nucleation in lithium disilicate glass. A comparison between melts prepared in platinum and silica crucibles and between melts prepared from ordinary and high purity starting materials. Phys. Chem. Glasses 19, 24–27.
Kelton, K. F. (2000). Kinetic model for nucleation in partitioning systems. J. Non-Cryst. Solids 274, 147–154. doi:10.1016/S0022-3093(00)00185-X
Kracek, F. C. (1930). The binary system Li2O-SiO2. J. Phys. Chem. 34, 2641–2650. doi:10.1021/j150318a001
Krüger, S., and Deubener, J. (2014). Stochastic nature of the liquid-to-crystal heterogeneous nucleation of supercooled lithium disilicate liquid. J. Non-Cryst. Solids 388, 6–9. doi:10.1016/j.jnoncrysol.2014.01.036
Krüger, S., and Deubener, J. (2015a). Heterogeneous surface nucleation of lithium disilicate glass: an isothermal DSC study. J. Non-Cryst. Solids 417, 45–51. doi:10.1016/j.jnoncrysol.2015.03.013
Krüger, S., and Deubener, J. (2015b). Lag time to crystal nucleation of supercooled lithium disilicate melts: a test of the classical nucleation theory. J. Non-Cryst. Solids 426, 1–6. doi:10.1016/j.jnoncrysol.2015.06.023
Krüger, S., Deubener, J., Ritzberger, C., and Höland, W. (2013). Nucleation kinetics of lithium metasilicate in ZrO2-bearing lithium disilicate glasses for dental application. Int. J. Appl. Glass Sci. 4, 9–19. doi:10.1111/ijag.12011
MacFarlane, D. R., Kadiyala, R. K., and Angell, C. A. (1983). Homogeneous nucleation and growth of ice from solutions. TTT curves, the nucleation rate, and the stable glass criterion. J. Chem. Phys. 79, 3921–3927. doi:10.1063/1.446260
Maeda, N., Wells, D., Becker, N. C., Hartley, P. G., Wilson, P. W., Haymet, A. D. J., et al. (2011). Development of a high pressure automated lag time apparatus for experimental studies and statistical analyses of nucleation and growth of gas hydrates. Rev. Sci. Instrum. 82, 065109. doi:10.1063/1.3602926
Maeda, N., Wells, D., Hartley, P. G., and Kozielski, K. A. (2012). Statistical analysis of supercooling in fuel gas hydrate systems. Energy Fuels 26, 1820–1827. doi:10.1021/ef201965z
Matusita, K., and Tashiro, M. (1973). Rate of homogeneous nucleation in alkali disilicate glasses. J. Non-Cryst. Solids 11, 471–484. doi:10.1016/0022-3093(73)90092-6
Mishima, N., Wakasugi, T., and Ota, R. (2006). Bulk crystallisation in mixed alkali disilicate glasses doped with a nucleating agent. Phys. Chem. Glasses 47, 259–265.
Morton, C. W., Hofmeister, W. H., Bayuzick, R. J., and Robinson, M. B. (1994). A statistical approach to understanding nucleation phenomena. Mater. Sci. Eng. A 178, 209–215. doi:10.1016/0921-5093(94)90545-2
Müller, R., Zanotto, E. D., and Fokin, V. M. (2000). Surface crystallization of silicate glasses: nucleation sites and kinetics. J. Non-Cryst. Solids 274, 208–231. doi:10.1016/S0022-3093(00)00214-3
Narayan, K. L., Kelton, K. F., and Ray, C. S. (1996). Effect of Pt doping on nucleation and crystallization in Li2O⋅2SiO2 glass: experimental measurements and computer modeling. J. Non-Cryst. Solids 195, 148–157. doi:10.1016/0022-3093(95)00526-9
Nascimento, M. L. F., Fokin, V. M., Zanotto, E. D., and Abyzov, A. S. (2011). Dynamic processes in a silicate liquid from above melting to below the glass transition. J. Chem. Phys. 135, 194703. doi:10.1063/1.3656696
Neilson, G. F., and Weinberg, M. C. (1979). A test of classical nucleation theory: crystal nucleation of lithium disilicate glass. J. Non-Cryst. Solids 34, 137–147. doi:10.1016/0022-3093(79)90013-9
Ota, R., Mishima, N., Wakasugi, T., and Fukunaga, J. (1997). Nucleation of Li2O-SiO2 glass and its interpretation based on a new liquid model. J. Non-Cryst. Solids 219, 70–74. doi:10.1016/S0022-3093(97)00253-6
Ramachandrarao, P., Cantor, B., and Cahn, R. W. (1977). Viscous behaviour of undercooled metallic melts. J. Non-Cryst. Solids 24, 109–120. doi:10.1016/0022-3093(77)90065-5
Ranasinghe, K. S., Ray, C. S., Day, D. E., Rogers, J. R., Hyers, R. W., and Rathz, T. (2007). Containerless processing of a lithium disilicate glass. J. Mater. Sci. 42, 4291–4297. doi:10.1007/s10853-006-1232-z
Ray, C. S., and Day, D. E. (1996). Identifying internal and surface crystallization by differential thermal analysis for the glass-to-crystal transformations. Thermochim. Acta 280/281, 163–174. doi:10.1016/0040-6031(95)02640-1
Ray, C. S., Day, D. E., Huang, W., Narayan, K. L., Cull, T. S., and Kelton, K. F. (1996). Non-isothermal calorimetric studies of the crystallization of lithium disilicate glass. J. Non-Cryst. Solids 204, 1–12. doi:10.1016/0022-3093(96)00401-2
Rowlands, E. G., and James, P. F. (1979). Analysis of steady state crystal nucleation rates in glasses. Part 1. Methods of analysis and application to lithium disilicate glass., Part 2. Further comparison between theory and experiment for lithium disilicate glass. Phys. Chem. Glasses 20, 9–14.
Scherer, G. W. (1991). “Glass formation and relaxation,” in Materials Science and Technology – A Comprehensive Treatment, Vol. 9: Glasses and Amorphous Materials, eds R. W. Cahn, P. Haasen, E. J. Kramer, and J. Zarzycki (Weinheim: VCH Verlagsgesellschaft mbH), 119–173.
Schmelzer, J. W. P., Potapov, O. V., Fokin, V. M., Müller, R., and Reinsch, S. (2004). The effect of elastic stress and relaxation on crystal nucleation in lithium disilicate glass. J. Non-Cryst. Solids 333, 150–160. doi:10.1016/j.jnoncrysol.2003.10.002
Takahashi, K., and Yoshio, T. (1973). Thermodynamic quantities of alkali silicates in the temperature range from 25°C to melting point. Yogyo Kyokai Shi 81, 524–533. doi:10.2109/jcersj1950.81.940_524
Tammann, G., and Hesse, W. (1926). Die Abhängigkeit der Viscosität von der Temperatur bei unterkühlten Flüssigkeiten. Z. Anorg. Allg. Chem. 156, 245–257. doi:10.1002/zaac.19261560121
Tomozawa, M. (1972). Liquid phase separation and crystal nucleation in Li2O–SiO2 glasses. Phys. Chem. Glasses 13, 161–166.
Tomozawa, M. (1973). Liquid phase separation and crystal growth in Li2O-SiO2 glass. Phys. Chem. Glasses 14, 112–115.
Toschev, S. (1973). “Homogeneous nucleation,” in Crystal Growth: An Introduction, ed. P. Hartman (Amsterdam: North-Holland Publishing Co.), 1–49.
Toschev, S., and Gutzow, I. (1972). Nichtstationäre Keimbildung: Theorie und Experiment. Krist. Tech. 7, 43–73. doi:10.1002/crat.19720070108
Toschev, S., and Markov, I. (1967). Electrolytic nucleation of cadmium. Electrochim. Acta 12, 281–286. doi:10.1016/0013-4686(67)80006-9
Toschev, S., Milchev, A., and Stoyanov, S. (1972). On some probabilistic aspects of the nucleation process. J. Cryst. Growth 1, 123–127. doi:10.1016/0022-0248(72)90073-5
Turnbull, D. (1956). “Phase changes,” in Solid State Physics, Vol. 3, eds F. Seitz and D. Turnbull (New York: Academic Press), 225–306.
Uhlmann, D. R. (1972). A kinetic treatment of glass formation. J. Non-Cryst. Solids 7, 337–348. doi:10.1016/0022-3093(72)90269-4
Uhlmann, D. R., and Yinnon, H. (1983). “The formation of glasses,” in Glass: Science and Technology, Vol. 1: Glass-Forming Systems, eds D. R. Uhlmann and N. J. Kreidl (New York, London, Paris, San Diego, San Francisco, Sao Paulo, Sydney, Tokyo, Toronto: Academic Press, Inc.), 1–47.
Uttormark, M. J., Zanter, J. W., and Perepezko, J. H. (1997). Repeated nucleation in an undercooled aluminum droplet. J. Cryst. Growth 177, 258–264. doi:10.1016/S0022-0248(96)01121-9
Vogel, H. (1921). The law of the relation between the viscosity of liquids and the temperature. Phys. Z. 22, 645–646.
Weinberg, M. C., and Neilson, G. F. (1985). On the possibility of critical radius measurements in the homogeneous crystal nucleation of glass. J. Non-Cryst. Solids 74, 177–179. doi:10.1016/0022-3093(85)90412-0
Weinberg, M. C., and Zanotto, E. D. (1989). Re-examination of the temperature dependence of the classical nucleation rate: homogeneous crystal nucleation in glass. J. Non-Cryst. Solids 108, 99–108. doi:10.1016/0022-3093(89)90337-2
Wilde, G., Santhaweesuk, C., Sebright, J. L., Bokeloh, J., and Perepezko, J. H. (2009). Kinetics of heterogeneous nucleation on intrinsic nucleants in pure fcc transition metals. J. Phys. Condens. Matter 21, 464113. doi:10.1088/0953-8984/21/46/464113
Wilde, G., Sebright, J. L., and Perepezko, J. H. (2006). Bulk liquid undercooling and nucleation in gold. Acta Mater. 54, 4759–4769. doi:10.1016/j.actamat.2006.06.007
Wilson, P. W., Lester, D., and Haymet, A. D. J. (2005). Heterogeneous nucleation of clathrates from supercooled tetrahydrofuran (THF)/water mixtures, and the effect of an added catalyst. Chem. Eng. Sci. 60, 2937–2941. doi:10.1016/j.ces.2004.12.047
Xu, K., Wang, Y., Li, J., and Li, Q. (2013). Critical cooling rate for the glass formation of ferromagnetic Fe80P13C7 alloy. Acta Metall. Sin. (Engl. Lett.). 26, 56–62. doi:10.1007/s40195-012-0117-1
Yang, B., Abyzov, A. S., Zhuravlev, E., Gao, Y., Schmelzer, J. W. P., and Schick, C. (2013). Size and rate dependence of crystal nucleation in single tin drops by fast scanning calorimetry. J. Chem. Phys. 138, 054501. doi:10.1063/1.4789447
Yang, B., Gao, Y., Zou, C., Zhai, Q., Abyzov, A. S., Zhuravlev, E., et al. (2011). Cooling rate dependence of undercooling of pure Sn single drop by fast scanning calorimetry. Appl. Phys. A 104, 189–196. doi:10.1007/s00339-010-6100-7
Yang, B., Gao, Y. L., Zou, C. D., Zhai, Q. J., Zhuravlev, E., and Schick, C. (2009). Repeated nucleation in an undercooled tin droplet by fast scanning calorimetry. Mater. Lett. 63, 2476–2478. doi:10.1016/j.matlet.2009.08.041
Zanotto, E. D. (1987). Isothermal and adiabatic nucleation in glass. J. Non-Cryst. Solids 89, 361–370. doi:10.1016/S0022-3093(87)80278-8
Zanotto, E. D. (1996). The applicability of the general theory of phase transformations to glass crystallization. Thermochim. Acta 28, 73–82. doi:10.1016/0040-6031(95)02636-3
Zanotto, E. D. (1997). Metastable phases in lithium disilicate glasses. J. Non-Cryst. Solids 219, 42–48. doi:10.1016/S0022-3093(97)00249-4
Zanotto, E. D., and James, P. F. (1985). Experimental tests of the classical nucleation theory for glasses. J. Non-Cryst. Solids 74, 373–394. doi:10.1016/0022-3093(85)90080-8
Keywords: lithium disilicate glass, time of formation of the first supercritical nucleus, stochastic nature of crystal nucleation, effective nucleation rate, TTT representation, coast-island microstructure
Citation: Krüger S and Deubener J (2016) The TTT Curves of the Heterogeneous and Homogeneous Crystallization of Lithium Disilicate – A Stochastic Approach to Crystal Nucleation. Front. Mater. 3:42. doi: 10.3389/fmats.2016.00042
Received: 09 July 2016; Accepted: 12 August 2016;
Published: 31 August 2016
Edited by:
Ashutosh Goel, Rutgers University, USAReviewed by:
John Stuart McCloy, Washington State University, USAQiang Fu, Corning Inc., USA
Daniel Roberto Cassar, Federal University of Sao Carlos, Brazil
Anuraag Gaddam, University of Aveiro, Portugal
Copyright: © 2016 Krüger and Deubener. This is an open-access article distributed under the terms of the Creative Commons Attribution License (CC BY). The use, distribution or reproduction in other forums is permitted, provided the original author(s) or licensor are credited and that the original publication in this journal is cited, in accordance with accepted academic practice. No use, distribution or reproduction is permitted which does not comply with these terms.
*Correspondence: Joachim Deubener, am9hY2hpbS5kZXViZW5lckB0dS1jbGF1c3RoYWwuZGU=