 Shingo Nakane
 Kosuke Kawamoto
- Nippon Electric Glass Co., Ltd., Otsu, Japan
Transparent β-quartz s.s. glass-ceramics in Li2O–Al2O3–SiO2 system have an undesirable brown color owing to Fe ions as a contaminant, whereas the mother glass normally has a clear appearance. Elucidation of the coloration mechanism during crystallization is important for industry to develop highly transparent materials. In this study, the mother glass contained SiO2, Al2O3, and Li2O as its principal constituents and TiO2 and ZrO2 as nucleation agents. The amount of contaminant Fe ions in the form of Fe2O3 was 0.03 wt%. It was confirmed that the coloration was appeared by the coexistence of Fe and Ti ions in the glass matrix based on the experimental results using Ti-containing and Ti-free glasses with a composition identical to that of the glass matrix. The coordination and oxidation state of the Fe ions were not changed by the coexistence of Ti ion according to the results of X-ray absorption near-edge structure measurement. The coloration is considered to be due to the formation of Fe–O–Ti by the concentration of Fe and Ti ions in the glass matrix phase during the crystallization process.
Introduction
Although Li2O–Al2O3–SiO2 low-expansion glass-ceramics having β-quartz s.s. or β-spodumene s.s. as main precipitated crystal were developed by Stookey more than 50 years ago, the research and development of the material is still active, particularly on their nucleation phenomena and improving their characteristics to apply them to various emerging applications (Bhattacharyya et al., 2010; Sakamoto and Yamamoto, 2010). The first developed Li2O–Al2O3–SiO2 glass-ceramics contained 2–20 mass% TiO2 as a nucleation agent, and their appearance was white and opaque. The ceramics were used for heat-resistant tableware (Stookey, 1960). The glass was crystallized homogeneously by heat treatment to induce the nucleation of Al2TiO5 as a precipitate (Doherty, 1967). Shortly after the work of Stookey, Tashiro and Wada (1963) found that ZrO2 is an effective nucleation agent, and transparent β-quartz s.s. glass-ceramics in Li2O–Al2O3–SiO2 system can be easily obtained by the addition of ZrO2 and TiO2 (Petzoldt, 1963; Beall, 1967; Müller, 1972; Tashiro et al., 1976). By improving the transparency and other characteristics by optimization of the composition and the conditions of the heat treatment for crystallization through many basic studies on nucleation and crystal growth (Nakagawa, 1972; Riello and Hopfe, 2001; Dymshits, 2005), the application of the transparent glass-ceramics has become widespread, such as in electronic and optical devices, production equipment, and home and cooking appliances.
However, the transparent glass-ceramics have an undesirable brown color owing to Fe ions as a contaminant, whereas the mother glass normally has a clear appearance. This coloration, which occurs through the crystallization process, causes two problems for industry. One is that it prevents further expansion of the market for fire-rated windows due to the mismatch in appearance with normal bluish windows of soda lime silicate glass. The other is that it is difficult to avoid the use of toxic arsenic oxide and/or antimony oxide as a fining agent because the non-toxic alternative of tin oxide cannot be used on account of its enhancement of the coloration (Nakane and Kawamoto, 2015). It is therefore necessary to determine the coloration mechanism to develop environmentally friendly glass-ceramics with high transparency.
Many investigations have been conducted on Fe coloration in various glass systems from the viewpoints of changes in the valence and coordination number and the formation of clusters (Traverse et al., 1992; Ehrt et al., 2001; Schutz et al., 2004). It is well known that optical absorption spectra of Fe ions can be changed and shifted easily by adjusting the composition and melting conditions because the d–d transition in the outermost electron orbital is sensitive to the surrounding environment. This means that there are various possible explanations for the coloration mechanism. Furthermore, in the case of glass-ceramics, the effects of changes in the phase and composition in the microstructure upon crystallization should be considered to elucidate the coloration-appearance phenomena through the crystallization process. Although many previous works have provided various insights, it is difficult to directly specify the coloration mechanism in glass-ceramics from the literature.
The objective of the present investigation is to elucidate the mechanism of the strong brown coloration caused by Fe ions in transparent β-quartz s.s. glass-ceramics in Li2O–Al2O3–SiO2 system. We determine the phase of the coloration and the key component responsible for the coloration. In addition, the relationship between the optical absorption and the valence and coordination state of Fe ions in the glass-ceramics is discussed on the basis of the results of Fe K-edge and Ti K-edge X-ray absorption near-edge structure (XANES) measurements and first-principles calculation.
Experimental
The specimens investigated in this study had a chemical composition (in mass percent) of 66SiO2, 23Al2O3, 4Li2O, 2TiO2, 2ZrO2, and small amounts of Na2O, K2O, MgO, BaO, and P2O5. Also, 0.03% of Fe2O3 was included as a contaminant. Mixture of raw materials was melted at 1,650°C for 20 h in air atmosphere, and then the melt were quenched with a metal roller. The obtained mother glass, which had a clear appearance, was crystallized in an electric furnace with a nucleation temperature of 780°C and a maximum temperature of 900°C. The heat-treatment times were 3 h at the nucleation stage and 1 h at the maximum temperature. After crystallization, the microstructure was observed using a scanning electron microscope to determine the crystallinity (SU8220, Hitachi). An X-ray diffractometer (RINT2000/PC, Rigaku) was used to analyze the crystalline phase. Optical absorption was measured by a double-beam photospectrometer (UV-3100PC, Shimadzu). XANES measurement at the Fe K-edge (from 7,110 to 7,200 eV) and Ti K-edge (from 4,950 to 5,050 eV) was performed at beamline 24 of SPring8 in Hyogo Prefecture, Japan.
X-ray energy was monochromatized using a four-crystal of Si(111) and Si(400) in an anti-parallel setting (Galoisy et al., 2001).
Results and Discussion
The broken line shown in Figure 1 is the absorption spectrum for the sample after crystallization. A wide range of absorption from 2 to 3.5 eV, resulting in the brown color, and a strong peak at about 4 eV in the UV region were observed. According to the results of XRD, the sample mainly consisted of β-quartz s.s. (JCPDS 01-073-2336) and remained glass matrix phase. To specify which phase exhibits optical absorption, a glass with a composition identical to that of the glass matrix was prepared, and its optical absorption was measured. The glass matrix was assumed to have the following properties: the crystallinity was 75%, analyzed from the total area and the grain size of the precipitated crystal determined by SEM observation. The crystal composition was Li2O–Al2O3–6SiO2, estimated from the (406) peak position in the XRD pattern (Iwatsuki et al., 1974). The ratio of precipitated TiO2 and ZrO2 was 60%, quoted from the literature (Riello and Hopfe, 2001). All the Fe2O3 was assumed to remain in the glass phase. Figure 1 shows the optical absorption spectrum of the glass with the matrix composition, which is almost identical to that of the glass-ceramics having a broad peak in the visible region and one sharp peak in the UV region, although there are slight differences in the peak position and shape, considered to be due to the deviation in the composition from the rough assumption. The absorption intensity in the visible region per Fe2O3 unit concentration was approximately 1.5 times larger than that of the glass-ceramics. This may indicate that Fe content in the glass matrix phase was overestimated since some of the Fe ions precipitated to the crystal phase. However, no other absorption peak was observed in the spectrum of the glass-ceramics; therefore, it is concluded that most of the Fe ions remained in the glass matrix phase, resulting in the brown color of the glass-ceramics.
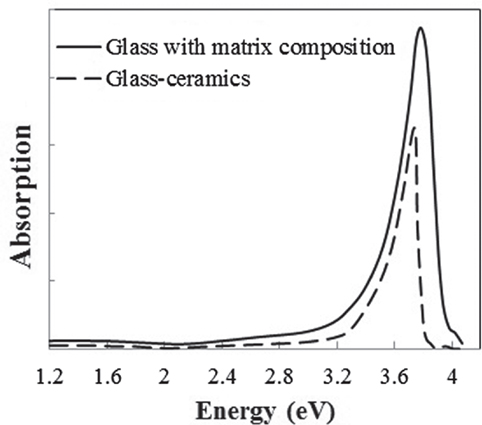
Figure 1. Absorption spectra of the glass-ceramics (broken line) and a glass with the matrix composition (solid line).
To determine which component in the glass matrix is responsible for the Fe ion coloration, the optical absorption spectra of various compositions, where the amount of only one component (Si, Al, Li, Ti, Zr, Na, K, or Ba) was changed from that in the above estimated matrix glass composition, were measured. Shown in Figure 2 are the appearances of the Ti-containing and Ti-free glasses. In the case of the Ti-free glass, the coloration disappeared, while all the other glasses containing Ti had a brown color. Figure 3 shows the optical absorption spectra of the Fe ions in the Ti-containing and Ti-free glasses, which were obtained by subtracting the Fe-free glass spectrum from the Fe-containing glass spectrum to eliminate the absorption from other components. The spectrum of the Ti-containing glass has a broad absorption peak in the visible region from approximately 2 to 4 eV, whereas no peak in the visible region can be observed for the Ti-free glass. The amounts of Fe and Ti ions in the glass matrix were estimated to increase from 0.03 to 0.1% in the form of Fe2O3 and from 2 to 3% in the form of TiO2 on the basis of the above. We speculate that the concentrations and the coexistence of Fe and Ti ions in the glass matrix phase may give the strong brown coloration in the glass-ceramics. Some previous works have mentioned a brown coloration due to the coexistence of Fe and Ti ions (Weyl, 1951). Weyl speculated that the coloration is caused by a change in the coordination number of Fe3+ from 6 to 4 due to the existence of Ti ions, but this was not sufficiently supported by experimental results. To determine the valence and coordination number in the Ti-containing and Ti-free glasses, XANES spectra at the Fe K-edge were measured. The other samples measured for reference were crystalline compounds of FeO and Fe2O3. Figure 4 shows the Fe–XANES spectra. The position of the XANES edge indicates the valence of the ions, in which the redox ratio is reflected in its position on the energy scale: 7,118 eV for Fe3+ in Fe2O3 and 7,114 eV for Fe2+ in FeO. The positions for both glasses were almost the same, 7,116 eV, which is almost halfway between those of the two minerals. The results clearly indicate that both Fe2+ and Fe3+ existed in the glasses, and that the ratio of the two ions did not change significantly with the existence or non-existence of Ti ions. Figure 5 shows the pre-edge peak of Fe ions in the glasses around 7,110–7,120 eV. The pre-edge peak originated from a forbidden electron transition, which is partly allowed by making a hybrid orbital with p-electron, is affected by the coordination number. The pre-edge was extracted by fitting two Gaussian functions to the contribution of the main edge to the pre-edge feature. The peaks for both samples are made up of at least two peaks. Wilke et al. (2001) reported that four-coordinated Fe2+ and Fe3+ have two and one contributions, and six-coordinated Fe2+ and Fe3+ have two and three contributions, respectively. However, in this case, the coordination numbers of Fe2+ and Fe3+ in the samples could not be determined because of the insufficient S/N ratio to conduct peak separation owing to the small amount of Fe ions in the glass. Comparing the spectra of the two samples, no significant differences in the height and shape were detected. Wilke et al. (2005) suggested that the peak intensity significantly changes with the coordination number, with the peak intensity of a four-coordinated Fe ion being more than four times larger than that of a six-coordinated Fe ion. Their work indicates that the coordination number of the Fe ions in our samples is not changed by the coexistence of Ti ions. The peak position was shifted slightly to the lower-energy side by less than 0.3 eV with the coexistence of Ti ions. This shift may be a consequence of a very small decrease in the valence (Wilke et al., 2005).
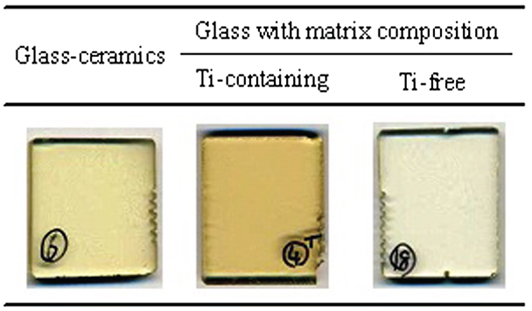
Figure 2. Appearance of the glass-ceramics and Ti-containing and Ti-free glasses with the matrix glass composition.
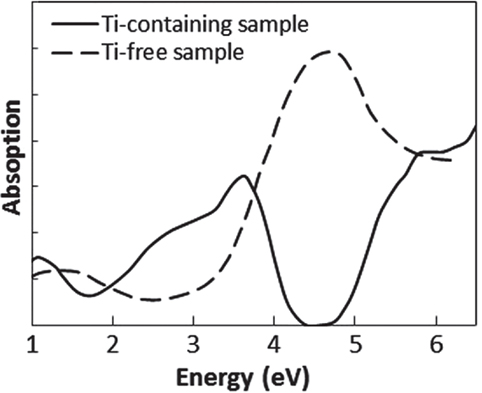
Figure 3. Absorption spectra of Fe ion in Ti-containing and Ti-free glasses. These spectra were obtained by subtracting the spectrum of Fe-free glass from that of Fe-containing glass.
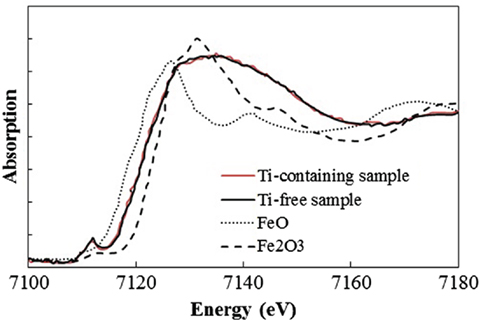
Figure 4. Fe K-edge X-ray absorption near-edge structure spectra of Ti-containing and Ti-free glasses.
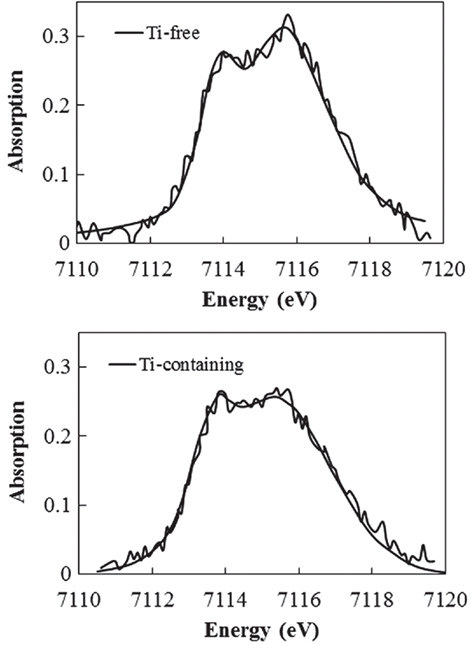
Figure 5. Fe K-edge X-ray absorption near-edge structure spectrum in pre-edge region of Ti-containing and Ti-free glasses.
In addition to the coloration from Fe ions, another past work showed that Ti3+–Ti4+ mixed complexes cause a brown coloration (Bausa et al., 1991). To determine the valence of the Ti ions in our Ti-containing glass, the XANES spectra were measured at the Ti K-edge. The other samples measured for reference were crystalline Ti2O3 and TiO2. Figure 6 shows the Ti–XANES spectra. The positions of the XANES edge indicating the valence are 4,972 eV for Ti3+ in Ti2O3 and 4,977 eV for Ti4+ in TiO2. The position in our glass is almost identical to that for Ti4+ in TiO2, where the existence of a certain amount of Ti3+ could not be confirmed. Similar results were reported for silicate glass systems prepared under normal melting conditions in a previous work (Schutz et al., 2004). In addition, we prepared Fe-free glass with the same composition to investigate the coloration by Ti ions, and it had a clear appearance without the strong brown coloration. These results indicate that Ti3+–Ti4+, which has an absorption band in the visible region, hardly exists in our glasses.
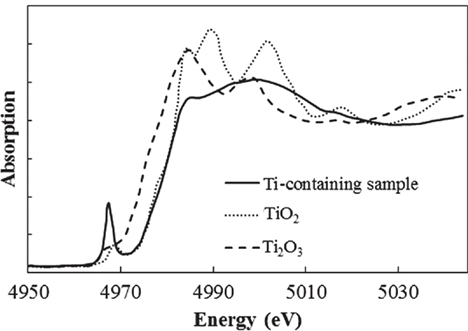
Figure 6. Ti K-edge X-ray absorption near-edge structure spectra of Ti-containing glass.
A first-principles calculation of the absorption of an Fe ion was conducted to clarify how Ti4+ ion affect the optical absorption of Fe ions in the case of no changes in the valence and coordination conditions. The absorption spectra for Fe ions were obtained by the DV-ME method, which can be used to calculate absorption spectra while considering the d–d transition (Ogasawara et al., 1998). Figure 7 shows the structure model used for the calculation, where a four-coordinated Fe3+ ion in the normal state in silicate glass (Schutz et al., 2004) is placed at the center of a SiO4 tetrahedron, in which the bonding length of Si–O is 0.16 nm, obtained from CR912569 crystal code, and the Fe–O length is 0.18 nm from CR910311. To evaluate the effect of Ti, one Si4+ is substituted by Ti4+ at the second-nearest position from the Fe ion. Figure 8 shows the calculated absorption spectra. Upon the substitution of the Ti ion, the absorption peak of the Fe ion from the d–d transition shifted to the lower-energy side that had qualitative agreement with the experimental results shown in Figure 3. This feature is caused by a change in the symmetry of the d-electron orbital in the Fe ion owing to the existence of a d-electron orbital in the Ti ion at the second-nearest position, even though the valence and coordination number are unchanged. Although this calculation does not have enough sufficient to give a definitive conclusion because of the oversimplified structure and components in the model, we tentatively conclude that the coloration is due to the formation of Fe–O–Ti in the glass matrix phase.
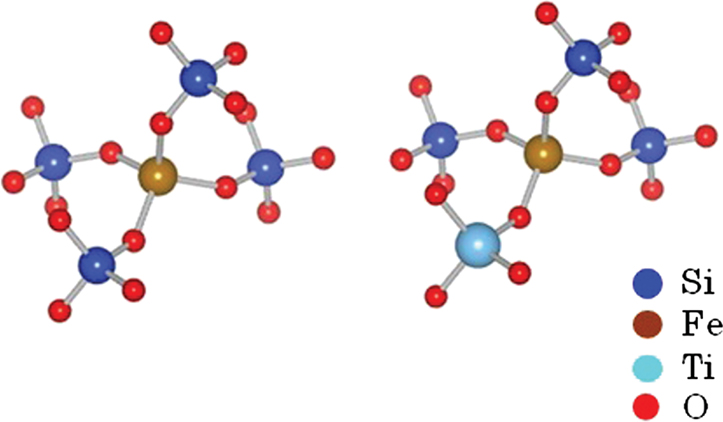
Figure 7. Structure model for calculation of Fe ion absorption spectra.
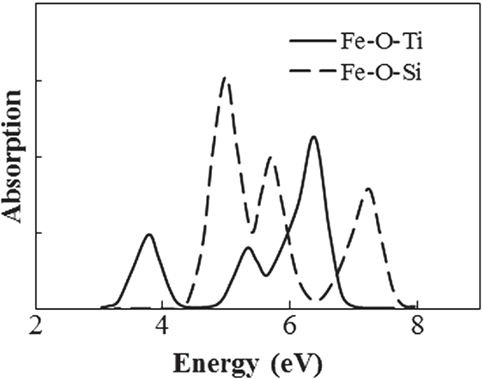
Figure 8. Calculated absorption spectra of Fe ion with and without Ti at second-nearest ion position.
Conclusion
In this present work, the mechanism of the brown coloration of transparent β-quartz s.s. glass-ceramics in Li2O–Al2O3–SiO2 system by Fe ions has been investigated. The preparation and evaluation of a glass with a composition identical to that of the glass matrix indicated that the concentration and coexistence of Fe and Ti ions in a glass matrix phase are the cause of the coloration. On the basis of this result, Nippon Electric Glass have developed and started to produce environmentally friendly glass-ceramics with high transparency (Nakane and Kawamoto, 2015). We hope that this finding will help understand the brown coloration in other glass-ceramics with TiO2 in present applications including dental materials like lithium disilicate glass-ceramics where appearance is important. This study highlights the importance of the characteristics of the glass matrix phase in the development and improvement of various glass-ceramics for future applications.
Author Contributions
SN: conception and design of the study, analysis and interpretation of data, collection and assembly of data, and drafting of the article. KK: conception and design of the study, analysis and interpretation of data, and collection and assembly of data.
Conflict of Interest Statement
The authors declare that the research was conducted in the absence of any commercial or financial relationships that could be construed as a potential conflict of interest.
The reviewer CR and handling editor declared their shared affiliation, and the handling editor states that the process nevertheless met the standards of a fair and objective review.
Acknowledgments
The authors thank Dr. Okajima of SAGA Light Source, Dr. Umesaki of Osaka University, and Dr. Matsui and Dr. Yokoyama of Hyogo Science and Technology Association for the measurement and analysis of the XANES spectra and for support in the first-principles calculation.
References
Bausa, L., Sole, J., Duran, A., and Navarro, J. (1991). Characterization of titanium induced optical absorption bands in phosphate glasses. J. Non Cryst. Solids 127, 267–272. doi: 10.1016/0022-3093(91)90479-P
Beall, G. (1967). Crystallization and chemical strength of stuffed β-quartz glass-ceramics. J. Am. Ceram. Soc. 50, 181–190. doi:10.1111/j.1151-2916.1967.tb15077.x
Bhattacharyya, S., Höche, T., Jinschek, J. R., Avramov, I., Wurth, R., Müller, M., et al. (2010). Direct evidence of Al-rich layers around nanosized ZrTiO4 in glass: putting the role of nucleation agents in perspective. Cryst. Growth Des. 10, 379–385. doi:10.1021/cg9009898
Doherty, P. D. (1967). Direct observation of the crystallization of Li2O-Al2O3-SiO2 glasses containing TiO2. J. Am. Ceram. Soc. 50, 77–80. doi:10.1111/j.1151-2916.1967.tb15043.x
Dymshits, O. (2005). Liquid phase separation and crystallization in CoO doped glasses of the Li2O-Al2O3-SiO2-TiO2 system. Phys. Chem. Glasses 46, 227–231.
Ehrt, D., Leister, M., and Matthai, A. (2001). Polyvalent elements iron, tin and titanium in silicate, phosphate and fluoride glasses and melts. Phys. Chem. Glasses 42, 231–239.
Galoisy, L., Calas, G., and Arrio, M. A. (2001). High-resolution XANES spectra of iron in minerals and glasses: structural information from the pre-edge region. Chem. Geol. 174, 307–319. doi:10.1016/S0009-2541(00)00322-3
Iwatsuki, M., Tanaka, M., and Fukasawa, T. (1974). Analysis of β-eucryptite solid solution in glass-ceramics by lattice constant method [in Japanese]. Nippon Kagaku Kaishi 1974, 505–510. doi:10.1246/nikkashi.1974.505
Müller, G. (1972). Zur Wirkungsweise von Gemischen oxidischer Keimbildner in GlasKeramiken des Hochquarz-Mischkristalltyps glass-ceramics catalyzed with zirconia. Glasstech. Ber. 45, 189–194.
Nakagawa, K. (1972). Metastable phase separation and crystallization of Li2O-Al2O3-SiO2 glasses. J. Non Cryst. Solids 7, 168–180. doi:10.1016/0022-3093(72)90287-6
Ogasawara, K., Ishii, T., Ito, Y., Ida, H., Tanaka, I., and Adachi, H. (1998). Analysis of covalent effects on the multiplet structure of ruby based on first-principles cluster calculations. Jpn. J. Appl. Phys. 37, 4590–4594. doi:10.1143/JJAP.37.4590
Petzoldt, J. (1963). Metastabile mischkristalle mit quarzstruktur im oxidsystem Li2O-MgO-ZnO-Al2O3-SiO2. Glasstech. Ber. 40, 385–396.
Riello, P., and Hopfe, S. (2001). Nucleation and crystallization behavior of glass-ceramic materials in the Li2O-Al2O3-SiO2 system of interest for their transparency properties. J. Non Cryst. Solids 288, 127–139. doi:10.1016/S0022-3093(01)00518-X
Sakamoto, S., and Yamamoto, S. (2010). Glass-ceramics: engineering principles and applications. Int. J. Appl. Glass Sci. 1, 237–247. doi:10.1111/j.2041-1294.2010.00027.x
Schutz, A., Ehrt, D., Dubiel, M., Yang, X., Mosei, B., and Eckert, H. (2004). A multi-method characterization of borosilicate glasses doped with 1 up to 10 mol% of Fe, Ti and Sb. Glass Sci. Technol. 77, 295–305.
Tashiro, M., and Wada, M. (1963). “Glass-ceramics catalyzed with zirconia,” in Proceedings of the 6th International Congress on Glass (Washington, DC), 18.
Traverse, J. P., Toganidis, T., and Ades, C. (1992). Spectrophotometric analysis of ferrous, ferric and total iron content in soda-lime silica glass. Glastech. Ber. 65, 201–206.
Weyl, W. (ed.). (1951). “The colours produced by titanium, tungsten and molybdenum,” in Coloured Glasses (Society of Glass Technology), 212–216.
Wilke, M., Farges, F., Petit, P. E., Brown, G. E., and Martin, F. (2001). Oxidation state and coordination of Fe in minerals: an Fe K-XANES spectroscopic study. Am. Mineral. 86, 714–730. doi:10.2138/am-2001-5-612
Keywords: Li2O–Al2O3–SiO2 glass-ceramics, iron ion, coloration mechanism, glass matrix phase, coordination state, X-ray absorption near-edge structure
Citation: Nakane S and Kawamoto K (2017) Coloration Mechanism of Fe Ions in β-Quartz s.s. Glass-Ceramics with TiO2 and ZrO2 as Nucleation Agents. Front. Mater. 4:7. doi: 10.3389/fmats.2017.00007
Received: 23 September 2016; Accepted: 08 March 2017;
Published: 03 April 2017
Edited by:
Wolfram Höland, Ivoclar Vivadent, LiechtensteinReviewed by:
Robert Graham Hill, Queen Mary University of London, UKChristian Ritzberger, Ivoclar Vivadent, Liechtenstein
Copyright: © 2017 Nakane and Kawamoto. This is an open-access article distributed under the terms of the Creative Commons Attribution License (CC BY). The use, distribution or reproduction in other forums is permitted, provided the original author(s) or licensor are credited and that the original publication in this journal is cited, in accordance with accepted academic practice. No use, distribution or reproduction is permitted which does not comply with these terms.
*Correspondence: Shingo Nakane, c25ha2FuZUBuZWcuY28uanA=