 Enrico Dall’Ara
 Marta Peña-Fernández
 Marco Palanca
 Mario Giorgi
 Luca Cristofolini
 Gianluca Tozzi
- 1Department of Oncology and Metabolism and INSIGNEO Institute for In Silico Medicine, University of Sheffield, Sheffield, United Kingdom
- 2Zeiss Global Centre, School of Engineering, University of Portsmouth, Portsmouth, United Kingdom
- 3School of Engineering and Architecture, Alma Mater Studiorum – Università di Bologna, Bologna, Italy
Accurate measurement of local strain in heterogeneous and anisotropic bone tissue is fundamental to understand the pathophysiology of musculoskeletal diseases, to evaluate the effect of interventions from preclinical studies, and to optimize the design and delivery of biomaterials. Digital volume correlation (DVC) can be used to measure the three-dimensional displacement and strain fields from micro-computed tomography (μCT) images of loaded specimens. However, this approach is affected by the quality of the input images, by the morphology and density of the tissue under investigation, by the correlation scheme, and by the operational parameters used in the computation. Therefore, for each application, the precision of the method should be evaluated. In this paper, we present the results collected from datasets analyzed in previous studies as well as new data from a recent experimental campaign for characterizing the relationship between the precision of two different DVC approaches and the spatial resolution of the outputs. Different bone structures scanned with laboratory source μCT or synchrotron light μCT (SRμCT) were processed in zero-strain tests to evaluate the precision of the DVC methods as a function of the subvolume size that ranged from 8 to 2,500 µm. The results confirmed that for every microstructure the precision of DVC improves for larger subvolume size, following power laws. However, for the first time, large differences in the precision of both local and global DVC approaches have been highlighted when SRμCT or in vivo μCT images were used instead of conventional ex vivo μCT. These findings suggest that in situ mechanical testing protocols applied in SRμCT facilities should be optimized to allow DVC analyses of localized strain measurements. Moreover, for in vivo μCT applications, DVC analyses should be performed only with relatively course spatial resolution for achieving a reasonable precision of the method. In conclusion, we have extensively shown that the precision of both tested DVC approaches is affected by different bone structures, different input image resolution, and different subvolume sizes. Before each specific application, DVC users should always apply a similar approach to find the best compromise between precision and spatial resolution of the measurements.
Introduction
This paper investigates comprehensively the precision of two digital volume correlation (DVC) approaches that can be used to measure the full three-dimensional (3D) displacement and strain fields of heterogeneous materials. While these approaches have huge potential for the assessment of complex material deformation and the validation of predictions of computational models, the fact that there is no other way of measuring such properties makes the validation of their output difficult. In this article, we will focus on a natural biomaterial: bone tissue. Even though previously other studies have investigated the precision of DVC methods, in this paper for the first time we report data obtained from five datasets acquired from different bone structures, scanned with three different techniques, and analyzed with two different DVC approaches, providing the most comprehensive dataset available in the literature to date.
Bone is a complex heterogeneous, anisotropic and hierarchical material for which the separation of scales does not hold (Viceconti, 2012). Therefore, its mechanical behavior (i.e., the load at which a certain bone fails or its toughness) depends on the intrinsic properties of the material that can be measured at the micro-scale (i.e., the heterogeneous distribution of extracellular matrix within the bone, its orientation, its mineralization, etc.), which depend on the properties of the material at the nano-scale (i.e., the molecular level, where collagen fibers and mineral grains are arranged). For example, to predict when and where a bone fracture will occur, the loading conditions on the whole bone (Cristofolini et al., 2010b; Dall’Ara et al., 2013b) as well as the density distribution and microarchitecture of the bone tissue (Bouxsein, 2003) need to be accounted for. Similarly, to evaluate the effect of mechanical stimuli (Birkhold et al., 2017), aging (Razi et al., 2015), musculoskeletal pathologies (e.g., osteoporosis imbalances the bone homeostasis toward reabsorption) (Badilatti et al., 2016), or interventions to treat them (Levchuk et al., 2014), the local mechanical properties on the different bone structural units (BSUs, i.e., trabeculae or osteons) need to be accurately quantified over the whole bone. Another example is the study of the effect of biomaterials such as injectable bone cements (Danesi et al., 2016) or systems of screws and plates on the bone mechanical properties and fracture healing (Widmer Soyka et al., 2013), where the constructs need to bio-integrate with the tissue and provide mechanical integrity to the organ. This problem can be tackled by the reliable estimation of the 3D internal full-field distribution of local properties, such as displacements and strain for the considered construct in different loading conditions. However, such measurements are not trivial because standard methods such as strain gauges (Cristofolini et al., 2010a, 2013), or digital image correlation (Gustafson et al., 2017) can only provide information on the external surface. Two options are left. The local properties can be computed with specimen-specific computational models, such as the finite element (FE) approach based on clinical (Dall’Ara et al., 2012, 2013a) or preclinical high-resolution (Levchuk et al., 2014; Lu et al., 2017) images. Nevertheless, it should be noted that the models have to be rigorously validated (Anderson et al., 2007; Jones and Wilcox, 2008) for prediction of both apparent (Schileo et al., 2008; Wolfram et al., 2010; Zysset et al., 2013; Schwiedrzik et al., 2016) and local (Zauel et al., 2006; Chen et al., 2017; Costa et al., 2017; Gustafson et al., 2017) properties before their application.
The only method that currently allows for 3D measurements within the bone structure is DVC combined with in situ mechanical testing within a micro-computed tomography (μCT) imaging system. This method, which is based on the deformable registration (i.e., allowing the possibility of the object to deform between the two scans) of high-resolution images of the undeformed and deformed structure, has been used to study the deformation in biological tissues and biomaterials (Bay et al., 1999; Liu and Morgan, 2007; Hussein et al., 2012; Madi et al., 2013; Gillard et al., 2014; Danesi et al., 2016) and to validate FE models based on μCT (Zauel et al., 2006; Chen et al., 2017; Costa et al., 2017) or clinical CT (Jackman et al., 2016; Palanca et al., 2017b) images. For extensive review of the literature about the applications of DVC for studying bone deformation, please refer to two recent reviews (Roberts et al., 2014; Grassi et al., 2016). Nevertheless, the accuracy and precision of the DVC in measuring the displacements depend on the quality of the input images and such errors in displacements can be amplified for the strain field, once differentiated. DVC algorithms showed errors in the displacement measurements of a fraction of voxel (precision of 0.0004–0.115 voxels) (Zauel et al., 2006; Liu and Morgan, 2007; Dall’Ara et al., 2014; Roberts et al., 2014). Nevertheless, a compromise must always be accepted between the precision of the DVC measurements and the measurement spatial resolution. In fact, the larger is the subvolume size (in local DVC) or the nodal spacing (NS, in global DVC), which represents the distance between two independent measurements of displacement, the lower are the random errors associated with the measurement (Dall’Ara et al., 2014; Palanca et al., 2015). There is no single optimal solution for all cases, but an adaptation of the method for different bone structures and image resolutions is required. Moreover, considering that there is no other measurement technique that allows evaluating the 3D bone deformations within heterogeneous structures, the precision of the method is typically estimated by registering repeated scans of the same undeformed specimen (“zero-strain” condition). Other approaches have been identified to test the precision of the method in measuring non-zero deformation fields virtually imposed to the acquired images (Christen et al., 2012). However, such methods do not account for the image noise and tend to underestimate the uncertainties. Some recent studies have estimated the precision of the DVC algorithms on repeated scans of loaded structures or in relation to virtual homogeneous deformations applied to repeated scans (Palanca et al., 2017a). However, considering the novelty of these approaches, only the precision of one DVC algorithm has been assessed on one dataset, which is not enough to generalize the findings, yet.
During the last 4 years, our groups have reported the results from zero-strain tests performed on several bone structures acquired with different μCT techniques. The uncertainties of a global (BoneDVC, formally referred to as “ShIRT-FE”) and of a commercial local (DaVis, LaVision, Germany) DVC method were therefore evaluated for several bone structures, at different dimensional levels. This paper is written for potential users of DVC and of DVC data, with the aim of providing an overview of the magnitude of the errors and of their trend, for different applications. To comprehensively present the precision of two DVC approaches, the results obtained in previous studies on different bone structures and at different dimensional levels were integrated with new results obtained from high-resolution images of trabecular bone with and without biomaterials and from in vivo and ex vivo analyses of the mouse tibia.
Materials and Methods
In this article, data collected in several previous studies have been integrated to new datasets to provide a comprehensive understanding of the relationship between the precision of two DVC approaches and their spatial resolution for different microstructure, and for different quality of the input images. In particular, the previously examined datasets consist in results from trabecular and cortical bone scanned with μCT (Dall’Ara et al., 2014; Palanca et al., 2015) and with synchrotron light μCT (SRμCT) (Palanca et al., 2017a), from vertebral bodies with and without injected biomaterial scanned with μCT (Palanca et al., 2016; Tozzi et al., 2017), and mice tibiae scanned with SRμCT (Palanca et al., 2017a). Moreover, two new datasets from SRμCT scans of trabecular bone and biomaterials and from in vivo and ex vivo μCT scans of the mouse tibia were included in this study. More details for each study are reported in Table 1, Figure 1 and below.
Table 1. Summary of the information about the studies, the results of which are reported in this manuscript for different dimensional levels, origins of the bones, volume of interest (VOI), scanning condition, and the total number of volumes of interest (VOIs) where the measurements were performed (Nr VOIs).
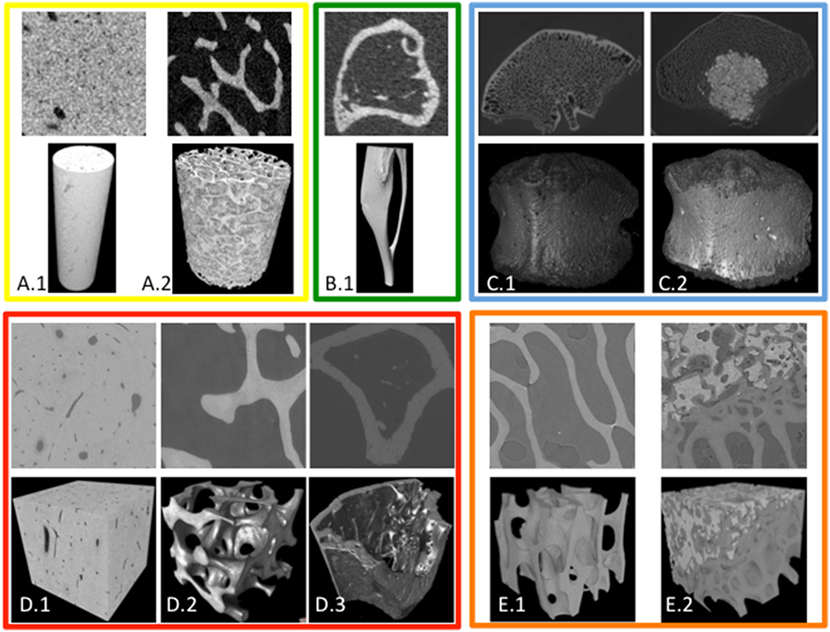
Figure 1. Overview of the different image types used for the deformable registrations with BoneDVC and/or DaVis-DC. For each dataset, a typical cross-section (top) and a 3D image reconstruction (bottom) are reported. Dataset include cortical (A.1) and trabecular (A.2) bone scanned with laboratory micro-computed tomography (μCT) at 10 µm voxel size (dimension of the 2D images: 1.79 mm × 1.79 mm); mouse tibiae (B.1) scanned with in vivo μCT at 10.4 µm voxel size (dimension of the 2D image: 4.11 mm × 4.11 mm); porcine vertebrae with (C.2) or without (C.1) biomaterial scanned with μCT at 39 µm voxel size (dimension of the 2D images: 27.61 mm × 19.5 mm); cortical bone (D.1), trabecular bone (D.2), and proximal mouse tibia (D.3) scanned with synchrotron light μCT (SRμCT) at 1.6 µm voxel size (dimension of the 2D images: 1.6 mm × 1.6 mm); ovine trabecular bone with (E.2) and without (E.1) biomaterial scanned with SRμCT at 2.6 µm voxel size (dimension of the 2D images: 2.60 mm × 2.60 mm).
In these studies, the precision of the DVC method was evaluated in a particular condition of zero-strain, by registering repeated scans of the same object. The parameters of the scanning procedures are reported in Table 2. For the different datasets a global or a local (or both), DVC approaches were used to estimate the bone strain and the precision of the methods are reported in this study in function of the chosen subvolume size. For a more detailed description of the methods and of the results for each study (effect of image processing, results on displacement, etc.), the reader should refer to the individual publications reported in Table 1.
Table 2. Summary of the scanning and DVC parameters used in the different studies, the results of which are reported in this article.
In the following sub-chapters, the two DVC algorithms used in these studies will be presented, together with a brief description of the samples and scanning procedures.
DVC Approaches and Estimation of the Precision
Both DVC approaches used in the studies presented in this article are based on a similar principle: two high-resolution 3D input images of the same object in undeformed and deformed configurations are imported and the algorithms compute a field of displacements, which minimizes the differences between the deformed images and the registered images (undeformed images after the application of the field of displacement). The field of displacement is then differentiated into a field of strain. The main features of the two methods are briefly reported hereafter.
BoneDVC (Previously Known As ShIRT-FE)
This global DVC (Dall’Ara et al., 2014) consists in computing the displacement map by using the Sheffield Image Registration Toolkit (ShIRT) (Barber and Hose, 2005; Barber et al., 2007; Khodabakhshi et al., 2013). With BoneDVC, a grid with selectable nodal spacing (NS, or subvolume, or grid size) is superimposed to the images to be registered. The deformable registration equations are solved at the nodes of the grid to evaluate the displacement field. The procedure consists in finding the displacement functions u(x, y, z), v(x, y, z), and w(x, y, z) that transforms the reference image f(x, y, z) into the deformed image m(x′ y′, z′). An additional intensity displacement function c(x, y, z) is included to account for potential changes in the gray levels. For small displacement, the following equation should be solved for each voxel:
However, this problem is underdetermined and the algorithm solves the equations only in the nodes of the cubic grid superimposed to the images. The displacements are interpolated with a tri-linear function between the nodes. Therefore, the problem is solving the following system of equations for the coefficients a of the displacement functions:
To provide a smooth solution, the algorithm includes a term based on the Laplacian operator L, and the coefficient λ that weights the relative importance of smoothing:
where T is a K × N matrix (K number of voxels in the image, and N number of nodes in the grid). T is derived from integrals of the image gradients multiplied by the basis functions of the displacements. For large displacements, the method can iterate to a correct solution. The grid is then converted into a mesh of 8-noded hexahedrons and the displacements are then imported into a FE software package (Ansys Mechanical APDL v.14.0, ANSYS, Inc., Canonsburg, PA, USA) to differentiate them into a strain field and to post-process the data efficiently.
DaVis-DC
This local approach is implemented in a commercial package (DaVis LaVision, Germany) that uses a direct correlation (DC) function to match the subvolumes (hereby referred to as DaVis-DC). With DaVis-DC, the 3D images are divided into smaller subvolumes, which are then independently correlated as a discrete function of gray levels. A piece-wise linear shape function for the reference-deformed mapping and a normalized cross-correlation function, rDaVis, based on gray level gaps are used:
where X (x, y, z) and X*(x, y, z) refer to coordinates (in voxels) of a same point in the reference state and in the deformed state; f and g are the gray levels, respectively, in the reference and deformed images. A third-order spline interpolation is used. This process provides a full 3D field of displacement vectors, which describes the mapping from reference to deformed state. The displacement field is then converted into strain field using the centered finite differences scheme.
The precision of the DVC methods for displacement measurements was quantified by reporting the standard deviation of displacement along x, y, and z directions. As it was found that in a first approximation the errors affecting strains were isotropic (Palanca et al., 2015), the precision of the DVC methods was quantified by reporting the standard deviation of the strain error (SDER), computed as the standard deviation of the mean of the components of strain computed for each measurement point [referred as “precision” in Liu and Morgan (2007)]. In case more specimens were analyzed for each bone type, median and standard deviation of the SDER were computed for each sample. In case more specimens were analyzed for each bone type, median of the measurement was computed for each sample.
Datasets
μCT Scans of Bovine Trabecular and Cortical Bone (Dall’Ara et al., 2014; Palanca et al., 2015)
A trabecular bone (8 mm in diameter, 12 mm in length) and a cortical bone (3 mm in diameter and 20 mm in length) cylinders were extracted from the femur of a bovine killed for alimentary purposes. In this case, ethics approval was not required as per institutional and national guidelines. Each specimen was scanned twice in saline solution with a μCT system (Skyscan 1172, Bruker, voltage: 59 kV for trabecular bone and 70 kV for cortical bone; power: 10 W; voxel size: 9.96 µm; exposure time: 1,180 ms; rotation step: 0.71; total rotation: 180°; images averages ×2; beam hardening filter: 1 mm Aluminum; height scan: 9.32 mm). After image reconstruction, a parallelepiped with square cross-section of 180 × 180 × 932 voxels was cropped in the central portion of each sample. In the trabecular specimen also a larger region 430 × 430 × 430 voxels was cropped for tests with larger subvolumes. Deformable registrations were run for different subvolume sizes with BoneDVC (5, 10, 15, 20, 25, 30, 35, 40, 45, 50 voxels) and with DaVis-DC (8, 10, 16, 20, 24, 28, 34, 40, 44, 52 voxels).
μCT Scans of Natural and Augmented Porcine Vertebral Bodies (Palanca et al., 2016; Tozzi et al., 2017)
Ten thoracic vertebral bodies were extracted from spines of pigs killed for alimentary purposes. In this case, ethics approval was not required as per institutional and national guidelines. A sample of five vertebrae was addressed for augmentation (referred as “augmented”), with acrylic vertebroplasty cement (Mendec Spine, Tecres Spa, Italy). The other five vertebrae were left untreated (referred as “natural”). The samples were scanned twice in saline solution, inside the chamber of a loading device with a μCT system (XTH225, Nikon Metrology, voltage: 88 kV; power: 10 W; voxel size: 39 µm; exposure time: 2,000 ms; rotation step: 0.23°; total rotation: 360°). Deformable registrations were run for different subvolume sizes (16, 32, 48, 64, 80, 96, 112, 128 voxels) with BoneDVC and DaVis-DC on a parallelepiped of 300 × 300 × 432 voxels cropped inside each vertebral body with and without the augmentation (VOI-1). Moreover, the image of each augmented specimen was cropped in other four VOIs of 152 × 152 × 432 voxels including fully cement-augmented trabecular bone (VOI-2); interface between augmented and non-augmented trabecular bone (VOI-3); trabecular bone (VOI-4), and regions containing both trabecular and cortical bone, with surrounding saline solution (VOI-5). The smaller VOIs were analyzed with BoneDVC and DaVis-DC with subvolume sizes of 16 and 48 voxels.
μCT Scans of Mice Tibiae In Vivo and Ex Vivo (This Study)
Eleven mouse (C57BL/6J, female, 22 weeks old) tibiae were scanned in vivo (seven) or ex vivo (four). The images from the seven tibiae scanned in vivo were collected from a previous study where mice were anesthetized during scanning (Lu et al., 2015). All procedures were approved by the local Research Ethics Committee of the University of Sheffield (Sheffield, UK). The four ex vivo specimens were dissected from mice of same strain, gender, and age, were isolated from the soft tissues, dehydrated and embedded in acrylic resin. Each tibia was scanned twice by using an in vivo μCT system (vivaCT80, Scanco Medical, Bruettisellen, Switzerland) with the following scanning parameters: voltage of 55 keV, intensity of 145 µA, integration time of 200 ms, nominal isotropic image voxel size of 10.4 µm for a total scanning time of approximately 40 min per scan. Beam hardening artifacts were reduced by applying a third-order polynomial correction algorithm provided by the manufacturer based on scans of 1,200 mgHA/cm3 wedge phantom. Deformable registrations were run for different subvolume sizes with BoneDVC (10, 20, 30, 40, 50, 60, 70, 80, 90, 100, 110, 120, 130, 140, 150 voxels).
Synchrotron μCT Scans of Bovine Cortical and Trabecular Bone and of Proximal Mice Tibiae (Palanca et al., 2017a)
Three tissue types were studied: cortical bones (three cylindrical specimens, 3 mm in diameter, 12 mm in length), trabecular bones cylinders (four cylindrical specimens, 8 mm in diameter, 12 mm in length) both obtained from the femur of a bovine killed for alimentary purposes; and four paired tibiae obtained from two 14-week-old female C57BL/6J mice (Harlan Laboratories, Bicester, UK). All procedures were approved by the local Research Ethics Committee of the University of Sheffield (Sheffield, UK). Each specimen was embedded in acrylic resin and was scanned twice at the Diamond-Manchester Imaging Beamline l13-2 of Diamond Light Source, UK. A filtered (950 µm C, 2 mm Al, 20 µm Ni) polychromatic “pink” beam (5–35 keV) of parallel geometry was used and the scanning parameters were: voxel size 1.6 µm; exposure time 53 ms; rotation step 0.045°; total rotation 180°. Two cubic volumes of interest (VOIs) with side length of 1,000 voxels were cropped from the middle of each cortical and trabecular specimen, and cubic VOIs were selected in the metaphysis of each murine tibia. The VOIs of the trabecular bone and of the mouse tibiae were masked, to evaluate the uncertainties only on bone tissues. Deformed registrations were run with BoneDVC with different subvolume sizes (10, 15, 20, 25, 50, 75, 100, 150, 200, 250, 300 voxels).
Synchrotron μCT Scans of Ovine Trabecular Bone with and without Biomaterials (This Study)
Four bone-biomaterial cylindrical specimens and two trabecular bone cylindrical specimen (4 mm in diameter and 8 mm in length) were extracted from ovine femoral condyles, where biomaterials were implanted after surgically creation of bone defects (Coathup et al., 2016). All procedures were carried out following Ethics approval granted by the Royal Veterinary College and in compliance with the United Kingdom Home Office regulations (Animal Scientific Procedures Act [1986]). Samples were placed in a loading stage (CT5000, Deben Ltd., UK) and immersed in saline solution. Each specimen was scanned twice at the imaging beamline l13-2 of Diamond Light Source, UK. A filtered (950 µm C, 2 mm Al, 60 µm steel) polychromatic “pink” beam (5–35 keV, weighted mean photon energy: 28.6 keV) of parallel geometry was used. Scanning parameters were chosen as following: voxel size: 2.6 µm; exposure time: 64 ms; rotation step: 0.1°; total rotation: 180°. One cubic VOI (1,000 voxels side length) was cropped from the middle of each specimen. To evaluate the uncertainties only in the mineralized tissue, masks were created by applying a non-local means filter (Buades et al., 2011), followed by image segmentation based on Huang’s method (Huang and Wang, 1995). The masks were used to create the masked images (original gray levels corresponding to the bone voxels and zero values corresponding to the marrow), on which the deformable registrations (DaVis-DC) were run for different subvolume sizes (16, 32, 48, 64, 80, 96, 112 voxels).
Results
The precisions of the DVC methods as a function of the used subvolume size are summarized in Figure 2. As expected for all bone types, the grid size and the SDER were highly correlated through power laws, for both DVC approaches (0.858 < R2 < 0.993, Table 3).
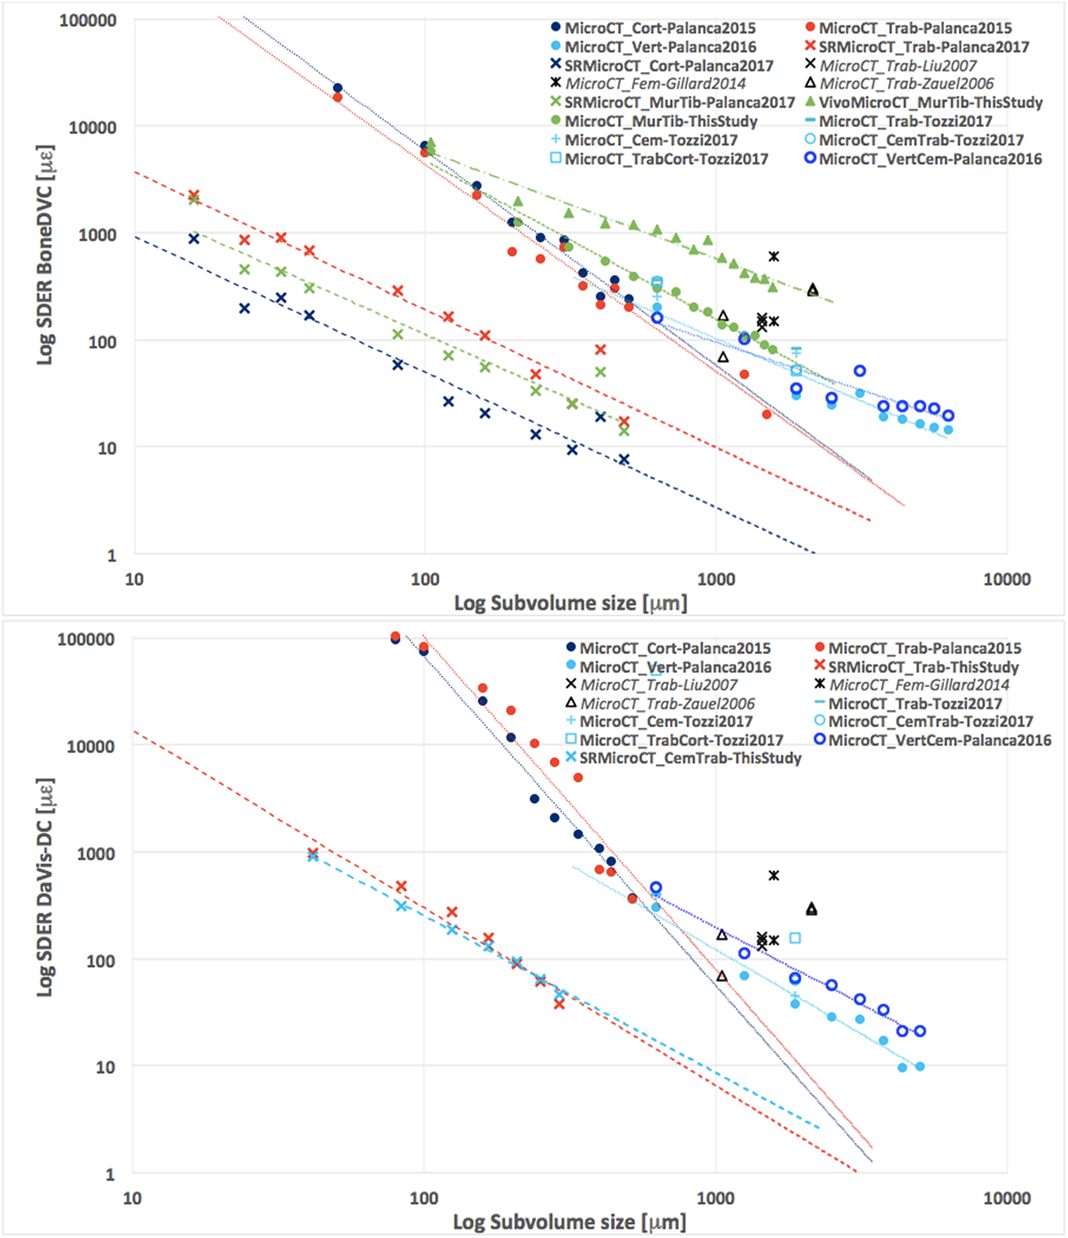
Figure 2. Relationship in logarithmic scale between the standard deviation of the error (SDER; median values in case more specimens were analyzed per group) and the subvolume size for both global (BoneDVC, top) and local (DaVis-DC, bottom) DVC approaches. Dataset include cortical (MicroCT_Cort-Palanca2015) and trabecular (MicroCT_Trab-Palanca2015) bone scanned with laboratory micro-computed tomography (μCT) at 10 µm voxel size; mouse tibiae scanned with in vivo (VivoMicroCT_MurTib-ThisStudy) and ex vivo (MicroCT_MurTib-ThisStudy) settings with a μCT at 10.4 µm voxel size; porcine vertebrae with (MicroCT_VertCem-Palanca2016) or without (MicroCT_Vert-Palanca2016) biomaterial scanned with μCT at 39 µm voxel size; portions of trabecular (MicroCT_Trab-Tozzi2017), cement (MicroCT_Cem-Tozzi2017), trabecular and cement (MicroCT_CemTrab-Tozzi2017), and trabecular and cortical bone (MicroCT_TrabCort-Tozzi2017) extracted from augmented porcine vertebrae scanned with μCT at 39 µm voxel size; cortical (SRmicroCT_Cort-Palanca2017), trabecular (SRmicroCT_Trab-Palanca2017) and mouse tibia (SRmicroCT_MurTib-Palanca2017) scanned with synchrotron light μCT (SRμCT) at 1.6 µm voxel size; ovine trabecular bone with (SRmicroCT_CemTrab-ThisStudy) and without (SRmicroCT_Trab-ThisStudy) scanned with SRμCT at 2.6 µm voxel size. In order to do not overcomplicate the figure, the error bars were not reported and the interested reader should refer to the specific publications for this information. Data extracted form the literature have been also added for both graphs (MicroCT_Trab-Liu2007 for data obtained from bovine distal femur, bovine proximal tibia, rabbit distal femur, rabbit proximal tibia, rabbit vertebral body, and human vertebral body, all acquired with μCT at 36 µm voxel size, MicroCT_Trab-Zauel2006 for data obtained from human femoral and vertebral trabecular bone acquired with μCT at 35 µm voxel size; MicroCT_Fem-Gillard2014 for data obtained from porcine femoral trabecular bone acquired with μCT at 24.6 µm).
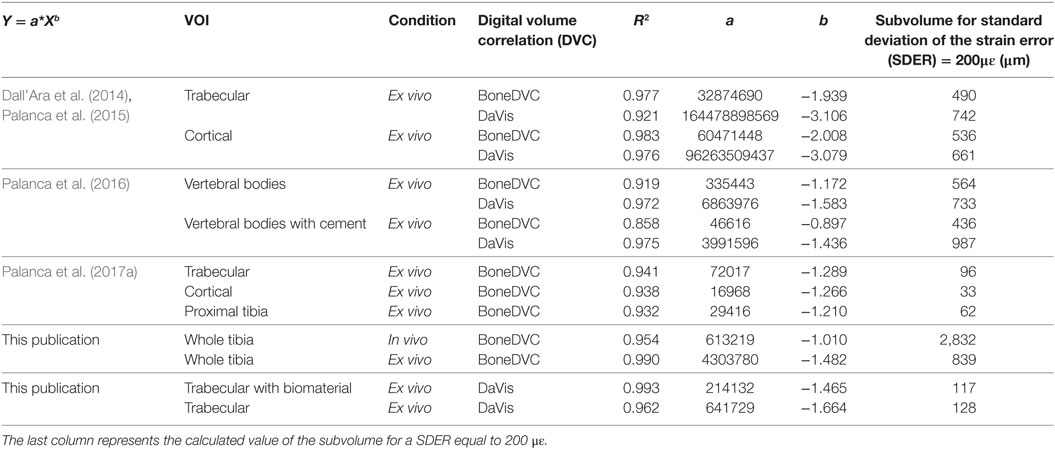
Table 3. Coefficients of power law regressions (a, b) and the coefficient of determination (R2) between the standard deviation of the error (SDER) and the “subvolume” size for the results obtained in the different studies reported in this manuscript.
As expected, the images with higher quality, obtained with SRμCT, provided the best results, followed by those obtained from ex vivo μCT and then those obtained from in vivo μCT. Similar trends were found for the two DVC algorithms. These regressions can be used to choose the best compromise between the spatial resolution of the measured displacement and the resulting precision in measuring strains (Table 3). In particular, one may fix a level of acceptable strain, and consequently identify the corresponding spatial resolution. If a threshold of 200 με is accepted (one order of magnitude lower than typical strains in bone subjected to physiological loading conditions), the corresponding spatial resolution can be found when images from SRμCT are used (at 1.6 µm for images used for BoneDVC and at 2.6 µm for images used for DaVis-DC) for cortical bone (33 µm for BoneDVC), for trabecular bone (96 µm for BoneDVC, 128 µm for DaVis-DC), as well as for trabecular bone with biomaterials (117 µm for DaVis-DC). Spatial resolutions that would allow the same errors on strains for measurements performed by using laboratory μCT images at the tissue level (voxel size between 10 and 39 µm) were in the range 490–564 µm for BoneDVC and 661–987 µm for DaVis-DC. The worst spatial resolution corresponding to the same errors of 200 με was found for measurements based on in vivo and ex vivo μCT images of the mouse tibiae (2,832 and 839 µm, respectively, both obtained with BoneDVC).
Only SRμCT-based DVC reached reasonable uncertainties for measurements performed the tissue level [for several BSUs, as trabeculae or osteons; spatial resolution for DVC displacement and strain measurements of 300 µm (Pfeiffer, 1998); from 9 to 46 με, Table 4] or at the single BSU level (spatial resolution for DVC displacement and strain measurements below 150 µm; from 21 to 156 με, Table 4).
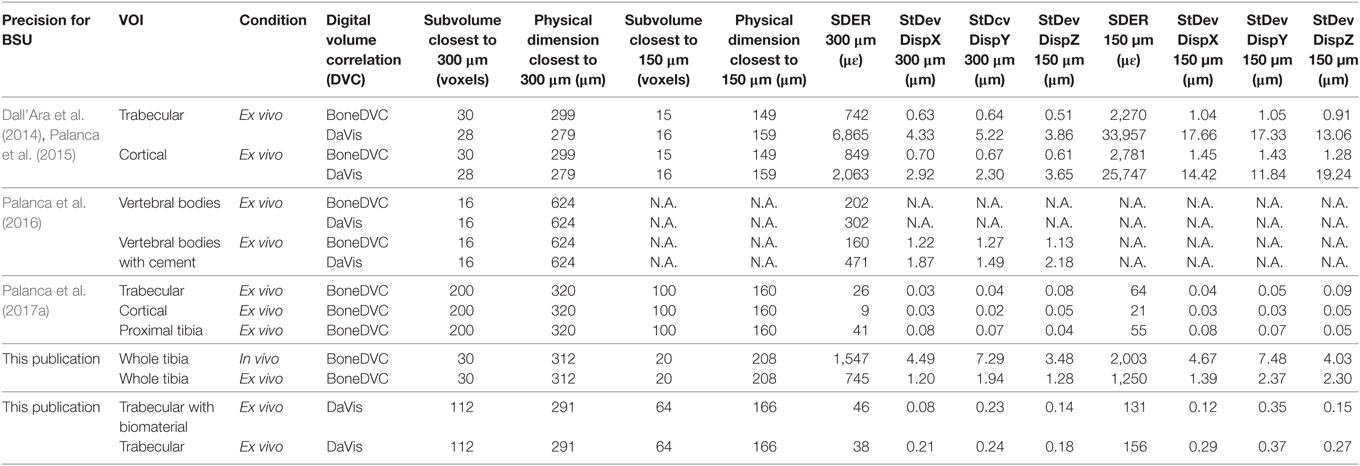
Table 4. Overview of the standard deviation of the error (SDER) for the strain measurements and standard deviation for the different components of the displacement (StDev DispX, StDev DispY, and StDev DispZ) found in the different studies for a subvolume size that could be used for measurements at the tissue level (~300 μm) and at the bone structural unit (BSU) level (~150 μm).
The computation time varied for the different voxel sizes, volumes of interest (VOIs), DVC approach, and post-processing method used, as reported in Table 5.
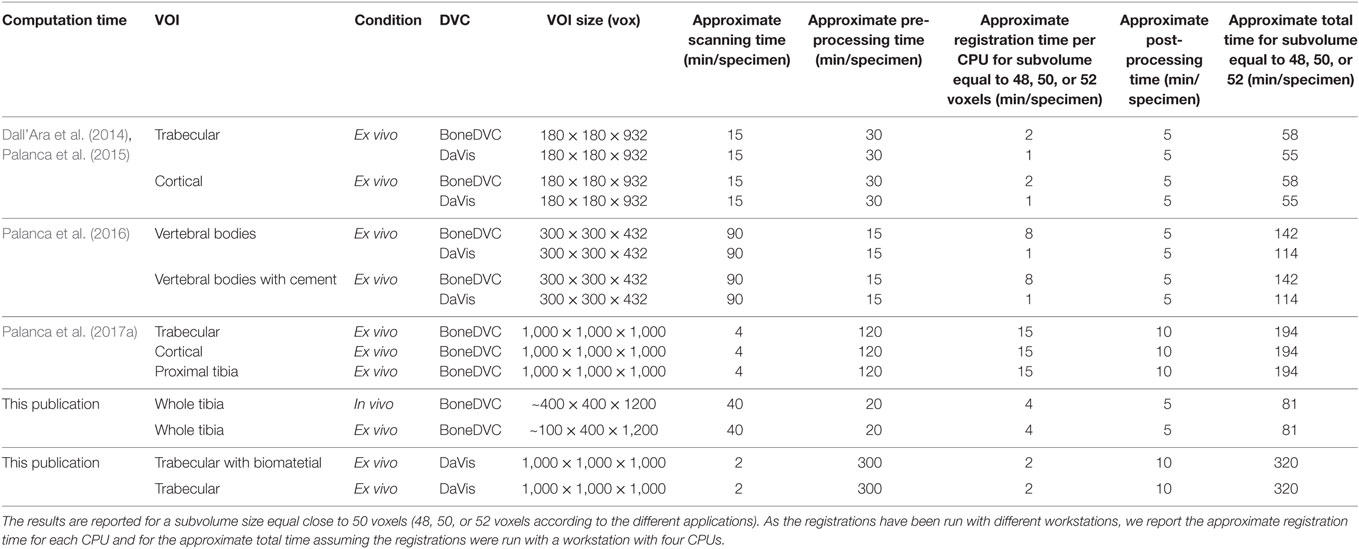
Table 5. Estimated time required for the different applications split for the different parts of the procedure, from the scanning to the image pre-processing, digital volume correlation (DVC) running time, and post-processing of the results.
Discussion
The goal of this study was to compare the precision of two DVC algorithms in different applications for measuring bone strains at different dimensional levels and based on images acquired with different techniques and modalities. While in the last decade several studies reported strain distributions on non-homogeneous bone specimens obtained with DVC, this is the first article that provides a comprehensive understanding about how the precision of these methods (evaluated in a simple case of full-field zero-strain on repeated scans) is affected by the different tissue structures, by the input images, and by the algorithms.
The results from the different studies confirmed that the precision in the measurements of displacement of the two tested DVC approaches are in the order of a fraction of voxel, with smaller errors for the global DVC compared to the local one (Table 4). As expected, for all the different studies that were compared in this article, strong correlations were found between the uncertainties of the DVC-computed strains (expressed as SDER), and the spatial distance between two independent measurements. This result confirms those obtained from previous studies (Roberts et al., 2014) and extend it for different bone and bone-biomaterial structures. The equations describing such trends (Table 3) provide a way to choose the input parameters of the DVC according to the different applications. In particular, the elastic registrations based on higher resolution images (~1.6 μm voxel size, obtained with SRμCT) allowed achieving uncertainties of 200 με for measurement spatial resolution of 30–100 µm for all the types of microstructure considered (bovine cortical bone, bovine trabecular bone, and mouse metaphysis), allowing strain measurements within BSUs. Conversely, μCT-based DVC measurements (~10 μm voxel size) showed the same strain errors (200 με) only for larger grid size, in the order of 400–600 µm, allowing for 3D measurements performed on subvolumes including more BSUs, but still enabling to detect strain gradients over the specimens. Such measurements can be used to classify regions at high or low localized strains as for example the beginning of failure in trabecular or cortical bone. It should be noted though that the strain values in this case refer to subvolumes containing both the mineralized tissue and the marrow. When DVC is applied to μCT images acquired with lower resolution (~40 μm voxel size), reliable information about the heterogeneous strain field can be obtained only with larger subvolumes, up to 1,000 µm, which contain several BSUs. As expected, the worst case scenario among those tested was related to the in vivo μCT images of the mouse tibia (~10.4 μm voxel size), where the subvolume size required to obtain the same strain errors (200 με) was as large as ~2,800 μm, which is even larger than the typical diameter of the bone (~1,000 μm). It should be noted that this case represents a very extreme case where the measurement resolution is affected by several artifacts (i.e., moving artifacts and lower contrast due to the lower energy), which may considerably affect the noise in the images and disturb the deformable registration. Therefore, with the current settings, it is hard to think of using such a methodology in vivo, unless large deformations are applied and larger errors can be accepted (e.g., hundreds of με). This would be feasible, for example, when strain measurements are used to classify between bone strained below or above yield [7,000–10,000με (Bayraktar et al., 2004)].
The results summarized here were obtained from the best conditions studied on the different applications. For example, we noted that masking the bone tissue in non-homogeneous structures such as the trabecular bone and mouse tibia improved the precision of the DVC only if based on high-resolution SRμCT (Palanca et al., 2017a), but not on standard laboratory μCT images (Dall’Ara et al., 2014). Furthermore, for the local DVC approach, it is clear that a metric based on DC should be preferred to analyses performed after Fourier Transformation (Palanca et al., 2015). Then, the best settings were used, similar trends were found for both DVC algorithms, with the global DVC performing better in the experiments where both algorithms were tested on the same specimens for the selected dimensional level (Tables 3 and 4), but with slightly higher computational cost to run the registration (Table 5).
Both DVC approaches summarized in this paper outperform those reported in the literature for similar structures in terms of precision in the strain measurements [trabecular bone (Bay et al., 1999; Liu and Morgan, 2007; Gillard et al., 2014) and trabecular bone-cement (Zhu et al., 2016) specimens], with the exception of Zauel et al. (2006), where similar errors were found but only after substantial smoothing of the displacement field, which may hide peaks of strain in applications under realistic loading conditions.
The DVC outputs can also be used to quantitatively validate the field of local properties identified by computational models such as the FE method (Zauel et al., 2006). The typical scheme is to acquire two images of the undeformed and deformed bone structure, to apply the DVC to measure the displacement and strain fields, to generate the FE models from the underformed configuration, to impose the DVC-measured displacement field at the boundary of the FE model (Zauel et al., 2006), and to compare the experimental and computational outputs in the middle portion of the specimen (far enough from the conditions imposed at the boundary). This approach has been used to evaluate the accuracy of the models in predicting the field of displacements for trabecular bone specimens (Zauel et al., 2006; Chen et al., 2017) and vertebral bodies (Jackman et al., 2016; Costa et al., 2017). The good precision of the DVC in measuring the field of displacements (Table 4) allows in most cases to test the ability of the models in predicting the local displacements. However, it should be noted that the limited precision of DVC in measuring the strain field with a spatial resolution of a few tens of μm [typical size of the finite elements at the tissue level (van Rietbergen et al., 1995)], makes it impossible to accurately validate the FE predictions of strain. We have shown that this could be potentially done if high-resolution SRμCT images were used (Figure 2; Table 4) but unfortunately for such application the challenge in performing repeated imaging of the specimens under loading without inducing structural damage to the irradiated tissue remains (Barth et al., 2011).
This method for evaluating and comparing the precision of the two DVC approaches has three main limitations: (1) the precision is usually evaluated on different specimens, (2) the precision is evaluated in case of very simple strain scenario (zero-strain), and (3) different parameters for the two DVC algorithms (optimization metric, interpolation of displacements, differentiation method) were used. To overcome to the first limitation, we suggest to publish in the public domain the images used to test the DVC precision in the different publications. We started this process in previous studies (Palanca et al., 2016; Tozzi et al., 2017; Palanca et al., 2017a) and we suggest that also future publications should share the input datasets or use the published images as benchmark. The reader is encourage to look at the figshare links in the acknowledgments for the complete or partial datasets used in the presented studies and contact the corresponding author for the complete datasets. A robust solution to overcome the second limitation has not been found yet due to the intrinsic difficulty of imposing a known, non-uniform field of internal strains. One possible approach to study the precision of the DVC predictions under realistic loading condition is to register repeated scans of the structure under loading. When applied to the mouse tibia (unpublished data), this method showed similar precision as in the case of unloaded or preloaded structures, but still does not allow measuring the accuracy of the method due to the fact that the field of displacement under loading is not known (and cannot be measured with independent measurement systems). In recent studies (Palanca et al., 2017a), we have suggested to perform analyses on repeated scans where one of them is virtually deformed with a known strain field, for estimating both accuracy and precision of the DVC methods. Nevertheless, more parameters should be accounted for during the generation of the virtually loaded images (e.g., interpolation), the application of the load (tension, compression, torsion), the load level, and their effect on the different bone structures, increasing significantly the labor, the computation, and post-processing time of the analyses. We believe that this approach should be used at least in one loading scenario and loading level until a proper standardization and benchmarking is provided. Furthermore, so far only virtually imposed affine deformations have been tested: this does not enable testing the DVC algorithms under realistic heterogeneous strain fields. Therefore, future work needs to be done to simulate a realistic loading condition, for example, imposing realistic boundary conditions and displacement (and strain) distributions derived from FE models of the constructs. To overcome the third limitation (i.e., different algorithms used for the different DVC approaches), the comparison between the two DVC methods will be further investigated for a subgroup of data, to identify which parts of the algorithms could lead to the best precision. Finally, a further limitation of this study is that some of the dataset were not processed with either one or the other DVC approach.
In conclusion in this study, we report a comprehensive analysis of the precision of two DVC methodologies for different bone structures, the microarchitecture of which has been acquired with different X-rays imaging techniques. These data can be used by the research community intending to employ DVC measurements for the estimation of the best trade-off between DVC precision in strain measurements, and the spatial resolution of independent displacement and strain measurements. The users are welcome to test new DVC approaches on the datasets shared in this and previous papers for direct comparison of the results.
Ethics Statement
All work performed on tissues collected from animals killed for alimentary purpose does not need ethic approval as per the institutional and national guidelines. All procedures performed on the mice were approved by the local Research Ethics Committee of the University of Sheffield (Sheffield, UK). The animal study from which the ovine bone specimens were extracted was performed according to the local ethical committee of the Royal National Orthopaedic Hospital.
Author Contributions
All authors contributed to the collection of the data, the interpretation of the results, and/or the writing of the paper.
Conflict of Interest Statement
The authors declare that the research was conducted in the absence of any commercial or financial relationships that could be construed as a potential conflict of interest.
Acknowledgments
The project was partially funded by the FP7 European program (MAMBO: PIEF-GA-2012-327357), the Engineering and Physical Sciences Research Council (Frontier Grant Multisim, EP/K03877X/1), the National Royal Society (RG130831 and RG150012), and the UK National Centre for the Replacement, Refinement and Reduction of Animals in Research (NC3Rs, grant number: NC/K000780/1). MP acknowledges the “Marco Polo” travel grant awarded by University of Bologna. The authors would like to thank the Diamond Light Source for time at the Diamond-Manchester Imaging Beamline I13-2 (under proposals: MT10315-Dall’Ara and MT14080-Tozzi), the SkeletAl (University of Sheffield), and the Zeiss Global Center (University of Portsmouth) for imaging and post-processing. We further acknowledge Prof. Hose and Prof. Barber for sharing the ShIRT scripts, Dr. Hollis (LaVision Ltd.) for assistance with DaVis software, Dr. Bodey for help with the acquisition of the Synchrotron images, and Dr. Danesi, Ms. Innocente, Mr. Morellato, and Dr. Boudiffa for help in the preparation and scanning of the samples. The whole or partial datasets used in this study can be found at the following figshare links: vertebral bodies scanned with μCT (https://doi.org/10.6084/m9.figshare.4062351.v1); vertebral bodies with bone cement scanned with μCT (https://doi.org/10.6084/m9.figshare.4308926.v2); cortical bone, trabecular bone, and mouse proximal tibia scanner with SRμCT (https://doi.org/10.15131/shef.data.4865300.v1); trabecular bone with and without biomaterial scanned with SRμCT (https://figshare.com/s/9e30505b66d77276cc9a); and mouse tibiae scanned with in vivo and ex vivo μCT (https://doi.org/10.15131/shef.data.5528104).
References
Anderson, A. E., Ellis, B. J., and Weiss, J. A. (2007). Verification, validation and sensitivity studies in computational biomechanics. Comput. Methods Biomech. Biomed. Engin. 10, 171–184. doi:10.1080/10255840601160484
Badilatti, S. D., Christen, P., Parkinson, I., and Muller, R. (2016). Load-adaptive bone remodeling simulations reveal osteoporotic microstructural and mechanical changes in whole human vertebrae. J. Biomech. 49, 3770–3779. doi:10.1016/j.jbiomech.2016.10.002
Barber, D. C., and Hose, D. R. (2005). Automatic segmentation of medical images using image registration: diagnostic and simulation applications. J. Med. Eng. Technol. 29, 53–63. doi:10.1080/03091900412331289889
Barber, D. C., Oubel, E., Frangi, A. F., and Hose, D. R. (2007). Efficient computational fluid dynamics mesh generation by image registration. Med. Image Anal. 11, 648–662. doi:10.1016/j.media.2007.06.011
Barth, H. D., Zimmermann, E. A., Schaible, E., Tang, S. Y., Alliston, T., and Ritchie, R. O. (2011). Characterization of the effects of x-ray irradiation on the hierarchical structure and mechanical properties of human cortical bone. Biomaterials 32, 8892–8904. doi:10.1016/j.biomaterials.2011.08.013
Bay, B. K., Smith, T. S., Fyhrie, D. P., and Saad, M. (1999). Digital volume correlation: three-dimensional strain mapping using X-ray tomography. Exp. Mech. 39, 217–226. doi:10.1007/BF02323555
Bayraktar, H. H., Morgan, E. F., Niebur, G. L., Morris, G. E., Wong, E. K., and Keaveny, T. M. (2004). Comparison of the elastic and yield properties of human femoral trabecular and cortical bone tissue. J. Biomech. 37, 27–35. doi:10.1016/S0021-9290(03)00257-4
Birkhold, A. I., Razi, H., Duda, G. N., Checa, S., and Willie, B. M. (2017). Tomography-based quantification of regional differences in cortical bone surface remodeling and mechano-response. Calcif. Tissue Int. 100, 255–270. doi:10.1007/s00223-016-0217-4
Bouxsein, M. L. (2003). Bone quality: where do we go from here? Osteoporos. Int. 14(Suppl. 5), S118–S127. doi:10.1007/s00198-003-1489-x
Buades, A., Coll, B., and Morel, J. (2011). Non-local means denoising. Image Process. Line 1, 208–212. doi:10.5201/ipol.2011.bcm_nlm
Chen, Y., Dall Ara, E., Sales, E., Manda, K., Wallace, R., Pankaj, P., et al. (2017). Micro-CT based finite element models of cancellous bone predict accurately displacement once the boundary condition is well replicated: a validation study. J. Mech. Behav. Biomed. Mater. 65, 644–651. doi:10.1016/j.jmbbm.2016.09.014
Christen, D., Levchuk, A., Schori, S., Schneider, P., Boyd, S. K., and Muller, R. (2012). Deformable image registration and 3D strain mapping for the quantitative assessment of cortical bone microdamage. J. Mech. Behav. Biomed. Mater. 8, 184–193. doi:10.1016/j.jmbbm.2011.12.009
Coathup, M. J., Edwards, T. C., Samizadeh, S., Lo, W. J., and Blunn, G. W. (2016). The effect of an alginate carrier on bone formation in a hydroxyapatite scaffold. J. Biomed. Mater. Res. Part B Appl. Biomater. 104, 1328–1335. doi:10.1002/jbm.b.33395
Costa, M. C., Tozzi, G., Cristofolini, L., Danesi, V., Viceconti, M., and Dall’Ara, E. (2017). Micro finite element models of the vertebral body: validation of local displacement predictions. PLoS ONE 12:e0180151. doi:10.1371/journal.pone.0180151
Cristofolini, L., Brandolini, N., Danesi, V., Juszczyk, M. M., Erani, P., and Viceconti, M. (2013). Strain distribution in the lumbar vertebrae under different loading configurations. Spine J. 13, 1281–1292. doi:10.1016/j.spinee.2013.06.014
Cristofolini, L., Conti, G., Juszczyk, M., Cremonini, S., Van Sint Jan, S., and Viceconti, M. (2010a). Structural behaviour and strain distribution of the long bones of the human lower limbs. J. Biomech. 43, 826–835. doi:10.1016/j.jbiomech.2009.11.022
Cristofolini, L., Schileo, E., Juszczyk, M., Taddei, F., Martelli, S., and Viceconti, M. (2010b). Mechanical testing of bones: the positive synergy of finite-element models and in vitro experiments. Philos. Trans. Series A Math. Phys. Eng. Sci. 368, 2725–2763. doi:10.1098/rsta.2010.0046
Dall’Ara, E., Barber, D., and Viceconti, M. (2014). About the inevitable compromise between spatial resolution and accuracy of strain measurement for bone tissue: a 3D zero-strain study. J. Biomech. 47, 2956–2963. doi:10.1016/j.jbiomech.2014.07.019
Dall’Ara, E., Luisier, B., Schmidt, R., Kainberger, F., Zysset, P., and Pahr, D. (2013a). A nonlinear QCT-based finite element model validation study for the human femur tested in two configurations in vitro. Bone 52, 27–38. doi:10.1016/j.bone.2012.09.006
Dall’Ara, E., Luisier, B., Schmidt, R., Pretterklieber, M., Kainberger, F., Zysset, P., et al. (2013b). DXA predictions of human femoral mechanical properties depend on the load configuration. Med. Eng. Phys. 35, 1564–1572; discussion 1564. doi:10.1016/j.medengphy.2013.04.008
Dall’Ara, E., Pahr, D., Varga, P., Kainberger, F., and Zysset, P. (2012). QCT-based finite element models predict human vertebral strength in vitro significantly better than simulated DEXA. Osteoporos. Int. 23, 563–572. doi:10.1007/s00198-011-1568-3
Danesi, V., Tozzi, G., and Cristofolini, L. (2016). Application of digital volume correlation to study the efficacy of prophylactic vertebral augmentation. Clin. Biomech. (Bristol, Avon) 39, 14–24. doi:10.1016/j.clinbiomech.2016.07.010
Gillard, F., Boardman, R., Mavrogordato, M., Hollis, D., Sinclair, I., Pierron, F., et al. (2014). The application of digital volume correlation (DVC) to study the microstructural behaviour of trabecular bone during compression. J. Mech. Behav. Biomed. Mater. 29, 480–499. doi:10.1016/j.jmbbm.2013.09.014
Grassi, L., Vaananen, S. P., Ristinmaa, M., Jurvelin, J. S., and Isaksson, H. (2016). How accurately can subject-specific finite element models predict strains and strength of human femora? Investigation using full-field measurements. J. Biomech. 49, 802–806. doi:10.1016/j.jbiomech.2016.02.032
Gustafson, H. M., Cripton, P. A., Ferguson, S. J., and Helgason, B. (2017). Comparison of specimen-specific vertebral body finite element models with experimental digital image correlation measurements. J. Mech. Behav. Biomed. Mater. 65, 801–807. doi:10.1016/j.jmbbm.2016.10.002
Huang, L., and Wang, M. (1995). Image thresholding by minimizing the measures of fuzziness. Pattern Recognit. 28, 41–51. doi:10.1016/0031-3203(94)E0043-K
Hussein, A. I., Barbone, P. E., and Morgan, E. F. (2012). Digital volume correlation for study of the mechanics of whole bones. Procedia IUTAM 4, 116–125. doi:10.1016/j.piutam.2012.05.013
Jackman, T. M., DelMonaco, A. M., and Morgan, E. F. (2016). Accuracy of finite element analyses of CT scans in predictions of vertebral failure patterns under axial compression and anterior flexion. J. Biomech. 49, 267–275. doi:10.1016/j.jbiomech.2015.12.004
Jones, A. C., and Wilcox, R. K. (2008). Finite element analysis of the spine: towards a framework of verification, validation and sensitivity analysis. Med. Eng. Phys. 30, 1287–1304. doi:10.1016/j.medengphy.2008.09.006
Khodabakhshi, G., Walker, D., Scutt, A., Way, L., Cowie, R. M., and Hose, D. R. (2013). Measuring three-dimensional strain distribution in tendon. J. Microsc. 249, 195–205. doi:10.1111/jmi.12009
Levchuk, A., Zwahlen, A., Weigt, C., Lambers, F. M., Badilatti, S. D., Schulte, F. A., et al. (2014). The Clinical Biomechanics Award 2012 – presented by the European Society of Biomechanics: large scale simulations of trabecular bone adaptation to loading and treatment. Clin. Biomech. (Bristol, Avon) 29, 355–362. doi:10.1016/j.clinbiomech.2013.12.019
Liu, L., and Morgan, E. F. (2007). Accuracy and precision of digital volume correlation in quantifying displacements and strains in trabecular bone. J. Biomech. 40, 3516–3520. doi:10.1016/j.jbiomech.2007.04.019
Lu, Y., Boudiffa, M., Dall’Ara, E., Bellantuono, I., and Viceconti, M. (2015). Evaluation of in-vivo measurement errors associated with micro-computed tomography scans by means of the bone surface distance approach. Med. Eng. Phys. 37, 1091–1097. doi:10.1016/j.medengphy.2015.08.017
Lu, Y., Boudiffa, M., Dall’Ara, E., Liu, Y., Bellantuono, I., and Viceconti, M. (2017). Longitudinal effects of parathyroid hormone treatment on morphological, densitometric and mechanical properties of the mouse tibia. J. Mech. Behav. Biomed. Mater. 75, 244–251. doi:10.1016/j.jmbbm.2017.07.034
Madi, K., Tozzi, G., Zhang, Q. H., Tong, J., Cossey, A., Au, A., et al. (2013). Computation of full-field displacements in a scaffold implant using digital volume correlation and finite element analysis. Med. Eng. Phys. 35, 1298–1312. doi:10.1016/j.medengphy.2013.02.001
Palanca, M., Bodey, A. J., Giorgi, M., Viceconti, M., Lacroix, D., Cristofolini, L., et al. (2017a). Local displacement and strain uncertainties in different bone types by digital volume correlation of synchrotron microtomograms. J. Biomech. 58, 27–36. doi:10.1016/j.jbiomech.2017.04.007
Palanca, M., Cristofolini, L., Pani, M., Kinene, E., Blunn, G., Madi, K., et al. (2017b). Feasibility study for a clinical application of digital volume correlation. Orthop. Proc. 99-B(Suppl. 2), 18.
Palanca, M., Cristofolini, L., Dall’Ara, E., Curto, M., Innocente, F., Danesi, V., et al. (2016). Digital volume correlation can be used to estimate local strains in natural and augmented vertebrae: an organ-level study. J. Biomech. 49, 3882–3890. doi:10.1016/j.jbiomech.2016.10.018
Palanca, M., Tozzi, G., Cristofolini, L., Viceconti, M., and Dall’Ara, E. (2015). Three-dimensional local measurements of bone strain and displacement: comparison of three digital volume correlation approaches. J. Biomech. Eng. 137:071006-1–071006-14. doi:10.1115/1.4030174
Pfeiffer, S. (1998). Variability in osteon size in recent human populations. Am. J. Phys. Anthropol. 106, 219–227. doi:10.1002/(sici)1096-8644(199806)106:2<219:aid-ajpa8>3.0.co;2-k
Razi, H., Birkhold, A. I., Weinkamer, R., Duda, G. N., Willie, B. M., and Checa, S. (2015). Aging leads to a dysregulation in mechanically driven bone formation and resorption. J. Bone Miner. Res. 30, 1864–1873. doi:10.1002/jbmr.2528
Roberts, B. C., Perilli, E., and Reynolds, K. J. (2014). Application of the digital volume correlation technique for the measurement of displacement and strain fields in bone: a literature review. J. Biomech. 47, 923–934. doi:10.1016/j.jbiomech.2014.01.001
Schileo, E., Dall’ara, E., Taddei, F., Malandrino, A., Schotkamp, T., Baleani, M., et al. (2008). An accurate estimation of bone density improves the accuracy of subject-specific finite element models. J. Biomech. 41, 2483–2491. doi:10.1016/j.jbiomech.2008.05.017
Schwiedrzik, J., Gross, T., Bina, M., Pretterklieber, M., Zysset, P., and Pahr, D. (2016). Experimental validation of a nonlinear muFE model based on cohesive-frictional plasticity for trabecular bone. Int. J. Numer. Method Biomed. Eng. 32, e02739. doi:10.1002/cnm.2739
Tozzi, G., Dall’Ara, E., Palanca, M., Curto, M., Innocente, F., and Cristofolini, L. (2017). Strain uncertainties from two digital volume correlation approaches in prophylactically augmented vertebrae: local analysis on bone and cement-bone microstructures. J. Mech. Behav. Biomed. Mater. 67, 117–126. doi:10.1016/j.jmbbm.2016.12.006
van Rietbergen, B., Weinans, H., Huiskes, R., and Odgaard, A. (1995). A new method to determine trabecular bone elastic properties and loading using micromechanical finite-element models. J. Biomech. 28, 69–81. doi:10.1016/0021-9290(95)80008-5
Viceconti, M. (2012). Multiscale Modeling of the Skeletal System. Cambridge: Cambridge University Press.
Widmer Soyka, R. P., Lopez, A., Persson, C., Cristofolini, L., and Ferguson, S. J. (2013). Numerical description and experimental validation of a rheology model for non-Newtonian fluid flow in cancellous bone. J. Mech. Behav. Biomed. Mater. 27, 43–53. doi:10.1016/j.jmbbm.2013.06.007
Wolfram, U., Wilke, H. J., and Zysset, P. K. (2010). Valid micro finite element models of vertebral trabecular bone can be obtained using tissue properties measured with nanoindentation under wet conditions. J. Biomech. 43, 1731–1737. doi:10.1016/j.jbiomech.2010.02.026
Zauel, R., Yeni, Y. N., Bay, B. K., Dong, X. N., and Fyhrie, D. P. (2006). Comparison of the linear finite element prediction of deformation and strain of human cancellous bone to 3D digital volume correlation measurements. J. Biomech. Eng. 128, 1–6. doi:10.1115/1.2146001
Zhu, M. L., Zhang, Q. H., Lupton, C., and Tong, J. (2016). Spatial resolution and measurement uncertainty of strains in bone and bone-cement interface using digital volume correlation. J. Mech. Behav. Biomed. Mater. 57, 269–279. doi:10.1016/j.jmbbm.2015.12.017
Keywords: bone, strain, digital volume correlation, deformable registration, micro-computed tomography, precision
Citation: Dall’Ara E, Peña-Fernández M, Palanca M, Giorgi M, Cristofolini L and Tozzi G (2017) Precision of Digital Volume Correlation Approaches for Strain Analysis in Bone Imaged with Micro-Computed Tomography at Different Dimensional Levels. Front. Mater. 4:31. doi: 10.3389/fmats.2017.00031
Received: 25 July 2017; Accepted: 09 October 2017;
Published: 08 November 2017
Edited by:
Davide Bigoni, University of Trento, ItalyReviewed by:
Ivan Argatov, Technische Universität Berlin, GermanyAlberto Salvadori, University of Brescia, Italy
Copyright: © 2017 Dall’Ara, Peña-Fernández, Palanca, Giorgi, Cristofolini and Tozzi. This is an open-access article distributed under the terms of the Creative Commons Attribution License (CC BY). The use, distribution or reproduction in other forums is permitted, provided the original author(s) or licensor are credited and that the original publication in this journal is cited, in accordance with accepted academic practice. No use, distribution or reproduction is permitted which does not comply with these terms.
*Correspondence: Enrico Dall’Ara, ZS5kYWxsYXJhQHNoZWZmaWVsZC5hYy51aw==