 Anita Zeidler1
 Philip S. Salmon
 Dean A. J. Whittaker
 Keiron J. Pizzey
 Alex C. Hannon
- 1Department of Physics, University of Bath, Bath, United Kingdom
- 2ISIS Facility, Rutherford Appleton Laboratory, Didcot, United Kingdom
The topological ordering of the network structure in vitreous GexSe1− x was investigated across most of the glass-forming region (0 ≤ x ≤ 0.4) by using high-resolution neutron diffraction to measure the Bhatia-Thornton number-number partial structure factor. This approach gives access to the composition dependence of the mean coordination number and correlation lengths associated with the network ordering. The thermal properties of the samples were also measured by using temperature-modulated differential scanning calorimetry. The results do not point to a structural origin of the so-called intermediate phase, which in our work is indicated for the composition range 0.175(8) ≤ x ≤ 0.235(8) by a vanishingly small non-reversing enthalpy near the glass transition. The midpoint of this range coincides with the mean-field expectation of a floppy-to-rigid transition at x = 0.20. The composition dependence of the liquid viscosity, as taken from the literature, was also investigated to look for a dynamical origin of the intermediate phase, using the Mauro-Yue-Ellison-Gupta-Allan (MYEGA) model to estimate the viscosity at the liquidus temperature. The evidence points to a maximum in the viscosity at the liquidus temperature, and a minimum in the fragility index, for the range 0.20 ≤ x ≤ 0.22. The utility of the intermediate phase as a predictor of the material properties in network glass-forming systems is discussed.
1. Introduction
The structural disorder associated with covalently bonded network-forming glassy materials gives rise to a diversity of material properties, which leads to the importance of glass in multiple technologies (Cusack, 1987; Elliott, 1990; Feltz, 1993). It is possible to predict many of the structure-related properties of these materials by using constraint-counting theory, where the constraints originate from the bond-stretching and bond-bending interatomic forces associated with the covalent bonds of network-forming motifs (Phillips, 1979; Thorpe, 1983). As the type and proportion of network-forming motifs is altered, the network topology will respond accordingly. Hence, the connectivity and properties of covalently bonded network-forming glasses can be manipulated systematically by altering their composition.
On the basis of mean-field constraint-counting theory, a network is predicted to undergo the transition from an elastically floppy to a stressed-rigid state when the mean number of Lagrangian bonding constraints per atom Nc is equal to three, i.e., the number of degrees of freedom per atom in three dimensions. Floppy phases are under-constrained (Nc < 3), and stressed-rigid phases are over-constrained (Nc > 3). For a system in which all of the bond-stretching and bond-bending constraints are intact and there are no dangling bonds, the transition at Nc = 3 corresponds to a mean coordination number = 2. 40 where the network is isostatically rigid and stress free (Phillips, 1979; Thorpe, 1983). If the network can self-organize and thereby lower the free energy at the temperature of its formation by the incorporation of structural configurations that minimize the occurrence of over-constrained regions, then it is postulated that two transitions can appear (Thorpe et al., 2000). In this case, the floppy and stressed-rigid phases are separated by a composition range known as the intermediate phase where the network is isostatically rigid and stress free. The compositional width of this phase is thought to be related to structural variability, i.e., the ability of a network to incorporate a range of structural motifs (Sartbaeva et al., 2007; Massobrio et al., 2009). In temperature-modulated differential scanning calorimetry (TMDSC) experiments, the existence of a stress-free intermediate-phase is inferred from the non-reversing part of the measured enthalpy ΔHnr, which takes a value close to zero near the glass transition temperature Tg (Wang et al., 2000; Boolchand et al., 2001b). The structural motifs of the intermediate phase are expected to yield Nc = 3 such that the network is optimally constrained to avoid stress. GexSe1− x (0 ≤ x ≤ 1) is a prototypical covalently bonded network-forming system for which the intermediate phase spans a wide composition window, usually reported as (Boolchand et al., 2001a, 2007; Bhosle et al., 2012b).
The first objective of this article is to search for a structural origin of the intermediate phase by performing a set of neutron diffraction experiments on vitreous GexSe1− x across the glass-forming region 0 ≤ x ≤ 0.43 (Azoulay et al., 1975). The experiments used samples containing Ge and Se of natural isotopic abundance, for which the coherent neutron scattering lengths take similar values, i.e., bGe = 8.185(20) fm and bSe = 7.970(9) fm (Sears, 1992). In consequence, the Bhatia and Thornton (1970) number-number partial structure factor SNN(q) is measured to an excellent level of approximation, where q denotes the magnitude of the scattering vector (Salmon, 2007a). This function and its Fourier transform, the number-number partial pair-distribution function gNN(r), do not distinguish between the chemical species that occupy the atomic sites in a glass-forming network structure, and therefore yield important information on the topological ordering (Salmon, 1992; Salmon and Liu, 1994; Petri et al., 1999). For example, the mean coordination number is obtained directly from gNN(r). In addition, the peak positions and widths in SNN(q) describe the atomic ordering in a glass network on different length scales (Salmon, 1994; Salmon et al., 2005; Zeidler and Salmon, 2016). One of these length scales is associated with an intermediate range, and manifests itself by the appearance of a first sharp diffraction peak (FSDP) in SNN(q) at qFSDP, where for glassy GexSe1− x and rnn is the nearest-neighbor bond distance. Another length scale is associated with ordering on an extended range, and manifests itself by the appearance of a principal peak in SNN(q) at qPP, where for glassy GexSe1− x. A competition between the ordering on these two length scales for different classes of binary glass-forming melts influences their relative fragility (Salmon et al., 2006; Salmon, 2007b; Salmon and Zeidler, 2013). The present neutron diffraction work complements previous investigations on the structure of intermediate phase glasses using neutron diffraction (Ramesh Rao et al., 1998), X-ray diffraction (Wang et al., 2004; Sharma et al., 2005), anomalous X-ray diffraction (Hosokawa et al., 2003, 2011); or a combination of high-energy X-ray diffraction and extended X-ray absorption fine structure (EXAFS) spectroscopy (Shatnawi et al., 2008).
The second objective of this article is to investigate the viscosity at the liquidus temperature in the GexSe1− x system by using the Mauro-Yue-Ellison-Gupta-Allan (MYEGA) model (Mauro et al., 2009) to search for a dynamical signature of the intermediate phase. For a given composition, the equilibrium liquid will have more thermal energy than the supercooled liquid, which should give a greater opportunity for reorganization of the network structure. The self-organization that occurs on quenching to form a stress-free intermediate-phase glass should therefore manifest itself in the dynamics of the liquid state at the liquidus temperature TL, and the temperature-dependent viscosity η(T) is an important measure of the dynamics for a glass-forming material.
The article is organized as follows. The essential neutron diffraction theory is outlined in Section 2. The experimental method is described in Section 3 and the neutron diffraction results are given in Section 4. The composition dependence of the viscosity and fragility index is described in Section 5. The results are discussed in Section 6, where the composition dependence of the glass structure is considered, along with the utility of the intermediate phase as a predictor of material properties. Conclusions are drawn in Section 7.
2. Theory
The total structure factor measured in a neutron diffraction experiment on glassy GexSe1− x is given by (Fischer et al., 2006)
where Sαβ(q) is the partial structure factor for chemical species α and β, and is the mean coherent neutron scattering length. The close similarity between the bGe and bSe values for Ge and Se of natural isotopic abundance means that to an excellent level of approximation (Salmon, 2007a), where SNN(q) is given by equation (1) if bGe = bSe. The total pair-distribution function g(r) follows from the Fourier transform relation
where ρ is the atomic number density. The measurement window of a diffractometer is limited to a maximum scattering vector qmax such that M(q ≤ qmax) = 1, M(q > qmax) = 0.
If qmax is sufficiently large that the effect of M(q) can be neglected, the overall mean coordination number for the spatial range r1 ≤ r ≤ r2 follows from the expression
where is the mean coordination number of chemical species β about chemical species α for the range r1 ≤ r ≤ r2. In the case when bGe = bSe, equation (3) reduces to the expression
Then, on the basis of the “8-N” rule in which the Ge and Se atoms are fourfold and twofold coordinated, respectively, such that = 4 and = 2, it follows that
The coordination numbers can be calculated on the basis of a chemically ordered network (CON) or random covalent network (RCN) model, both of which satisfy the “8-N” rule (Salmon, 2007a). In the CON, Ge–Se bonds are favored such that only Ge–Se and Se–Se bonds are allowed for x < 1/3 whereas only Ge–Se and Ge–Ge bonds are allowed for x > 1/3. The associated coordination numbers are , and for x < 1/3; , and for x > 1/3; or with at the stoichiometric composition x = 1/3. In the RCN, there is a purely statistical distribution of bond types giving , and . Hence, provided the “8-N” rule holds for the GexSe1− x system, will follow from equation (5) if an experiment is performed on a sample for which bGe = bSe, or can be calculated from either the CON or RCN model by using equation (3) if an experiment is performed on a sample for which bGe ≠ bSe.
3. Experimental Method
3.1. Glass Synthesis and Characterization
Elemental Ge (99.999%, Alpha Aesar) and Se powders (99.999+%, Sigma-Aldrich), with the desired mass ratio, were loaded into a silica ampoule of 5 mm inner diameter and 1 mm wall thickness that had been etched using a 48 wt% solution of hydrofluoric acid, rinsed using water then acetone, and baked dry under vacuum at 800°C for 3 h. The ampoule was loaded in a high-purity argon-filled glove box, isolated using a Young’s tap, and then transferred to a vacuum line where it was sealed under a pressure of 10−5 Torr. The sealed ampoule was placed in a rocking furnace, which was heated at a rate of 2°C min−1 from ambient to a temperature of 975°C, dwelling for 1 h each at temperatures of 221, 685, and 938°C, i.e., near to the melting and boiling points of Se, and the melting point of Ge, respectively. The highest temperature was maintained for 47 h before the rocking motion was stopped, and the furnace was placed vertically for 1 h to let the melt collect at the bottom of the ampoule. The furnace was then cooled at a rate of 2°C min−1 to a temperature 100°C above the liquidus temperature TL (Figure 1), where the sample was left to equilibrate for 4 h, and the ampoule was dropped into an ice/water mixture. The sample (of mass ∼ 3.6 g) was broken out of the ampoule inside an argon-filled glove box and transferred into a vanadium container of outer diameter 7 mm and wall thickness 0.1 mm ready for the diffraction experiment. Glassy samples prepared in this way showed no indication of Ge-O or Se-O impurity bands in the measured infrared transmission spectra, e.g., in the region around 735–781 cm−1 (Savage and Nielsen, 1965). A sample of glassy GeSe4, as prepared by using an almost identical procedure but with only 10 h of rocking, was investigated by both energy dispersive X-ray spectroscopy (EDS) and Raman spectroscopy, and was found to be homogeneous on a submicron to centimeter length scale (Pierre Lucas, private communication).
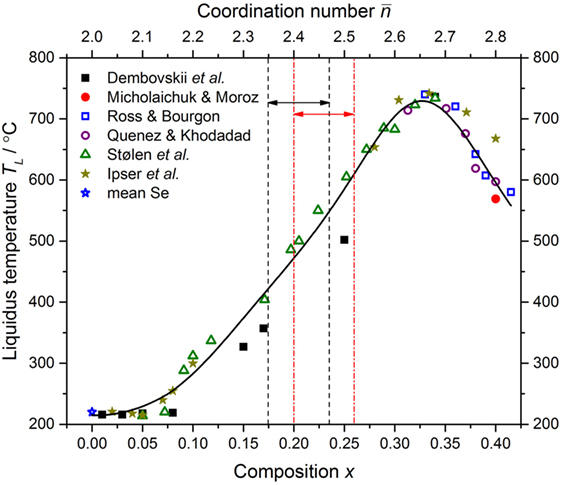
Figure 1. The dependence of the liquidus temperature TL for the GexSe1− x system on the composition x and mean coordination number . The data point for Se is a mean of the values reported by Berkes and Myers (1971), Johnson et al. (1986), Morgant and Legendre (1986), Ota and Kunugi (1973), and Stølen et al. (1999). The other data points were taken from Dembovskii et al. (1965), Ipser et al. (1982), Mikolaichuk and Moroz (1986), Quenez and Khodadad (1969), Ross and Bourgon (1969), and Stølen et al. (1999). The solid (black) curve gives a least-squares fit of the measured data sets to an inverse polynomial function. The pairs of vertical dashed (black) or chained (red) lines, and associated horizonal arrows, mark compositions for which as found in the present work or in the work of Boolchand et al. (2001a), respectively.
The density of each sample was measured using a Quantachrome MICRO-ULTRAPYC 1200e pycnometer operated with helium gas. The results are compared to those obtained from other measurements in Figure 2. The comparison shows that systematically smaller densities were obtained in the work by Bhosle et al. (2012b). In the latter, agreement is claimed with the molar volume Vm values given by Mahadevan et al. (1995), but the latter were incorrectly copied from the work of Feltz et al. (1983). As shown in Figure 3, the molar volumes measured by Feltz et al. (1983) are not in quantitative agreement with the work of Bhosle et al. (2012b). Nevertheless, the data sets of Bhosle et al. (2012b), Feltz et al. (1983), Ota et al. (1978), and Yang et al. (2013) point to a minimum value of Vm in the interval (Bhageria et al., 2014). The present results show a shallow minimum around x = 0.19(4) corresponding to Vm = 17.95(5) cm3 mol−1.
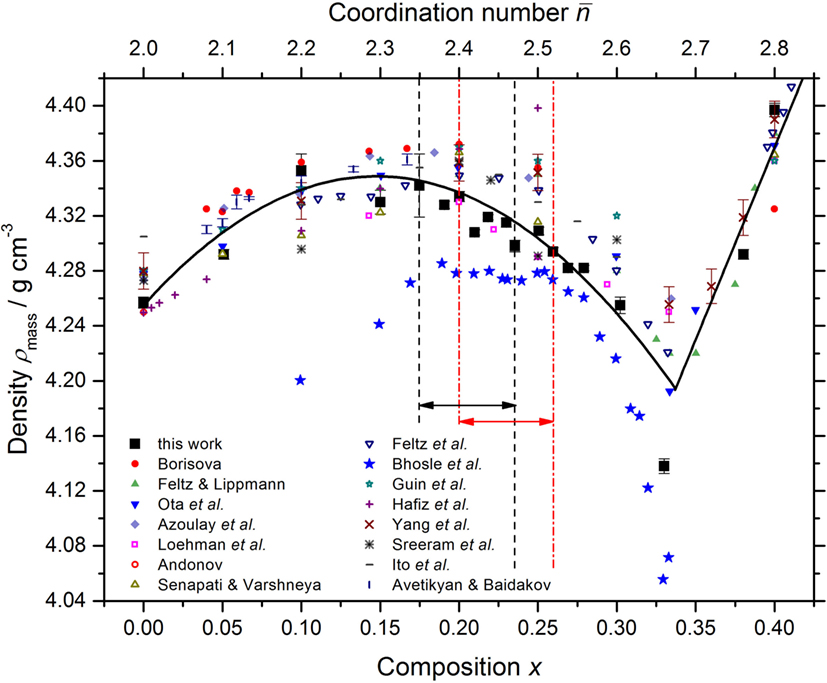
Figure 2. The dependence of the mass density at room temperature ρmass for the GexSe1− x system on the composition x and mean coordination number . The results from the present work at ≃22°C are compared to those taken from Andonov (1982), Avetikyan and Baidakov (1972), Azoulay et al. (1975), Bhosle et al. (2012b), Borisova (1981), Feltz et al. (1983), Feltz and Lippmann (1973), Guin et al. (2002b), Hafiz et al. (1993), Ito et al. (1988), Loehman et al. (1972), Ota et al. (1978), Senapati and Varshneya (1995), Sreeram et al. (1991b), and Yang et al. (2013). The solid (black) curves are drawn as guides for the eye. The pairs of vertical dashed (black) or chained (red) lines, and associated horizonal arrows, mark compositions for which as found in the present work or in the work of Boolchand et al. (2001a), respectively.
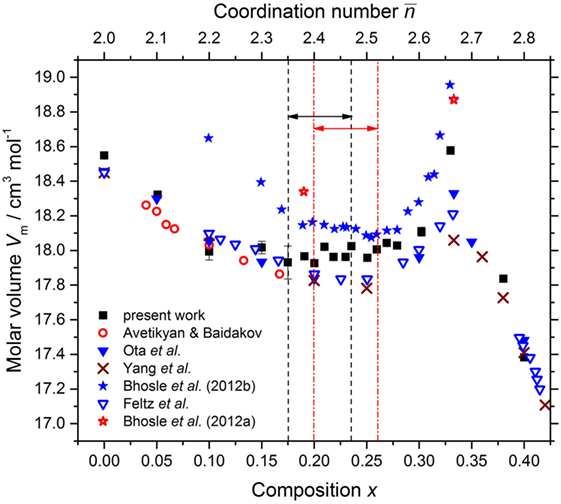
Figure 3. The dependence of the molar volume at room temperature Vm for the GexSe1− x system on the composition x and mean coordination number . The results from the present work are compared to those taken from Avetikyan and Baidakov (1972), Bhosle et al. (2012b), Feltz et al. (1983), Ota et al. (1978), and Yang et al. (2013). Data points are also given for the “dry” samples prepared by Bhosle et al. (2012a). The pairs of vertical dashed (black) or chained (red) lines, and associated horizonal arrows, mark compositions for which as found in the present work or in the work of Boolchand et al. (2001a), respectively.
The glass transition temperature Tg was measured by using a TA Instruments Q200 Differential Scanning Calorimeter operated in a TMDSC mode. Each scan comprised a temperature increasing and a temperature decreasing part, both performed at a rate of 3°C min−1 and temperature modulation of 1°C per 100 s. The maximum temperature was set to give complete coverage of the glass-transition region whilst avoiding crystallization. The Tg values taken from the onset of the glass transition as manifested in the total heat flow measured during the temperature increasing part of a scan are plotted in Figure 4. The results are in the range of values previously reported for glasses in the GexSe1− x system. In addition, in order to make a like-for-like comparison with the glass transition temperatures reported by Boolchand and coworkers from TMDSC experiments (Feng et al., 1997; Boolchand, 2000; Boolchand and Bresser, 2000; Wang et al., 2005; Bhosle et al., 2012a,b), a value Tg1 was taken from the midpoint of the glass-transition region for the reversing heat-flow in the temperature increasing part of a scan, and a value Tg2 was also taken from the midpoint of the glass-transition region for the reversing heat-flow in the temperature decreasing part of a scan, and the mean value was taken. The results for Tg,rev from the present work are in agreement with those previously obtained by Boolchand and coworkers, as shown by the inset to Figure 4.
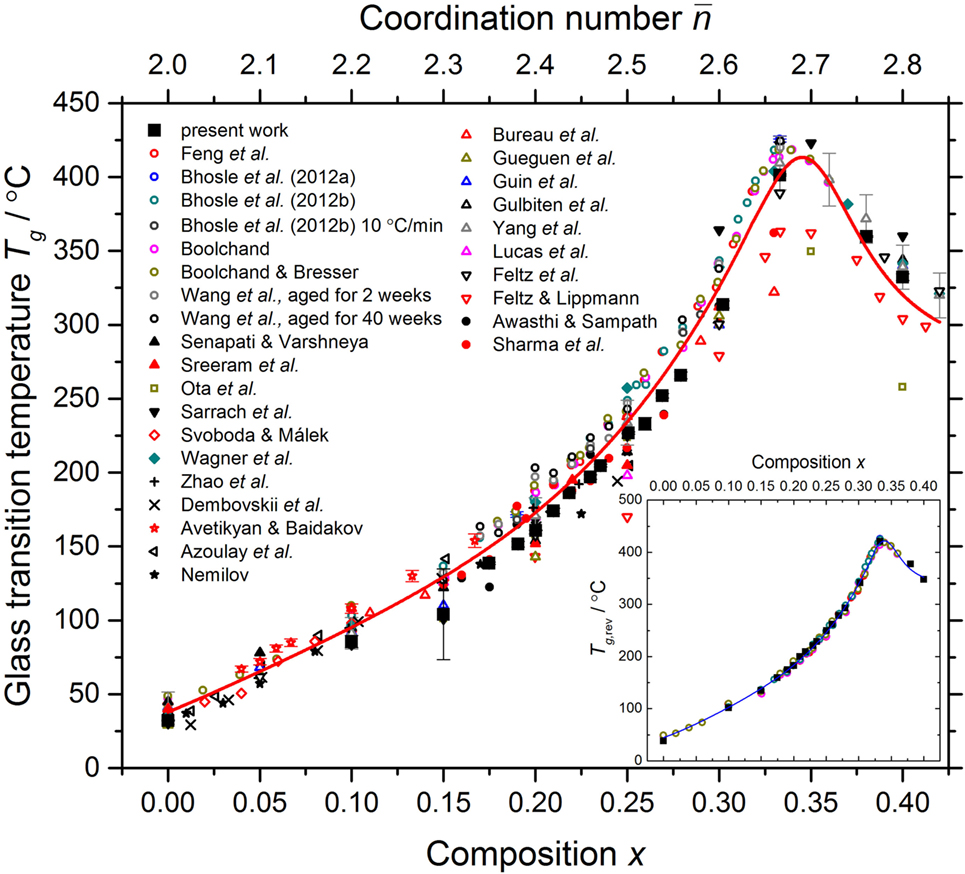
Figure 4. The dependence of the glass transition temperature Tg for the GexSe1− x system, as measured using a variety of methods, on the composition x and mean coordination number . The results obtained from the total heat flow in the present work are compared to the results obtained by Avetikyan and Baidakov (1972), Awasthi and Sampath (2002), Azoulay et al. (1975), Bhosle et al. (2012a,b), Boolchand (2000), Boolchand and Bresser (2000), Bureau et al. (2003), Dembovskii et al. (1965), Feltz and Lippmann (1973), Feltz et al. (1983), Feng et al. (1997), Gueguen et al. (2011), Guin et al. (2002a), Gulbiten et al. (2013), Lucas et al. (2003), Nemilov (1964), Ota et al. (1978), Sarrach et al. (1976), Senapati and Varshneya (1996), Sharma et al. (2005), Sreeram et al. (1991a), Svoboda and Málek (2015), Wagner et al. (1997), Wang et al. (2005), Yang et al. (2013), and Zhao et al. (2013). The inset shows solely the results for Tg,rev as obtained in the present work and in the work of Boolchand and coworkers (Feng et al., 1997; Boolchand, 2000; Boolchand and Bresser, 2000; Wang et al., 2005; Bhosle et al., 2012a,b)—see Section 3.1 for details. The solid (red) curve in the main panel gives a least-squares fit of the measured data sets to a fourth-order polynomial at and to a Lorentzian function at larger x values. The solid (blue) curve in the inset gives a similar least-squares fit to the measured Tg,rev values.
The non-reversing enthalpy ΔHnr was obtained from the same TMDSC scans used to obtain Tg,rev by following the procedure described by Chen et al. (2010b), which includes a frequency correction. Independent measurements were made on several samples from each composition that had been aged at room temperature for a minimum of 37 days, and the mean and standard deviation were taken to find ΔHnr and its error. The results give , which is the defining characteristic of the intermediate phase, for the composition range 0.175(8) ≤ x ≤ 0.235(8) (Figure 5). This composition range compares to previously reported “reversibility windows” of 0.225 ≤ x ≤ 0.230 (Feng et al., 1997), 0.20(1) ≤ x ≤ 0.26(1) (Boolchand et al., 2001a), or 0.195(5) ≤ x ≤ 0.260(5) (Bhosle et al., 2012b) for the GexSe1− x system. The composition range found in the present work is therefore shifted to lower x, and its mid-range value of x = 0.205(8) is in agreement, within the experimental error, with the expectation from mean-field constraint-counting theory of a rigid to floppy transition in the GexSe1− x system at x = 0.20 where = 2. 40 (Thorpe, 1983). The activation energy for enthalpy relaxation EA, as measured by differential scanning calorimetry (DSC) experiments that employed different cooling rates (Lucas et al., 2009), also shows a minimum around x = 0.20 (Figure 5).
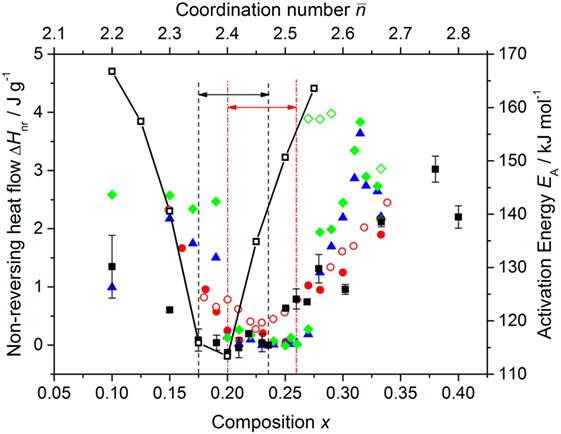
Figure 5. The dependence of the measured non-reversing enthalpy ΔHnr for the GexSe1− x system on the composition x and mean coordination number . The results from the present work [solid (black) squares  with vertical error bars] are compared to those of Feng et al. (1997) [open (red) circles
  ]; Boolchand et al. (2007) [solid (red) circles
  ]; and Bhosle et al. (2012b) where the samples were investigated as prepared [solid (blue) triangle
  ], after aging for two weeks at room temperature [solid (green) diamonds
  ], or after aging for two weeks at 240°C [open (green) diamonds
  ]. The pairs of vertical dashed (black) or chained (red) lines, and associated horizonal arrows, mark compositions for which as found in the present work (0.175 ≤ x ≤ 0.235) or in the work of Boolchand et al. (2001a) (0.20 ≤ x ≤ 0.26), respectively. Also shown is the composition dependence of the activation energy for enthalpy relaxation EA as measured in the DSC experiments of Lucas et al. (2009) [open (black) squares ⃞].
3.2. Neutron Diffraction Experiments
The neutron diffraction experiments were performed at room temperature (≃25°C) using the GEM (Hannon, 2005) and SANDALS (Soper, 1991) diffractometers at the ISIS pulsed neutron source. Diffraction patterns were measured for each sample in a vanadium container, the empty container, the empty instrument, and a vanadium rod of diameter 8.37(1) mm for normalization purposes. Each diffraction pattern was built up from the intensities measured for different detector groups, where these intensities were saved at regular intervals in order to test the diffractometer stability. The data sets were analyzed detector-by-detector using the GUDRUN analysis software (Soper, 2011). Inelasticity corrections were performed using the procedure described by Howe et al. (1989). The compositions x = 0, 0.100, 0.150, 0.175, 0.200, 0.230, 0.251, 0.260, 0.279, 0.302, 0.333, and 0.400 were investigated using GEM; the compositions x = 0, 0.191, 0.210, 0.218, 0.230, 0.235, and 0.269 were investigated using SANDALS. The uncertainty on these sample compositions Δx = ± 0.001.
4. Neutron Diffraction Results
4.1. Reciprocal-Space Properties
The measured total structure factors for the GexSe1− x glasses are shown in Figure 6. For the x = 0 and x = 0.230 compositions, that were investigated using both GEM and SANDALS, the measured functions are in agreement within the experimental error. For glassy Se, S(q) has a small shoulder on the low-q side of the principal peak at qPP = 1.91(2) Å−1, which develops into an FSDP with increasing Ge content. The height of the FSDP is largest at the stoichiometric composition x = 1/3 where its position qFSDP = 0.985(10) Å−1. According to Fourier transform theory, a sharp peak of width Δqi at a position qi in is associated with real-space ordering of periodicity 2π/qi and correlation length 2π/Δqi (Salmon, 1994). Indeed, the real-space periodicity associated with these features is directly observable for several network-forming glasses, including Ge0.333Se0.667 (Salmon, 1994, 2006; Salmon et al., 2005, 2006). The composition dependence of the periodicity and correlation length associated with each of the first three peaks in the measured S(q) functions is shown in Figures 7 and 8, respectively. The full-width at half-maximum of a peak Δqi was measured relative to a linear baseline drawn between points (usually minima) deemed to mark the start and end of a peak (Salmon, 1994). The parameters obtained from the GEM and SANDALS diffractometers are in agreement within the experimental error. The results do not show any notable feature that can be associated specifically with an intermediate phase, although there is a change in the correlation length associated with the FSDP at . The composition dependence of the periodicity 2π/qFSDP as obtained from other diffraction experiments is also shown in Figure 7. A shoulder at , as reported in the X-ray diffraction work of Sharma et al. (2005), is not found in any of the other data sets.
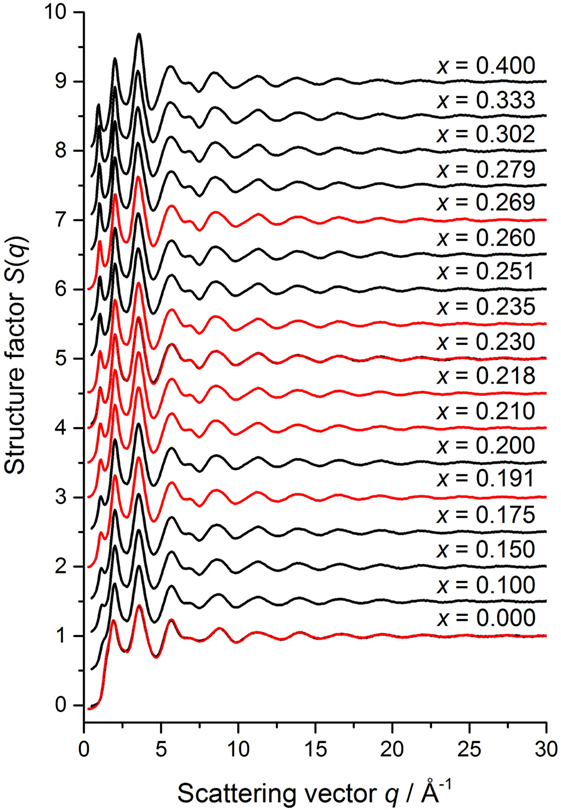
Figure 6. The composition dependence of the measured total structure factors for the GexSe1− x system. The GEM and SANDALS data sets are shown by the solid dark (black) and solid light (red) curves with vertical error bars, respectively, where the line thickness is greater than the size of the error bars at most q values. The curves for x > 0 have been displaced vertically for clarity of presentation.
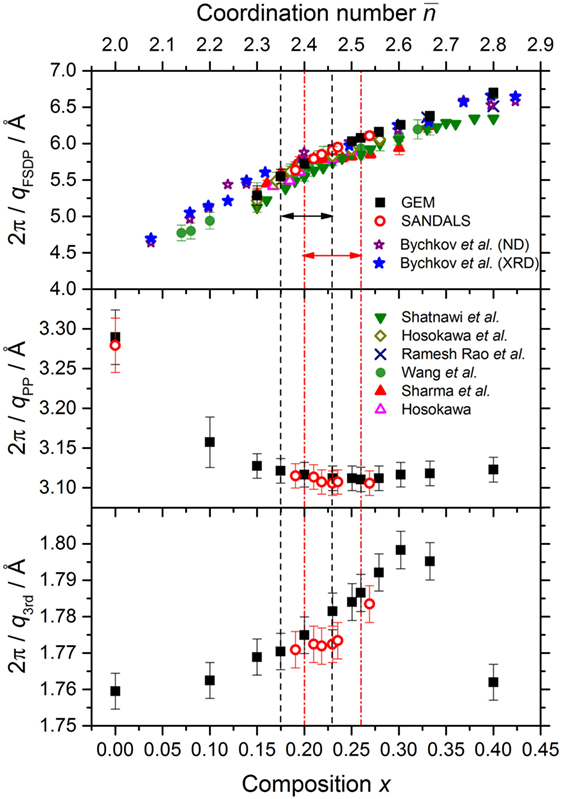
Figure 7. The dependence of the periodicity 2π/qi associated with the FSDP, principal peak (PP) and third peak in S(q) on the composition x and mean coordination number . The results from the present neutron diffraction (ND) work were obtained using either the GEM or SANDALS diffractometer. In the case of the FSDP, these results are compared to those obtained from the ND and high energy X-ray diffraction (XRD) work of Bychkov et al. (2005); the high energy XRD work of Shatnawi et al. (2008); the ND work of Ramesh Rao et al. (1998); the XRD work of Sharma et al. (2005) and Wang et al. (2004); and the anomalous X-ray scattering work of Hosokawa (2001) and Hosokawa et al. (2003). The pairs of vertical dashed (black) or chained (red) lines, and associated horizonal arrows, mark compositions for which as found in the present work or in the work of Boolchand et al. (2001a), respectively.
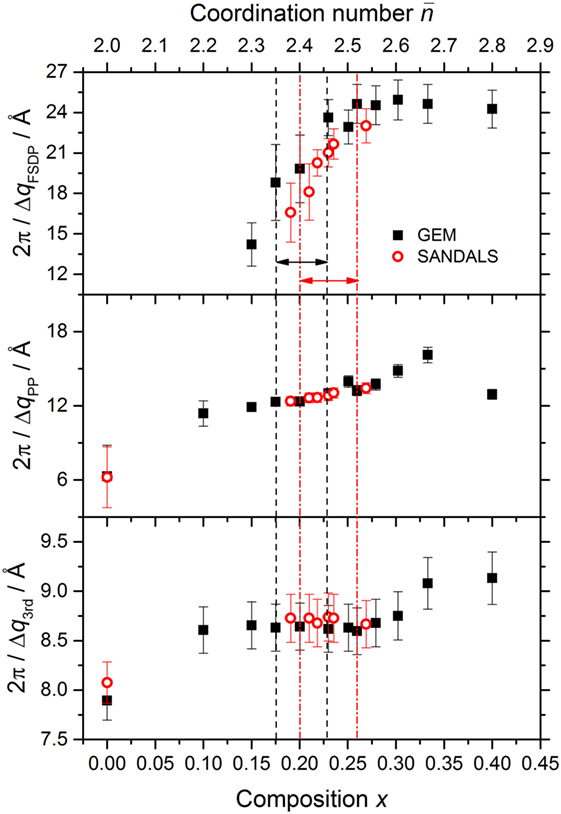
Figure 8. The dependence of the correlation length 2π/Δqi associated with the FSDP, principal peak (PP) and third peak in S(q) on the composition x and mean coordination number . The results were obtained using either the GEM or SANDALS diffractometer. The pairs of vertical dashed (black) or chained (red) lines, and associated horizonal arrows, mark compositions for which as found in the present work or in the work of Boolchand et al. (2001a), respectively.
4.2. Real-Space Properties
The measured total pair-distribution functions are shown in Figure 9. The large qmax values accessed by the neutron diffractometers ensure that M(q) has a minimal effect on S(q) (equation (2)), so the g(r) functions do not show associated Fourier transform artifacts. The mean coordination number for each glass composition was therefore obtained by direct integration of the first peak in g(r) (equation (3)), i.e., there was no need to apply a fitting procedure in order to account for the effect of a finite qmax value (Petri et al., 2000; Salmon and Petri, 2003). The composition dependence of the measured values is shown in Figure 10, where the results are compared to those obtained from the EXAFS experiments of Zhou et al. (1991) and the first-principles molecular dynamics simulations of Inam et al. (2007). The predictions of the “8-N” rule are also given, where the curves for the CON and RCN models take into account the small mismatch between the coherent neutron scattering lengths of Ge and Se of natural isotopic abundance (Section 2). The results show that increases monotonically with x and, within the experimental error, the values are in accordance with the “8-N” rule. They do not show any notable feature that can be associated specifically with the intermediate phase, such as a deviation from the “8-N” rule as reported by Inam et al. (2007).
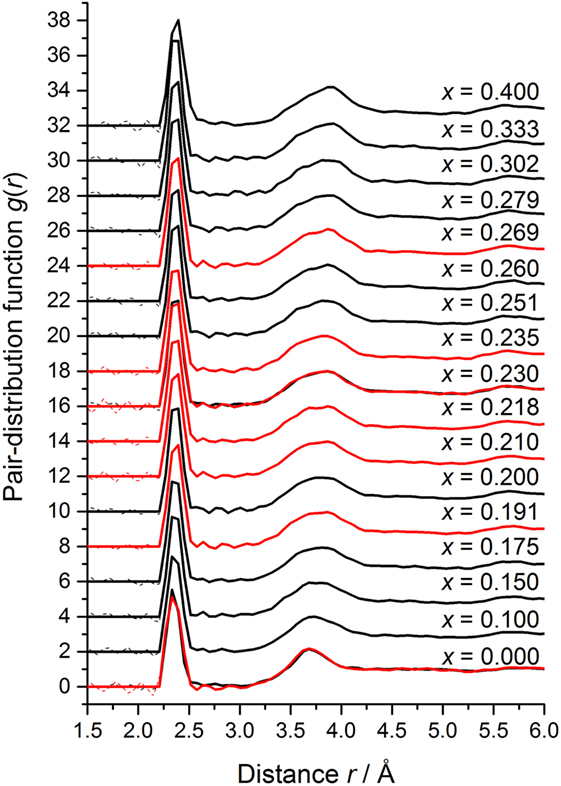
Figure 9. The composition dependence of the measured total pair-distribution function for the GexSe1− x system, as obtained by Fourier transforming the spline fitted S(q) functions shown in Figure 6 with qmax set at a node in S(q) at ≃ 32 Å−1. The GEM and SANDALS data sets are shown by the dark solid (black) and light solid (red) curves, respectively. The Fourier transform artifacts at r values smaller than the distance of closest approach between two atoms are shown by broken curves oscillating about the g(r → 0) = 0 limit. The curves for x > 0 have been displaced vertically for clarity of presentation.
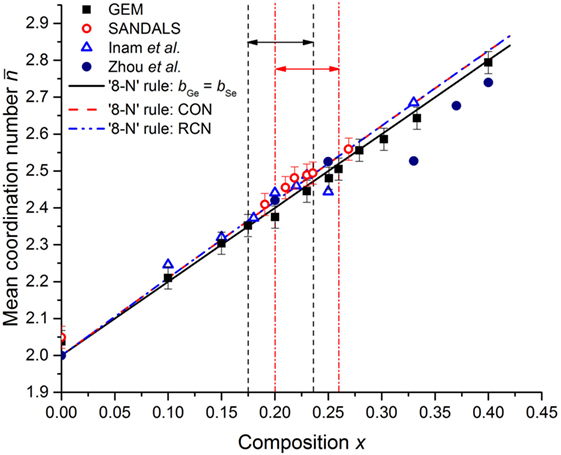
Figure 10. The composition dependence of the mean coordination number for the GexSe1− x system. The neutron diffraction results from GEM and SANDALS are compared to the EXAFS results of Zhou et al. (1991) and to the first-principles molecular dynamics results of Inam et al. (2007). The expectations of the “8-N” rule are also given, where the curves were calculated (i) for glassy samples for which bGe = bSe (see equation (5)), or (ii) for the expectations of the CON and RCN models, taking into account a small mismatch between the values of bGe and bSe for the measured samples (see equation (3)). The pairs of vertical dashed (black) or chained (red) lines, and associated horizonal arrows, mark compositions for which as found in the present work or in the work of Boolchand et al. (2001a), respectively.
5. Viscosity and Fragility Index
As motivated in Section 1, the composition dependence of η(TL) may reveal a dynamical signature of the intermediate phase. To investigate this possibility, the MYEGA model (Mauro et al., 2009) for the viscosity at absolute temperature T was adopted where, for a given composition x,
Here, log10η∞ is the logarithm of the high-temperature viscosity, Tg is the glass transition temperature (in absolute units) corres- ponding to η(Tg) = 1012 Pa s, and is the fragility index. The model was used to fit the measured viscosity data for Se (Cukierman and Uhlmann, 1973; Koštál and Málek, 2010; Gueguen et al., 2011), Ge0.10Se0.90 (Nemilov, 1964; Senapati and Varshneya, 1996; Gueguen et al., 2011), Ge0.20Se0.80 (Nemilov, 1964; Gueguen et al., 2011), and Ge0.25Se0.75 (Nemilov, 1964; Senapati and Varshneya, 1996; Gueguen et al., 2011) where two or more of the data sets are self-consistent, and the measured viscosity data for Ge0.30Se0.70 (Gueguen et al., 2011) where only one data set is available. For a given composition, the logarithm of the high-temperature viscosity was treated as either a fitting parameter or a fixed parameter set at log10[η∞(Pa s)] = − 2.93 (Zheng et al., 2011). The fits corresponding to log10[η∞(Pa s)] = − 2.93 are shown in Figure 11, and give values of Tg and mvisc (Figure 12) that are within the spread of values reported in the literature from viscosity measurements (Table 1).
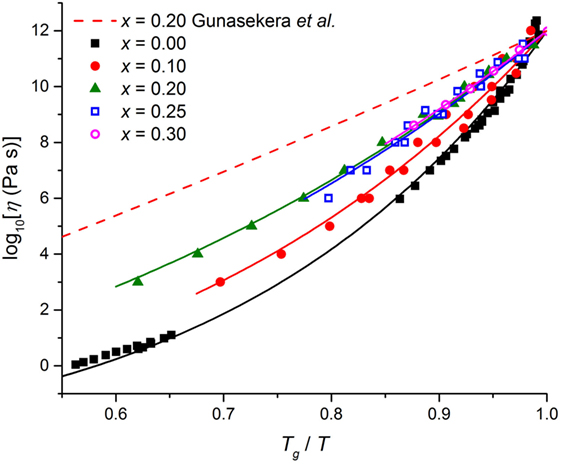
Figure 11. The dependence of log10[η(Pa s)] on the ratio of absolute temperatures Tg/T. The solid curves show fits of the MYEGA model to the measured viscosity data shown by the symbols for Se (Cukierman and Uhlmann, 1973; Koštál and Málek, 2010; Gueguen et al., 2011), Ge0.10Se0.90 (Nemilov, 1964; Senapati and Varshneya, 1996; Gueguen et al., 2011), Ge0.20Se0.80 (Nemilov, 1964; Gueguen et al., 2011), Ge0.25Se0.75 (Nemilov, 1964; Senapati and Varshneya, 1996; Gueguen et al., 2011), or Ge0.30Se0.70 (Gueguen et al., 2011), where the logarithm of the high-temperature viscosity was treated as a fixed parameter set at log10[η∞(Pa s)] = − 2.93 (Zheng et al., 2011). The broken (red) curve shows the prediction at x = 0.20 of the MYEGA model if the fragility index mvisc is equated to mDSC = 17.7 as found in the TMDSC measurements of Gunasekera et al. (2013) (see Figure 12).
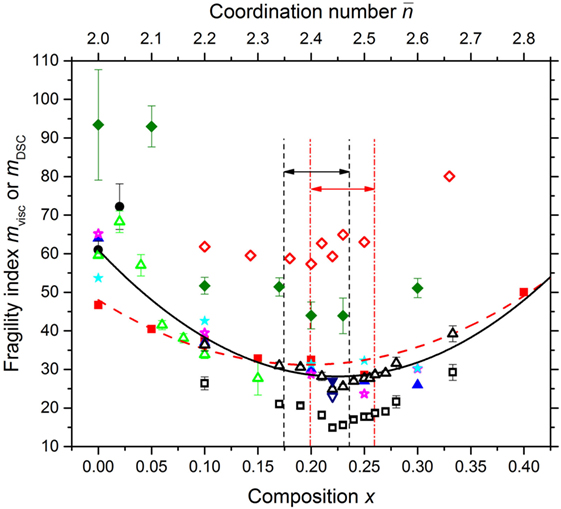
Figure 12. The dependence of the fragility index mvisc or mDSC for the GexSe1− x system on the composition x and mean coordination number . The data points are from the viscosity measurements of Senapati and Varshneya (1996) [solid (red) squares  ], Gueguen et al. (2011) [solid (blue) triangles ] and Svoboda and Málek (2015) [solid (black) circles
  ], or from fits to viscosity data using the MYEGA model with the logarithm of the high-temperature viscosity treated as either a fitting parameter [solid (magenta) stars
  ] or a fixed parameter set at log10[η∞(Pas)] = − 2.93 [solid (cyan) stars
  ]. Least-squares parabolic fits are shown for (i) all of these viscosity derived data points [solid (black) curve] and (ii) solely the mvisc values of Senapati and Varshneya (1996) [broken (red) curve]. The mvisc values estimated from the molecular dynamics work of Yildirim et al. (2016b) are given by the open (red) diamonds
  . Also shown are the mDSC values from Gunasekera et al. (2013) as measured [open (black) squares
  ] or after shifting by 10 units [open (black) triangles Δ]; Svoboda and Málek (2015) [open (green) triangles
  ]; Li et al. (2017) for samples prepared at x = 0.22 using short and long sample reaction times of 34 h [open (blue) downward triangle ▽] versus 192 h [solid (blue) downward triangle
  ]; and Zhao et al. (2013) [solid (green) diamonds
  ]. The pairs of vertical dashed (black) or chained (red) lines, and associated horizonal arrows, mark compositions for which as found in the present work or in the work of Boolchand et al. (2001a), respectively.
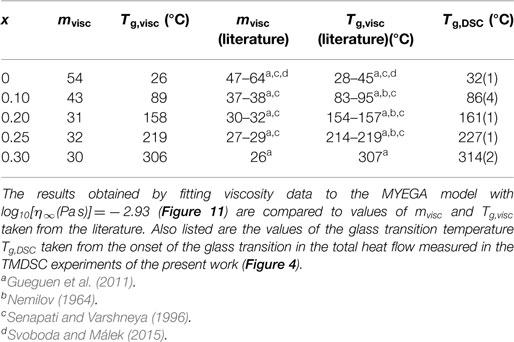
Table 1. The fragility index mvisc and glass transition temperature Tg,visc corresponding to a viscosity η(Tg,visc) = 1012 Pa s.
The measured data sets shown in Figure 12 give a spread in values for the composition dependence of the fragility index. For example, a least-squares parabolic fit to the mvisc values of Senapati and Varshneya (1996) leads to a minimum at x = 0.196(2), whereas a similar fit to all of the mvisc data points leads to a minimum at x = 0.223(2), consistent with the value x = 0.225 previously reported by Stølen et al. (2002). The mDSC values of Gunasekera et al. (2013) are smaller than other values of the fragility index and, for several intermediate phase compositions, are even smaller than the fragility index of silica , where the latter was obtained by applying the MYEGA model to the viscosity data listed by Doremus (2002). A large disparity between mvisc and mDSC is, however, unexpected for strong glass-forming systems: the approximation is expected to become less accurate with increasing fragility because of the use of an Arrhenius approximation in DSC work, where the mDSC values are often smaller than their mvisc counterparts (Zheng et al., 2017). As discussed by Svoboda and Málek (2015), the small mDSC values of Gunasekera et al. (2013) may originate from the exploration of a narrow range of relaxation times in their TMDSC experiments. There may also be an issue in interpreting the imaginary part of the heat capacity signal C″ from TMDSC experiments, which is used to extract mDSC, when it cannot be represented by a single Gaussian function, e.g., when there are two relaxation channels that originate from different structural motifs (Yang et al., 2012; Gulbiten, 2014). A shift in the Gunasekera et al. (2013) mDSC values to better match the fragility index of glassy Ge0.10Se0.90 found in the work by Svoboda and Málek (2015) leads to results that are more consistent with the mDSC values of 23(2)–27(2) measured for Ge0.22Se0.78 by Li et al. (2017), and better match the measured composition dependence of mvisc (Figure 12). In comparison, the mDSC values of Zhao et al. (2013) are larger than expected from the other experimental work, and take minimal values for the range .
Figure 13 shows the composition dependence of the ratio of absolute temperatures Tg/TL, where the composition dependence of TL was taken from a least-squares fit to the data shown in Figure 1 and the composition dependence of Tg was taken from a least-squares fit to the full set of data points shown in Figure 4. These Tg values originate predominantly from DSC experiments (with a few results from dilatometry, indentation and viscosity experiments), and were used as an approximation to the viscosity derived values on account of the sparsity of viscosity measurements for the GexSe1− x system. At compositions for which both glass transition temperatures are available (Table 1), a discrepancy ≲10°C is indicated, corresponding to a fractional uncertainty of ≲5% on the absolute values of Tg. In order to examine the effect on Tg/TL of an uncertainty on Tg, this ratio was also calculated after making a least-squares fit to the Tg,rev values shown in the inset to Figure 4.
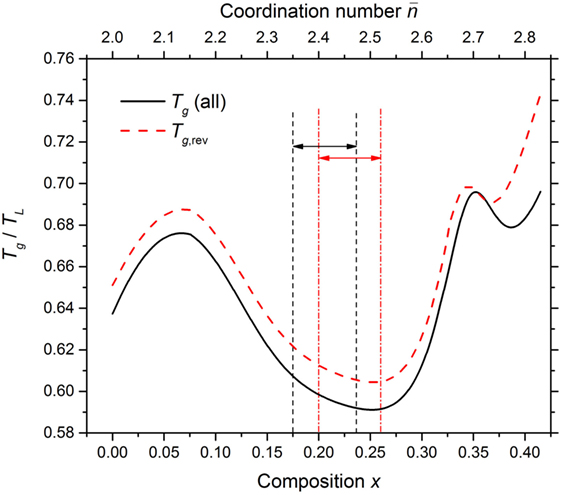
Figure 13. The dependence of the ratio of absolute temperatures Tg/TL for the GexSe1− x system on the composition x and mean coordination number . The TL values were taken from the least-squares fit to the experimental data shown in Figure 1, and the glass transition values were taken from the least-squares fit to either (i) all of the measured Tg values shown in the main panel of Figure 4 or (ii) solely the Tg,rev values shown in the inset to Figure 4. The resultant Tg/TL versus x curves are shown by the solid (black) and broken (red) curves, respectively. The pairs of vertical dashed (black) or chained (red) lines, and associated horizonal arrows, mark compositions for which as found in the present work or in the work of Boolchand et al. (2001a), respectively.
The composition dependence of log10η(TL) as predicted by the MYEGA model with log10[η∞(Pa s)] = − 2.93 is shown in Figure 14, where the ratio Tg/TL was taken from Figure 13 and several different scenarios were investigated for the composition dependence of mvisc (Figure 12). A maximum in log10η(TL) occurs at (i) x = 0.21(1) if mvisc is taken from a fit to all of the viscosity derived data, or (ii) x = 0.21(1) if mvisc is estimated by shifting the mDSC values of Gunasekera et al. (2013) and combining them with the Svoboda and Málek (2015) mDSC values. A maximum in log10η(TL) occurs at (iii) x = 0.22(1) if mvisc is estimated from the unshifted mDSC values of Gunasekera et al. (2013), but the calculated viscosities are several orders of magnitude larger than expected from viscosity measurements (see also Figure 11). A maximum in log10η(TL) occurs at (iv) m = 0.20(1) if mvisc is estimated from the mDSC values of Zhao et al. (2013), but in this case the calculated viscosities are significantly smaller than expected from viscosity measurements. A maximum in log10η(TL) at x ∼ 0.2 is also indicated if mvisc is taken from the fitted values listed in Table 1, but disappears if the composition dependence of mvisc is taken from Senapati and Varshneya (1996).
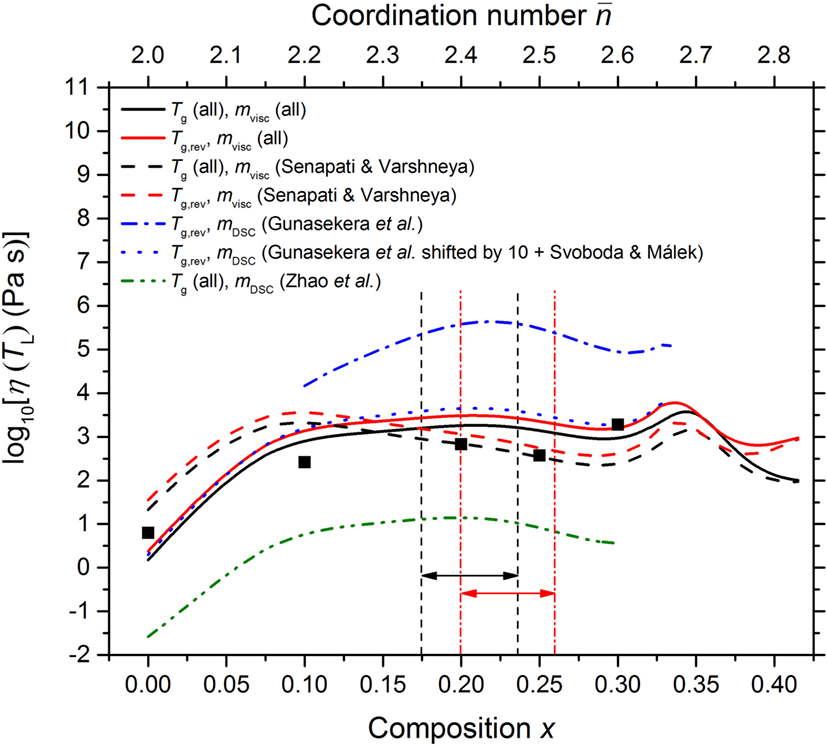
Figure 14. The dependence of log10η(TL) for the GexSe1− x system, as calculated using the MYEGA model with log10[η∞(Pa s)] = − 2.93, on the composition x and mean coordination number . The solid (black) squares correspond to the fitted data sets shown in Figure 11 where the associated mvisc values are listed in Table 1. The solid (black) and solid (red) curves show the results obtained by taking mvisc from the solid (black) curve in Figure 12 and Tg/TL from either the solid (black) or broken (red) curve in Figure 13, respectively. The broken (black) and broken (red) curves show the results obtained by taking mvisc from the broken (red) curve in Figure 12 and Tg/TL from either the solid (black) or broken (red) curve in Figure 13, respectively. The chained (blue) and dotted (blue) curves show the results obtained by taking Tg/TL from the broken (red) curve in Figure 13 and by assuming that , with mDSC either (i) taken from the results of Gunasekera et al. (2013) or (ii) obtained by combining the results of Svoboda and Málek (2015) with the shifted results of Gunasekera et al. (2013) (see Figure 12), respectively. The chained (green) curve shows the results obtained by taking Tg/TL from the solid (black) curve in Figure 13 and by assuming that , with mDSC taken from the results of Zhao et al. (2013). The pairs of vertical dashed (black) or chained (red) lines, and associated horizonal arrows, mark compositions for which as found in the present work or in the work of Boolchand et al. (2001a), respectively.
Recently, Yildirim et al. (2016a,b) used first-principles molecular dynamics simulations to investigate the dynamics of liquid GexSe1− x. By applying the Stokes-Einstein relation to the calculated Ge self-diffusion coefficients, a maximum in the viscosity was found at x ≃0. 22 for the 777°C isotherm, which accompanies a maximum in the structural relaxation time for the α-relaxation regime of the intermediate scattering function at q = 2.1 Å−1. Temperature dependent constraint counting theory, when combined with molecular-dynamics-based constraint-counting algorithms, led to a minimum in the fragility index at this composition. A minimum in the composition dependence of the fragility index at x ≃0. 2 was also found by fitting the high-temperature viscosity data derived from first-principles molecular dynamics simulations to the MYEGA model with the logarithm of the high temperature viscosity set at log10[η∞(Pa s)] = −4 (Yildirim et al., 2016b). The majority of extracted mvisc values are, however, significantly larger than expected from experiment (Figure 12).
6. Discussion
6.1. Glass Structure and Properties
As shown by the inset to Figure 4, the Tg,rev results of the present work are, within the experimental error, the same as those previously measured by Boolchand and coworkers. As shown in Figure 5, the composition range of the intermediate phase found in the present work, 0.175(8) ≤ x ≤ 0.235(8), is centered on the mean-field expectation of a floppy-to-rigid transition at x = 0.20 (Thorpe, 1983), and is therefore shifted to smaller x values as compared to the work of Boolchand and coworkers. As shown in Figure 2, the composition dependence of the density found in the present work is different to that reported by Bhosle et al. (2012b), and more closely matches that measured by other authors.
Bhosle et al. (2012a,b) report a water-induced increase of density that accompanies a decrease in Tg,rev for glasses in the GexSe1− x system. In this way, an attempt was made to rationalize the low density values found in their work as compared to previous investigations (Figure 2). At a given composition, the density measured in the present work is also greater than reported by Bhosle et al. (2012a,b), but the Tg,rev values are the same, e.g., 174(2)°C at x = 0.19 for our sample versus 172(2)°C at x = 0.19 for the (dry) sample of Bhosle et al. (2012a). Also, the infrared spectra for samples made using our procedure do not indicate any water contamination (Section 3.1). Hence, it is difficult to reconcile the large discrepancy in the composition dependence of the glass density between Bhosle et al. (2012b) and previous work (Figure 2) with the presence of water contamination.
In the present work, the absence of a jump in the composition dependence of ΔHnr at the boundaries of the intermediate phase (Figure 5) might be attributed to inhomogeneous glass that originates from the allocation of insufficient time to fully react Ge and Se in the liquid state before quenching to form a glass (Bhosle et al., 2012b). However, GexSe1− x glasses made by using an almost identical rocking-furnace procedure show no evidence of sample heterogeneity (Section 3.1). In the work of Gunasekera et al. (2013), a small fragility index mDSC = 14.8(5) for Ge0.22Se0.78 (Figure 12) might be attributed to the preparation of homogeneous glass after a long reaction time of 144–216 h for samples of mass 2 g. However, systematically larger values of mDSC = 23(2) and mDSC = 27(2) are reported for Ge0.22Se0.78 samples of similar mass (∼1.5 g) prepared using short versus long reaction times of 34 and 192 h, respectively (Li et al., 2017).
The neutron diffraction results of the present work do not show any obvious structural signature of the intermediate phase. For example, they do not support a deviation from the “8-N” rule as reported by Inam et al. (2007) from first-principles molecular dynamics simulations, or a shoulder in the composition dependence of the periodicity 2π/qFSDP as reported by Sharma et al. (2005) from X-ray diffraction experiments. This absence of a structural signature is consistent with the high-energy X-ray diffraction and EXAFS spectroscopy work of Shatnawi et al. (2008), who investigated samples for which for the range .
It is conceivable that a structural signature of the intermediate phase does not manifest itself at the pair-correlation function level, as accessed by diffraction experiments (Fischer et al., 2006). Modeling methods can, however, access information on higher-body correlation functions, and Micoulaut et al. (2013) used first-principles molecular dynamics to investigate the structure of several GexSe1− x glasses with compositions spanning the intermediate phase. Although a compelling structural signature of the intermediate phase was not found, constraint-counting algorithms show that broken bond-bending constraints are associated with the stressed-rigid phases at x = 1/3 and x = 0.40. As shown by Chen et al. (2010a), the electronic structure of a glass may offer evidence of a structural origin for the intermediate phase. By combining first-principles molecular dynamics simulations with the results obtained from X-ray absorption near-edge structure (XANES) experiments made at the K-edge of both Ge and Se, it was suggested that the intermediate phase for GexSe1− x glasses corresponds to a composition range in which there is interplay between regions that are either Se-rich or populated by clustered Ge(Se4)1/2 tetrahedra.
6.2. Comment on the Utility of the Intermediate Phase
The defining feature of the intermediate phase is a composition range where . The physical interpretation of this parameter is debated (Schawe, 1995; Reading, 1997), with Boolchand and coworkers attributing it to the enthalpy of relaxation at Tg (Bhosle et al., 2012a). It is conjectured that glasses within the intermediate phase are stable in the sense that, for different aging times at room temperature, there is no alteration to the total enthalpy change across the glass transition: the reversing part ΔHr does not alter and, unlike the floppy and stressed-rigid phases, the non-reversing part ΔHnr remains vanishingly small (Boolchand et al., 2002; Bhosle et al., 2012b).
By contrast, the change in specific heat capacity Cp across the glass transition, as determined from the total enthalpy change measured in DSC experiments, has been used to monitor the effect on Ge0.10Se0.90 and Ge0.20Se0.80 glass fibers of aging at room temperature for periods of up to 58 months (King, 2011). The results show that glasses within the intermediate phase do relax, although the magnitude of change is markedly smaller for x = 0.20 as compared to x = 0.10. Some of this difference in response may originate from a difference in fictive temperatures: The glass fibers were quenched quickly from the melt and correspond to a high fictive temperature, whereas the samples of, e.g., Bhosle et al. (2012b) were temperature cycled above Tg during a TMDSC experiment before aging at room temperature, and therefore correspond to a low fictive temperature. Some of this difference in response may also originate from the size of the interval between Tg and the annealing temperature Ta, where the former increases with x (Figure 4). Zhao et al. (2013) looked at this issue by employing DSC to monitor the change in total enthalpy for bulk samples of melt-quenched glassy GexSe1− x (0 ≤ x ≤ 0.23) annealed for 1 h at Tg. The samples were subsequently aged for different durations of time with Ta set at a fixed interval below Tg. All of the samples showed the same aging characteristics, including those associated with intermediate phase compositions, with an aging rate and kinetics that depend on the interval Tg − Ta. A Raman spectroscopy investigation of Ge0.20Se0.80, in which a glass equilibrated at Tg = 160°C was subsequently aged at 120°C for a time period ranging from 6 to 240 h, showed structural relaxation with a characteristic timescale of ∼40 h during which there is a conversion from edge-sharing to corner-sharing Ge(Se4)1/2 tetrahedral units (Edwards and Sen, 2011). A conversion from edge-sharing to corner-sharing tetrahedral units was also observed by King (2011) in her Raman spectroscopy work on the aging of Ge0.10Se0.90 and Ge0.20Se0.80 glass fibers at room temperature.
Recently, mDSC values smaller than the fragility index of silica have been reported for glasses within the intermediate phase window, leading to the notion of “super-strong” liquids (Gunasekera et al., 2013). This feature has been attributed to a slow homogenization of the melt when GexSe1− x glasses are prepared via a heating procedure in which elemental Ge and Se pieces are melted in a stationary vertically-mounted silica-ampoule, i.e., when a rocking furnace is not employed (Gunasekera et al., 2013; Bhageria et al., 2014). However, as discussed in Section 5, the numerical values for mDSC reported by Gunasekera et al. (2013) lead to a temperature dependence of the viscosity that is notably different to that expected from viscosity measurements (Figure 11), leading to log10η(TL) values that are significantly larger than expected (Figure 14).
Lastly, it would be helpful if advocates of the intermediate phase could develop a method for predicting its occurrence and composition range for different classes of network glass-forming systems, and the concomitant effect on the material properties. For example, GexSe1− x and AsxSe1− x are prototypical chalcogenide glass-forming systems that feature different network topologies. In the case of GexSe1− x, the intermediate phase window incorporates the composition x = 0.20 for which a rigid to floppy transition is expected on the basis of mean-field constraint counting theory, a minimum in the molar volume is reported for the intermediate phase window (Bhosle et al., 2012b; Bhageria et al., 2014), and the fragility index takes a minimum within this window at around x = 0.22 (Section 5). In the case of AsxSe1− x, however, the intermediate phase window of 0.291(1) ≤ x ≤ 0.37(1) (Georgiev et al., 2000) or 0.20 < x < 0.37 (Ravindren et al., 2014) does not incorporate the mean-field composition of x = 0.40 for a floppy to rigid transition, a minimum in the molar volume may (Ravindren et al., 2014) or may not occur within this composition range (e.g., Feltz et al., 1983 report a minimum at x = 0.40), and a minimum in the fragility index mvisc occurs at (Musgraves et al., 2011).
7. Conclusion
The structure of vitreous GexSe1− x across the glass-forming region was measured by using neutron diffraction. No clear-cut evidence could be found for a structural origin of the intermediate phase, which extends over the composition range 0.175(8) ≤ x ≤ 0.235(8) as found from the non-reversing enthalpy measured using TMDSC. The dynamical properties of the GexSe1− x system were also probed by using the MYEGA model for the viscosity. Much of the available evidence points to a minimum in the fragility index, and a maximum in the viscosity at the liquidus temperature, that occur in the range 0.20 ≤ x ≤ 0.22. This range incorporates the composition x = 0.20 at which a floppy-to-rigid transition is expected from mean-field constraint-counting theory, in contrast to the AsxSe1− x system where a minimum in the fragility index occurs at but a floppy-to-rigid transition is expected from mean-field constraint-counting theory at x = 0.40. In order to establish the extent to which these findings are related to the expectations of mean-field constraint-counting theory, or to a special range of compositions associated with the intermediate phase, it would be beneficial to make a systematic and more complete investigation on the composition dependence of η(T) for the GexSe1− x and other chalcogenide network glass-forming systems.
Data Access Statement
The data sets created during this research are openly available from the University of Bath data archive at https://doi.org/10.15125/BATH-00426.
Author Contributions
PS and AZ designed the research; all authors contributed to the neutron diffraction experiments; AZ and KP performed the TMDSC experiments; AZ and PS analyzed data; PS wrote the article.
Conflict of Interest Statement
The authors declare that the research was conducted in the absence of any commercial or financial relationships that could be construed as a potential conflict of interest.
Acknowledgments
We thank Kamil Wezka for help with some of the diffraction work; Punit Boolchand for advice on using the TMDSC method, and for pointing out the correct reference (Mahadevan et al., 1995) for some of the density data reported in Bhosle et al. (2012b); Pierre Lucas for access to his unpublished results on the homogeneity of chalcogenide glasses prepared by rocking-furnace methods; John Mauro, Doug Allan and Ozgur Gulbiten for helpful discussions about the MYEGA equation and calorimetry; and Tanguy Rouxel for providing the numerical data sets from Gueguen et al. (2011).
Funding
The Bath group received support from the EPSRC via Grant Nos. EP/G008795/1 and EP/J009741/1. AZ and PS are grateful to Corning Inc. for the award of Gordon S. Fulcher Distinguished Scholarships, during which this work was completed. AZ is supported by a Royal Society–EPSRC Dorothy Hodgkin Research Fellowship.
References
Andonov, P. (1982). Studies of non-crystalline forms of selenium. J. Non Cryst. Solids 47, 297–339. doi: 10.1016/0022-3093(82)90209-5
Avetikyan, G. B., and Baidakov, L. A. (1972). Temperature dependence of the density of selenium-enriched glasses of the system Ge-Se and their thermal expansion. Neorg. Mater. 8, 1489–1490.
Awasthi, A. M., and Sampath, S. (2002). Thermo-kinetic anomalies across rigidity threshold in GexSe1− x. Mater. Trans. 43, 2046–2049. doi:10.2320/matertrans.43.2046
Azoulay, R., Thibierge, H., and Brenac, A. (1975). Devitrification characteristics of GexSe1− x glasses. J. Non Cryst. Solids 18, 33–53. doi:10.1016/0022-3093(75)90006-X
Berkes, J. S., and Myers, M. B. (1971). Phase relations and liquid structure in the system As-Sb2Se3-Se. J. Electrochem. Soc. 118, 1485–1491. doi:10.1149/1.2408359
Bhageria, R., Gunasekera, K., Boolchand, P., and Micoulaut, M. (2014). Fragility and molar volumes of non-stoichiometric chalcogenides: the crucial role of melt/glass homogenization. Phys. Status Solidi 251, 1322–1329. doi:10.1002/pssb.201350165
Bhatia, A. B., and Thornton, D. E. (1970). Structural aspects of the electrical resistivity of binary alloys. Phys. Rev. B 2, 3004–3012. doi:10.1103/PhysRevB.2.3004
Bhosle, S., Gunasekera, K., Boolchand, P., and Micoulaut, M. (2012a). Melt homogenization and self-organization in chalcogenides-part I. Int. J. Appl. Glass Sci. 3, 189–204. doi:10.1111/j.2041-1294.2012.00093.x
Bhosle, S., Gunasekera, K., Boolchand, P., and Micoulaut, M. (2012b). Melt homogenization and self-organization in chalcogenides – part II. Int. J. Appl. Glass Sci. 3, 205–220. doi:10.1111/j.2041-1294.2012.00093.x
Boolchand, P. (2000). The maximum in glass transition temperature (Tg) near x = 1/3 in GexSe1− x glasses. Asian J. Phys. 9, 709–721.
Boolchand, P., and Bresser, W. J. (2000). The structural origin of broken chemical order in GeSe2 glass. Philos. Mag. B 80, 1757–1772. doi:10.1080/13642810008216504
Boolchand, P., Chen, P., Jin, M., Goodman, B., and Bresser, W. J. (2007). 129I and 119Sn Mössbauer spectroscopy, reversibility window and nanoscale phase separation in binary GexSe1− x glasses. Physica B Condens. Matter 389, 18–28. doi:10.1016/j.physb.2006.07.009
Boolchand, P., Feng, X., and Bresser, W. J. (2001a). Rigidity transitions in binary Ge-Se glasses and the intermediate phase. J. Non Cryst. Solids 293-295, 348–356. doi:10.1016/S0022-3093(01)00867-5
Boolchand, P., Georgiev, D. G., and Goodman, B. (2001b). Discovery of the intermediate phase in chalcogenide glasses. J. Optoelectron. Adv. Mater. 3, 703–720.
Boolchand, P., Georgiev, D. G., and Micoulaut, M. (2002). Nature of glass transition in chalcogenides. J. Optoelectron. Adv. Mater. 4, 823–836.
Bureau, B., Troles, J., Le Floch, M., Guénot, P., Smektala, F., and Lucas, J. (2003). Germanium selenide glass structures studied by 77Se solid state NMR and mass spectroscopy. J. Non Cryst. Solids 319, 145–153. doi:10.1016/S0022-3093(02)01911-7
Bychkov, E., Benmore, C. J., and Price, D. L. (2005). Compositional changes of the first sharp diffraction peak in binary selenide glasses. Phys. Rev. B 72, 172107. doi:10.1103/PhysRevB.72.172107
Chen, P., Inam, F., and Drabold, D. A. (2010a). Structural origin of the intermediate phase in Ge-Se glasses. Appl. Phys. Lett. 97, 131901. doi:10.1063/1.3495775
Chen, P., Boolchand, P., and Georgiev, D. G. (2010b). Long term aging of selenide glasses: evidence of sub-Tg endotherms and pre-Tg exotherms. J. Phys. Condens. Matter 22, 065104. doi:10.1088/0953-8984/22/6/065104
Cukierman, M., and Uhlmann, D. R. (1973). Viscous flow behaviour of selenium. J. Non Cryst. Solids 12, 199–206. doi:10.1016/0022-3093(73)90069-0
Dembovskii, S. A., Vinogradova, G. Z., and Pashinkin, A. S. (1965). Crystallisation of glasses of the Ge-Se system. Russ. J. Inorg. Chem. 10, 903–905.
Edwards, T. G., and Sen, S. (2011). Structure and relaxation in germanium selenide glasses and supercooled liquids: a Raman spectroscopic study. J. Phys. Chem. B 115, 4307–4314. doi:10.1021/jp202174x
Feltz, A., Aust, H., and Blayer, A. (1983). Glass formation and properties of chalcogenide systems XXVI: permittivity and the structure of glasses AsxSe1− x and GexSe1− x. J. Non Cryst. Solids 55, 179–190. doi:10.1016/0022-3093(83)90667-1
Feltz, A., and Lippmann, F.-J. (1973). Zur glasbildung im system germanium-selen. Z. Anorg. Allg. Chem. 398, 157–166. doi:10.1002/zaac.19733980208
Feng, X., Bresser, W. J., and Boolchand, P. (1997). Direct evidence for stiffness threshold in chalcogenide glasses. Phys. Rev. Lett. 78, 4422–4425. doi:10.1103/PhysRevLett.78.4422
Fischer, H. E., Barnes, A. C., and Salmon, P. S. (2006). Neutron and x-ray diffraction studies of liquids and glasses. Rep. Prog. Phys. 69, 233–299. doi:10.1088/0034-4885/69/1/R05
Georgiev, D. G., Boolchand, P., and Micoulaut, M. (2000). Rigidity transition and molecular structure of AsxSe1− x glasses. Phys. Rev. B 62, R9228–R9231. doi:10.1103/PhysRevB.62.R9228
Gueguen, Y., Rouxel, T., Gadaud, P., Bernard, C., Keryvin, V., and Sangleboeuf, J.-C. (2011). High-temperature elasticity and viscosity of GexSe1− x glasses in the transition range. Phys. Rev. B 84, 064201. doi:10.1103/PhysRevB.84.064201
Guin, J.-P., Rouxel, T., Keryvin, V., Sangleboeuf, J.-C., Serre, I., and Lucas, J. (2002a). Indentation creep of Ge-Se chalcogenide glasses below Tg: elastic recovery and non-Newtonian flow. J. Non Cryst. Solids 298, 260–269. doi:10.1016/S0022-3093(01)01053-5
Guin, J.-P., Rouxel, T., Sangleboeuf, J.-C., Melscoët, I., and Lucas, J. (2002b). Hardness, toughness, and sctratchability of germanium-selenium chalcogenide glasses. J. Am. Ceram. Soc. 85, 1545–1552. doi:10.1111/j.1151-2916.2002.tb00310.x
Gulbiten, O. (2014). An Investigation of Dynamic Processes in Selenium Based Chalcogenide Glasses. Ph.D. Thesis, Tucson: University of Arizona.
Gulbiten, O., Mauro, J. C., and Lucas, P. (2013). Relaxation of enthalpy fluctuations during sub-Tg annealing of glassy selenium. J. Chem. Phys. 138, 244504. doi:10.1063/1.4811488
Gunasekera, K., Bhosle, S., Boolchand, P., and Micoulaut, M. (2013). Superstrong nature of covalently bonded glass-forming liquids at select compositions. J. Chem. Phys. 139, 164511. doi:10.1063/1.4826463
Hafiz, M. M., Hammad, F. H., and El-Kabany, N. A. (1993). Short- and medium-range order in Se-Ge glassy systems (I) effect of composition. Physica B Condens. Matter 183, 392–398. doi:10.1016/0921-4526(93)90130-X
Hannon, A. C. (2005). Results on disordered materials from the GEneral Materials diffractometer, GEM, at ISIS. Nucl. Instrum. Methods Phys. Res. A 551, 88–107. doi:10.1016/j.nima.2005.07.053
Hosokawa, S. (2001). Atomic and electronic structures of glassy GexSe1− x around the stiffness threshold composition. J. Optoelectron. Adv. Mater. 3, 199–214.
Hosokawa, S., Oh, I., Sakurai, M., Pilgrim, W.-C., Boudet, N., Bérar, J.-F., et al. (2011). Anomalous x-ray scattering study of GexSe1− x glassy alloys across the stiffness transition composition. Phys. Rev. B 84, 014201. doi:10.1103/PhysRevB.84.014201
Hosokawa, S., Wang, Y., Bérar, J.-F., Sakurai, M., and Pilgrim, W.-C. (2003). Anomalous x-ray scattering studies on glassy GexSe1− x over a wide concentration range including the stiffness transition composition. J. Non Cryst. Solids 326-327, 394–398. doi:10.1016/S0022-3093(03)00445-9
Howe, M. A., McGreevy, R. L., and Howells, W. S. (1989). The analysis of liquid structure data from time-of-flight neutron diffractometry. J. Phys. Condens. Matter 1, 3433–3451. doi:10.1088/0953-8984/1/22/005
Inam, F., Shatnawi, M. T., Tafen, D., Billinge, S. J. L., Chen, P., and Drabold, D. A. (2007). An intermediate phase in GexSe1− x glasses: experiment and simulation. J. Phys. Condens. Matter 19, 455206. doi:10.1088/0953-8984/19/45/455206
Ipser, H., Gambino, M., and Schuster, W. (1982). The germanium-selenium phase diagram. Monatshefte Chemie 113, 389–398. doi:10.1007/BF00799914
Ito, Y., Kashida, S., and Murase, K. (1988). Elastic constants of the chalcogenide glasses (GexSe1− x, AsySe1− y and Ge2/3 zAs1/3 zSe1− z). Solid State Commun. 65, 449–452. doi:10.1016/0038-1098(88)90431-0
Johnson, R. W., Susman, S., McMillan, J., and Volin, K. J. (1986). Preparation and characterization of SixSe1− x glasses and determination of the equilibrium phase diagram. Mater. Res. Bull. 21, 41–47. doi:10.1016/0025-5408(86)90027-9
King, E. A. (2011). Structure and Relaxation in Germanium Selenide and Arsenic Selenide Glasses. Ph.D. Thesis, Tucson: University of Arizona.
Koštál, P., and Málek, J. (2010). Viscosity of selenium melt. J. Non Cryst. Solids 356, 2803–2806. doi:10.1016/j.jnoncrysol.2010.09.032
Li, P., Zhang, Y., Chen, Z., Gao, P., Wu, T., and Wang, L.-M. (2017). Relaxation dynamics in the strong chalcogenide glass-former of Ge22Se78. Sci. Rep. 7, 40547. doi:10.1038/srep40547
Loehman, R. E., Armstrong, A. J., Firestone, D. W., and Gould, R. W. (1972). Composition and physical properties of amorphous bulk and thin film materials in the system Ge-Se-Te-As. J. Non Cryst. Solids 8-10, 72–77. doi:10.1016/0022-3093(72)90119-6
Lucas, P., Doraiswamy, A., and King, E. A. (2003). Photoinduced structural relaxation in chalcogenide glasses. J. Non Cryst. Solids 332, 35–42. doi:10.1016/j.jnoncrysol.2003.09.008
Lucas, P., King, E. A., Gulbiten, O., Yarger, J. L., Soignard, E., and Bureau, B. (2009). Bimodal phase percolation model for the structure of Ge-Se glasses and the existence of the intermediate phase. Phys. Rev. B 80, 214114. doi:10.1103/PhysRevB.80.214114
Mahadevan, S., Giridhar, A., and Singh, A. K. (1995). Chemical ordering and topological effects in chalcogenide glass systems. Indian J. Pure Appl. Phys. 33, 643–652.
Massobrio, C., Celino, M., Salmon, P. S., Martin, R. A., Micoulaut, M., and Pasquarello, A. (2009). Atomic structure of the two intermediate phase glasses SiSe4 and GeSe4. Phys. Rev. B 79, 174201. doi:10.1103/PhysRevB.79.174201
Mauro, J. C., Yue, Y., Ellison, A. J., Gupta, P. K., and Allan, D. C. (2009). Viscosity of glass-forming liquids. Proc. Natl. Acad. Sci. U.S.A. 106, 19780–19784. doi:10.1073/pnas.0911705106
Micoulaut, M., Kachmar, A., Bauchy, M., Le Roux, S., Massobrio, C., and Boero, M. (2013). Structure, topology, rings, and vibrational and electronic properties of GexSe1− x glasses across the rigidity transition: a numerical study. Phys. Rev. B 88, 054203. doi:10.1103/PhysRevB.88.054203
Mikolaichuk, A. G., and Moroz, V. N. (1986). Chemical interaction and glass formation in the system Ag8GeSe6-GeSe-GeSe2. Fizika Khimiia Stekla 12, 717–719.
Morgant, G., and Legendre, B. (1986). Etude du systeme binaire selenium-tellure. J. Therm. Anal. 31, 377–385. doi:10.1007/BF01911070
Musgraves, J. D., Wachtel, P., Novak, S., Wilkinson, J., and Richardson, K. (2011). Composition dependence of the viscosity and other physical properties in the arsenic selenide glass system. J. Appl. Phys. 110, 063503. doi:10.1063/1.3638122
Nemilov, S. V. (1964). Viscosity and structure of glass system Se-Ge. Zh. Prikl. Khim. 37, 1020–1024.
Ota, R., and Kunugi, M. (1973). Thermal expansion coefficient and glass transition temperature for As-Se glasses. J. Ceram. Assoc. Jpn 81, 228–231. doi:10.2109/jcersj1950.81.934_228
Ota, R., Yamate, T., Soga, N., and Kunugi, M. (1978). Elastic properties of Ge-Se glass under pressure. J. Non Cryst. Solids 29, 67–76. doi:10.1016/0022-3093(78)90141-2
Petri, I., Salmon, P. S., and Fischer, H. E. (2000). Defects in a disordered world: the structure of glassy GeSe2. Phys. Rev. Lett. 84, 2413–2416. doi:10.1103/PhysRevLett.84.2413
Petri, I., Salmon, P. S., and Howells, W. S. (1999). Change in the topology of the glass forming liquid GeSe2 with increasing temperature. J. Phys. Condens. Matter 11, 10219–10227. doi:10.1088/0953-8984/11/50/314
Phillips, J. C. (1979). Topology of covalent non-crystalline solids I: short-range order in chalcogenide alloys. J. Non Cryst. Solids 34, 153–181. doi:10.1016/0022-3093(79)90033-4
Quenez, P., and Khodadad, P. (1969). Étude du système GeSe2-CdSe. Identification du composé Cd4GeSe6. C. R. Acad. Sci. 268, 2294–2297.
Ramesh Rao, N., Krishna, P. S. R., Basu, S., Dasannacharya, B. A., Sangunni, K. S., and Gopal, E. S. R. (1998). Structural correlations in GexSe1− x glasses – a neutron diffraction study. J. Non Cryst. Solids 240, 221–231. doi:10.1016/S0022-3093(98)00705-4
Ravindren, S., Gunasekera, K., Tucker, Z., Diebold, A., Boolchand, P., and Micoulaut, M. (2014). Crucial effect of melt homogenization on the fragility of non-stoichiometric chalcogenides. J. Chem. Phys. 140, 134501. doi:10.1063/1.4869107
Reading, M. (1997). Comments on “A comparison of different evaluation methods in modulated-temperature DSC”. Thermochim. Acta 292, 179–187. doi:10.1016/S0040-6031(96)03109-7
Ross, L., and Bourgon, M. (1969). The germanium-selenium phase diagram. Can. J. Chem. 47, 2555–2559. doi:10.1139/v69-422
Salmon, P. S. (1992). The structure of molten and glassy 2:1 binary systems: an approach using the Bhatia-Thornton formalism. Proc. R. Soc. Lond. A Math. Phys. Sci. 437, 591–606. doi:10.1098/rspa.1992.0081
Salmon, P. S. (1994). Real space manifestation of the first sharp diffraction peak in the structure factor of liquid and glassy materials. Proc. R. Soc. Lond. A Math. Phys. Sci. 445, 351–365. doi:10.1098/rspa.1994.0065
Salmon, P. S. (2006). Decay of the pair correlations and small-angle scattering for binary liquids and glasses. J. Phys. Condens. Matter 18, 11443–11469. doi:10.1088/0953-8984/18/50/004
Salmon, P. S. (2007a). Structure of liquids and glasses in the Ge-Se binary system. J. Non Cryst. Solids 353, 2959–2974. doi:10.1016/j.jnoncrysol.2007.05.152
Salmon, P. S. (2007b). The structure of tetrahedral network glass forming systems at intermediate and extended length scales. J. Phys. Condens. Matter 19, 455208. doi:10.1088/0953-8984/19/45/455208
Salmon, P. S., Barnes, A. C., Martin, R. A., and Cuello, G. J. (2006). Glass fragility and atomic ordering on the intermediate and extended range. Phys. Rev. Lett. 96, 235502. doi:10.1103/PhysRevLett.96.235502
Salmon, P. S., and Liu, J. (1994). The relation between the melt topology and glass-forming ability for liquid Ge-Se alloys. J. Phys. Condens. Matter 6, 1449–1460. doi:10.1088/0953-8984/6/8/004
Salmon, P. S., Martin, R. A., Mason, P. E., and Cuello, G. J. (2005). Topological versus chemical ordering in network glasses at intermediate and extended length scales. Nature 435, 75–78. doi:10.1038/nature03475
Salmon, P. S., and Petri, I. (2003). Structure of glassy and liquid GeSe2. J. Phys. Condens. Matter 15, S1509–S1528. doi:10.1088/0953-8984/15/16/301
Salmon, P. S., and Zeidler, A. (2013). Identifying and characterising the different structural length scales in liquids and glasses: an experimental approach. Phys. Chem. Chem. Phys. 15, 15286–15308. doi:10.1039/c3cp51741a
Sarrach, D. J., De Neufville, J. P., and Haworth, W. L. (1976). Studies of amorphous Ge-Se-Te alloys (I): preparation and calorimetric observations. J. Non Cryst. Solids 22, 245–267. doi:10.1016/0022-3093(76)90057-0
Sartbaeva, A., Wells, S. A., Huerta, A., and Thorpe, M. F. (2007). Local structural variability and the intermediate phase window in network glasses. Phys. Rev. B 74, 224204. doi:10.1103/PhysRevB.75.224204
Savage, J. A., and Nielsen, S. (1965). Chalcogendide glasses transmitting in the infrared between 1 and 20 μ – a state of the art review. Infrared Phys. 5, 195–204. doi:10.1016/0020-0891(65)90023-0
Schawe, J. E. K. (1995). A comparison of different evaluation methods in modulated temperature DSC. Thermochim. Acta 260, 1–16. doi:10.1016/0040-6031(95)90466-2
Sears, V. F. (1992). Neutron scattering lengths and cross sections. Neutron News 3, 26–37. doi:10.1080/10448639208218770
Senapati, U., and Varshneya, A. K. (1995). Configurational arrangements in chalcogenide glasses: a new perspective on Phillips’ constraint theory. J. Non Cryst. Solids 185, 289–296. doi:10.1016/0022-3093(94)00534-6
Senapati, U., and Varshneya, A. K. (1996). Viscosity of chalcogenide glass-forming liquids: an anomaly in the ‘strong’ and ‘fragile’ classification. J. Non Cryst. Solids 197, 210–218. doi:10.1016/0022-3093(95)00628-1
Sharma, D., Sampath, S., Lalla, N. P., and Awasthi, A. M. (2005). Mesoscopic organization and structural phases in network-forming GexSe1− x glasses. Phys. B 357, 290–298. doi:10.1016/j.physb.2004.11.078
Shatnawi, M. T. M., Farrow, C. L., Chen, P., Boolchand, P., Sartbaeva, A., Thorpe, M. F., et al. (2008). Search for a structural response to the intermediate phase in GexSe1− x glasses. Phys. Rev. B 77, 094134. doi:10.1103/PhysRevB.77.094134
Soper, A. K. (1991). “First results from SANDALS – the Small Angle Neutron Diffractometer for Amorphous and Liquid Samples at ISIS,” in Proceedings of the Eleventh Meeting of the International Collaboration on Advanced Neutron Sources ICANS-XI, Vol. II, eds M. Misawa, M. Furusaka, H. Ikeda, and N. Watanabe (Tsukuba, Japan), 809–819. KEK Report 90–25.
Soper, A. K. (2011). GudrunN and GudrunX: Programs for Correcting Raw Neutron and X-Ray Diffraction Data to Differential Scattering Cross Section. RAL-TR-2011-013. Rutherford Appleton Laboratory Technical Report.
Sreeram, A. N., Swiler, D. R., and Varshneya, A. K. (1991a). Gibbs-DiMarzio equation to describe the glass transition temperature trends in multicomponent chalcogenide glasses. J. Non Cryst. Solids 127, 287–297. doi:10.1016/0022-3093(91)90481-K
Sreeram, A. N., Varshneya, A. K., and Swiler, D. R. (1991b). Molar volume and elastic properties of multicomponent chalcogenide glasses. J. Non Cryst. Solids 128, 294–309. doi:10.1016/0022-3093(91)90467-K
Stølen, S., Grande, T., and Johnsen, H.-B. (2002). Fragility transition in GeSe2-Se liquids. Phys. Chem. Chem. Phys. 4, 3396–3399. doi:10.1039/b201396g
Stølen, S., Johnsen, H. B., Bøe, C. S., Grande, T., and Karlsen, O. B. (1999). Stable and metastable phase equilibria in the GeSe2-Se system. J. Phase Equilibria 20, 17–28. doi:10.1361/105497199770335901
Svoboda, R., and Málek, J. (2015). Kinetic fragility of Se-based binary chalcogenide glasses. J. Non Cryst. Solids 419, 39–44. doi:10.1016/j.jnoncrysol.2015.01.021
Thorpe, M. F. (1983). Continuous deformations in random networks. J. Non Cryst. Solids 57, 355–370. doi:10.1016/0022-3093(83)90424-6
Thorpe, M. F., Jacobs, D. J., Chubynsky, M. V., and Phillips, J. C. (2000). Self-organization in network glasses. J. Non Cryst. Solids 266-269, 859–866. doi:10.1016/S0022-3093(99)00856-X
Wagner, T., Kasap, S. O., and Maeda, K. (1997). Glass transformation, heat capacity, and structure of GexSe100− x glasses studied by temperature-modulated differential scanning calorimetry experiments. J. Mater. Res. 12, 1892–1899. doi:10.1557/JMR.1997.0259
Wang, F., Boolchand, P., and Micoulaut, M. (2000). Glass structure, rigidity transitions and the intermediate phase in the Ge-As-Se ternary. Europhys. Lett. 52, 633–639. doi:10.1209/epl/i2000-00485-9
Wang, Y., Ohata, E., Hosokawa, S., Sakurai, M., and Matsubara, E. (2004). Intermediate-range order in glassy GexSe1− x around the stiffness transition composition. J. Non Cryst. Solids 337, 54–61. doi:10.1016/j.jnoncrysol.2004.03.101
Wang, F., Mamedov, S., Boolchand, P., Goodman, B., and Chandrasekhar, M. (2005). Pressure Raman effects and internal stress in network glasses. Phys. Rev. B 71, 174201. doi:10.1103/PhysRevB.71.174201
Yang, G., Gueguen, Y., Sangleboeuf, J.-C., Rouxel, T., Boussard-Plédel, C., Troles, J., et al. (2013). Physical properties of the GexSe1− x glasses in the 0 < x < 0.42 range in correlation with their structure. J. Non Cryst. Solids 377, 54–59. doi:10.1016/j.jnoncrysol.2013.01.049
Yang, Y., Gulbiten, O., Gueguen, Y., Bureau, B., Sangleboeuf, J.-C., Roiland, C., et al. (2012). Fragile-strong behavior in the AsxSe1− x glass forming system in relation to structural dimensionality. Phys. Rev. B 85, 144107. doi:10.1103/PhysRevB.85.144107
Yildirim, C., Raty, J.-Y., and Micoulaut, M. (2016a). Revealing the role of molecular rigidity on the fragility evolution of glass-forming liquids. Nat. Commun. 7, 11086. doi:10.1038/ncomms11086
Yildirim, C., Raty, J.-Y., and Micoulaut, M. (2016b). Anomalous diffusion and non-monotonic relaxation processes in Ge-Se liquids. J. Chem. Phys. 144, 224503. doi:10.1063/1.4953077
Zeidler, A., and Salmon, P. S. (2016). Pressure-driven transformation of the ordering in amorphous network-forming materials. Phys. Rev. B 93, 214204. doi:10.1103/PhysRevB.93.214204
Zhao, H. Y., Koh, Y. P., Pyda, M., Sen, S., and Simon, S. L. (2013). The kinetics of the glass transition and physical aging in germanium selenide glasses. J. Non Cryst. Solids 368, 63–70. doi:10.1016/j.jnoncrysol.2013.02.025
Zheng, Q., Mauro, J. C., Ellison, A. J., Potuzak, M., and Yue, Y. (2011). Universality of the high-temperature viscosity limit of silicate liquids. Phys. Rev. B 83, 212202. doi:10.1103/PhysRevB.83.212202
Zheng, Q., Mauro, J. C., and Yue, Y. (2017). Reconciling calorimetric and kinetic fragilities of glass-forming liquids. J. Non Cryst. Solids 456, 95–100. doi:10.1016/j.jnoncrysol.2016.11.014
Keywords: chalcogenide glass, neutron diffraction, viscosity, fragility index, intermediate phase, material properties
Citation: Zeidler A, Salmon PS, Whittaker DAJ, Pizzey KJ and Hannon AC (2017) Topological Ordering and Viscosity in the Glass-Forming Ge–Se System: The Search for a Structural or Dynamical Signature of the Intermediate Phase. Front. Mater. 4:32. doi: 10.3389/fmats.2017.00032
Received: 28 August 2017; Accepted: 16 October 2017;
Published: 13 November 2017
Edited by:
Lothar Wondraczek, Friedrich-Schiller-Universität Jena, GermanyReviewed by:
David Sidebottom, Creighton University, United StatesYann Gueguen, University of Rennes 1, France
Copyright: © 2017 Zeidler, Salmon, Whittaker, Pizzey and Hannon. This is an open-access article distributed under the terms of the Creative Commons Attribution License (CC BY). The use, distribution or reproduction in other forums is permitted, provided the original author(s) or licensor are credited and that the original publication in this journal is cited, in accordance with accepted academic practice. No use, distribution or reproduction is permitted which does not comply with these terms.
*Correspondence: Philip S. Salmon, cC5zLnNhbG1vbkBiYXRoLmFjLnVr