 Marco Miniaci1,2*
 Matteo Mazzotti3Maciej Radzieński2Pawel Kudela2Nesrine Kherraz4
 Federico Bosia4
 Nicola M. Pugno5,6,7Wieslaw Ostachowicz2
- 1EMPA, Laboratory of Acoustics and Noise Control, Dübendorf, Switzerland
- 2Institute of Fluid-Flow Machinery, Polish Academy of Science, Gdańsk, Poland
- 3Civil, Architectural & Environmental Engineering (CAEE) Department, Drexel University, Philadelphia, PA, United States
- 4Department of Physics and Nanostructured Interfaces and Surfaces Centre, University of Torino, Torino, Italy
- 5Laboratory of Bio-Inspired and Graphene Nanomechanics, Department of Civil, Environmental and Mechanical Engineering, University of Trento, Trento, Italy
- 6School of Engineering and Materials Science, Queen Mary University of London, London, United Kingdom
- 7Ket Lab, Edoardo Amaldi Foundation, Rome, Italy
Non-destructive testing and structural health monitoring (SHM) techniques using elastic guided waves are often limited by material inhomogeneity or geometrical irregularities of the tested parts. This is a severe restriction in many fields of engineering such as aerospace or aeronautics, where typically one needs to monitor composite structures with varying mechanical properties and complex geometries. This is particularly true in the case of multiscale composite materials, where anisotropy and material gradients may be present. Here, we provide an impact localization algorithm based on time reversal and laser vibrometry to cope with this type of complexity. The proposed approach is shown to be insensitive to local elastic wave velocity or geometrical features. The technique is based on the correlation of the measured impact response and a set of measured test data acquired at various grid points along the specimen surface, allowing high resolution in the determination of the impact point. We present both numerical finite element simulations and experimental measurements to support the proposed procedure, showing successful implementation on an eccentrically stiffened aluminum plate. The technique holds promise for advanced SHM, potentially in real time, of geometrically complex composite structures.
1. Introduction
Assessment of the integrity of structural components is of great importance for aerospace vehicles and systems, for land and marine transportation, for civil infrastructures, for the oil industry as well as for other biological and mechanical applications (Grandt, 2004). It is well-known that accidental impacts may generate hidden damage in structures, which can develop under cyclic loading, until it endangers the integrity of the whole structure. In some cases, propagation of undetected damage can be the cause of the structural failure. One of the most well-known cases of this occurred when the composite tile on the leading edge of the wing of the Space Shuttle Columbia fractured due to impact with a piece of foam insulation, leading to a catastrophic failure of the whole vehicle on February 1, 2003 (NASA, 2003).
In order to prevent this scenario, the capability to identify impacts and then to monitor potential damage evolution in the neighborhood of the impact is of crucial importance. With this in mind, the use of Structural Health Monitoring (SHM) approaches based on guided elastic waves driven by a network of piezoelectric transducers has attracted the interest of several researchers in recent decades (Ostachowicz et al., 2011).
For isotropic plates, several techniques, known as hyperbolic approaches, have been proposed for impact localization over the years, the majority of which locate the point of impact after detecting the acoustic emission signal generated by the impact event using at least three sensors and applying standard or modified triangulation techniques (De Marchi et al., 2011). When the assumption of isotropy is removed, the standard triangulation technique fails and alternative methods need to be used. Various approaches for anisotropic (Kundu et al., 2012) and inhomogeneous plate-like (Hajzargerbashi et al., 2011) structures have been proposed, including threshold-based procedures (Kundu et al., 2009), peak detection techniques (Tracy and Chang, 1998; Seydel and Chang, 2001) and cross-correlation schemes (White, 1969). However, these methods are predictive on regular geometries whereas the presence of stiffeners, rivets, and other geometrical irregularities, reduce their diagnostic potential.
To overcome these difficulties, other approaches based on direct strategies and inverse methods have recently been proposed. While the first type requires ad-hoc designed transducers (Salamone et al., 2010; Senesi et al., 2010; Baravelli et al., 2013; De Marchi et al., 2018), the second makes use of a database of responses generated by impacts (Staszewski et al., 2000; Coverley and Staszewski, 2003; Park J. et al., 2009; Ciampa and Meo, 2012). In this context, Park et. al. recently proposed a new impact localization algorithm based on time reversal (TR) and scanning laser Doppler vibrometer (SLDV) measurements applied to Lamb waves (Park et al., 2012). The use of TR in Lamb wave applications was first explored by Ing and Fink (1988, 1996) and later extensively used both for damage detection in plates (Wang et al., 2004; Park et al., 2007; Gliozzi et al., 2015; Miniaci et al., 2017) and for impact localization (Sohn et al., 2011; Park et al., 2012). Lamb waves are extensively involved in plate-like structures for non-invasive inspection because of their guided nature allowing for large area inspection. However, their dispersion often limits their use because of the complex waveform of acquired signals since pulse distortion occurs due to the variation of modal group velocities. Because of this the received signals are often difficult to interpret (Ostachowicz et al., 2011) and TR becomes an attractive tool to overcome the problem of dispersion in guided elastic waves. This technique only requires minimal prior knowledge of the monitored structures and no specific information relative to the properties of the propagating medium (Ing and Fink, 1988; Park et al., 2007).
In this work, the procedure proposed in Park et al. (2012) is applied to locate simulated impacts in a reinforced aluminum plate. Although in general, the larger the number of transducers used for the collection of the training data, the smaller the variation in the localization performance is, we show that in our case a single piezoelectric transducer is sufficient to achieve adequate training data capable of unambiguously providing the impact location with good accuracy. This is possible thanks to the relatively small irregularity of the location surrounding the transducer and to the possibility of thoroughly cleaning the bonding surface and thus properly gluing the transducer to the specimen.
2. A Time-Reversal Based Procedure for Impact Location
2.1. Time-Reversal Basic Principles
The concept of TR applied to Lamb waves is here briefly recalled with the support of Figure 1. Elastic guided waves are excited into a plate-like structure by means of a tone burst signal UD(t) at point A (the subscript D is used to distinguish the signal in the direct propagation phase from the reconstructed one, named D,r, in a time reversal experiment). This elastic wave propagates from A to B in the plate where it is recorded as Uacq(t). This signal can be then time inverted Uacq(−t) and used as the input signal in B. The final stage is to acquire the corresponding signal UD,r(−t) in A again.
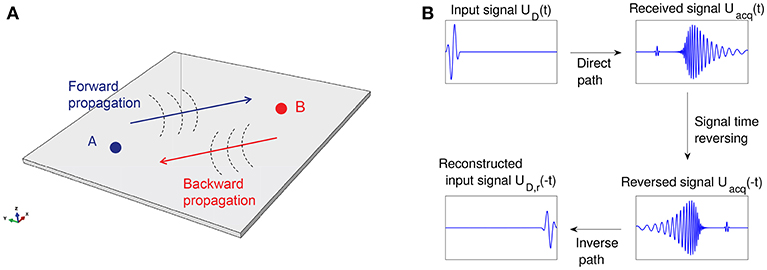
Figure 1. (A) Schematic representation of time reversal (TR) procedure for Lamb waves in a plate-like structure. (B) A tone burst excitation UD(t) is provided at point A, generating elastic guided waves in the plate that are recorded as Uacq(t) in B. This acquired signal is then time-inverted as Uacq(−t) and used as the input signal in B. The acquired signal at point A is the inverted reconstruction UD,r(−t) of the original signal.
If the source is point-like, TR allows to focus back to the source irrespective of the medium complexity (Cassereau and Fink, 1992; Fink, 1992; Wu et al., 1992). Spatial reciprocity is not broken by velocity dispersion, multiple scattering, mode conversion, anisotropy, refraction or attenuation, as long as the latter is linear with respect to the wave amplitude. This remains true even if the propagation medium is inhomogeneous with variations of density and stiffness which reflect, scatter, and refract the acoustic waves. On the contrary, non-linear elastic effects may break spatial reciprocity (and therefore focusing through TR), as do those effects that lead to wave velocity variations along the direct and inverse propagation paths (Park H.W. et al., 2009). Contrary to the case of bulk waves, TR of Lamb waves is complicated by their dispersion and multi-modal nature (Park H.W. et al., 2009).
2.2. Procedure Description
In what follows the impact localization algorithm originally proposed by Park et al. (2012) is briefly recalled.
First, Lamb guided waves are excited in the specimen under test by means of a surface-mounted piezoelectric (PZT) transducer (red circle in Figure 2A) reproducing an impact-like time-history (a square signal, for instance). A training data set of signals gi(t), with i = 1, 2, …, m (Figure 2B), is then collected recording the out-of-plane velocity at the desired m points with a Scanning Laser Vibrometer, denoted in Figure 2A with black dots within the target scanning area bounded by the red dashed line.
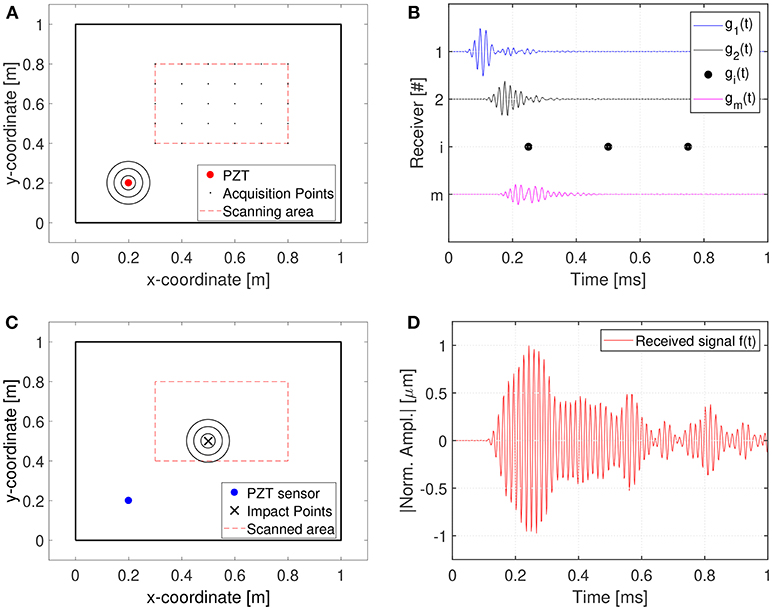
Figure 2. Schematics of the proposed technique for impact localization: (A) scanning area; (B) training data set acquisition; (C) actual impact event; (D) actual impact Impulse Response Function (IRF).
Now let us suppose that the structure is subjected to an impact within the scanned area (Figure 2C) and that the guided waves response f(t) is recorded by the same piezoelectric used to generate the training dataset (Figure 2D). At this point, the correlations between the actual impact response f(t) and the responses of the training data set gi(t) are computed. Because of the dispersion of Lamb waves, without any numerical manipulation the correlation is very poor, since the compared signals are completely different. However, it can be mathematically shown that if the correlation is written as a function of inverted signal (being T the duration of the acquired signal), the gi(t) with maximum correlation to the actual impact response f(t) can be used to identify the impact location. The correlation correlation between f(t) and g(t) is defined as follows (see Park et al., 2012; Miniaci, 2014 for further details):
where ⋆ denotes the correlation operation. On the other hand, the convolution of two functions is defined as:
where ⊗ is the convolution operation. Comparison between Equations (1, 2) reveals that the correlation and convolution are related to each other as follows:
Equation (3) shows that the correlation between two signals is mathematically equivalent to the convolution between one and the time-reversed version of the other one. By applying the Fourier transform, the convolution in the time domain is transformed into a simple multiplication in the frequency domain:
where denotes the Fourier transform operator. The convolution is reconstructed by taking the inverse Fourier transform of Equation (4):
Since this new expression involves only Fourier and inverse Fourier transforms and point-wise multiplications, the correlation or convolution can be computed effectively:
The maximum correlation value, obtained using Equation (6) is designated as the most likely impact point (Park et al., 2012).
3. Impact Localization: Numerical and Experimental Results
3.1. Description of the Tested Specimen
The reviewed impact localization algorithm is tested on a reinforced aluminum plate, schematically shown in Figures 3A,B. The specimen is 1, 000 mm in length and 1, 000 mm in width. It is composed of a flat aluminum 1-mm thick plate reinforced by two unidirectional eccentric stiffeners with L cross-section. The width of both the web and the flange of the stiffeners is 3 mm. The stiffeners are parallel to the specimen edges and are attached to the plate along their full length. Material properties are the following: Young's modulus E = 68 GPa, Poisson's ratio 0.32 and density ρ = 2, 700 kg/m3 (Miniaci, 2014).
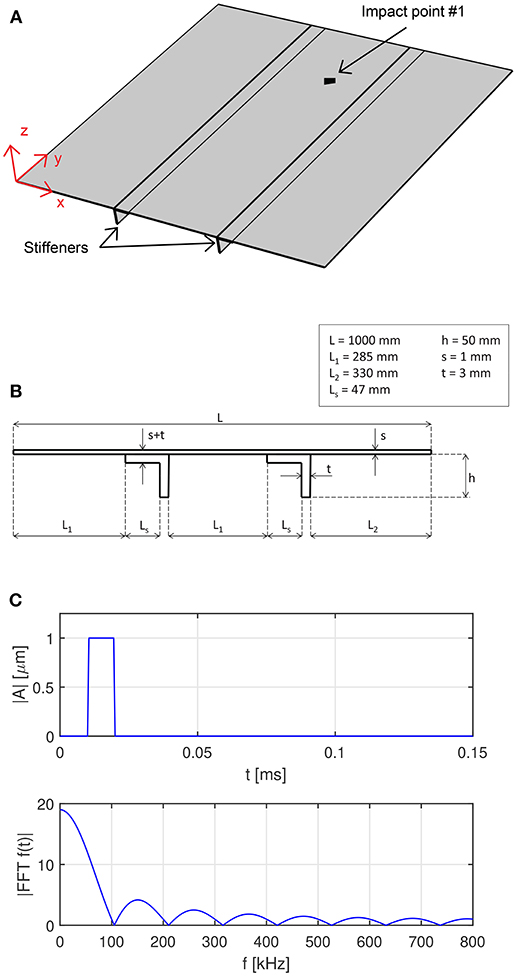
Figure 3. A schematic representation of the tested specimen: (A) isometric view and (B) cross-section. The drawings are not to scale, for sake of clarity. The light gray rectangle indicate the scanning area. (C) Time history (top panel) and its frequency content (bottom panel) of the excitation signal (chosen as a square pulse to simulate an actual impact event).
3.2. Numerical Application
The reliability of the proposed technique is first tested numerically by means of a transient Finite Element (FE) analysis simulating the propagation of guided waves in the aforementioned specimen. The implemented model is shown in Figure 3A. A full 3D propagation field is calculated by using linear hexahedral brick elements of C3D8R type for a total number of 2, 686, 684 nodes. To ensure accuracy to the time-transient FE simulations, the plate domain is discretized with elements of maximum side length Lmax = 1 mm and the time integration step kept as tint ≤ 1e − 8 s (De Marchi et al., 2013). To reproduce the experimental conditions, wave reflection, generated by both plate edges and stiffeners, as well as geometrical attenuation, due to wave radiation, are taken into account. Impact is simulated by imposing an out-of-plane displacement in the form of a sharp square pulse (see Figure 3C), which reproduces the kind of excitation that may occur in an impact event. In the FE analysis only 81 scanning points covering a square scanning area of 900 × 900 mm are considered.
Figure 4 shows three snapshots of the simulated guided wave propagation in terms of normalized Von Mises stress at different time steps t1 = 0.5 ms, t2 = 0.75 ms, and t3 = 1 ms after the simulated impact is applied. It is possible to observe how the stiffeners confine and guide much of the energy, and thus of the available information to determine the impact. This is due to the much higher rigidity of the stiffeners with respect to the plate.
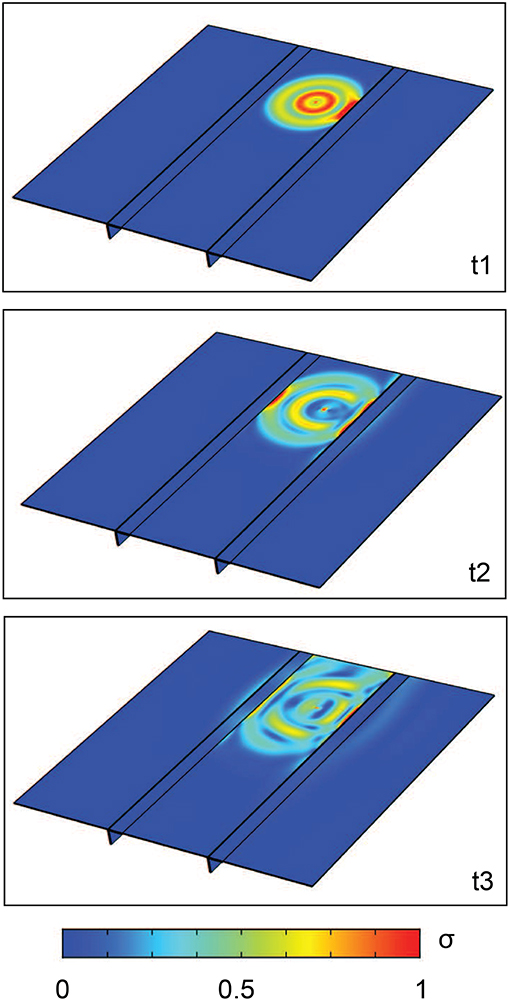
Figure 4. Three snapshots of the guided wave propagation in terms of normalized Von Mises stress at different time steps t1 = 0.5 ms, t2 = 0.75 ms and t3 = 1 ms after the simulated impact is applied. It is possible to observe how the stiffeners confine and guide much of the energy, and thus of the available information to determine the impact. This is due to the much higher rigidity of the stiffeners with respect to the plate.
The following impact cases are considered:
(i) Impact location corresponding to a grid point (results are shown in Figures 5A,B);
(ii) Impact location corresponding to a random point within the area delimited by the stiffeners (results are shown in Figures 5C,D);
(iii) Impact location almost equidistant from two grid points (results are shown in Figures 5E,F);
Corresponding signals are collected and processed as explained in section 2.2. Results are presented in Figure 5, confirming the reliability of the method. Figure 5 reports the normalized correlation values between the signal registered at each grid point and the signal of the actual impact points (1-D plots) as well as the estimated points of impact derived in a 2-D visualization. The gray dots denote the scanning points, the red circle the acquisition point, the green spot the real impact positions and the blue crosses the estimated ones. Specifically, it appears that when the impact point coincides with an acquisition point (Figure 5B), the correlation presents a higher value (Figure 5A) than for a random point (Figures 5C,E) and the impact location can be predicted extremely accurately (Figure 5B). Therefore, numerical simulations show that the farther the impact point is from a scanning point, the smaller the correlation value is. The minimum is achieved when an impact occurs at a location equidistant between scanning points (Figures 5E,F).
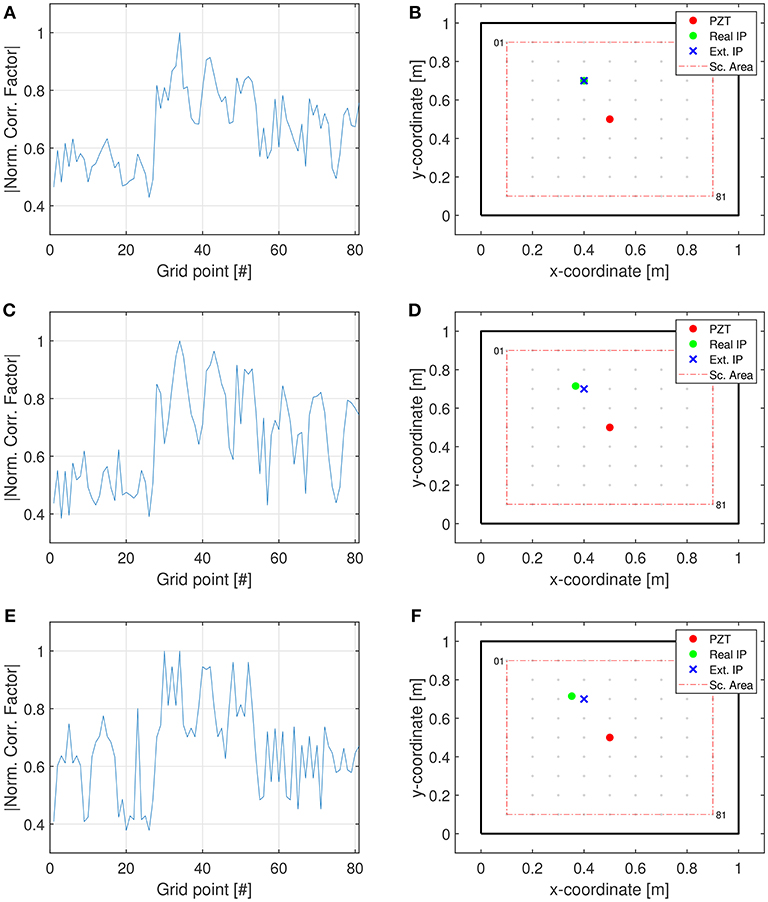
Figure 5. Numerical results. (A,C,E) Normalized correlation values between the signal registered at each grid point and the signal of the actual impact points (1-D plots). (B,D,F) The estimated points of impact are then derived and highlighted in a 2-D visualization. The gray dots denote the scanning points, the red circle the acquisition point, the green spot the real impact positions and the blue crosses the estimated ones.
3.3. Additional Numerical Considerations
In what follows, we verify the effectiveness of the TR-based technique regardless of the material and geometrical properties of the specimen. To do this, additional numerical simulations have been carried out (without loss of generality and for the sake of a reduction in computation time, a 2D plane strain model has been implemented see Figure 6A). First, two additional numerical simulations, in which the material properties of the specimen have been changed by small and large amounts with respect to those considered initially, have been performed (refer to Table 1 for the adopted properties), in the case of an impact occurring inside the area delimited by the stiffeners (in #12) and training data collected in #15 (see Figure 6A). In order to verify that the TR-based procedure is not dependent on the local elastic wave velocity, exactly the same configuration is maintained for the two study cases, but with different material properties (aluminum II in Figure 6B and steel Figure 6C, respectively). Figures 6B,C report the normalized correlation values between the signal calculated at each grid point and the signal of the actual impact points (1-D plots), clearly proving the independence of the procedure from wave velocity. This is in accordance with a fundamental symmetry principle of TR (Fink et al., 2000), if the geometry and excitation/acquisition conditions are left unaltered (Miniaci et al., 2017).
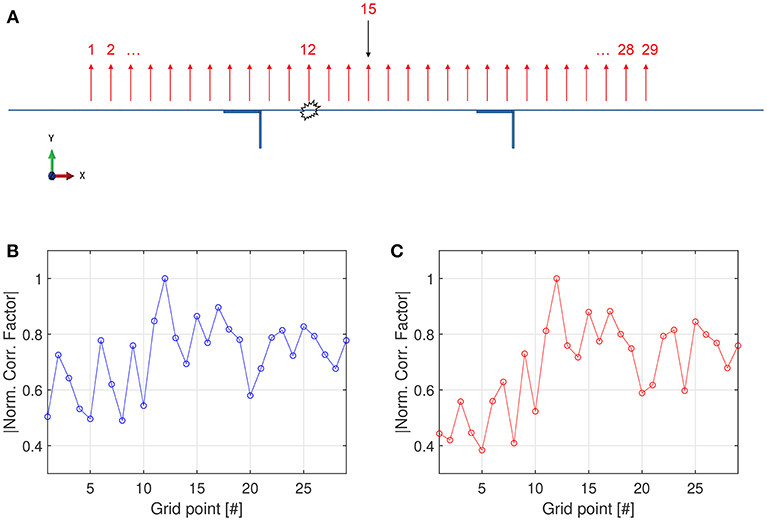
Figure 6. Numerical results. (A) Representation of the 2D finite element model under plane strain assumption. The black arrow shows the position where elastic waves have been excited into the specimen (through an imposed out-of-plane displacement of the corresponding mesh node) in phase 1. It also represents the collecting position during phase 2 (i.e., after the actual impact has occurred). The location of the acquisition points composing the training data are indicated with red arrows. (B,C) Normalized correlation values between the signal registered at each grid point and the signal of the actual impact points (1-D plots) for the aluminum II and steel cases, respectively. Additional numerical simulations showing the effectiveness of the TR-based technique regardless of the material properties of the specimen.
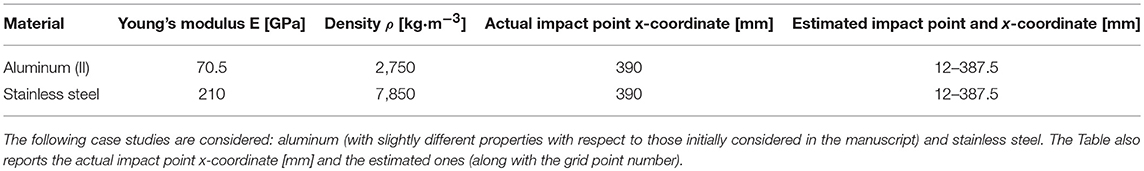
Table 1. Young's modulus, density and Poisson's ratio of the stiffened plate used for additional numerical simulations in order to prove the effectiveness of the technique regardless the material properties of the sample.
Secondly, the stiffeners have been replaced by tapers running through half of the thickness of the plate, as shown in Figure 7, in order to show the effectiveness of the TR-based technique regardless of the geometrical properties of the specimen. In this case, too, the possibility to correctly locating the impact is fully supported by the numerical simulations.
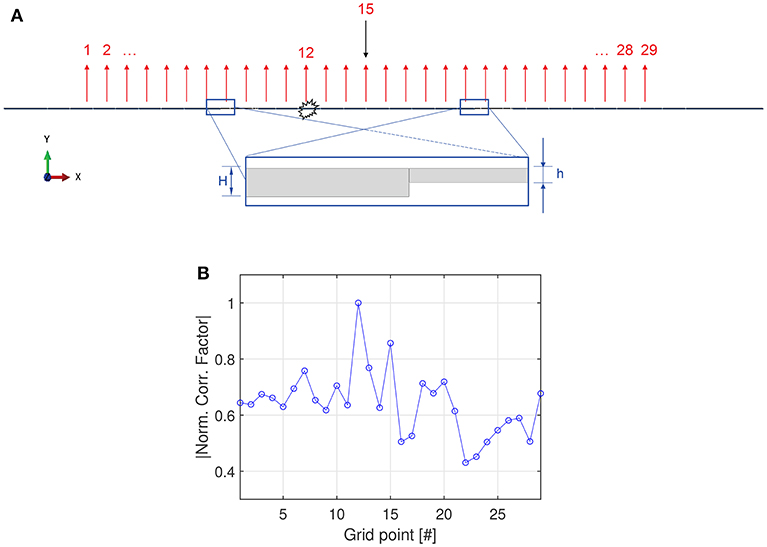
Figure 7. Numerical simulations showing the effectiveness of the TR-based technique regardless of the geometrical properties of the specimen. (A) Representation of the 2D finite element model under plane strain assumption. The stiffeners have been replaced by tapers of half the plate thickness h = 0.5; H = 0.5 mm. All the other parameters are left unaltered with respect to Figure 6. (B) The impact location still is predicted with good accuracy.
Finally, we performed additional numerical simulations to check the reliability of the TR-based technique in the case of an impact occurring outside the area delimited by the stiffeners (for instance in #23 with respect to Figure 8) and training data collected through a transducer still bonded between the two stiffeners (in #15). Here too, without loss of generality and to reduce computation time, a 2D plane strain model has been implemented, as shown in Figure 8A. Black and red arrows have the same meaning as in the previous cases. We found that the accuracy of the technique in detecting impacts outside the area delimited by the stiffeners is strongly correlated to the quantity of energy the geometrical irregularity (i.e., the stiffeners) allow to reach the detection point. Indeed, since the thickness of the stiffeners is three times that of the plate, they confine and guide most of the energy (the amplitude of the wave beyond the stiffeners is more than 3 times smaller than that inside the stiffeners), strongly limiting the information reaching the transducer in #15 (in the case of impact occurring outside the area delimited by the stiffeners and training data collected from a transducer bonded between the stiffeners). Therefore, in this specific case with huge impedance mismatch, another map of training data would be required to correctly identify the impact location (see Figure 8B). This condition corresponds to a small ratio between the maximum of the wave amplitudes calculated outside (Aout) and inside (Ain) the area delimited by the stiffeners (0.283). However, if the rigidity of the stiffeners is decreased, a larger wave amplitude is allowed to pass beyond them and the accuracy of the technique increases, as for instance in the case reported in Figures 8C,D, corresponding to the cases of Aout/Ain = 0.415 and Aout/Ain = 0.511, respectively. Thus, it emerges that the method can still be applied insofar as sufficient wave amplitude is guaranteed beyond the geometrical irregularities (quantitatively a zero-grid point error is reached for a ratio of 0.5 see Figure 8D).
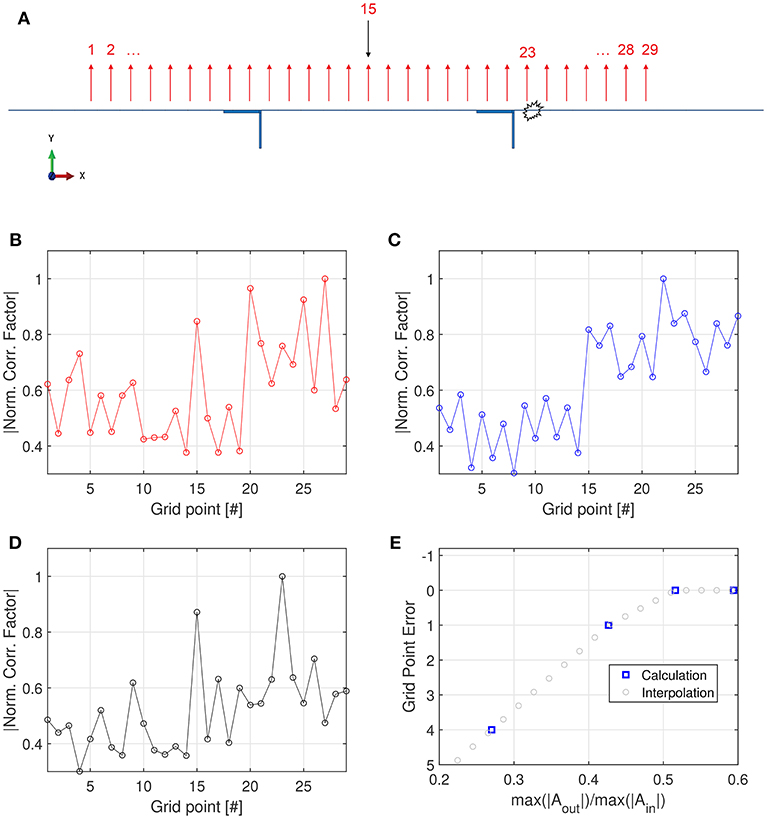
Figure 8. (A) Representation of the 2D finite element model under plane strain assumption in the case of an impact occurring outside the area delimited by the stiffeners (#23) and transducer for the training data collection bonded between the stiffeners (#15). The black arrow shows the position where elastic waves are excited into the specimen in phase 1. It also represents the collecting positions of the training data during phase 2, i.e., after the actual impact has occurred (in #23). The location of the acquisition points composing the training data are indicated with red arrows. (B–D) Numerical results show the accuracy of the technique in terms of normalized correlation values between the signal registered at each grid point and the signal of the actual impact point (1-D plots) as the ratio of the maximum of the wave amplitudes registered outside (Aout) and inside (Ain) the area delimited by the stiffeners increases : (B) Aout/Ain = 0.283, (C) Aout/Ain = 0.415, and (D) Aout/Ain = 0.511. (E) Calculated and extrapolated values of the grid point error as a function of the wave amplitude outside and inside the region delimited by the stiffeners.
3.4. Experimental Application
The tested specimen is shown in Figure 9A. The red circle represents the position of both the piezoelectric transducers used as actuator for the data training acquisition and of the SLDV acquisition point in impact tests. The testing region (768 × 803 mm), represented as the yellow rectangular box, is composed of a regular grid with 93 × 91 acquisition points. Impacts are simulated in correspondence of the three points shown in Figure 9A, that were randomly chosen within the area delimited by the stiffeners, and denoted by black stars.
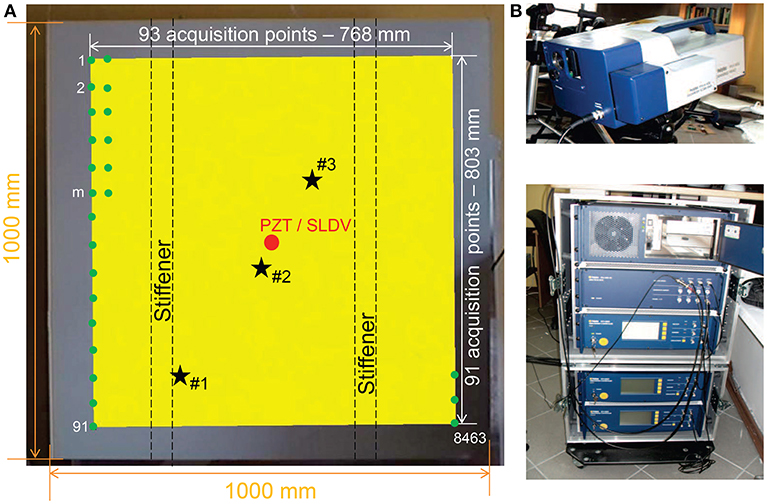
Figure 9. (A) Photograph of the tested specimen. The red circle represents the position of both the PZT transducer used as actuator for the data training acquisition and the SLDV acquisition in impact tests. The yellow rectangle represents the scanned portion of the plate (testing region) during the training acquisition phase and consists of a 93 × 91 grid of acquisition points (green dots) in the horizontal and vertical directions, respectively. The unknown impact points - #1, #2, and #3 - are represented by means of black stars and chosen within the area delimited by the stiffeners. (B) SLDV experimental setup.
Elastic guided waves are excited in the specimen using a ceramic piezoelectric disk of diameter 10 mm made of Sonox® by CeramTec® glued to the surface of the investigated sample using commercial super-glue. A scanning measurement head (PSV 400 by Polytec®) connected to a data acquisition system and a steering circuit (Figure 9B) is used to perform the out-of-plane measurements of the velocities over the target area. The pulse excitation is fed from a TGA1241 function generator by Thurlby Thandar Instruments and amplified through an EPA-104 amplifier by Piezo Systems® Inc, inducing a 20 Vpp signal. In order to improve measurements accuracy, the investigated specimen is covered with self-adesive retro-reflective film by ORALITE®. This allows to improve the laser vibrometer signal level at each measurement point regardless of the incidence angle of the measurement beam on the surface (Ostachowicz et al., 2011).
The training data collection process is realized using the square pulse shown in Figure 3C applied to the piezoelectric transducer. For each scanning point, 16, 384 samples are collected over 8 ms by the SLDV at a sampling rate of 256 kHz, and signals are averaged 128 times to improve the signal-to-noise ratio. Intervals of 50 ms are provided between two consecutive pulse excitations to allow signals to decay close to the background noise level before a new data collection. Measurement of all time signals from 8, 463 scanning points takes 8 h.
The results are shown in Figure 10, where the normalized correlation values between the signal registered at each grid point and the signal of the actual impact points (Figures 10A,C,E) are presented. The estimated point of impact is then derived and highlighted in Figures 10B,D,F. The gray dots denote all the scanning points, the red circle the acquisition point whereas the green spot the real impact position and the blue cross the estimated one. It clearly emerges that the algorithm is able to precisely identify the impact point for all the three considered cases. A very good accuracy, within 0.5 cm, is obtained regardless of the impact position (Miniaci, 2014).
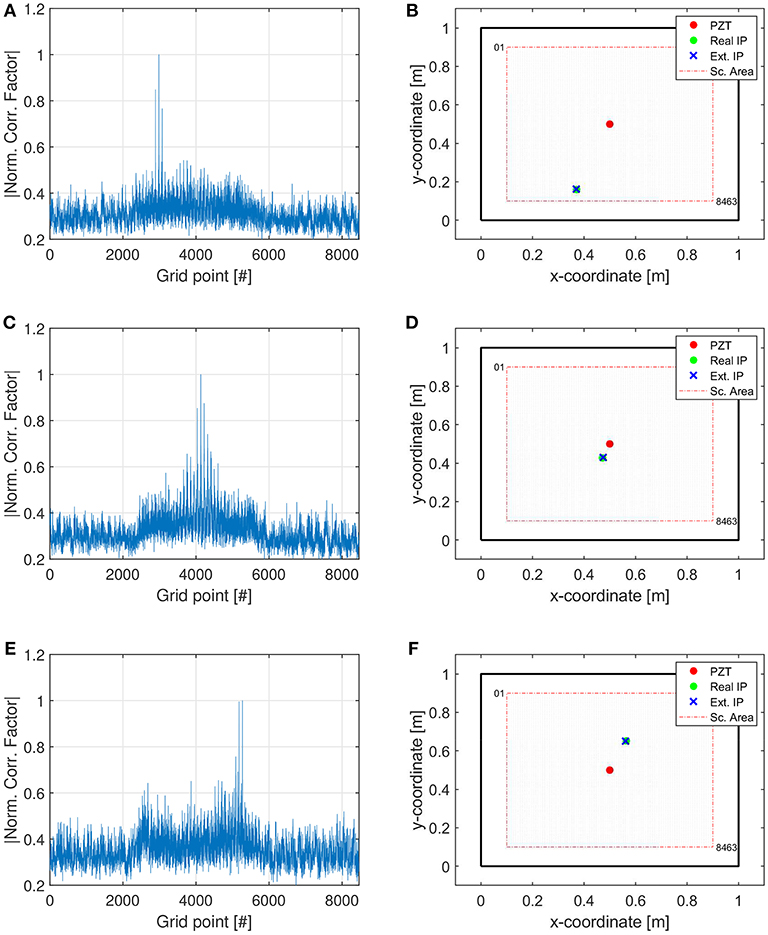
Figure 10. Experimental results. (A,C,E) Normalized correlation values between the signal registered at each grid point and the signal of the actual impact points (1-D plots). (B,D,F) The estimated points of impact are then derived and highlighted in a 2-D visualization. The gray dots denote the scanning points, the red circle the acquisition point, the green spot the real impact positions and the blue crosses the estimated ones.
4. Conclusions
This work presents an impact localization algorithm based on TR and laser-vibrometry. The main idea is to locate an impact event by simply comparing the actual impact response with IRFs obtained from a grid of training points. This technique is shown to be very powerful particularly in the case of irregular waveguides or complex structures since it does not require the knowledge of the local wave velocity or the structural geometry. Its main advantages over existing techniques are thus that: (a) it can be applied to complex structures with additional structural features such as ribs, stiffeners, and rivet connections; (b) only simple correlation calculations are required for impact localization, making it attractive for real-time automated monitoring; (c) high spatial resolution in impact localization can be achieved. A significant advantage of the present approach compared to previous realizations of the technique is the use of a single instead of multiple transducers, thus simplifying its experimental realization in applications considerably.
Both numerical and experimental results confirm the capability of the method to identify unknown impact positions without a priori knowledge of the tested specimen. The described procedure is here validated using only a single acquisition point. Tests also show that the localization of trial impacts can be successfully achieved regardless of the impact position (near the sensor, far from the sensor, near a plate edge, near a stiffener).
Although many methods are already available, the present method is particularly well-suited to impact localization in complex structures, such as parts fabricated using multiscale composite materials, thanks to its unique potential to treat in the same manner different kinds of waveguides, both isotropic and anisotropic, homogeneous and inhomogeneous with simple or irregular geometries. In this work, the training data was obtained over a grid of square points. However, a more complex disposition of the SLDV acquisition points minimizing their distance (such as for instance a triangular disposition) may reduce the training data acquisition time.
Future developments may include the optimal grid point disposition for the training data and additional tests in order to examine the robustness of the proposed approach under temperature variations.
Data Availability
The datasets generated for this study are available on request to the corresponding author.
Author Contributions
MMin performed most of the experimental and numerical work. MMaz, MR, PK, and WO contributed to experiments. NK to the simulations. FB and NP to discussions and to the writing of the paper.
Funding
MMin has received funding from the European Union's Horizon 2020 research and innovation programme under the Marie Skłodowska-Curie grant agreement n. 754364. NK was supported by Progetto d'Ateneo/Fondazione San Paolo Metapp, n. CSTO160004. FB is supported by the FET Proactive Neurofibres grant n. 732344, the COST Action 15125 DENORMS (Designs for Noise Reducing Materials and Structures), and by Progetto d'Ateneo/Fondazione San Paolo Metapp, n. CSTO160004. NP was supported by the European Commission H2020 under the Graphene Flagship Core 2 No. 785219 (WP14 Composites) and the FET Proactive Neurofibres grant n. 732344, as well as by the Italian Ministry of Education, University and Research (MIUR) under the Departments of Excellence grant L.232/2016. Some of the contents of the present work first appeared in MMin's Ph.D. thesis and are referenced in the text by Miniaci (2014).
Conflict of Interest Statement
The authors declare that the research was conducted in the absence of any commercial or financial relationships that could be construed as a potential conflict of interest.
References
Baravelli, E., Senesi, M., Ruzzene, M., and De Marchi, L. (2013). Fabrication and characterization of a wavenumber-spiral frequency-steerable acoustic transducer for source localization in plate structures. IEEE Trans. Instrument. Meas. 62, 2197–2204. doi: 10.1109/TIM.2013.2255992
Cassereau, D., and Fink, M. (1992). Time-reversal of ultrasonic fields. III. theory of the closed time-reversal cavity. IEEE Trans. Ultrason. Ferroelectr. Frequency Control 39, 579–592. doi: 10.1109/58.156176
Ciampa, F., and Meo, M. (2012). Impact detection in anisotropic materials using a time reversal approach. Struct. Health Monitor. 11, 43–49. doi: 10.1177/1475921710395815
Coverley, P. T., and Staszewski, W. J. (2003). Impact damage location in composite structures using optimized sensor triangulation procedure. Smart Mater. Struct. 12:795. doi: 10.1088/0964-1726/12/5/017
De Marchi, L., Marzani, A., and Miniaci, M. (2013). A dispersion compensation procedure to extend pulse-echo defects location to irregular waveguides. NDT E Int. 54, 115–122. doi: 10.1016/j.ndteint.2012.12.009
De Marchi, L., Marzani, A., Speciale, N., and Viola, E. (2011). A passive monitoring technique based on dispersion compensation to locate impacts in plate-like structures. Smart Mater. Struct. 20:035021. doi: 10.1088/0964-1726/20/3/035021
De Marchi, L., Testoni, N., and Marzani, A. (2018). Spiral-shaped piezoelectric sensors for lamb waves direction of arrival (doa) estimation. Smart Mater. Struct. 27:045016. doi: 10.1088/1361-665X/aab19e
Fink, M. (1992). Time reversal of ultrasonic fields. I. basic principles. IEEE Trans. Ultrason. Ferroelectr. Frequency Control 39, 555–566. doi: 10.1109/58.156174
Fink, M., Cassereau, D., Derode, A., Prada, C., Roux, P., Tanter, M., et al. (2000). Time-reversed acoustics. Rep. Prog. Phys. 63:1933. doi: 10.1088/0034-4885/63/12/202
Gliozzi, A. S., Miniaci, M., Bosia, F., Pugno, N. M., and Scalerandi, M. (2015). Metamaterials-based sensor to detect and locate nonlinear elastic sources. Appl. Phys. Lett. 107:161902. doi: 10.1063/1.4934493
Grandt, A. (2004). Fundamentals of Structural Integrity: Damage Tolerant Design and Nondestructive Evaluation. Hoboken, NJ: John Wiley.
Hajzargerbashi, T., Kundu, T., and Bland, S. (2011). An improved algorithm for detecting point of impact in anisotropic inhomogeneous plates. Ultrasonics 51, 317–324. doi: 10.1016/j.ultras.2010.10.005
Ing, R.-K., and Fink, M. (1988). Time-reversed lamb waves. Ultrason. Ferroelectr. Frequency Control 45, 1032–1043. doi: 10.1109/58.710586
Ing, R. K., and Fink, M. (1996). “Time recompression of dispersive lamb waves using a time reversal mirror-application to flaw detection in thin plates,” in 1996 IEEE Ultrasonics Symposium (San Antonio, TX), 659–663.
Kundu, T., Das, S., and Jata, K. V. (2009). Detection of the point of impact on a stiffened plate by the acoustic emission technique. Smart Mater. Struct. 18:035006. doi: 10.1088/0964-1726/18/3/035006
Kundu, T., Nakatani, H., and Takeda, N. (2012). Acoustic source localization in anisotropic plates. Ultrasonics 52, 740–746. doi: 10.1016/j.ultras.2012.01.017
Miniaci, M. (2014). Behaviour and Applications of Elastic Waves in Structures and Metamaterials. Ph.D. thesis, Alma Mater Studiorum.
Miniaci, M., Gliozzi, A. S., Morvan, B., Krushynska, A., Bosia, F., Scalerandi, M., et al. (2017). Proof of concept for an ultrasensitive technique to detect and localize sources of elastic nonlinearity using phononic crystals. Phys. Rev. Lett. 118:214301. doi: 10.1103/PhysRevLett.118.214301
Ostachowicz, W., Kudela, P., Krawczuk, M., and Zak, A. (2011). Guided Waves in Structures for SHM: The Time - Domain Spectral Element Method. Chichester: A John Wiley & Sons, Ltd.; Wiley.
Park, B., Sohn, H., Olson, S. E., DeSimio, M. P., Brown, K. S., and Derriso, M. M. (2012). Impact localization in complex structures using laser-based time reversal. Struct. Health Monitor. 11, 577–588. doi: 10.1177/1475921712449508
Park, H. W., Kim, S. B., and Sohn, H. (2009). Understanding a time reversal process in lamb wave propagation. Wave Motion 46, 451–467. doi: 10.1016/j.wavemoti.2009.04.004
Park, H. W., Sohn, H., Law, K. H., and Farrar, C. R. (2007). Time reversal active sensing for health monitoring of a composite plate. J. Sound Vibr. 302, 50–66. doi: 10.1016/j.jsv.2006.10.044
Park, J., Ha, S., and Chang, F. (2009). Monitoring impact events using a system-identification method. AIAA 47:2011. doi: 10.2514/1.34895
Salamone, S., Bartoli, I., Leo, P. D., Scala, F. L. D., Ajovalasit, A., D'Acquisto, L., et al. (2010). High-velocity impact location on aircraft panels using macro-fiber composite piezoelectric rosettes. J. Intell. Mater. Syst. Struct. 21, 887–896. doi: 10.1177/1045389X10368450
Senesi, M., Xu, B., and Ruzzene, M. (2010). Experimental characterization of periodic frequency-steerable arrays for structural health monitoring. Smart Mater. Struct. 19:055026. doi: 10.1088/0964-1726/19/5/055026
Seydel, R., and Chang, F.-K. (2001). Impact identification of stiffened composite panels: I. system development. Smart Mater. Struct. 10:354. doi: 10.1088/0964-1726/10/2/323
Sohn, H., DeSimio, M. P., Olson, S. E. B. K., and Derriso, M. (2011). “Impact localization in an aircraft fuselage using laser based time reversal,” in Proceedings of SPIE - The International Society for Optical Engineering (San Diego, CA), 7984.
Staszewski, W. J., Worden, K., Wardle, R., and Tomlinson, G. R. (2000). Fail-safe sensor distributions for impact detection in composite materials. Smart Mater. Struct. 9:298. doi: 10.1088/0964-1726/9/3/308
Tracy, M., and Chang, F.-K. (1998). Identifying impacts in composite plates with piezoelectric strain sensors, part II: Experiment. J. Intell. Mater. Syst. Struct. 9, 929–937. doi: 10.1177/1045389X9800901109
Wang, C. H., Rose, J. T., and Chang, F.-K. (2004). A synthetic time-reversal imaging method for structural health monitoring. Smart Mater. Struct. 13:415. doi: 10.1088/0964-1726/13/2/020
White, P. H. (1969). Cross correlation in structural systems: dispersion and nondispersion waves. J. Acous. Soc. Am. 45, 1118–1128. doi: 10.1121/1.1911582
Keywords: impact localization, guided waves, numerical simulations, structural health monitoring
Citation: Miniaci M, Mazzotti M, Radzieński M, Kudela P, Kherraz N, Bosia F, Pugno NM and Ostachowicz W (2019) Application of a Laser-Based Time Reversal Algorithm for Impact Localization in a Stiffened Aluminum Plate. Front. Mater. 6:30. doi: 10.3389/fmats.2019.00030
Received: 22 October 2018; Accepted: 12 February 2019;
Published: 14 March 2019.
Edited by:
Julian J. Rimoli, College of Engineering, Georgia Institute of Technology, United StatesReviewed by:
Shangchao Lin, Florida State University, United StatesPaolo S. Valvo, University of Pisa, Italy
Copyright © 2019 Miniaci, Mazzotti, Radzieński, Kudela, Kherraz, Bosia, Pugno and Ostachowicz. This is an open-access article distributed under the terms of the Creative Commons Attribution License (CC BY). The use, distribution or reproduction in other forums is permitted, provided the original author(s) and the copyright owner(s) are credited and that the original publication in this journal is cited, in accordance with accepted academic practice. No use, distribution or reproduction is permitted which does not comply with these terms.
*Correspondence: Marco Miniaci, bWFyY28ubWluaWFjaUBnbWFpbC5jb20=