 Chandi Mohanty1
 Avik Mandal2
 Vamshi Kiran Gogi2
 Ping Chen2
 Deassy Novita2
 Ralph Chbeir2
 Mathieu Bauchy3
 Matthieu Micoulaut4
 Punit Boolchand2*
- 1Department of Mechanical and Materials Engineering, University of Cincinnati, Cincinnati, OH, United States
- 2Department of Electrical Engineering and Computer Science, University of Cincinnati, Cincinnati, OH, United States
- 3Physics of AmoRphous and Inorganic Solids Laboratory (PARISlab), Department of Civil and Environmental Engineering, University of California, Los Angeles, Los Angeles, CA, United States
- 4Sorbonne Université, CNRS, Laboratoire de Physique Théorique de la Matière Condensée, Paris, France
Scores of especially dry and homogeneous (Na2O)x(P2O5)100−x glass compositions over a wide range, 0 < x < 61%, are synthesized and examined in modulated Differential Scanning Calorimetry (m-DSC), Raman scattering, infrared reflectance, and molar volume experiments. The glass transition temperature variation, Tg(x), displays three regimes; at low x (0 < x < 15%), Na serves to produce non-bridging oxygens as Tgs decrease. At higher x, 15% < x < 50%, Na continues to serve as a network modifier, but now chains of Q2 species steadily grow and Tg(x) increases. In this regime, we observe a square-well-like, thermally reversing window, bordered by abrupt rigidity transition near xr = 37.5% and stress transition near xs = 46.0% defining the intermediate phase (IP). The rigidity transition near xr = 37.5% occurs near the percolation of rigidity predicted by the coarse graining model. Variations of melt fragility index, m(x), established from complex Cp measurements show m(x = 0) to be 15(1) and to increase monotonically with x to display a square-well-like fragility window (m < 20) in the 37.5(3)% < x < 46.0(2)% range, a range which coincides with the reversibility window. These results show that melt dynamics encode glass topological phases. At still higher x (>50%), Tg(x) mildly decreases with increasing x, as pyrophosphate units decouple from the backbone and glasses segregate. Raman scattering measurements show that the fraction of the local structural species f(Q3(x)), f(Q2(x)), and f(Q1(x)) tracks the mean-field behavior based on glass stoichiometry (x), as noted earlier from 31P Nuclear Magnetic Resonance (NMR) experiments. Raman scattering also shows that the Q2 structural species always display a triad of modes, a majority mode and two satellite modes, that serve as topological defects. For the two highest frequency optic modes, infrared specular reflectance measurements show that the frequency difference between the longitudinal optic (LO) and transverse optic (TO) response displays a global minimum in the IP. The local minimum of molar volumes, a global minimum in the LO–TO mode splitting, a fragility window that coincides with the reversibility window, each observation provides persuasive evidence of the singular role of the IP in present glasses.
Introduction
Sodium phosphate glasses (SPGs) have been widely examined by a variety of probes including neutron scattering (Hoppe et al., 1996; Suzuya et al., 1998; Brow, 2000), 31P NMR (Brow et al., 1994, 1995, 2017; Alam and Brow, 1998; Brow, 2000; Click et al., 2002), X-ray photo electron spectroscopy (Gresch et al., 1979; Sammet et al., 1980), calorimetric experiments (Brow et al., 1994; Hudgens, 1994), Raman scattering (Hudgens, 1994; Hudgens et al., 1998; Brow, 2000), IR reflectance (Hudgens and Martin, 1993; Hudgens, 1994; Moustafa and El-Egili, 1998), and dynamic light scattering experiments (Fabian and Sidebottom, 2009). The base oxide, P2O5, is composed of a network of P-centered quasi-tetrahedral units, Ot = P(O1/2)3, that have three bridging and one non-bridging oxygen near neighbor, generally specified as a Q3 species in the NMR notation. The base glass is unusual, extremely hygroscopic, and also isostatically rigid in having three chemical bonding constraints per atom. The Tg of the base glass is extremely sensitive to not only its preparation but also to its handling while sealing in an Al pan for a calorimetric experiment. Tgs can easily decrease from 430 to 397°C as the enthalpy of relaxation (ΔHnr) builds up from 0.06(2) to 0.40(2) cal/gm if even traces of water are picked up if the Al pans are not dry or if the relative humidity of the ambient environment in which samples are handled is not <0.01%. Water doping converts a bridging oxygen site into a pair of dangling OH ends, lowering the global network connectivity that is reflected in a decrease of Tg, and an increase of ΔHnr due to the opening of a new degree of freedom of glass relaxation. Alloying Na2O in the base glass at first decreases the glass transition temperature Tg(x) up to 15 mole % of soda, but then increases it thereafter at higher x to display a maximum near x = 50 mole % of soda, corresponding to NaPO3. The change in slope, dTg/dx, from negative at low x (<15%) to positive at high x (>15%) underscores that the Na2O additive serves as a network modifier both at low x and high x. Stoichiometric NaPO3 glass is composed of long P-O-P-O-P chains in which P atoms are tetrahedrally coordinated to two bridging oxygens (Ob) in a chain and two terminal oxygens (Ot) that are charge compensated by a Na+ cation, a Q2 species in the NMR notation. The molecular structure of these ultraphosphate glasses, in the 0 < x < 50% composition range, has been broadly described (Brow, 2000) as composed of Q2 and Q3 species, with the fraction of Q2 species, f(Q2) monotonically growing at the expense of the Q3 ones (f(Q3)) as x increases to 50%. In the coarse graining model (Sidebottom and Schnell, 2013) of these glasses, one excludes counting dangling ends, and the Q2 and Q3 species then take on a two- and three-fold coordination. The mean coordination number <r> = 2.40, as x increases to 37.5% at the rigidity percolation transition (Thorpe et al., 2000).
We have synthesized especially dry and homogeneous SPGs in the 0 < x < 60% range of soda and examined them in m-DSC, Raman scattering, infrared reflectance, and molar volume measurements. The nature of the glass transition examined in m-DSC experiments reveals the non-reversing enthalpy of relaxation at Tg, ΔHnr(x) and shows a square-well-like variation in the 37.5% < x < 46% range. The observation identifies the composition range with formation of isostatically rigid networks (Phillips, 1979), i.e., networks belonging to the intermediate phase (IP). The onset of the IP near 37.5% coincides closely with the prediction of the coarse graining model (Sidebottom and Schnell, 2013). The increase of Tg(x) in the 20% < x < 50% range suggests that glass compositions at x < 37.5% are in the flexible phase, while those at x > 46% are in the stressed rigid phase.
The increase in viscosity (η) of a glass-forming melt as its T is lowered to Tg to an astronomically high value near 1012 Pa.s results in a frozen solid or glass that supports shear (Debenedetti and Stillinger, 2001). In addition, one defines (Williams et al., 1955; Angell, 1988) the fragility index m as the slope d(Log η)/ d(T/Tg) as T approaches Tg. Upon cooling melts across Tg and examining the resulting glass transition exotherm in m-DSC experiments, one can establish m (Carpentier et al., 2003; Thomas, 2005a). In the present work, such experiments show a square-well-like minimum in m with m < 20 as a function of melt composition in the 37.5% < x < 46% compositional window. Thus, the window in fragility apparently coincides with the window across which Tg becomes thermally reversing. The finding leads us to the key central finding of the present work, viz., there exists an intimate linkage between melt fragility index and glass topological phases in the phosphates. Parallel results were recently reported (Gunasekera et al., 2013a; Chakraborty and Boolchand, 2014) in several binary chalcogenides, underscoring that melt dynamics encode the topological phases of the resulting glasses.
In Raman scattering and IR reflectance experiments, one observes modes characteristic of the Q3, Q2, and Q1 local structural species. Here, Qn represents a P atom having n-bridging O near-neighbors in the NMR notation. The observed variation in mode frequency and mode scattering strength with glass composition reveals new insights into the structure evolution of glasses. The glass structure near x = 50% is dominated by long -O-P-O-P-O- chains (composed of Q2 species) that form the extended range structure of the glasses also in the 35% < x < 60% range. In the chains characteristic of the glass, Q2 species always display a triad of modes, a majority mode and two lower-frequency satellite modes, henceforth labeled as a minority mode and a defect mode. Evidence shows that the local structures corresponding to the minority and defect modes, function as topological defects. They serve to relieve stress in the flexible and stressed rigid phases but are weakly populated in the stress-free IP. Raman scattering along with IR reflectance show that the highest frequency optic modes display an LO-TO mode frequency splitting (Galeener and Lucovsky, 1976) that displays a global minimum in the IP. Thus, many experimental observables in the calorimetric, Raman scattering, infrared reflectance, and volumetric measurements undertaken here display anomalies in the IP.
Finally we have put the present results on glass structure in context with earlier reports (Cormia et al., 1963; Angell and Rao, 1972; He and Thorpe, 1985; Martin and Angell, 1986; Wäsche and Brückner, 1986; Angell, 1990; Sales, 1990; Hudgens and Martin, 1993; Brow et al., 1994; Hudgens, 1994; Hoppe, 1996; Hudgens et al., 1998; Angell et al., 1999; Brow, 2000; Sidebottom and Changstrom, 2008; Fabian and Sidebottom, 2009; Gupta and Mauro, 2009; Mauro et al., 2009; Sidebottom and Schnell, 2013; Hermansen et al., 2014, 2015; Sidebottom, 2014; Sidebottom et al., 2014) on the subject. By synthesizing especially dry glasses, new insights into the physics of glasses have emerged, and these developments are likely to have important consequences on the applications of these materials.
Materials and Methods
Synthesis of (Na2O)x(P2O5)100-x Glasses
Synthesis of P2O5 Glass
The base P2O5 starting material is extremely hygroscopic and requires rather special handling for the synthesis of the bulk glass. Fortunately, it sublimes at 340°C into a monomeric form and can be synthesized as a rather pure and dry bulk glass (Hudgens and Martin, 1993) as follows. The starting material in a powder form was transferred in a quartz tube in model HE-493/MO-5 Glove box from Vacuum Atmospheres, which is continuously flushed with dry N2 gas and with a relative humidity of <0.01%. An assembly made of Swagelok valve connected to an 8-mm-diameter tube supporting connector was used to evacuate the quartz tubing. The quartz tubing was evacuated using a high-vacuum pumping system with a liquid nitrogen trapped diffusion pump. The quartz tube was then gently heated to 340°C, and a deposit sublimed on the cold end of a long quartz tube while pumping on it. Next, the quartz tube was sealed off, and the bulk glass was realized by heating the sublimed P2O5 to 350°C and water quenched. Since the thermal expansion of the glass and quartz differs, water quenching leads to a fracture of the quartz tube a few minutes after the water quench. Bulk glass shards are collected and immediately transferred into the glove box. TA Instruments Tzero pans that could be hermetically sealed were dried by gently heating to 80°C in a quartz tube while being pumped on by a high-vacuum line overnight and transferred into the glove box. Pans and lids were paired and weighed with a digital balance placed in the glove box. A 10- to 15-mg quantity of the bulk glass was transferred in the pans and hermetically sealed and weighed. This process was repeated several times, and in each synthesis, several bulk glass specimens were synthesized and examined in the m-DSC experiments. The Tg, enthalpy of relaxation, and fragility index of these glasses were measured, and these results are presented in section Calorimetric Results on Tg, ΔHnr, and m.
Synthesis of Bulk (Na2O)x(P2O5)100-x Glasses in the 20% < x < 61% Range of Soda
Stoichiometric sodium metaphosphate glass, NaPO3, corresponding to x = 50%, was synthesized by heating finely crushed and intimately mixed Na2CO3 and P2O5 powders as starting materials. In each case, the batch size was kept at 2 g. Two synthesis procedures were employed. Sample A was obtained by mixing the fine powders in a Pt crucible for 5 min using a spatula in the glove box. Sample B was synthesized by mixing the starting materials in an agate mortar and pestle for about 25 min, and the mixture was transferred to a Pt crucible with a lid in the glove box. Mixtures were then placed in a box furnace at 120°C and heated to 420°C to decarbonize the precursor and taken to 700°C for 2 h, and then to 900°C for 30 min, and the melt was poured over a steel plate to realize the bulk glass. The glass was immediately transferred to the glove box. The stoichiometric glass was crystallized by heating to 420°C, and a powder X-ray diffraction scan confirmed the crystalline phase formed to be indexed on an orthorhombic structure (JCPDS file 011-0648). Micro-Raman scattering results show that while glass samples A were heterogeneous, glass samples B were homogeneous (Mohanty, 2018) as will be noted in the segment on Results. Although a full range of glass sample A compositions were synthesized and their calorimetric properties measured (Mohanty, 2018), in the present work, we will largely report results on the homogeneous glass samples B.
We repeated the processing described above at the metaphosphate composition by extending synthesis to lower values of x, but with some changes; we reduced the alloying temperature from 700 to 600°C as x was lowered from 50 to 20%. This was necessary to avoid loss of P2O5 as it was alloyed with Na2O at lower x (< 40%). Glass stoichiometry “x” was independently established by energy dispersive analysis X-ray (EDAX) measurements (Goldstein et al., 2003; Mohanty, 2018), and these values of x were used to define the stoichiometry of glasses. The EDAX-deduced compositions showed a steadily higher soda content than the one based on weighed ones as x decreased in the 30% > x > 20% range. At x > 50%, homogeneous bulk glasses were realized in the 50% < x < 61% range following the processing used at x = 50%. At x > 61%, quenched glasses were found partially crystalline. Micro-Raman scattering measurements, taken at a 1-μm spatial resolution, revealed regions that showed narrow vibrational features characteristic of a partially crystalline sample and broad bands characteristic of a glass. Thus, only results on the fully glassy range at x < 61% will be presented here.
Glass Transition Temperature Tg, Enthalpy of Relaxation of Glasses at Tg (ΔHnr), and Melt Fragility Index (m) From m-DSC
Glass transition endotherms were analyzed by m-DSC in one of two methods. In one method, the endotherm is analyzed in terms of the reversing and non-reversing heat flow terms (Thomas, 2005b). This method was used to establish the Tg and ΔHnr. In the second method, one analyzes the endotherm in terms of the complex specific heat (Cp) with in-phase part, , akin to the reversing heat flow, while the out-of-phase part, , akin to the non-reversing heat flow. The second method lends itself well to establish the fragility index of melts.
All bulk glass samples were examined using a model Q2000 m-DSC from TA Instruments Inc. In a typical measurement, about 10–15 mg of the glass was sealed in Tzero pans of the hermetically sealed type. All Al pans and lids were first dried by pumping for at least a day or longer in a vacuum oven held at 80°C. All glass samples were sealed in Al pans in a dry nitrogen ambient environment using the vacuum atmospheres glove box.
Glass Transition Temperature Tg and Enthalpy of Relaxation at Tg, ΔHnr
The typical operating parameters were as follows: scan rate: 3°C/min, modulation amplitude: ±1°C, modulation time: 100 s. The calorimeter was calibrated using indium metal T-calibration, sapphire Cp calibration. In each case, a melt-quenched bulk glass was first rejuvenated by heating past Tg and cooled back to the starting temperature to dissipate stress frozen upon a thermal quench of the melt. Next, a second heating scan initiated to establish the total heat flow, the “reversing” and “non-reversing” heat flow. Next, a cooling cycle followed to establish the frequency-corrected non-reversing heat flow term, ΔHnr(x), as described elsewhere (Thomas, 2005b; Dash et al., 2017). In Figure 1, we show an actual scan of a glass at x = 34%, and find a Tg of 269.9(5)°C, as the average value of the inflection point of the reversing heat flow signal in the heating and cooling cycles. The frequency-corrected non-reversing heat flow ΔHnr(x) is found to be 0.48(5)cal/gm. Such experiments were systematically undertaken at several glass compositions x to establish trends in Tg(x), ΔCp(x), and ΔHnr(x). Results are presented in section Results.
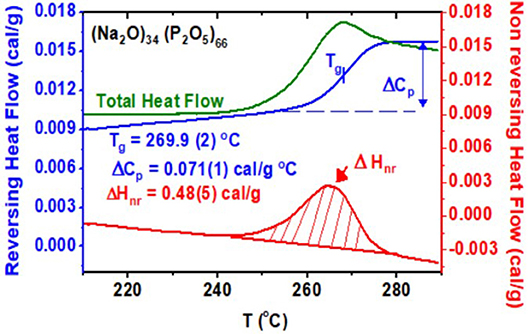
Figure 1. m-DSC scan of a (Na2O)x(P2O5)100−x glass at x = 34% showing the total (green), reversing (blue), and non-reversing (red) heat flow terms in the heating cycle. The Tg deduced from the inflection point of the reversing heat flow is 269.9(2)°C. The non-reversing enthalpy at Tg deduced after a frequency correction is 0.48(5) cal/gm. The cooling cycle heat flow scans are not shown.
Melt Fragility Index (m) and Activation Energy (EA) for Enthalpy Relaxation
Upon cooling a melt past the glass transition, an exotherm is manifested, which can be analyzed in terms of a complex Cp formalism: an in-phase-specific heat, , that shows a step-like feature akin to the reversing heat flow, and an out- of-phase specific heat, , which shows a Gaussian-like peak. In these experiments, one tracks the shift of peak as the modulation frequency is systematically changed (Bustin and Descamps, 1999; Carpentier et al., 2003), and one establishes the melt fragility index, m, as illustrated next with an example at the composition x = 34% in the present SPGs (Figure 2).
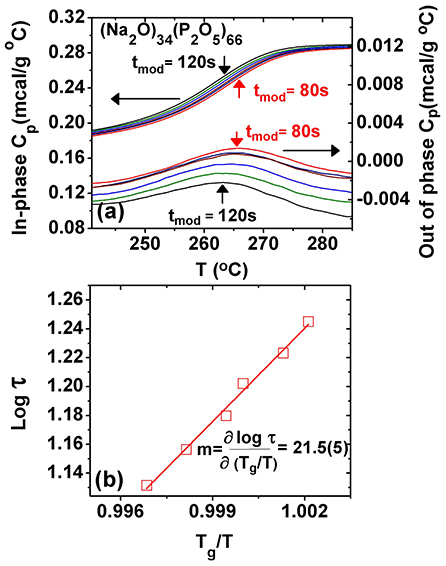
Figure 2. (a) Observed variation of the in-phase and the out-of-phase specific heat as a function of modulation frequency. Note that as the frequency increases, the peak in shifts to higher temperatures as the glass must relax faster so ωτ = 1. (b) A plot of the enthalpic relaxation time τ as a function of T/Tg displaying an Arrhenius variation, with a slope that fixes the fragility index m = 21.5(5). Tg is determined from the inflection point of the at a modulation time period of 100 s.
These results were obtained as a function of modulation time period tm in the range 60 s < tm < 120 s as the melt T is lowered from 285 to 235°C. One finds that the step in steadily shifts to higher T as the modulation frequency ω = 2π/tm is increased. On the other hand, displays a peak that steadily shifts to higher T as ω increases. At the peak location, the glass enthalpic relaxation tracks the programmed modulated T-profile, i.e., ωτ = 1. By establishing the peak location, one fixes the enthalpic relaxation time τ at a given modulation frequency (ω), and from the abscissa of the , the T at which that enthalpic relaxation time τ was realized. By plotting log of τ as a function of Tg/T (Figure 2b), one obtains the fragility index (Böhmer et al., 1993; Bhosle et al., 2012b).
Given the fragility index m, one then obtains the activation energy EA for enthalpic relaxation using the following relation (Gunasekera et al., 2013a),
Traditionally melt fragility index of glasses has been measured in DSC experiments following the method introduced by Moynihan et al. (1974). The scan rate (“q”) dependence of Tg is measured, and one expects a linear variation of ln “q” against 1/Tg. We performed such experiments on samples of set B with the scan rate varied in the range 5°C/min < q < to 30°C/min. In the present modified oxides, we could not observe a unique slope d(lnq)/d(1/Tg) over the range of q used. The variation was found to be non-linear and displayed a continuously variable slope with a high slope at low scan rates (q < 10°/min) but a low slope at high scan rates (20°C < q < 30°C), and with the high slope nearly twice that of the low slope in all the samples examined (Mohanty, 2018). On the other hand, the complex Cp approach using m-DSC yielded quite reproducible melt fragility index results that varied systematically with glass composition x, as described in the present work.
Raman Scattering
We used a model T64000 Dispersive Raman system from Horiba Jobin Yvon Inc, with a microscope attachment, and 514.5-nm excitation from an Argon ion laser to excite Raman scattering from bulk SPGs. All spectra were least-squares fit in terms of Voight lineshapes using the Peakfit Software, and keeping the Lorentzian/Gaussian mix fixed at 57%/43%.
As an example of a Raman scattering measurement, we compare in Figure 3 the observed lineshape of crystalline (Exarhos and Risen, 1974) NaPO3 with its bulk glass counterpart. These spectra show remarkable similarities: features 1, 2, and 3 characteristic of the long P-O-P-O-P chains (Brow et al., 1994, 2017; Hudgens et al., 1998; Brow, 2000) are present in both the crystal and the glass. The prominent feature 1 near 1,166 cm−1, ascribed to the symmetric stretch mode of P-Ot bonds in a Q2-like species (Brow et al., 1994; Hudgens, 1994; Hudgens et al., 1998; Click et al., 2002; Novita and Boolchand, 2007, 3), is observed in both the glass and the crystal. The mode is extremely narrow (Full Width at Half Maximum (FWHM) = 4.6 cm−1) in the crystal but is much broader in the glass (FWHM = 14.1 cm−1). In the two panels below, we highlight the observed lineshape of Feature 1 in glass sample A with the one in glass sample B profiled across the glass specimen.
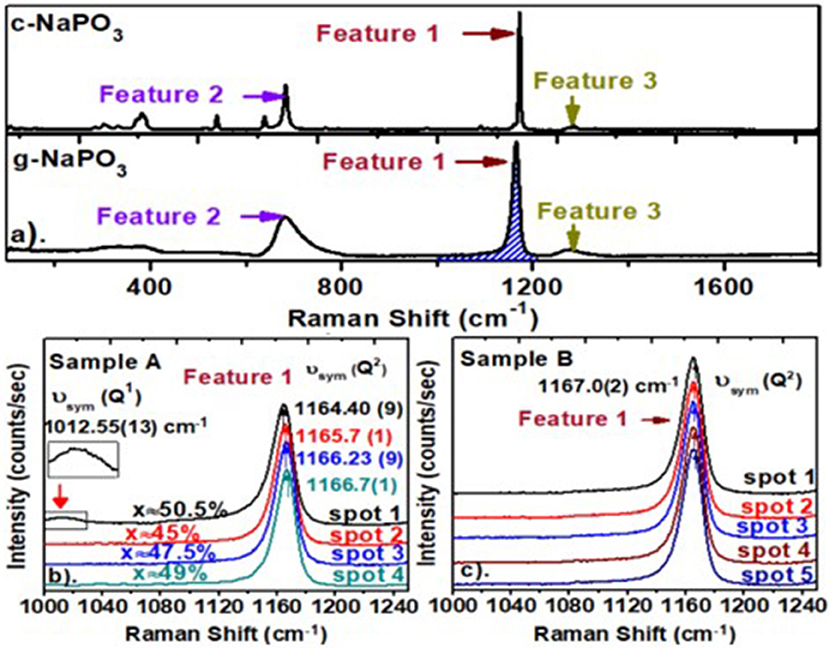
Figure 3. (a) Raman scattering in c-NaPO3 compared to the one in g- NaPO3. In the two panels below (a), we compare the micro-Raman profiling of feature 1 in a glass from sample A (b) with the one of a glass sample B (c). The results show the variance in x for sample A is 5.5%, but the variance in x for sample B is vanishing. In (b), note that the Q1-related mode near 1,012 cm−1 is observed at spot 1, showing the composition to be x = 50.5%. Global variation of feature 1 mode-width and mode-frequency of sample B appear in Figure 7A. Details of the glass synthesis appear in section Synthesis of (Na2O)x(P2O5)100−x glasses.
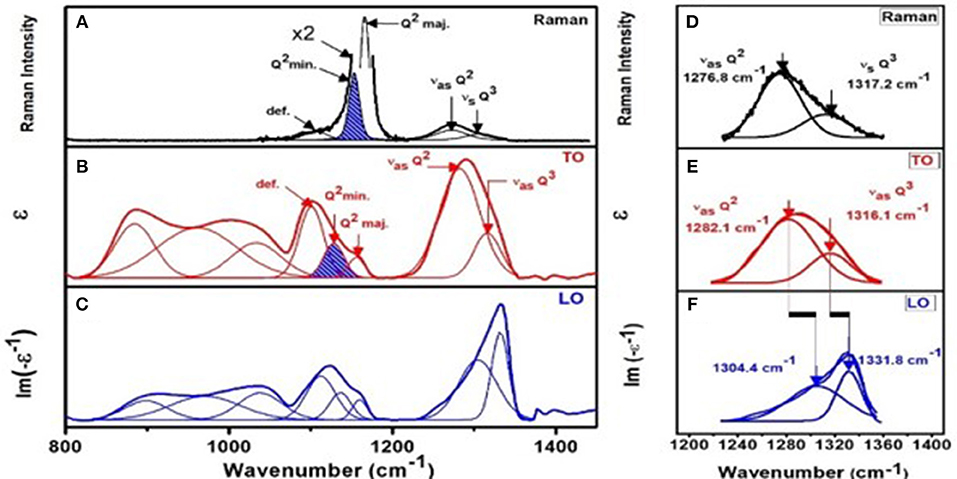
Figure 4. Correlating (A) Raman scattering with (B) IR TO response (ε) and (C) IR LO response [Im (-1/ε)] for NaPO3 glass. Note that the two minority modes (Q2 min. mode and def. mode) associated with the majority mode near 1,166 cm−1 mode are weakly excited in Raman scattering but strongly in IR response (B,C). Please note we have enhanced the two minority modes by a factor of 2 in plotting the data to make these features visible in (A). (D) shows a blow up of the two high frequency optic modes from (A) while (E) and (F) give the same two optic modes from (B) and (C) respectively. Note, one observes an LO-TO splitting associated with the two highest frequency optic modes, Q2 asymmetric and Q3 asymmetric as shown in (E) and (F).
A perusal of the observed lineshapes shows the 1,167 cm−1 mode frequency in sample A (lower left) is found to shift by as much as 2.0 cm−1 as one moves from spot 1 to 4 in the micro-Raman experiments. Furthermore, at spot 1, the lineshape shows evidence of the 1,012 cm−1 mode ascribed to Q1-like species (Brow et al., 1995; Velli et al., 2005) being formed, a feature expected only at x > 50.0%. On the other hand, the Raman spectrum of glass sample B shows the mode frequency of the Q2 species to be steady at 1,167.0(2) cm−1 with a variance of < 0.3 cm−1 as the sample was profiled at five spots. The spots were typically separated by 2 to 3 mm. These spectra illustrate that while sample A was heterogeneous, sample B was homogenous. Details of synthesis are presented in section Synthesis of (Na2O)x(P2O5)100−x Glasses.
Infrared Reflectance
An FTIR Model Nexus 870 from Thermo-Nicolet Inc. with a Seagull accessory for specular reflectance studies from bulk glasses was used. The system was set up for mid-IR response (400–6,000 cm−1) using a DTGS detector with KBr window and KBr beam splitter. In a typical measurement, 200 scans were recorded at 4-cm−1 resolution. The system as well as glass samples were thoroughly purged with dry air circulating inside the Seagull chamber to flush traces of water on the surface of platelet-like samples. A polished stainless-steel flat disc was used as a reference to normalize the reflected light. The normalized reflectance was then Kramers–Kronig transformed (Galeener et al., 1983) to obtain absorbance, transverse optic (TO), and longitudinal optic (LO) response using Grams 32 software.
Molar Volumes
Molar volumes of bulk glasses were deduced from mass density using the Archimedes' principle. A 125-mg glass sample or larger was weighed in air and in 200 proof alcohol using a quartz fiber suspended from a digital balance with a resolution of 0.1 mg. To calibrate the density of 200 proof alcohol, a Si single crystal wafer of known density (ρSi = 2.33 g/cm3) was used. To ascertain the accuracy and reproducibility of the method, the density of a single crystal of Ge was measured and found to be 5.322(6)/cm3, which may be compared to the known standard value of 5.323 g/cm3. With glass samples weights exceeding 125 mg, the density could be measured to an accuracy of 0.25%.
Results
Calorimetric Results on Tg, ΔHnr, and m
We begin by presenting results for the base P2O5 glass corresponding to x = 0. Next, we present calorimetric results on the SPGs in the 20% < x < 60% range.
Tg, ΔHnr, and ΔCp of Base P2O5 Glass
Following the synthesis of the base P2O5 glass described in section Materials and Methods, at least 10 different glass samples were examined in m-DSC experiments to establish trends in Tg, ΔHnr, and ΔCp. An m-DSC scan of one of the driest P2O5 glass with a Tg = 430°C is shown in Figure 5A. A summary of the m-DSC results on all other samples is given in Figure 5B as a plot of ΔHnr on the left ordinate as a function of Tg, and ΔCp on the right ordinate as a function of Tg. Because of the extreme hygroscopicity of the glass, these 10 different glass preparations had apparently varying water impurity content. The presence of water impurity doping leads to the conversion of bridging O into NBO (Walter et al., 1997; Brow, 2000), lowering the global network connectivity, which is reflected in an increase of ΔHnr and a decrease of Tg. Thus, we identify the Tg of dry P2O5 glass at 435°C and associate the vanishing ΔHnr ~ 0 with such a sample. The vanishing of ΔHnr is fully consistent with the isostatic nature (Georgiev and Boolchand, 2000) of the quasi-tetrahedral local structure, which contributes three constraints per atom. Our results also show that ΔCp systematically decreases as glass samples get drier.
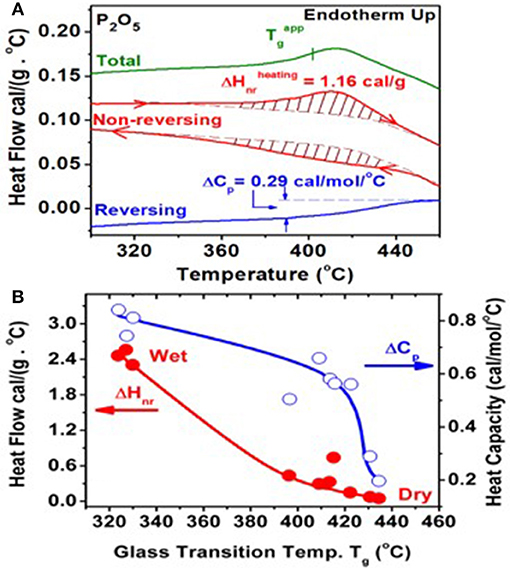
Figure 5. (A) An m-DSC scan of one of the driest P2O5 glass synthesized. The total, reversing, and non-reversing heat flows in the heating up cycles are displayed (B). A plot of ΔHnr on the left ordinate as a function of Tg, and ΔCp on the right ordinate as a function of Tg for the 10 samples measured. The glass sample with the highest Tg of 435(2)°C is identified with dry P2O5 glass. This particular glass sample has a vanishing ΔHnr ~ 0, consistent with its isostatically rigid nature.
Tg, ΔHnr, and ΔCp of Ultra- and Pyrophosphate Glasses
m-DSC results on bulk (Na2O)x(P2O5)100−x glasses (SPGs) in the 20% < x < 60% range are summarized in Figure 6. The three panels (Figures 6A–C) plot glass compositional trends in Tg(x), ΔHnr (x), and ΔCp(x), respectively. The Tg(x) trends are suggestive that glass structure evolution displays three distinct regions: I, II, and III. In region I, 0% < x < 15%, Tg(x) decrease at a rate of near 20°C/mole of Na2O suggests that Na+ ions serve to convert BO into NBO, thus lowering the global connectivity of the network that is reflected in the decrease of Tg. This requires that in a P-centered quasi-tetrahedral local structure of P2O5 base glass, Na+ ions bond only to one of the three available BO sites (Wazer, 1958). Remarkably, the slope dTg/dx of 20.0°C/mole % of Na2O observed in the experiments is almost identical to the value Micoulaut (1998) predicted if one of the three BO were to be replaced by a NBO, thus lowering the network connectivity as we discuss later. In region II, 15% < x < 50%, increase of Tg(x) with x suggests broadly that the Na2O additive now serves to increase network cohesion as Na+ ions donate a −ve charge to the P-centered tetrahedra, leading to the two double-bonded terminal (Ot) bonds and two bridging oxygen bonds facilitating growth of the Q2 species (Wazer, 1958; Brow et al., 1994, 2017; Alam and Brow, 1998; Brow, 2000). In region III, 50% < x < 60%, one finds Tg(x) to mildly decrease with x, with a clear evidence of a kink near x = 50%. In region III, the network is steadily fragmented as pyro-phosphate dimers form, by the conversion of Q2 species into a pair of Q1 species by uptake of 2 Na+ ions, and as the backbone steadily decouples (Brow et al., 1995; Alam and Brow, 1998; Velli et al., 2005).
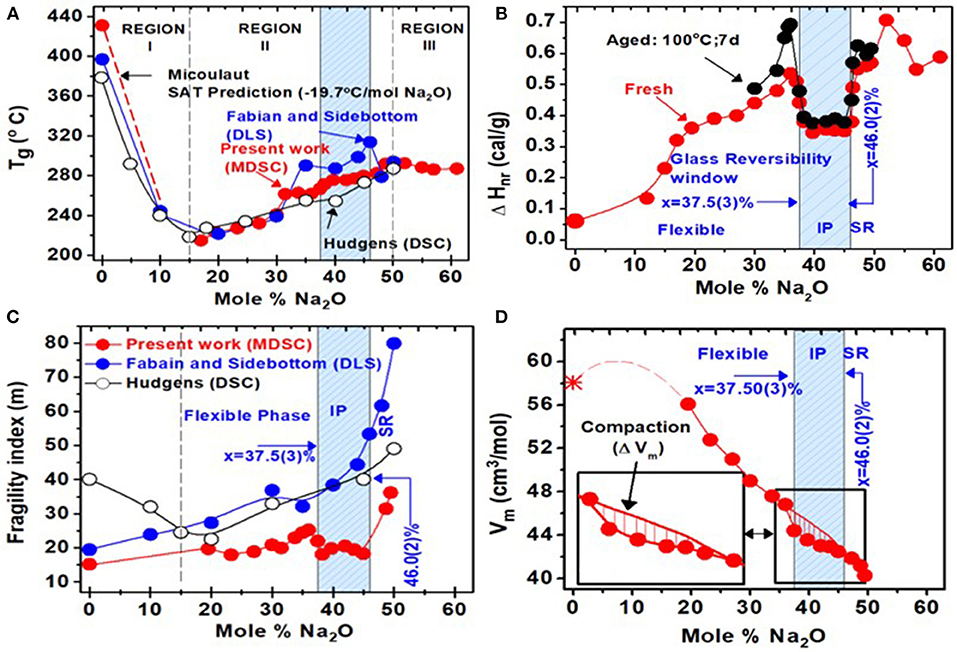
Figure 6. Calorimetric results on sodium phosphate glasses obtained from present work and two earlier reports (Hudgens, 1994; Fabian and Sidebottom, 2009). Compositional trends in (A) Tg(x) (B) in the non-reversing enthalpy of relaxation, ΔHnr(x), (C) melt fragility index m(x), and (D) molar volumes Vm(x). The light blue panel represents the glass composition range across which a glass reversibility window and a melt fragility window are observed, and it is identified with the isostatically rigid intermediate phase. Compositions at x < 37.5(3)% are in the flexible phase, while those at x > 46.0(2)% are in the stressed rigid phase. At x > 50%, glasses steadily fragment with the decoupling of pyrophosphate units. In the intermediate phase, molar volumes show a local minimum consistent with the compacted nature of networks formed therein. The composition x = 37.5% represents the rigidity elastic phase transition in these glasses, and it coincides with the percolation of rigidity in the Sidebottom coarse graining model (D. L. Sidebottom and Schnell 2013) of these glasses.
Most remarkable are the trends in ΔHnr(x) (Figure 6B) that steadily increase in the 0 < x < 37.5% range to show a square-well-like local minimum in the 37.5(3)% < x < 46.0(2)% range, and then continue to increase in the 46.0% < x < 50.0% range, and to finally decrease in region III, 50% < x < 60% for the pyro-phosphates. We also examined the aging effect of the enthalpy of relaxation ΔHnr(x) term (Tonchev and Kasap, 2002; Chakravarty, 2003; Micoulaut, 2016) in the 37.5(3)% < x < 46.0(2)% range by heating the glasses at 100°C for a week and found the term to age (black filled data points) for compositions outside but not inside the IP. The square-well-like shape and the absence of any measurable aging in that window are features that are characteristic of the reversibility window (Boolchand, 2006), as we discuss in section Fragmentation of Q2 Bearing Chains by Q1 Dimers in the Pyrophosphates (50% < x < 60%). An interesting aspect of the reversibility window is that it sits on a finite background of ΔHnr = 0.50 cal/gm. In fact, the background term progressively increases almost monotonically in the 0.05 cal/gm < ΔHnr < 0.50 cal/gm range as the glass composition increases in the 0 < x < 37.5% range.
In the less homogenous glass samples A (Mohanty, 2018), we also observed a reversibility window. But in sharp contrast to the abrupt and square-well like nature of the window seen in samples B, the window in samples A was narrower and Gaussian like. It appears that the litmus test of ideally homogeneous samples is the observation of a square-well-like reversibility window, wherein one has an abrupt rigidity- and stress-elastic phase transitions (Jacobs and Thorpe, 1995).
Fragility Index of P2O5, Ultra-, and Pyro-sodium Phosphate Glasses
In section Glass Transition Temperature Tg, Enthalpy of Relaxation of Glasses at Tg (ΔHnr), and Melt Fragility Index (m) From m-DSC, we outlined the procedure in which m-DSC can be used to deduce melt fragility index (m) and the activation energy for enthalpic relaxation (Ea). The compositional variations of these melt-related calorimetric observables are shown in Figure 6. The fragility index of the base P2O5 melt is near m = 15.0(5), and it is suggestive of a super-strong melt. Upon alloying soda, m progressively increases in the 0 < x < 37% range, and then shows a square-well-like minimum in the 37.5(3)% < x < 46.0(2)% range. Note that in this square-well range, m acquires a value of < 20, suggesting that melts formed in the well are super strong. The composition range 37.5(3)% < x < 46.0%, in which melts acquire an m < 20, will henceforth be denoted as the fragility window. We also note that the compositional width of the fragility window in Figure 6C within experimental error coincides with that of the reversibility window in Figure 6B. This is not an accident as we shall discuss in section Discussion.
Raman Scattering
The similarity in Raman scattering of crystalline with glassy meta-phosphate (Figure 3) stems from features common to their molecular structures. In both cases, long chains of P-centered tetrahedral units having two bridging oxygen atoms (Ob) and two terminal oxygen atoms (Ot) comprise the local structure. In the glass, feature 1 near 1,167 cm−1 represents a symmetric stretch of P-Ot bonds, feature 2 near 760 cm−1 is a symmetric stretch of P-Ob bonds, while feature 3 near 1,250 cm−1 is an asymmetric stretch of P–Ot bonds. The chains are infinitely long close to 10,000 tetrahedral units (Walsh et al., 1992; Brow, 2000) in the crystalline phase but are estimated to be about 400 tetrahedral units (Wazer, 1958; Bunker et al., 1984; Walsh et al., 1992; Brow, 2000) long in the glassy phase. But, there are also other striking differences in Raman scattering of the glass from that of the crystalline NaPO3. In the crystal, one observes (Figure 3) a single optical phonon, with a frequency of 1,172 cm−1 with a rather narrow linewidth of 4.8 cm−1. In g-NaPO3, one observes a triad of modes (Velli et al., 2005; Novita and Boolchand, 2007): a majority mode near 1,167 cm−1, and two satellite ones on the low-frequency side of the majority mode. One of these satellites is centered near 1,151 cm−1, while the second one near 1,105 cm−1 (Figure 7).
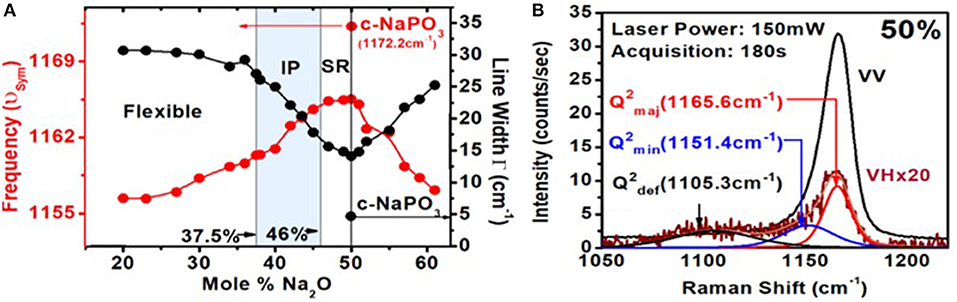
Figure 7. (A) Variations in the Raman P–Ot symmetric stretch mode frequency and linewidth (FWHM) as a function of glass composition. (B) Raman polarization results on g-NaPO3 showing both the IVV and IVH scattering of Q2 species. Note that in the IVH scattering, one observes two satellite modes on the low-frequency wing near 1,151 cm−1 and near 1,105 cm−1 of the majority mode near 1,166 cm−1. The scattering strengths of the triad of modes associated with the Q2 species vary with x in a rather systematic fashion (Figure 10).
The centroid of these satellite modes could be localized by Raman polarization measurements on g-NaPO3 (Figure 7B). In Figure 7B, we show both the IVV and IVH scattering. In IVV scattering, the E-field vector of the incident light and that of the scattered light are kept vertical. In IVH scattering, the incident laser light E-field was vertical, but the scattered light E-field polarization was horizontal. In the IVH configuration, one can clearly discern the majority mode from the two satellite modes and localize the centroid of the latter two for detailed Raman lineshape analysis.
In Figure 8, we provide a global summary of the Raman scattering lineshapes observed in the glasses in the 20% < x < 60% range of soda. Examples of lineshape deconvolution of feature 1 associated with the triad of modes related to Q2 local structures (Velli et al., 2005; Novita and Boolchand, 2007) are included in Figure 9. The scattering strength and mode frequency variation as a function of glass composition for the triad of modes associated with Q2 local structures are included in Figure 10. The triad of modes henceforth will be labeled as a majority mode, , near 1,166 cm−1, a minority mode, , near 1,151 cm−1, and a broad mode that we believe is a defect mode, , near 1,105 cm−1. The triad of modes are observed at non-stoichiometric glass compositions as well, and their scattering strengths and frequency change in a rather systematic fashion as a function of glass composition. In particular, one finds the minority mode, , shaded blue (Figure 9), to steadily increase in scattering strength as the soda content increases in the 47% < x < 50% range. In the ultraphosphate range, the minority and defect modes grow at the expense of the majority mode. There are features of the data that suggest that the minority and majority modes in the ultraphosphates are intrinsic to the Q2 local structure in the glass, while the defect mode, , is most likely stabilized with the presence of an additional Na+ cation in the vicinity of the Q2 species. The minority and defect Q2 site act, we suspect, functionally as topological defects in the ultraphosphates. Finally, in our Raman scattering experiments, we do not observe a high-frequency shoulder to the Q2 majority mode near 1,200 cm−1 (Figures 8, 9) that was noted by Hudgens (1994), in the 40% < x < 45% range of soda concentration. The shoulder mode was traced by Hudgens (1994) to the presence of strained tetrahedral units in their glass samples at room temperature.
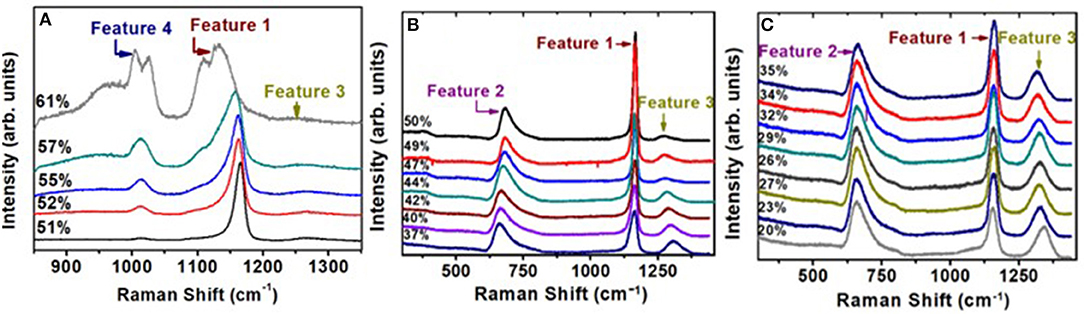
Figure 8. Observed Raman scattering in (Na2O)x(P2O5)100−x glasses as a function of soda content “x.” Spectra (A) are those in the pyrophosphate range, 50% < x < 61% range, while spectra (B,C) are those in the ultraphosphate range, 20% < x 50%. In the 40% < x < 45% range, we do not observe a shoulder near 1,200 cm−1 to the majority mode near 1,166 cm−1, as noted by Hudgens et al. (1998) in their ultraphosphate glasses.
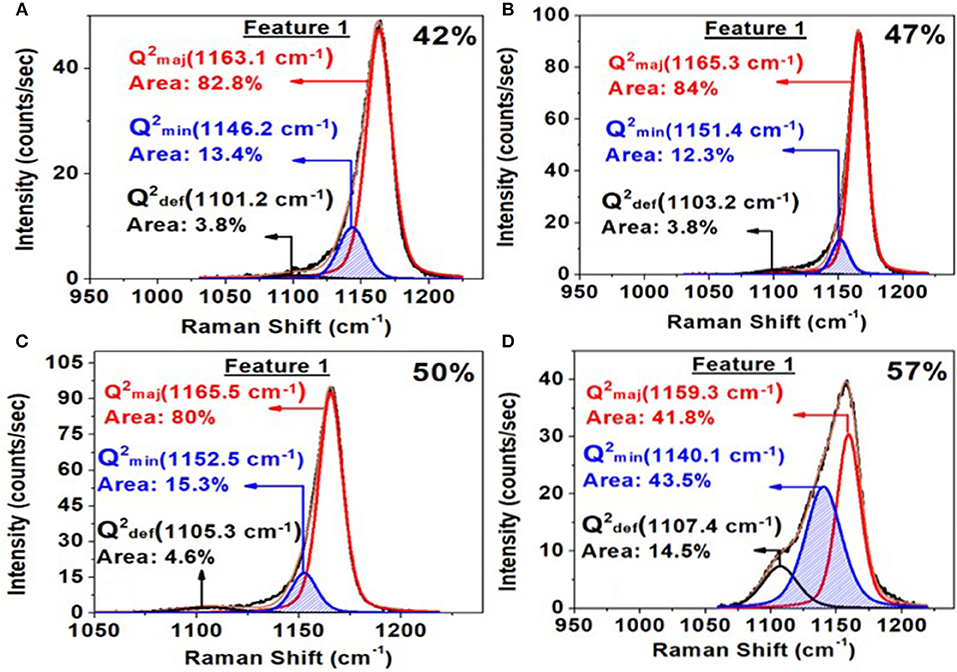
Figure 9. Deconvolution of the triad of modes associated with feature 1 near 1,166 cm−1 observed in the Raman scattering at x = 42% in (A); at x = 47% in (B); at x = 50% in (C) and at x = 57% in (D). Also noteworthy in these spectra is the complete absence of a shoulder near 1,200 cm−1 noted by Hudgens et al. (1998) in Raman scattering of their glass samples in the 40% < x < 45% range.
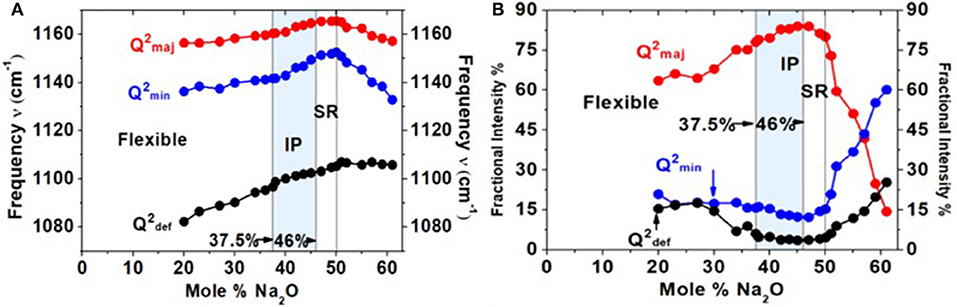
Figure 10. (A) Mode frequency and (B) mode scattering strength variation of the triad of modes associated with the Q2 local structure as a function of x. All modes blue-shift with glass composition in the 20% < x < 50% range. The scattering strength variation (B) shows that the majority mode (red dataset) increases in scattering strength with x; the minority mode (blue dataset) and defect band (black dataset) show a global minimum in the intermediate phase.
We have also analyzed features 3 and 4 as a super-position of requisite number of Voight lineshapes. In Figures 11A–D, we illustrate some examples of these fits. The observed variation of the scattering strength and mode frequency of Q3 local structure associated with feature 3 can be observed in the results. In Figures 11E–H, we provide the lineshape deconvolution of feature 4 associated with Q1 local structure species, and here again, the results reveal a triad of modes (Tatsumisago et al., 1992): a majority mode, near 1,014 cm−1, a minority mode, , near 1,005 cm−1, and a defect mode, , near 960 cm−1 displaying a rather broad band. With increasing soda content in the 50% < x < 60% range, we observe the minority and defect modes to grow at the expense of the majority mode. In addition to features 1, 2, and 3 visible in the ultraphosphates, we also have analyzed feature 4 observed near 1,012 cm−1 associated with the Q1 local structure in the pyrophosphate glass compositions. These results are included in the plots of Figure 11.
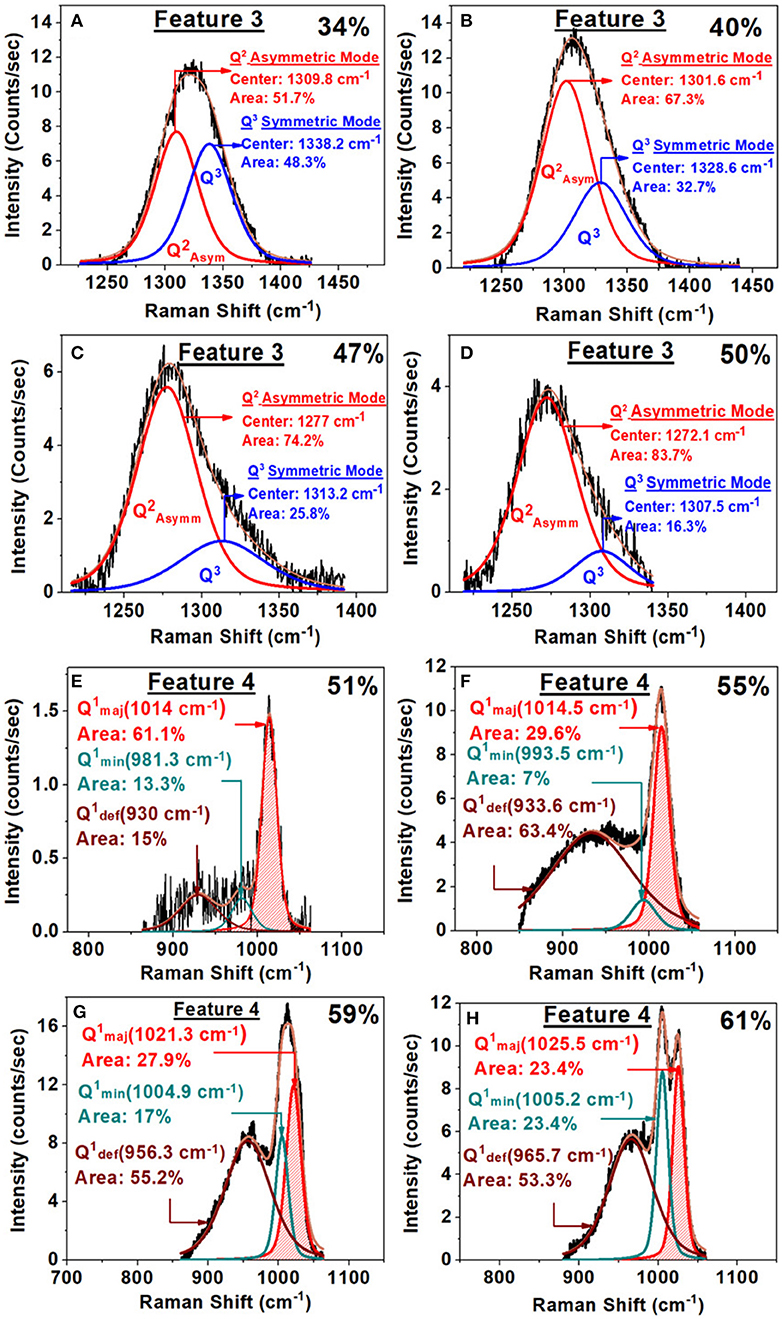
Figure 11. (A–D) Examples of a Raman lineshape analysis of feature 3 associated with the Q3 local structure in SPGs with increasing x. Note that as x increases the Q3 related vibrational mode scattering strength steadily decreases. (E–H) Examples of Raman lineshape feature 4 deconvolution associated with the Q1 local structure (mode near 1,012 cm−1) in SPGs as a function of glass composition. Note that the scattering strength of the mode in question increases steadily with composition in the 50% < x < 59%.
A summary of the observed scattering strength ratio of Q2 species-related modes (majority plus minority (feature 1) and Q3 species-related mode (feature 3) is plotted in Figure 12A as the red filled data points in the 20% < x < 50% range. The scattering strength ratio of the Q1 mode (majority plus minority) is displayed in Figure 12A as the red data points in the 50% < x < 61% range of composition. For the ultraphosphate compositions (Figure 12A), it became clear that the observed scattering strength ratio of Q3/Q2 fraction was low compared to the expected variation based on glass stoichiometry (thin black line in Figure 12A) considerations. This suggests that the Raman scattering cross sections of the two modes in question are different. By requiring that the observed Q3/Q2 fraction to equalize near x = 33.33%, as the glass stoichiometry requires, one finds that the Raman cross section for the Q2 mode exceeds that of the symmetric stretch mode of Q3 species by a factor of 2.85. The suggestion is qualitatively supported by Naval Research Laboratory Molecular Orbital Library (NRLMOL) calculations (Porezag and Pederson, 1996, 1999; Neugebauer et al., 2002; Park et al., 2006). The normalized Q3/Q2 fraction, plotted in Figure 12A as the blue data points, then becomes a good representation of the concentrations of the two species in the ultraphosphates.
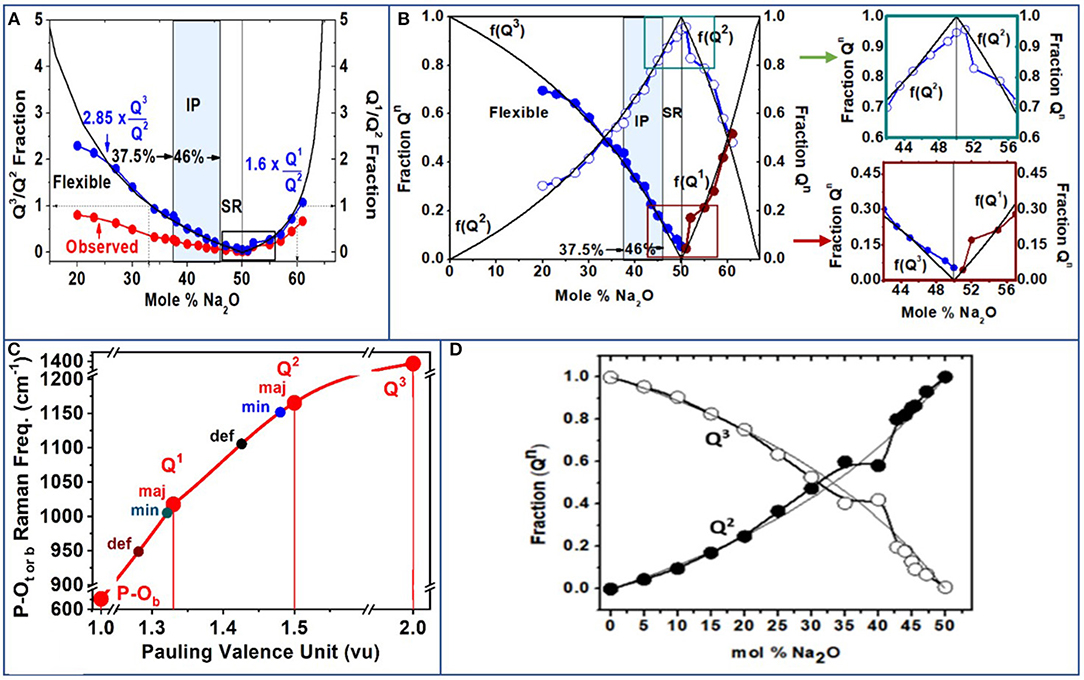
Figure 12. (A) Observed Q3/Q2 fractions and Q1/Q2 fractions (red data points) obtained from Raman scattering features 1, 3, and 4 (Figures 8, 9, 11). The blue data points are obtained after the Raman scattering strengths are corrected for Raman cross sections (see text). (B) The f(Q3) and f(Q2) and f(Q1) fractions are plotted as a function of x. The variations in the fractions f(Q3) and f(Q2) near x = 50% deviate measurably from the mean-field behavior as shown in the two insets of (B). See text for details. (C) Raman P–Ot mode frequency for the Q3 species and the triad of Q2 and Q1 species as a function of Pauling valence unit (PVU). For completeness, we include Raman P–Ob mode frequency with a PVU of 1. (D) Fractions of Q2 and Q3 species deduced from 31P NMR results of Brow et al. (1994, 1995); Brow (2000).
The observed Q1/Q2 fraction, deduced by taking the scattering strength ratio of the sum of the majority and minority modes of Q1 species and Q2 species, respectively, (Figures 9, 11E–H, 12A), are plotted as the red data points in the pyrophosphate range of compositions, 50% < x < 61%. Here again we find that the observed scattering strength ratios are systematically lower than the expected Q1/Q2 concentration ratio based on glass stoichiometry considerations. These results suggest that the Raman cross section of the Q2 species exceeds that of the Q1 species by a factor 1.60. The Raman cross-section ratio is deduced by requiring the concentration f(Q1)/f(Q2) = 1 at x = 60%, as required by stoichiometric considerations (Wazer, 1958; Brow, 2000).
From the normalized Q3/Q2 ratio, one could cast the results in terms of the individual fractions f(Q3) and f(Q2), since the sum of the two fractions must equal 1. Thus, f(Q2) = [1 + Q3/Q2]−1; f(Q3) = 1 – f(Q2). For the pyrophosphates (x > 50%), by establishing the normalized Q1/Q2 from the Raman experiments, we obtained f(Q2) = [1 + Q1/Q2]−1, and f(Q1) = 1 – f(Q2).
The observed f(Q3), f(Q2), and f(Q1) fractions from the present Raman scattering (Figure 12B) broadly track the expected fractions (thin black lines in Figure 12B), based on glass stoichiometry considerations. In the ultraphosphates (Wazer, 1958; Brow, 2000), 0 < x < 50% range, f(Q3) = (1 – 2x)/(1 – x), and f(Q2) = x/(1 – x). In the pyrophosphates (Wazer, 1958; Brow, 2000), 50% < x < 66.6%, f(Q1) = (2x – 1)/(1 – x), and f(Q2) = (2 – 3x)/(1 – x). Nevertheless, there are deviations from the mean-field behavior that appear near x = 50%. These deviations are small but finite and systematic (Figure 12B insets). For example, we find that the concentration of the Q3 species does not go to zero at x = 50%, but it does so closer to 52%. Furthermore, Q2 species concentration never reaches its expected maximum value of 1.0 near x = 50%. These deviations are due to the presence of the defect Q2 and defect Q1, local structures that are formed, and drain away some of the alloyed soda, leading to the scattering strength anomalies near x = 50%.
A useful perspective on the local structures of the triad of Q2 and Q1 species observed in Raman scattering can be obtained by plotting the P–Ot or P–Ob stretch mode frequency as a function of Pauling valence unit (PVU; Figure 12C; Brow, 2000). For a Q3 species, the PVU would be 2.0 since for the three BO bonds each possessing a PVU of 1 leaves the P = Ot bond with a PVU count of 5 – 3 = 2, given the pentavalent nature of the P cation. For a Q2 and a Q1 species, one can show that the PVU would respectively be 1.50 and 1.33. We have included in the plot of Figure 12C the case of P–Ob stretch mode frequency since these bonds by definition have a PVU of 1.0. On the plot of Figure 12C, one can see a quasi-linear variation of the P = Ot or P–Ob mode frequency with the PVU. Both the majority and minority modes of Q2 and Q1 species have mode frequencies that are quite close to each other. On the other hand, the defect band shifts measurably to lower frequency and has a substantially larger width. We discuss this issue in section Discussion. For completeness, we include in Figure 12D the 31P NMR results on the f(Q3) and f(Q2) fractions reported by Brow et al. (1994); Brow (2000) in the ultraphosphate glasses. The correlation between the NMR results and the Raman scattering is most encouraging.
Infrared Reflectance
Infrared as Probe of Water Traces in Sodium Phosphate Glasses
The presence of water impurity atoms creates dangling ends of P–H and P–OH as the P–O–P–O chains are cut. The vibrational modes of the proposed dangling ends have been identified (Novita and Boolchand, 2007; Colthup, 2012) to be as follows: the P↔(OH)− stretch (Colthup, 2012) at 1,654 cm−1, the P↔H stretch (Daasch and Smith, 1951) at 2,370 cm−1, and the O↔H stretch (Novita and Boolchand, 2007) at 2,850 cm−1. These were used as a test of bonded water in the chains characteristic of these glasses. In almost all glasses synthesized, we could not detect these vibrational modes. But in select glasses, we did observe these and also found that the Tg of these glasses were measurably lower than their dry counterparts. These results gave us confidence that glasses synthesized in the present work are rather dry. Furthermore, in general, presence of water enhances the IR absorption because of the high dipole moment of H2O molecule that stains the chains. That feature is readily apparent when we compare the response of a wet glass sample with the dry one. All glass samples B synthesized in the present work were examined by FTIR and revealed no evidence of free or bonded water in the glasses.
Complementary Role of Infrared and Raman Activity in Sodium Phosphate Glasses
Confidence in the assignment of triad of modes associated with the Q2 and Q1 species emerged by comparing the IR response of the glasses in Figures 4B,C with the Raman response as illustrated in Figure 4A for the case of the stoichiometric NaPO3 glass. Although the minority and defect modes of the Q2 species are weakly excited in Raman scattering (Figure 4A), the IR response from these excitations is rather high (Figures 4B,C). Specifically, if one compares the scattering strength of the minority mode near 1,150 cm−1, one finds it is weakly excited in Raman but strongly in IR–TO response (Figure 4B). In the case of the defect mode near 1,105 cm−1, the enhancement is qualitatively higher when one compares the results of Figure 4A with Figure 4B. The complementary response of Raman and IR response in SPGs were observed, in general, at non-stoichiometric compositions as well, and it was helpful in better understanding the nature of the triad of modes associated with the Q2 and Q1 species.
Longitudinal Optic–Transverse Optic Splitting in Sodium Phosphate Glasses
Raman scattering, FTIR-TO response (ε), and FTIR-LO response [Im(−ε−1)] for all SPGs were obtained, the latter two from specular reflection data on flat disc-like specimen. We show an example at x = 50% in Figure 4. The two highest frequency optic modes in NaPO3 glass appear near 1,276.8 cm−1 (νas Q2) and near 1,317.2 cm−1 (νas Q3) in Raman scattering (Figure 4D). The corresponding TO mode frequency (νTO) and LO mode frequency (νLO) were also measured (Figures 4E,F; Galeener and Lucovsky, 1976). In fact, we established the general variation in νTO and νLO mode frequency with glass composition “x” (Figures 13A,C) and found that νTO(x) mode frequency is generally lower than νLO(x) as expected, but in the IP, νTO(x) blue-shifts to nearly equal νLO (x), leading to the νLO-νTO frequency difference to display a global minimum in that special phase. Furthermore, we find that the variation in both the LO and TO mode frequency displays a rather abrupt blue shift in going from x = 36% to x = xr = 37.5%, near the rigidity transition, and a general softening of these excitations as one goes across the IP (Figure 13). It is generally acknowledged that LO-TO mode frequency splitting (νLO-νTO) provides a measure of the internal E-fields setup in the polar glasses made of positive (P5+, Na+) cations and negative (O2−) anions. Most noteworthy is the finding that the νLO-νTO splitting shows a global minimum in the IP (Figure 13) for both the Q2 asymmetric mode and the Q3 asymmetric mode (Figure 4A).
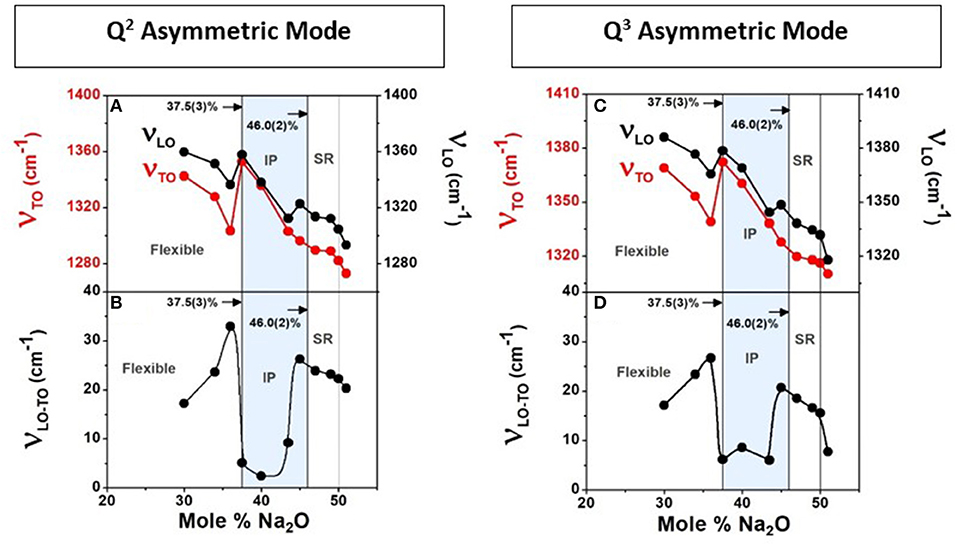
Figure 13. The observed LO and TO mode frequency variation with glass composition for the Q2 asymmetric mode (A) and the Q3 asymmetric mode (C) in (Na2O)x(P2O5)100−x glasses (Figure 4) in the 30% < x < 60% range. The frequency difference νLO − νTO displays a broad minimum in the IP (B) for the Q2 asymmetric mode and (D) for the Q3 asymmetric mode. The reduction in LO–TO splitting or internal Electric fields in the IP could be the consequence of the absence of network stress and network compaction that leads to a redistribution of charges in these ionic glasses.
Trends in Molar Volumes
Compositional trends in the variation of molar volumes [Vm(x)] of the present SPGs are summarized in Figure 6D. With increasing soda content, one finds Vm(x) steadily decreases from a value near 56.0 cm3/mol to about 40 cm3/mol in the 20% < x < 50% range. The reported value (Hudgens, 1994) of Vm in c-NaPO3 is close to 41.1 cm3/mole, in reasonable accord with the value we obtained in the corresponding metaphosphate glass. The baseline variation Vm(x) is sketched by the smooth curve drawn through the data in Figure 6D. A closer perusal of the results show that IP glass compositions reveal evidence of an additional reduction in Vm or compaction of the glassy network from the average behavior that is illustrated by the vertical hash marks in the inset of Figure 6D. The compaction remarkably coincides with the reversibility window range of 37.5% < x < 46.0%. Compaction of IP glass compositions has been noted in chalcogenides (Bhosle et al., 2012b; Chakraborty and Boolchand, 2014) previously. The effect is generally ascribed (Boolchand et al., 2013) to the consequence of the balance of near-neighbor covalent bonding interactions exhausting the available degrees of freedom in the isostatically rigid backbone formed in the IP. That balance promotes weaker but longer range Coulombic forces to additionally compact networks formed in the IP, displaying evidence of molar volume window.
Discussion
Linking Melt Fragility Index With Glass Topological Phases
Topological Phases
The calorimetric results on SPGs obtained in the present work along with those reported earlier (Cormia et al., 1963; Angell and Rao, 1972; He and Thorpe, 1985; Martin and Angell, 1986; Wäsche and Brückner, 1986; Angell, 1990; Sales, 1990; Hudgens and Martin, 1993; Hudgens, 1994; Hoppe, 1996; Angell et al., 1999; Brow, 2000; Sidebottom and Changstrom, 2008; Fabian and Sidebottom, 2009; Gupta and Mauro, 2009; Mauro et al., 2009; Sidebottom and Schnell, 2013; Hermansen et al., 2014, 2015; Sidebottom, 2014; Sidebottom et al., 2014) are summarized in Figure 6. In addition, we have included in Figure 6 the compositional trends in molar volumes Vm(x) obtained in the present glasses. The central finding of the present work is the existence of a reversibility window in the 37.5(3)% < x < 46.0(2)% range of soda across which glass transitions become thermally reversing. The square-well-like (Chakravarty, 2003; Chen et al., 2008; Bhosle et al., 2012a,b; Gunasekera et al., 2013b; Chakraborty and Boolchand, 2014; Chakraborty et al., 2017) variation of the non-reversing heat flow ΔHnr(x) in the indicated range is a direct evidence of the isostatically rigid IP formed in the present glasses. Micoulaut (Micoulaut, 2010; Mantisi et al., 2015) has shown that the enthalpy of relaxation at Tg of a glass constitutes a measure of nc-3, i.e., departure of the glass network from isostaticity (nc = 3). The increasing Tg in the 20% < x < 50% range shows that glasses at x < 37.5%(3) are in the flexible phase, while those at x > 46.0(2)% are in the stressed rigid phase, thus fixing the three glass topological phases in the present glasses.
In several publications, Sidebottom has developed a coarse graining model of these glasses by considering only the bridging oxygen atoms serving to define the glass backbone. In this approach, one excludes the terminal oxygen atoms and the Na+ ions in evaluating constraints. In this approach, the mean coordination number of the glass backbone is taken as 3 at x = 0 and as 2 at x = 50%, and, in general, one can show,
A mean coordination number of <r> of 2.40 is realized when x = 37.5% in Equation 3. Thus, in the coarse graining (Sidebottom et al., 2014) approach, one expects the percolation of rigidity to occur when x increases to x = 37.5%, and that prediction is in harmony with our observation of the rigidity transition near that composition in the present SPGs.
Dangling ends of a network play no role near the rigidity transition, but they soften a stressed rigid network and stiffen a flexible network as suggested earlier (Mamedov et al., 2003; Qu and Boolchand, 2005; Boolchand and Goodman, 2017). If one considers the dangling ends of the base P2O5 glass, a count of the bond-bending and bond-stretching constraints (Georgiev and Boolchand, 2000) shows the quasi-tetrahedral local structure to be isostatically rigid (nc = 3). The vanishing of ΔHnr(x) term (Figure 6) at x = 0 is in harmony with its isostatic character of the base glass. The increase of Tg(x) in the 15% < x < 50% range would, of course, be in conflict with the coarse graining model, which predicts <r> to steadily decrease in the indicated glass range. So, one does not expect the topological phase assignment of the coarse graining model to be in harmony with the observed findings. But since the percolation of rigidity near <r> = 2.40 is independent of the count of dangling ends, the onset of rigidity is correctly predicted by the coarse graining model.
Correlating Melt Dynamics With Glass Topological Phases
The second key finding of the present work is the observation of a melt fragility window in the 37.5(3)% < x < 46.0(2)% range, where the fragility index m displays a square-well-like variation with the fragility index in the well acquiring a value m somewhat lower than 20. The finding underscores the super-strong characteristic of melts (Gunasekera et al., 2013a; Chakraborty and Boolchand, 2014) formed in the fragility window (Figure 6C). The correlation between the variation of ΔHnr(x) (Figure 6B) and m(x) (Figure 6C) underscores that super-strong melts upon cooling (Boolchand and Goodman, 2017) will give rise to isostatically rigid glasses, while fragile melts formed at x < 37.5(3)% and at x > 46.0(2)% will form flexible and stressed rigid glasses. For stressed rigid glasses, one thus observes Tg to increase with fragility index. For flexible glasses, on the other hand, the reverse is the case, i.e., m(x) increases as Tg decreases at least close to the rigidity transition near x = 37.5% (Figure 6C).
The correlation between melt dynamics and glass topological phases has been observed recently in the chalcogenides such as Ge–Se (Bhosle et al., 2012a,b) and Ge–S (Chakraborty et al., 2017). The present case of SPG is one of the first on a modified oxide where melt dynamics correlate with glass topological phases. These findings strongly suggest that the dynamics of glass-forming melts may well encode the glass topological phases, as a general principle of glass science.
Challenges of Synthesis and Handling Sodium Phosphate Glasses
The fragility index reported by Fabian and Sidebottom (2009) show m = 80 at x = 50%, and the term to steadily decrease as x decreases to 0 to display a value of m = 20 for the base P2O5 melt in their dynamic light scattering measurements. That trend is broadly similar to the one observed by us in our melts, although the absolute values of m observed by us are systematically lower. It is encouraging to see that for the base glass (at x = 0), the fragility index reported in ref. (Fabian and Sidebottom, 2009) is actually quite close to the one observed in the present work by m-DSC. These fragility index results differ qualitatively from those of Hudgens (1994) and Martin (Martin and Angell, 1986; Hudgens and Martin, 1993). Hudgens and Martin (1993) were the first group to demonstrate how P2O5 could be dried and purified by sublimation, and we as well as Fabian and Sidebottom followed that procedure. The results in Figure 5 presented in the present work on calorimetric properties of the base P2O5 glass highlight some of the challenges in working with and handling of the base P2O5 glass in DSC and m-DSC experiments. Not only must the bulk glass be dry but the Al pans and lids must be especially dry and have the capability to be hermetically sealed to get reliable calorimetric results. The lower Tg(x) (Figure 6A) and higher fragility index for the base P2O5 glass at x = 0% (Figure 6B) reported by Hudgens and Martin in their DSC experiments compared to those reported by us in the present m-DSC ones, particularly at x < 20%, are suggestive that these large differences probably come from inadvertent traces of water impurity doping of these P2O5-rich bulk glasses.
Glass Molecular Structure Evolution With Composition From Calorimetric, Raman Scattering, and 31P NMR Studies in Sodium Phosphate Glasses
Three Regimes of Structure Evolution
The Tg(x) variation in the present SPGs displays three distinct regimes of variation. At low x, 0 < x < 15% range, soda serves as a network modifier cutting BO bonds to create NBO ones, leading to a reduction of Tg(x) at a rate that is fully consistent with the predicted slope equations based on the stochastic agglomeration theory (SAT) (Micoulaut, 1998; Georgiev et al., 2001).
In Equation 4, To represents the Tg of the base P2O5 glass, and the slope dTg/dx = 19.7°C/mole % of Na2O, taking Tg to be 704 K. The observed slope of 20°C/mol% of Na2O is in harmony with the SAT predicted slope (Micoulaut, 1998). If Na+ ions were to bond with the terminal Ot of the P-centered quasi-tetrahedral local structure, Ot=P(O1/2)3, the network connectivity would remain unaltered and Tg(x) would remain unchanged. The Micoulaut slope equations have been calculated for a variety of modified oxides such as (Na2O)x(SiO2)100−x and (Na2O)x(GeO2)100−x. In each case, the Tg(x) decrease with soda content can be traced to the reduced network connectivity as bridging oxygen atoms are converted into non-bridging ones. The observed and calculated slopes, dTg(x)/dx, are in remarkable accord with each other (Micoulaut, 1998; Micoulaut and Naumis, 1999).
Returning to SPGs, at intermediate x, 15% < x < 50%, the additive continues to serve as a network modifier but adds to the cohesion by promoting the growth of the Q2 species forming part of a P–O–P–O– chains. Na+ ions now charge compensate the P-centered tetrahedral unit having two bridging oxygen (Ob) and two terminal oxygen (Ot) permitting the P = Ot bond to form. At higher x, 50% < x < 60% range, the Q2-bearing chains are fragmented by pairs of Q1 species forming the pyrophosphate units. The loss of backbone structure is reflected in both Tg (x) and ΔHnr(x) to steadily decrease at x > 50%. This broad picture of glass structure evolution suggested by the trends in Tg(x) variation finds support in Raman scattering and IR reflectance results.
Fraction of Qn Species and Molecular Structure of the Intermediate Phase From Raman Scattering
Raman scattering (Figure 8A) results in the present glasses reveal the three features 1, 3, and 4. Analysis of feature 1 near 1,150 cm−1, associated with the Q2 local structure, shows a triad of modes (Figures 9, 10), a majority mode, a minority mode, and a defect mode. Feature 3 near 1,300 cm−1 was analyzed in terms of two modes (Figures 11A–D). The highest frequency mode represents the symmetric stretch mode of Q3 species. Feature 4 near 1,012 cm−1 is identified with Q1 species, and its scattering strength steadily increases as x > 50% as shown in Figures 12A,B. These results were cast in terms of the compositional dependence of the fractions f(Q2), f(Q3), and f(Q1) species deduced from Raman scattering (Figure 12B) and show that they correlate well with the 31P NMR results of Figure 12D. It is encouraging that two independent probes of glass structure, one nuclear, the other optical, have converged to provide closely similar details of local structure in terms of the Qn species of these SPGs. Recently, Bødker et al. (2018) have successfully reproduced the Qn speciation in SPGs (Figures 12B,D) using a purely statistical mechanical approach by using the experimentally known populations at one select composition, viz., NaPO3.
The Raman mode frequency and mode scattering strength variation for the triad of Q2 species displays other rather striking features (Figures 10A,B) that provide new clues to the formation of the IP. All three modes steadily blue-shift with increasing x, giving unambiguous evidence of a stiffening of the glass network in the 20% < x < 50% range. Furthermore, the minority and the defect mode of the Q2 species show a global minimum in concentration in the IP range, wherein the majority Q2 mode near 1,166 cm−1 steadily increases in scattering strength with x. These features, i.e., a minimum in the concentration of the minority mode and defect mode along with an average Q2/Q3 fraction of near 4 (Figure 12B), serve to define the characteristic structural features of the stress-free backbone of the IP.
The generic connection between the triad of modes of the Q2 species is made more quantitative by PVU considerations (Figure 12C; Brow et al., 1995). The plot of the Raman active P–Ot-related stretch mode frequency scaling with the PVU parameter (Figure 12C) provides a quantitative measure of the P–Ot bond strengths in each of these species. The majority and minority modes of the Q2 species possess P–Ot Raman frequency that are quite close to each other and illustrate how local structural disorder is intrinsically built in the chain-bearing glass backbone. The defect mode, on the other hand, is rather broad and is suggestive that its local structure is more distorted, most likely because of the presence of an additional Na+ cation in the vicinity of the Q2 local structure. Inclusion of Na+ ion is suggested by the anomalies in the fraction of Q2 and Q3 species manifested near x = 50% when the concentration of the defect site is high in the stressed rigid glass. We alluded to these anomalies earlier in section Raman Scattering and Figure 12B.
We view the minority mode and the defect mode of Q2 species to functionally serve as stress relief entities of the chain-bearing backbone. Their minimum in the IP range is consistent with the stress-free nature (Wang et al., 2005) of that phase, and their presence a reminder of the role of fluctuations that build the configurational entropy of that phase (Yan, 2018). The minority mode and defect mode represent topological defects that assist self-organization.
At x > 50%, the continued growth in concentration of the minority mode and defect mode at the expense of the majority mode of Q2 species (Figure 10B) constitutes signature of the loss in integrity of the P-O-P-chains. But a far more significant structural change occurs, viz., formation of Q1 species (1,012 cm−1). The Q1 species break up the Q2-bearing chains as schematically illustrated (Figure 12B). The scattering strength variation of the Raman mode with x (Figure 12B) shows that the Q1 species become the majority species at x > 60% rapidly fragmenting the backbone and leading Tgs to mildly decrease as the network connectivity lowers upon growth of Q1 dimers.
Fragmentation of Q2-Bearing Chains by Q1 Dimers in the Pyrophosphates (50% < x < 60%)
By bringing two additional Na+ cations next to the P–O–P– chain (Figure 14A), one converts the two bridging oxygen atoms (Ob) into two terminal ones (Ot), thus forming the building block of a Q1 dimer or a pyrophosphate (Figure 14B) as schematically illustrated in Figure 14. The three P-Ot bonds in the Q1 species are nearly equivalent as suggested by simulations NRLMOL (Porezag and Pederson, 1996, 1999; Neugebauer et al., 2002; Park et al., 2006) and PVU estimates (Brow et al., 1995; Brow, 2000). The cluster calculations also reveal the Raman cross section of the P–Ot stretch vibration of Q2 species exceeds that of the corresponding vibration of Q3 species by a factor of 4.5, a factor that compares reasonably with the experimental deduced value of 2.85 as mentioned earlier in section Raman Scattering.
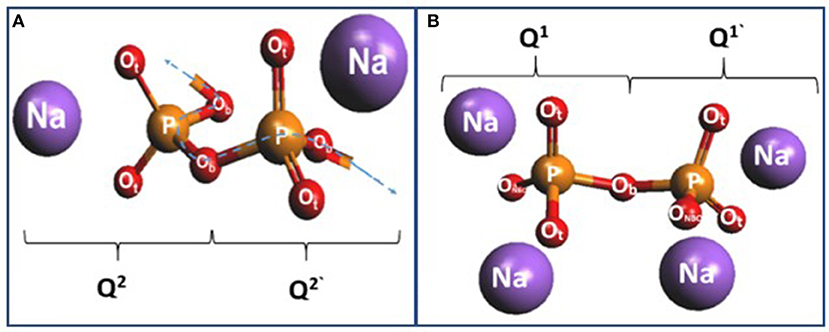
Figure 14. (A) A pair of Q2 species forming the building block of P–O–P–O chains near x = 50%. (B) The uptake of two Na+ ions with a pair of Q2 leads to the formation of a Q1 dimer (pyrophosphate) in the right panel.
Simple constraint counting algorithms show that while Q3 species and Q2 species are nearly isostatic (nc = 3), the Q1 species is under constrained (nc = 2.69).
It is useful to mention that the observed scattering strength ratio of the Q1/Q2 species deduced from the Raman measurements appear to be somewhat lower than the expected ratio based on stoichiometry considerations (Figure 12A). The latter considerations also place the Q1/Q2 fraction to equalize at x = 60%. By imposing that condition, one finds the Raman scattering cross section of the Q2 species to exceed that of the Q1 species by a factor of 1.60. Our NRLMOL estimates of the Raman cross section of the 1,166 cm−1 mode (Q2) to the 1,012 cm−1 mode (Q1) is found to be 1.93. The correlation between theory and experiment on the Raman cross sections of the modes due to Q3, Q2, and Q1 species is, thus, in reasonable accord with each other.
We had noted earlier that the square-well-like lowering in the enthalpy of relaxation ΔHnr(x) is the signature of the IP (Figure 6B). But we also find that the window sits on a slopping baseline in ΔHnr(x) that increases monotonically with x in the 20% < x < 50% range, and furthermore, within the window, the ΔHnr(x) term remains finite and constant near 0.35 cal/gm. How can we understand this rather peculiar result? Such a result was not observed in chalcogenides, where we always find the reversibility window to possess a nearly vanishing enthalpy of relaxation in the window (Novita and Boolchand, 2007; Chen et al., 2008; Bhosle et al., 2012a,b; Gunasekera et al., 2013b).
The presence of a finite concentration of both minority mode and defect mode of the Q2 species (Figure 10B) that coexist with the main local structures (Q2 and Q3 species), we conjecture, contributes a finite contribution to the ΔHnr(x) term from the presence of these under constrained local structures that form part of the backbone. These under constrained topological defects contribute to the ΔHnr(x) term over the broad 20% < x < 50% range as their concentration suggests (Figure 10B). In the IP, a local minimum in the ΔHnr(x) term comes as the right mix of Q2 (majority mode) and Q3 species come together to self-organize the network backbone.
Infrared Reflectance, Longitudinal Optic, and Transverse Optic Response
A significant finding from the IR measurements is that the LO and TO mode frequency splitting, νLO-νTO, shows a global minimum in the IP (Figure 13) for both the two highest-frequency optic modes, Q2 asymmetric mode and the Q3 asymmetric mode (Figure 4A). The result is most likely related to the stress-free nature of networks formed in the isostatically rigid IP. That speculation clearly needs to be tested theoretically, and it is beyond the scope of the present work.
Here, we would like to draw attention to the fact that the blue shift of the TO mode frequency, νTO, in the IP where molar volumes decrease (Figure 6D) leads in a natural fashion to a mode Gruneisen parameter, γ = −(V/ν)dν/dV of 0.75(10). The magnitude of γ suggests (Zallen, 1974) an underlying mode stiffness that is characteristic of covalent bonds. That result appears reasonable given that for a TO mode of the predominantly Q2-like chains formed in the IP glasses, one expects the P-Ot bonds, locally transverse to the chains, to be involved. And these are the very bonds that will be compressed as the glass backbone compacts (Figure 6D) and the interchain spacing decreases. We attribute the blue shift of the TO vibrational excitation in the IP to the underlying network compaction. The LO mode, on the other hand, must involve displacement of P and Ob atoms locally along the chain axis. The P–Ob bonds are softer than the P–Ot ones by almost a factor of 0.60, as suggested by the Raman mode frequency ratio of 670 cm−1/1,160 cm−1. For that reason, we believe the LO mode frequency may remain largely unaffected by compaction of the network structure in the IP.
The global reduction in local electric fields observed in the present polar glass in the IP is reminiscent of a parallel finding in sodium germanate glasses (Rompicharla et al., 2008). The finding may well be a general feature of glasses. We hope the present results stimulates further discussion of the subject.
Conclusions
We have examined scores of especially dry and homogeneous (Na2O)x(P2O5)100−x glass compositions over a wide range, 0 < x < 61%, in m-DSC, Raman scattering, infrared reflectance, and molar volume experiments. The glass transition temperature variation Tg(x) displays three regimes; at low x (0 < x < 15%), the additive serves as a network modifier converting bridging oxygen atoms (BO) of the parent base material into non-bridging oxygen atoms (NBO) lowering the network connectivity reflected in Tg(x). At higher x, 15% < x < 50%, the additive serves as a network modifier but adds to the cohesion of the network with Tg(x) monotonically increasing as chains of Q2 species steadily grow at the expense of quasi-tetrahedral units Ot=P(O1/2)3 of the base glass. In this regime, we observe a thermally reversing, square-well-like window, bordered by an abrupt rigidity transition near xr = 37.5% and a stress transition near xs = 46.0%. Between these two transitions, glasses are viewed to form an isostatically rigid network, the IP. Melt fragility index, established using the complex Cp formalism, reveals m(x = 0) to be 15, to increase monotonically with x, and to display a square-well-like fragility window in the 37.5(3)% < x < 46.0(2)% range. That range coincides with that of the reversibility window. The fragility window coinciding with the reversibility window underscores that melt dynamics encode glass topological phases. At still higher x (> 50%), Tg(x) mildly decreases with increasing x, confirming that glasses steadily segregate as pyrophosphate units emerge as revealed by the Q1 structural species in Raman scattering.
Raman scattering measurements also show that the fraction of f(Q3(x)), f(Q2(x)), and f(Q1(x)) generally tracks the mean field behavior based on stoichiometry of glasses. These trends are quite similar to those reported earlier by Brow et al. (1994) and Brow (2000). Raman scattering also shows that the Q2 structural species always appear with two satellite modes on the low-frequency side. These satellite modes are viewed as topological defects present in glasses.
Infrared specular reflectance measurements on bulk glasses confirm the dryness of glass samples synthesized. Furthermore, these measurements also reveal the LO and TO mode frequencies to change with glass composition in a rather systematic fashion. One finds that the LO–TO mode frequency difference shows a global minimum in the intermediate phase. The observation may be a consequence of the compactness and stress-free nature of glasses prevailing in the IP. Taken together, in the IP, we observe the existence of a reversibility window, a fragility window, a local minimum in molar volumes, a global minimum in the LO–TO mode splitting, and a global minimum in the concentration of the topological defects in the IP. These extrema in physical properties may well be the clearest signature of network self-organization in a network glass.
Author Contributions
CM took the lead in the synthesis of glasses and the m-DSC experiments. AM in performing and analyzing the Raman scattering results, and VG in performing and analyzing infrared reflectance results, on the SPGs. Earlier, PC and DN took the lead in the synthesis of the base P2O5 glass and its characterization by m-DSC. RC assisted in the Raman and m-DSC experiments and took the lead in numerical simulations using the NRLMOL package. MB and MM assisted with the numerical simulations and discussions on topological phases, melt dynamics, and the coarse graining model approach. PB coordinated the experimental work performed at University of Cincinnati, and assisted in writing the manuscript.
Funding
PB acknowledges support from NSF grant DMR 08-53957. MM acknowledges the support of Agence Nationale de la Recherche (ANR) grant no. ANR-11-BS08-10012 from the American Fulbright Commission and the International Materials Institute (H. Jain). MB acknowledges support from NSF grants 1562066, 1762292, and 1826420.
Conflict of Interest Statement
The authors declare that the research was conducted in the absence of any commercial or financial relationships that could be construed as a potential conflict of interest.
Acknowledgments
It is a pleasure to thank Dr. Koblar Alan Jackson for assistance with the simulation package NRLMOL to calculate the Raman and infrared vibrations from characteristic local structures, and Dr. Bernard Goodman and Dr. Sergey Mamedov for the many useful discussions on glass science. It is also a pleasure to thank Dr. Warren Huff for the numerous discussions on glass science and particularly for the EDAX measurements.
References
Alam, T., and Brow, R. K. (1998). Local structure and connectivity in lithium phosphate glasses: a solid-state 31P MAS NMR and 2D exchange investigation. J. Non-Cryst. Solids 223, 1–20. doi: 10.1016/S0022-3093(97)00345-1
Angell, C. A. (1988). Perspective on the glass transition. J. Phys. Chem. Solids 49, 863–871. doi: 10.1016/0022-3697(88)90002-9
Angell, C. A. (1990). Dynamic processes in ionic glasses. Chem. Rev. 90, 523–542. doi: 10.1021/cr00101a006
Angell, C. A., and Rao, K. J. (1972). Configurational excitations in condensed matter, and the “bond lattice” model for the liquid–glass transition. J. Chem. Phys. 57, 470–481. doi: 10.1063/1.1677987
Angell, C. A., Richards, B. E., and Velikov, V. (1999). Simple glass-forming liquids: their definition, fragilities, and landscape excitation profiles. J. Phys. Condens. Matter 11:A75. doi: 10.1088/0953-8984/11/10A/005
Bhosle, S., Gunasekera, K., Boolchand, P., and Micoulaut, M. (2012a). Melt Homogenization and self-organization in chalcogenides—part I. Int. J. Appl. Glass Sci. 3, 189–204. doi: 10.1111/j.2041-1294.2012.00093.x
Bhosle, S., Gunasekera, K., Boolchand, P., and Micoulaut, M. (2012b). Melt homogenization and self-organization in chalcogenides—part II. Int. J. Appl. Glass Sci. 3, 205–220. doi: 10.1111/j.2041-1294.2012.00092.x
Bødker, M. S., Mauro, J. C., Goyal, S., Youngman, R. E., and Smedskjaer, M. M. (2018). Predicting Q-speciation in binary phosphate glasses using statistical mechanics. J. Phys. Chem. B 122, 7609–7615. doi: 10.1021/acs.jpcb.8b04604
Böhmer, R., Ngai, K. L., Angell, C. A., and Plazek, D. J. (1993). Nonexponential relaxations in strong and fragile glass formers. J. Chemi. Phys. 99, 4201–4209. doi: 10.1063/1.466117
Boolchand, P. (2006). Intermediate phases, reversibility windows, stress-free and non-aging networks, and strong liquids. Chalcogenide Lett. 3, 29–31.
Boolchand, P., and Goodman, B. (2017). Glassy materials with enhanced thermal stability. MRS Bull. 42, 23–28. doi: 10.1557/mrs.2016.300
Boolchand, P., Mauro, J. C., and Phillips, J. C. (2013). A note on compacted networks. Phys. Today 66:10. doi: 10.1063/PT.3.1932
Brow, R. K. (2000). Review: the structure of simple phosphate glasses. J. Non-Cryst. Solids 263, 1–28. doi: 10.1016/S0022-3093(99)00620-1
Brow, R. K., Alam, T. M., Tallant, D. R., and Kirkpatrick, R. J. (2017). Spectroscopic studies on the structures of phosphate sealing glasses. MRS Bull. 23, 63–67. doi: 10.1557/S088376940003102X
Brow, R. K., Tallant, D. R., Hudgens, J. J., Martin, S. W., and Irwin, A. D. (1994). The short-range structure of sodium ultraphosphate glasses. J. Non-Cryst. Solids 177, 221–228. doi: 10.1016/0022-3093(94)90534-7
Brow, R. K., Tallant, D. R., Myers, S. T., and Phifer, C. C. (1995). The short-range structure of zinc polyphosphate glass. J. Non-Cryst. Solids 191, 45–55. doi: 10.1016/0022-3093(95)00289-8
Bunker, B. C., Arnold, G. W., and Wilder, J. A. (1984). Phosphate glass dissolution in aqueous solutions. J. Non-Cryst. Solids 64, 291–316. doi: 10.1016/0022-3093(84)90184-4
Bustin, O., and Descamps, M. (1999). Slow structural relaxations of glass-forming Maltitol by modulated DSC calorimetry. J. Chem. Phys. 110, 10982–10992. doi: 10.1063/1.478041
Carpentier, L., Desprez, S., and Descamps, M. (2003). From strong to fragile glass-forming systems: a temperature modulated differential scanning calorimetry investigation. Phase Trans. 76, 787–799. doi: 10.1080/01411590310001603708
Chakraborty, S., and Boolchand, P. (2014). Topological origin of fragility, network adaptation, and rigidity and stress transitions in especially homogenized nonstoichiometric binary GeS glasses. J. Phys. Chem. B 118, 2249–2263. doi: 10.1021/jp411823j
Chakraborty, S., Boolchand, P., and Micoulaut, M. (2017). Structural properties of Ge–S amorphous networks in relationship with rigidity transitions: an ab initio molecular dynamics study. Phys. Rev. B 96:094205. doi: 10.1103/PhysRevB.96.094205
Chakravarty, S. (2003). Self-Organization and Aging in Network Glasses. Ph.D. thesis, University of Cincinnati, (Unpublished).
Chen, P., Holbrook, C., Boolchand, P., Georgiev, D. G., Jackson, K. A., and Micoulaut, M. (2008). Intermediate phase, network demixing, boson and floppy modes, and compositional trends in glass transition temperatures of binary As-S system. Phys. Rev. B 78:224208. doi: 10.1103/PhysRevB.78.224208
Click, C. A., Brow, R. K., and Alam, T. M. (2002). Properties and structure of cesium phosphate glasses. J. Non-Cryst. Solids 311, 294–303. doi: 10.1016/S0022-3093(02)01417-5
Cormia, R. L., Mackenzie, J. D., and Turnbull, D. (1963). Viscous flow and melt allotropy of phosphorus pentoxide. J. Appl. Phys. 34, 2245–2248. doi: 10.1063/1.1702721
Daasch, L., and Smith, D. (1951). Infrared spectra of phosphorus compounds. Anal. Chem. 23, 853–868. doi: 10.1021/ac60054a008
Dash, S., Chen, P., and Boolchand, P. (2017). Molecular origin of aging of pure Se glass: growth of inter-chain structural correlations, network compaction, and partial ordering. J. Chem. Phys. 146:4983480. doi: 10.1063/1.4983480
Debenedetti, P. G., and Stillinger, F. H. (2001). Supercooled liquids and the glass transition. Nature 410, 259–267. doi: 10.1038/35065704
Exarhos, G. J., and Risen, W. M. (1974). Raman study of isothermal devitrification kinetics of NaPO3 glass. J. Am. Ceram. Soc. 57, 401–405. doi: 10.1111/j.1151-2916.1974.tb11422.x
Fabian, R., and Sidebottom, D. L. (2009). Dynamic light scattering in network-forming sodium ultraphosphate liquids near the glass transition. Phys. Rev. B 80:064201. doi: 10.1103/PhysRevB.80.064201
Galeener, F. L., Leadbetter, A. J., and Stringfellow, M. W. (1983). Comparison of the neutron, Raman, and infrared vibrational spectra of vitreous SiO2, GeO2, and BeF2. Phys. Rev. B 27:1052. doi: 10.1103/PhysRevB.27.1052
Galeener, F. L., and Lucovsky, G. (1976). Longitudinal optical vibrations in glasses: GeO2 and SiO2. Phys. Rev. Lett. 37, 1474–1478. doi: 10.1103/PhysRevLett.37.1474
Georgiev, D. G., and Boolchand, P. (2000). Rigidity transitions and molecular structure of AsxSe1−x glasses. Phys. Rev. B 62, 9228–9231. doi: 10.1103/PhysRevB.62.R9228
Georgiev, D. G., Mitkova, M., and Boolchand, P. (2001). Molecular structure, glass transition temperature variation, agglomeration theory, and network connectivity of binary P–Se glasses. Phys. Rev. B 64, 1–11. doi: 10.1103/PhysRevB.64.134204
Goldstein, J., Newbury, D. E., Joy, D. C., Lyman, C. E., Echlin, P., Lifshin, E., et al%. (2003). Scanning Electron Microscopy and X-ray Microanalysis. 3rd ed. Springer US. Available online at www.springer.com/us/book/9780306472923 (accessed December 21, 2018). doi: 10.1007/978-1-4615-0215-9
Gresch, R., Muller-Warmuth, W., and Dutz, H. (1979). X-ray photoelectron spectroscopy of sodium phosphate glasses. J. Non-Cryst. Solids 34, 127–136. doi: 10.1016/0022-3093(79)90012-7
Gunasekera, K., Bhosle, S., Boolchand, P., and Micoulaut, M. (2013a). Superstrong nature of covalently bonded glass-forming liquids at select compositions. J. Chem. Phys. 139:164511. doi: 10.1063/1.4826463
Gunasekera, K., Boolchand, P., and Micoulaut, M. (2013b). Elastic phases of GeSbSe ternary glasses driven by topology. J. Phys. Chem. B 117, 10027–10034. doi: 10.1021/jp404565d
Gupta, P. K., and Mauro, J. C. (2009). Composition dependence of glass transition temperature and fragility. I. A topological model incorporating temperature-dependent constraints. J. Chem. Phys. 130:094503. doi: 10.1063/1.3077168
He, H., and Thorpe, M. F. (1985). Elastic properties of glasses. Phys. Rev. Lett. 54:2107. doi: 10.1103/PhysRevLett.54.2107
Hermansen, C., Mauro, J. C., and Yue, Y. (2014). A model for phosphate glass topology considering the modifying ion sub-network. J. Chem. Phys. 140:154501. doi: 10.1063/1.4870764
Hermansen, C., Mauro, J. C., and Yue, Y. (2015). Response to “Comment on ‘A model for phosphate glass topology considering the modifying ion sub-network”’. J. Chem. Phys. 142:107103. doi: 10.1063/1.4913761
Hoppe, U. (1996). A structural model for phosphate glasses. J. Non-Cryst. Solids 195, 138–147. doi: 10.1016/0022-3093(95)00524-2
Hoppe, U., Walter, G., Stachel, D., and Hannon, A. C. (1996). Short-range order in KPO3 glass studied by neutron and X-ray diffraction. Z. Naturforsch. 51a, 179–186. doi: 10.1515/zna-1996-0308
Hudgens, J. J. (1994). The Structure and Properties of Anhydrous, Alkali Ultra-Phosphate Glasses. Available online at: https://lib.dr.iastate.edu/rtd/11267.
Hudgens, J. J., Brow, R. K., Tallant, D. R., and Martin, S. W. (1998). Raman spectroscopy study of the structure of lithium and sodium ultraphosphate glasses. J. Non-Cryst. Solids 223, 21–31. doi: 10.1016/S0022-3093(97)00347-5
Hudgens, J. J., and Martin, S. W. (1993). Glass Transition and infrared spectra of low-alkali, anhydrous lithium phosphate glasses. J. Am. Ceram. Soc. 76, 1691–1696. doi: 10.1111/j.1151-2916.1993.tb06636.x
Jacobs, D. J., and Thorpe, M. F. (1995). Generic rigidity percolation: the pebble game. PRL 75, 4051–4054. doi: 10.1103/PhysRevLett.75.4051
Mamedov, S., Georgiev, D. G., Qu, T., and Boolchand, P. (2003). Evidence for nanoscale phase separation of stressed–rigid glasses. J. Phys. Condens. Matter. 15:S2397. doi: 10.1088/0953-8984/15/31/315
Mantisi, B., Bauchy, M., and Micoulaut, M. (2015). Cycling through the glass transition: evidence for reversibility windows and dynamic anomalies. Phys. Rev. B 92:134201. doi: 10.1103/PhysRevB.92.134201
Martin, S. W., and Angell, C. A. (1986). On the glass transition and viscosity of phosphorus pentoxide. J. Phys. Chem. 90, 6736–6740. doi: 10.1021/j100283a030
Mauro, J. C., Gupta, P. K., and Loucks, R. J. (2009). Composition dependence of glass transition temperature and fragility. II. A topological model of alkali borate liquids. J. Chem. Phys. 130, 234503–234508. doi: 10.1063/1.3152432
Micoulaut, M. (1998). The slope equations: a universal relationship between local structure and glass transition temperature. Eur. Phys. J. B 294, 277–294. doi: 10.1007/s100510050184
Micoulaut, M. (2010). Linking rigidity transitions with enthalpic changes at the glass transition and fragility: insight from a simple oscillator model. J. Phys. 22:285101. doi: 10.1088/0953-8984/22/28/285101
Micoulaut, M. (2016). Relaxation and physical aging in network glasses: a review. Rep. Progr. Phys. 79:066504. doi: 10.1088/0034-4885/79/6/066504
Micoulaut, M., and Naumis, G. G. (1999). Glass transition temperature variation, cross-linking and structure in network glasses: a stochastic approach. Europhys. Lett. 47:568. doi: 10.1209/epl/i1999-00427-7
Mohanty, C. (2018). Direct Evidence for Topological Phases in Sodium Phosphate Glasses From Raman Scattering, Infrared Reflectance and Modulated DSC, Master's thesis, University of Cincinnati, August 2018 (Unpublished).
Moustafa, Y. M., and El-Egili, K. (1998). Infrared spectra of sodium phosphate glasses. J. Non-Cryst. Solids 240, 144–153. doi: 10.1016/S0022-3093(98)00711-X
Moynihan, C. T., Easteal, A. J., Wilder, J., and Tucker, J. (1974). Dependence of the glass transition temperature on heating and cooling rate. J. Phys. Chem. 78, 2673–2677. doi: 10.1021/j100619a008
Neugebauer, J., Reiher, M., Kind, C., and Hess, B. A. (2002). Quantum chemical calculation of vibrational spectra of large molecules—Raman and IR spectra for buckminsterfullerene. J. Comput. Chem. 23, 895–910. doi: 10.1002/jcc.10089
Novita, D. I., and Boolchand, P. (2007). Synthesis and structural characterization of dry AgPO3 glass by Raman scattering, infrared reflectance, and modulated differential scanning calorimetry. Phys. Rev. B 76:184205. doi: 10.1103/PhysRevB.76.184205
Park, K., Pederson, M. R., Boyer, L. L., Mei, W. N., Sabirianov, R. F., and Zeng, X. C., et al. (2006). Electronic structure and vibrational spectra of C2 B10-based clusters and films. Phys. Rev. B 73:035109. doi: 10.1103/PhysRevB.73.035109
Phillips, J. C. (1979). Topology of covalent non-crystalline solids.1. Short-range order in chalcogenide alloys. J. Non-Cryst. Solids 34, 153–181. doi: 10.1016/0022-3093(79)90033-4
Porezag, D., and Pederson, M. R. (1996). Infrared intensities and Raman-scattering activities within density-functional theory. Phys. Rev. B Phys. 54, 7830–7836. doi: 10.1103/PhysRevB.54.7830
Porezag, D., and Pederson, M. R. (1999). Optimization of Gaussian basis sets for density-functional calculations. Phys. Rev. A 60, 2840–2847. doi: 10.1103/PhysRevA.60.2840
Qu, T., and Boolchand, P. (2005). Shift in elastic phase boundaries due to nanoscale phase separation in network glasses: the case of GexAsxS1−2x. Philos. Mag. 85, 875–884. doi: 10.1080/147864304123314636
Rompicharla, K., Novita, D. I., Chen, P., Boolchand, P., Micoulaut, M., and Huff, W. (2008). Abrupt boundaries of intermediate phases and space filling in oxide glasses. J. Phys. Condens. Matter. 20:202101. doi: 10.1088/0953-8984/20/20/202101
Sales, B. C. (1990). Structural relaxation dynamics of phosphate glasses: the effects of network topology on the glass transition. J. Non-Cryst. Solids 119, 136–150. doi: 10.1016/0022-3093(90)90837-C
Sammet, R. B., Chun, H. U., and Goretzki, H. (1980). XPS measurements and structural aspects of silicate and phosphate glasses. J. Non-Cryst. Solids 42, 49–60. doi: 10.1016/0022-3093(80)90007-1
Sidebottom, D. L. (2014). Comment on “A model for phosphate glass topology considering the modifying ion sub-network”. J. Chem. Phys. 140:154501. doi: 10.1063/1.4913760
Sidebottom, D. L., and Changstrom, J. R. (2008). Viscoelastic relaxation in molten phosphorus pentoxide using photon correlation spectroscopy. Phys. Rev. B 77:020201. doi: 10.1103/PhysRevB.77.020201
Sidebottom, D. L., and Schnell, S. E. (2013). Role of intermediate-range order in predicting the fragility of network-forming liquids near the rigidity transition. Phys. Rev. B 87:054202. doi: 10.1103/PhysRevB.87.054202
Sidebottom, D. L., Tran, T. D., and Schnell, S. E. (2014). Building up a weaker network: the effect of intermediate range glass structure on liquid fragility. J. Non-Cryst. Solids 402, 16–20. doi: 10.1016/j.jnoncrysol.2014.05.010
Suzuya, K., Price, D. L., Loong, C.-K., and Martin, S. W. (1998). Structure of vitreous P2O5 and alkali phosphate glasses. J. Non-Cryst. Solids 232, 650–657. doi: 10.1016/S0022-3093(98)00529-8
Tatsumisago, M., Kowada, Y., and Minami, T. (1992). Raman spectra of rapidly quenched glasses and melts containing large amounts of Li2O. J. Non-Cryst. Solids 150, 207–211. doi: 10.1016/0022-3093(92)90124-3
Thomas, L. C. (2005b). Modulated DSC®paper 3 modulated DSC®basics; optimization of MDSC®experimental conditions. T.A. Instruments 1–10.
Thorpe, M. F., Jacobs, D. J., Chubynsky, M. V., and Phillips, J. C. (2000). Self-organization in network glasses. J. Non-Cryst. Solids, 266–269. doi: 10.1016/S0022-3093(99)00856-X
Tonchev, D., and Kasap, S. O. (2002). Effect of aging on glass transformation measurements by temperature modulated DSC 328, 62–66. doi: 10.1016/S0921-5093(01)01668-9
Velli, L. L., Varsamis, C. P. E., Kamitsos, E. I., Möncke, D., and Ehrt, D. (2005). Structural investigation of metaphosphate glasses. Phys. Chem. Glasses 46, 178–181.
Walsh, E. N., Griffith, E. J., Parry, R. W., and Quin, L. D. (1992). Phosphorus Chemistry. Washington, DC: American Chemical Society. doi: 10.1021/bk-1992-0486
Walter, G., Hoppe, U., Baade, T., Kranold, R., and Stachel, D. (1997). Intermediate range order in MeO–P2O5 glasses. J. Non-Cryst. Solids 217, 299–307. doi: 10.1016/S0022-3093(97)00220-2
Wang, F., Mamedov, S., Boolchand, P., Goodman, B., and Chandrasekhar, M. (2005). Pressure Raman effects and internal stress in network glasses. Phys. Rev. B 71:174201. doi: 10.1103/PhysRevB.71.174201
Wäsche, R., and Brückner, R. (1986). The structure of mixed alkali phosphate melts as indicated by their non-Newtonian flow behaviour and optical refringence. Phys. Chem. Glasses 27, 87–94.
Wazer, J. R. (1958). Phosphorous and its compounds. Vol I Chemistry. J. Chem. Educ. 36:531. doi: 10.1021/ed036p531.2
Williams, M. L., Landel, R. F., and Ferry, J. D. (1955). The temperature dependence of relaxation mechanisms in amorphous polymers and other glass-forming liquids. J. Am. Chem. Soc. 77, 3701–3707. doi: 10.1021/ja01619a008
Yan, L. (2018). Entropy favors heterogeneous structures of networks near the rigidity threshold. Nat. Commun. 9:1359. doi: 10.1038/s41467-018-03859-9
Keywords: raman scattering, modulated Differential Scanning Calorimetry (m-DSC), topological phases, reversibility window, fragility window, volumetric window, infrared reflectance, intermediate phase
Citation: Mohanty C, Mandal A, Gogi VK, Chen P, Novita D, Chbeir R, Bauchy M, Micoulaut M and Boolchand P (2019) Linking Melt Dynamics With Topological Phases and Molecular Structure of Sodium Phosphate Glasses From Calorimetry, Raman Scattering, and Infrared Reflectance. Front. Mater. 6:69. doi: 10.3389/fmats.2019.00069
Received: 21 February 2019; Accepted: 01 April 2019;
Published: 14 May 2019.
Edited by:
Jincheng Du, University of North Texas, United StatesReviewed by:
William LaCourse, Alfred University, United StatesStefan Karlsson, RISE Research Institutes of Sweden, Sweden
Copyright © 2019 Mohanty, Mandal, Gogi, Chen, Novita, Chbeir, Bauchy, Micoulaut and Boolchand. This is an open-access article distributed under the terms of the Creative Commons Attribution License (CC BY). The use, distribution or reproduction in other forums is permitted, provided the original author(s) and the copyright owner(s) are credited and that the original publication in this journal is cited, in accordance with accepted academic practice. No use, distribution or reproduction is permitted which does not comply with these terms.
*Correspondence: Punit Boolchand, Ym9vbGNocEB1Y21haWwudWMuZWR1