 Juliana Moraes Neves
 Peter J. Collins
 Ryan P. Wilkerson
 Richard N. Grugel
 Aleksandra Radlińska
- 1Department of Civil and Environmental Engineering, The Pennsylvania State University, University Park, PA, United States
- 2Marshall Space Flight Center-NASA, Huntsville, AL, United States
For the first time, tricalcium silicate (C3S) and an aqueous solution were mixed and allowed to hydrate in the microgravity environment aboard the International Space Station (ISS). The research hypothesis states that minimizing gravity-driven transport phenomena, such as buoyancy, sedimentation, and thermosolutal convection ensures diffusion-controlled crystal growth and, consequently, lead to unique microstructures. Results from SEM micrographs, image analysis, mercury intrusion porosimetry, thermogravimetry, and x-ray diffraction revealed that the primary differences in μg hydrated C3S paste are increased porosity and a lower aspect ratio of portlandite crystals, likely due to a more uniform phase distribution. Relevant observations led by the presence or absence of gravity, including bleeding effect, density, and crystallography are also presented and discussed.
Introduction
Exploration of extraterrestrial bodies, such as the moon, can be facilitated by extended stays, which will require fabrication of habitats and other supporting infrastructure. Given the cost of transporting materials into space, it is envisioned that in situ materials, e.g., lunar regolith, would be required in such construction and a cement-like binder would be needed for creating resilient habitats. Solidification of cement in a microgravity (10−6 g or μg) environment, however, is not well-understood. As a first step, the primary objective of this research is to experimentally document microgravity influence on the microstructure development of a tricalcium silicate (C3S) paste.
The Microgravity Investigation of Cement Solidification (MICS) research project is in strong alignment with NASA's human and space exploration needs. The experiment directly addresses two objectives identified by NASA Space Technology Roadmaps and Priorities (National Research Council, 2012), listed as (1) exploring the evolution of the solar system and the potential for life elsewhere and (2) expanding the understanding of the Earth and the universe. Furthermore, it is possible that indigenous materials can be used to manufacture a binder to make concrete on the surface of the Moon, which would enable a cost-effective solution for long-duration human missions (Khoshnevis, 2004). The role the extreme environment would have on life has been researched (lsson-Francis et al., 2018), and the extraterrestrial building material would have to help combat these challenges.
Cement has been studied for over a century with pioneering research conducted by Bogue, T. C. Powers, and T. L. Brownyard. Together they remarkably contributed to the science of cement and concrete materials (Powers and Brownyard, 1946; Bogue, 1947; Powers et al., 1954; Powers, 1958), including characterization of basic fresh and hardened properties. Since then, understanding the complex hydration of portland cement has improved substantially, but is not yet fully understood. One example is the insufficient comprehension of the mechanism controlling the main heat evolution peak of cement hydration (Bullard et al., 2011; Scrivener et al., 2015), which hampers development of accurate prediction models (Bullard et al., 2010). The need for improved methods of studying cement hydration has been noted (Provis, 2015) and MICS contributes by providing a novel approach to understanding how gravity affects materials processing. Moreover, this novel insight will promote our understanding of Earth-based cementitious science, and advance development of binders for use on extraterrestrial bodies.
It should be noted that the work described here is part of the on-going MICS research project and focuses on the microstructural development of high water-to-cement ratio tricalcium silicate (C3S) paste mixed and cured in a microgravity environment. C3S is the main mineral component of typical commercially available portland cement and dictates most of the kinetics and early properties (Taylor, 1990; Mindess et al., 2003; Scrivener, 2004; Thomas et al., 2009). In principle, investigating pure compounds, such as C3S, constitutes elementary research, which eases and enhances the analysis of more complex systems such as portland cement mixtures. In portland cement systems, the presence of aluminates, sulfates, alkalis, and other impurities affects pH and supersaturation of the solvent (i.e., pore solution), which makes interpretation of results and the conclusion-drawing process more complicated. As such, a thorough understanding of pure phases is necessary before more complex systems can be analyzed. To date, pure C3S and its hydration products (C-S-H and CH1) have been extensively studied theoretically (Young and Hansen, 1987; Bentz and Garboczi, 1991; Joseph et al., 2017) and experimentally (Thomas et al., 2009; Bazzoni, 2014; Hu et al., 2016a,b).
As of now, no experiments have fully documented the effect of microgravity on the microstructural development of portland cement or any of its compounds. There have been cement hydration studies performed aboard a parabolic flight path, which allows for ~20 s of a 10−2-10−3 gravity environment (Meier et al., 2015; Lei et al., 2016; Meier and Plank, 2016). The short time duration limited the experiments to investigating instantaneous ettringite precipitation. The authors reported that the microgravity environment generally leads to increase in the amount of ettringite precipitated. However, the change in gravity has only a minor effect on the aspect ratios of ettringite formed from a neat cement by a slight reduction. The most notable changes occur in the presence of PCE polymers as the aspect ratio of the ettringite was significantly changed depending on the anionicity of the polymer. Outside of the cementitious materials realm, one experiment documenting the effects of microgravity on the growth of an inorganic crystal (sodium chloride) was conducted aboard the ISS (Fontana et al., 2011). The authors reported morphological differences between crystals precipitated in μg and typical NaCl precipitated on Earth (Fontana et al., 2011). Qi et al. (2017) modeled how settling motion could affect the morphology of a growing dendritic crystal. These studies (Fontana et al., 2011; Meier et al., 2015; Lei et al., 2016; Meier and Plank, 2016; Qi et al., 2017) advocate that gravitational forces impact crystal growth and can provide ground for interpreting the results of the present research.
Materials and Experimental Setup
Characterization of Anhydrous Materials: Tri-calcium Silicate (C3S) and Hydrated Lime
Pure compound C3S, hydrated lime, and distilled water were used in this work. High purity triclinic C3S with a surface area of 3,500 cm2/gram was obtained from Mineral Research Processing (Meyzieu, France). Calcium hydroxide (Alfa-Aesar) was added to the mixing water, which is explained in detail in Mixture Proportions. The present study refers to the calcium hydroxide used in the mixing water as hydrated lime, so it can be easily differentiated from the calcium hydroxide precipitated during the C3S hydration process, which is referred to as portlandite.
The evaluation of the anhydrous powder of C3S and hydrated lime was first conducted to characterize their size and morphology. Dry-dispersion laser diffraction (Malvern Mastersizer 3000) was employed to determine the particle size distribution of C3S. Approximately 100 mg of powder was dispersed by an Aero S dry dispersion unit using a standard venturi at 4 bar air pressure and a 25% feed rate. The refractive index and adsorption were assumed to be, respectively, 1.68 and 0.1. Table 1 shows diameters D10, D50, and D90. Determining the particle size distribution of hydrated lime was not performed as most of the powder was expected to dissolve once added to water.
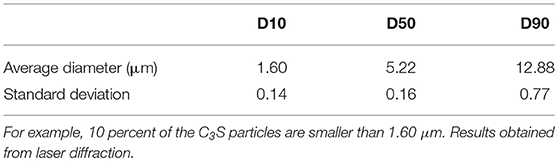
Table 1. Percentages (10, 50, and 90) of C3S particles with a diameter equal to or smaller than the indicated values.
Scanning electron microscope (SEM) images of the anhydrous C3S and hydrated lime powders were also taken (Figures 1, 2). In the specific case of hydrated lime, the images prove that it differs from the hydrated materials, which are shown and discussed in the results section. The samples were prepared by sprinkling the powders over carbon tape and placing them in an SEM at low vacuum mode. It can be seen that the C3S particles are consistent with the results obtained through laser diffraction, as most of the particles are smaller than the 10 μm scale bar.
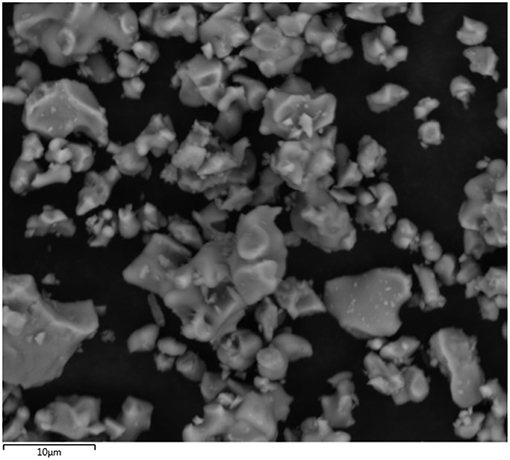
Figure 1. SEM image of anhydrous C3S particles showing irregular morphology, smooth surface, and sizes often smaller than the 10 μm (scale bar), in agreement with laser diffraction results.
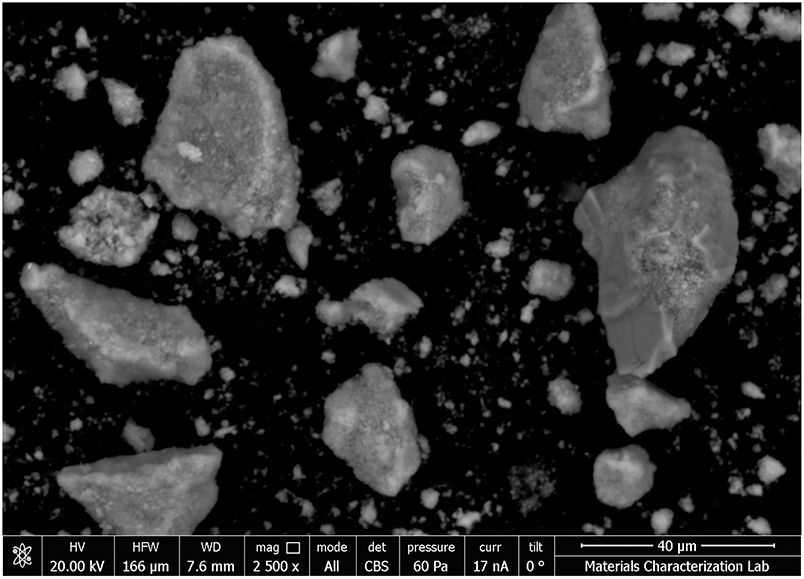
Figure 2. SEM image of lime particles before being added to the mixing water.
Mixture Proportions
The mixture evaluated in this research consisted of C3S mixed with lime-water at a water-to-cement ratio (w/c) of 2.0 by mass (5 grams of C3S and 10 grams of lime-water). The lime-water consisted of a 15 mmol/liter solution of calcium hydroxide, where 1.12 grams of hydrated lime was added to 1,000 g (1 liter) of distilled water, sealed, and continuously stirred for 24 h at room temperature to ensure stabilization of the solution.
In addition to enhancing the degree of hydration, a high w/c (2.0) enhances crystal growth through coarsening the porosity of the paste (Scrivener, 1989; Taylor, 1990; Mindess et al., 2003; Thomas and Jennings, 2019). Magnifying the overall microstructural development also nourishes the μg effects and aids in their identification. Moreover, the high w/c allowed for the easiness of the manual mixing process (discussed in Experimental Setup) without need for chemical admixtures. If pure water was used rather than lime-water in this high w/c system, the initial reaction rate would be too rapid and as such, unrealistic. Using lime-water mimics the supersaturation degree with respect to portlandite in the pore solution of cement [pH of 12.5 ± 0.1(Rajabipour et al., 2015)], controls the initial reaction rate (Hu et al., 2016a,b), and still enhances nucleation and crystal growth (Bazzoni, 2014).
Experimental Setup
Commercially available plastic bags (Burst Pouches®) were used as mixing containers (Figure 3). A total of 12 identical pouches were prepared; 6 were sent to the ISS on the OA-9 resupply mission and 6 remained on the ground as control samples. The pouches entailed two separate compartments divided by an internal, burstable seal which allowed mixing materials under sealed conditions. Individual compartments of the pouches were filled with C3S and aqueous solutions under laboratory conditions on Earth. This setup allowed the first contact between the C3S and lime-water to take place while aboard the ISS. Space and ground samples were mixed simultaneously and at the same conditions (temperature of 20 ± 2°C). The pressure and relative humidity conditions (1 ATM and 35% RH) were also constant, since they are characteristics of the air confined in the sealed pouches during the preparation. As such, gravity is considered the only variable between the space and ground experiments.
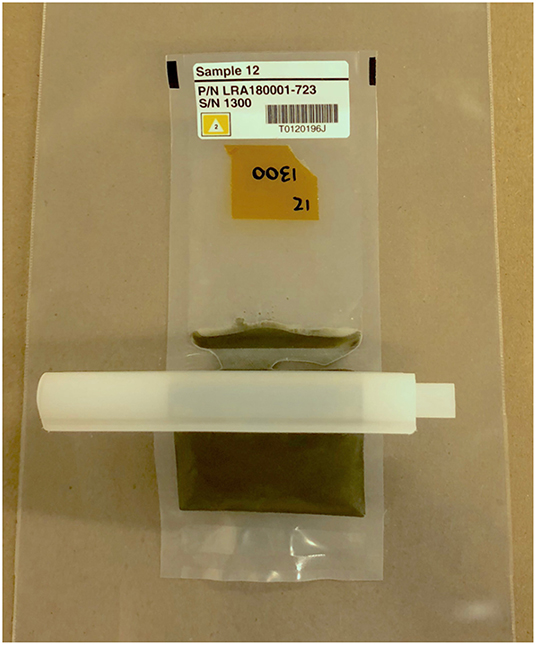
Figure 3. A typical processed pouch containing hydrating cement paste and a clamp.
The mixing procedure consisted of exerting pressure on the lime-water by rolling the pouch and effectively pushing the solution forward until the internal seal was broken, after which the solution came in contact with the anhydrous C3S. The hydrating C3S paste was then manually mixed with a rubberized spatula for ~3 min, or until homogeneity was achieved. Finally, a clamp was used to assure consolidation of the paste, as shown in Figure 3. The processed ground and space samples remained within the sealed pouch for the entire hydration period at undisturbed, controlled temperature (20 ± 2°C) conditions. The space samples were allowed to hydrate for 42 days aboard the ISS until returning to Earth for analysis. Samples were retrieved after splash down and immediately transported in insulated containers to Marshall Space Flight Center in Huntsville, AL, where the initial analysis took place.
Both the experimental setup and mixing procedure were kept simple to meet two major requirements: (1) to reduce the volume of materials and shipping cost, which is estimated to be at least $10,000 per pound (0.454 kg) of material (Futron Corporation., 2002), and (2) to meet NASA safety requirements that consider cement and its compounds to be hazardous. To address this issue, the pouches were tested for pressure, temperature, and long-term storage of high pH materials. In addition, the samples had to be triple-contained while the experiments were executed by the astronauts on the ISS. The first containment level was the pouch itself, the second was a plastic bag seen in Figure 3, and the third was a portable glovebag which was fixed on top of the Maintenance Workbench Area (MWA). Note that the hardened samples were given the lowest toxicity level (0 rating).
Methods
Scanning Electron Microscopy (SEM)
Shortly after returning to Earth, the space samples underwent a visual comparison with the ground samples. This assisted in identifying the most pronounced differences and subsequently selecting the series of most relevant tests. The fractured surfaces of samples were examined using a Hitachi S-3700N SEM immediately after their removal from the pouch, at day 56 from the initial hydration. The microscope operated under variable pressure conditions (10 to 20 Pa) with an accelerating voltage of 10 or 15 keV. In the variable pressure mode, the capability of the instrument is limited to backscattered electron (BSE) micrographs. A probe current of 25 μA and an aperture of 4 were used to maximize image resolution.
Additionally, polished cross sections were prepared at day 152 after initial hydration. The sample preparation consisted of immersing the samples in 200 ml of isopropyl alcohol for 48 h, followed by 30 h of drying under vacuum and room temperature (22°C). Subsequently, the samples were mounted in medium grade acrylic resin, ground through a series of SiC papers, and finally polish using 0.25 μm diamond paste. The polished cross-sections were examined in a FEI Q250 and BSE images were taken. The operating conditions are specified at the bottom of each micrograph presented in the results section.
Image Analysis
Analysis of the porosity through the BSE images taken of the polished samples was done by creating a binary image separating the pores from all other phases. The greyscale value to determine the upper boundary of the pores was done using the overflow method (Wong et al., 2006). There were 20 images captured for the space samples and 30 images for the ground samples at a magnification of 500x. A statistical analysis was done ensuring the number of images acquired for each sample was enough to be 95% confident that the true mean is within 10% of the sample mean. The images captured were 1,536 × 1,024 pixels with each pixel representing 0.27 × 0.27 μm. The brightness and contrast settings were adjusted to ensure a greyscale histogram with a broad range of values for the present phases. The images showed a large amount of porosity, C-S-H, and portlandite with minimal anhydrous C3S being visible.
After creating the binary image using the greyscale value obtained from the overflow method for thresholding, the area fraction of porosity was calculated. Regions with <10 pixels were regarded as noise and not included in the porosity calculation, which is consistent with the Wong et al. study (Wong et al., 2006). As such, the smallest pore size that was detected and counted in this method had diameter of 0.96 microns. As will later be discussed in more detail, the ground sample exhibits a layered structure due to sedimentation. Each layer of the ground sample was individually analyzed. Multiple size measurements were taken and averaged to calculate the corresponding fraction of each layer. The values obtained were used to calculate a weighted average of porosity.
Mercury Intrusion Porosimetry (MIP)
Prior to the MIP test, ground and space samples were immersed individually in 200 ml of isopropyl alcohol for 48 h for solvent exchange, which was followed by 34 h of drying under vacuum at room temperature. Subsequently, a Micromeritics AutoPore V 9620 MIP mercury penetrometer was used to assess the porosity, pore size distribution, bulk density, and skeletal density of the pastes. The mercury temperature during testing of ground and space samples was 19°C.
Thermogravimetric Analysis (TGA)
Prior to TGA analysis, the space samples underwent 42 days of hydration under μg condition, followed by at 109 of hydration under 1 g, totaling 151 days of hydration. Unopened ground and space samples of same age were removed from the pouches and stored for 10 days in a nitrogen-purged chamber, at 32°C and 65% relative humidity. Subsequently, the partially dried samples were finely ground with mortar and pestle immediately before the TGA measurement. SDT Q600 (TA Instruments) was then used to estimate the degree of hydration and to quantify the amount of portlandite in the pastes. Approximately 20 grams of ground material was placed in the nitrogen purged chamber of the instrument and heated to 110°C. This temperature was held for 20 min to eliminate any remaining free water and then raised in increments of 10°C per minute until 800°C or higher.
X-Ray Diffraction (XRD)
Samples of 151 days of age were taken from the pouch immediately before the analysis and, without additional preparation, were crushed using a mortar and pestle for approximately 3 min. Due to the high water-to-cement ratio, the crushed material was somewhat wet when back-filled into a zero-background sample holder for x-ray diffraction. XRD data was collected using a PANalytical X'Pert PRO MPD diffractometer in a conventional Bragg–Brentano θ-θ configuration. CuKα X-ray (λ = 1.5418 Å) was generated using 40 mA and 45 kV operating conditions. The optics setup included incident divergence slit fixed at 0.25°, 0.04 soller slits, incident/diffracted anti-scatter slits and a nickel filter. The samples were scanned continuously between 5° and 65° 2θ at a step size of 0.013°, and spinning at 60 rpm to maximize the intensity (counts).
Results and Discussion
SEM
The micrographs obtained at different magnifications provided a wide range of detail, revealing information ranging from the overall distribution of phases to the micron-scale crystal morphology. As it can be seen in Figures 4, 5, the pastes cured in μg differ from the control samples cured in 1 g in several aspects. First (Figure 4), is the greater number of trapped air bubbles found in the space specimens, which is attributed to the lack of buoyancy in a μg environment. Buoyancy is a gravity-driven phenomenon that results from differences in specific gravities among components comprising a given system (Turner, 1979). Under the influence of gravity, air bubbles, for example, are expected to move upwards through the initial watery cement paste due to their lower density [≈1.2 kg/m3 (Cavcar, 2000)], while also promoting fluid flow (Barge et al., 2015).
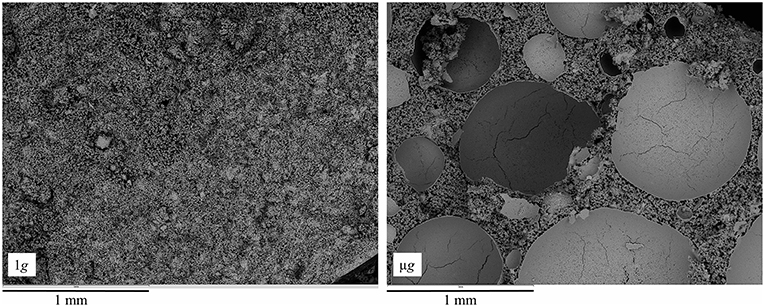
Figure 4. Fractured surface of 56 days old C3S pastes hydrated at 1 g (left) and μg (right). The large, round, shell-like structures seen on the μg sample are the trapped air bubbles. Higher porosity can also be seen on the μg sample.
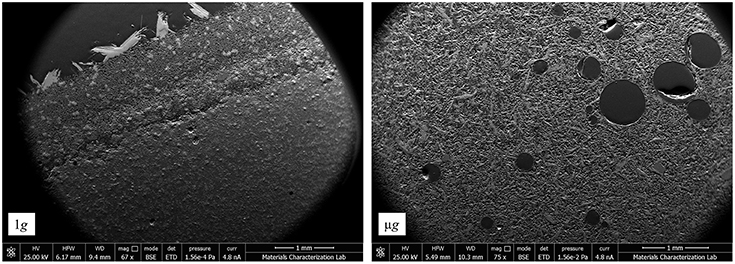
Figure 5. Polished surface of C3S pastes hydrated at 1 g (left) and μg (right). The 1 g sample shows a porosity gradient and the cross-section of large portlandite crystals at the surface as a result of buoyancy. The μg sample is remarked by the presence of large air bubbles and uniform porosity.
The 1g micrograph in Figure 5 clearly shows that layering and “bleeding” effects can manifest even in a paste that is merely 3 mm high, as is the case for the ground samples. Bleeding occurs at very early stages of cement hydration and generates a gradient water-to-cement ratio across the sample height, which results in a porosity gradient (Han and Wang, 2016). The physical explanation behind the commonly seen phenomenon is the gravity-driven sedimentation. Sedimentation promotes sinking of anhydrous C3S, as well as of C-S-H, and portlandite [specific gravities of 3.15, 2.3–2.6, and 2.24, respectively (Mindess et al., 2003)], while raising the calcium-saturated pore solution (specific gravity of ≈1) to the surface. The film of supersaturated solution promotes unimpeded growth of portlandite at the specimen's top surface, as seen in Figure 6. As expected, the sedimentation layering or bleeding effects do not take place in space; rather, the pastes hydrated in μg develop a more uniform density, as shown in the μg micrograph (Figure 5). Gravity-driven sedimentation also seems to affect the consolidation process of cementitious materials. Figure 7 suggests that C3S hydrated in microgravity generates a more porous paste in comparison to the ground control. It also appears that, in 1g, the self-weight of the hydrating paste generates sufficient compaction to reduce the overall spacing between the hydrating phases. In μg, the lack of a directional gravitational force allows the anhydrous C3S to float in the solution, enhancing the porosity.
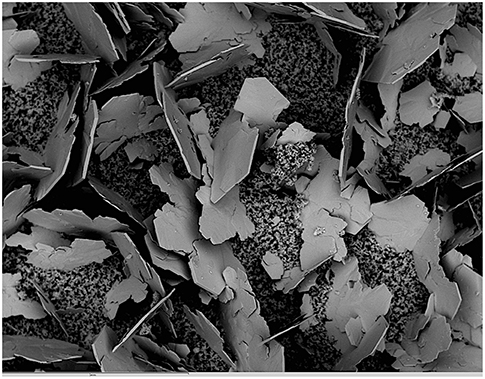
Figure 6. SEM image taken from the top surface of a C3S paste hydrated under 1 g environment for 56 days. The large, plate-like portlandite crystals sitting on the C-S-H matrix can reach over 1 mm of diameter and result from bleeding effect. The scale bar at the bottom of the micrograph shows 1 mm.
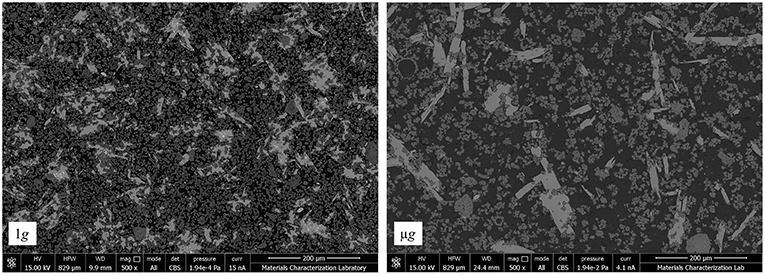
Figure 7. The polished surface of C3S paste hydrated at 1 g (left) implies lower porosity than the paste hydrated in μg (right). The 1 g sample shows a larger number of small portlandite crystals distributed in higher amount throughout the C-S-H matrix. Contrarily, the μg sample has a less frequent distribution of larger and fewer portlandite crystals, remarked by the lightest gray scale.
The size, shape and distribution of portlandite crystals also differs substantially between 1g and μg samples, in agreement with the ISS NaCl experiment (Fontana et al., 2011). The different morphologies of portlandite seen in Figure 7 can also be justified by differences in phase distribution. When hydrated in 1g, the severe bleeding caused by the high w/c reduces the availability of calcium in the pore solution, as well as reduces room for crystal growth. As a result, portlandite is more frequently distributed throughout the matrix and grows filling up the tortuous pore space (Gallucci and Scrivener, 2007). In μg, the crystals have a rather elongated, plate-like morphology, which is in line with the preferential crystal growth found by Harutyunyan and coworkers (Harutyunyan et al., 2009). The higher effective w/c and the larger porosity provide the dissolved species with more freedom to develop a purely chemical diffusion-driven microstructure, without complications from the physical effects of gravity. Also shown by Harutyunyan et al. (2009), portlandite has very specific crystallographic growth preferences that are accordant with the crystals shown in the μg image, Figure 7.
Smaller crystallites of well-defined hexagonal shape, and covered by C-S-H, were also found in pastes hydrated in ground and space (Figures 8, 9). Characterized by the hexagonal basal plane, the euhedral crystallites are smaller in size than typical portlandite. Their smaller size indicates that they likely precipitate at later stages of the hydration period (Boistelle and Astier, 1988; Glasser, 2001) after the skeleton of the paste is formed. Prismatic crystallites were oftentimes found in samples hydrated in μg, whereas plate-like crystallites of similar basal plane size were rarely found in 1g samples (Figure 8).
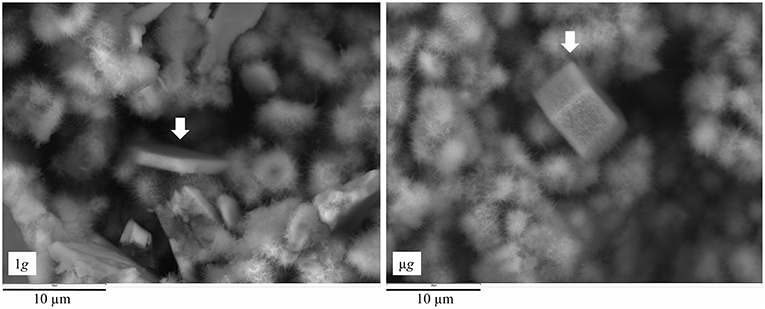
Figure 8. SEM images of fractured surface of C3S pastes, with white arrow pointing to a small, secondary CH crystallite. The crystallite formed under 1 g (left) presents dish-like morphology, while that formed under μg (right) is more prismatic. The different morphologies are attributed to differences in the effective w/c containing dissolved calcium species, as well as to pore space, both being limited in 1 g resulting in a smaller crystallite.
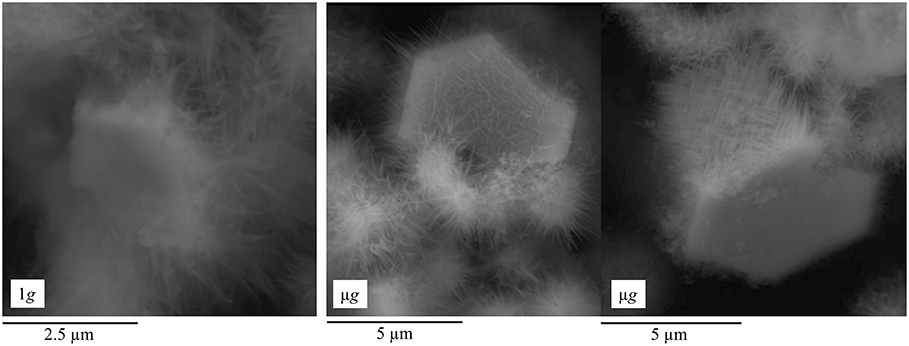
Figure 9. The micrographs show CH crystallite hydrated in 1 g (left), resulting in a completely misoriented C-S-H covering its surface, while the CH crystallite formed in μg (right) is covered by an oriented C-S-H. Note the difference in the scale bar, which also highlights that the crystallites are bigger when hydrated under μg condition.
Image Analysis
The typical greyscale histogram seen throughout the images taken of the samples is seen on the left side of Figure 10. There is minimal anhydrous material observed both visually and in the greyscale histogram of polished samples images. This is indicative of advanced degree of hydration as the samples age was 152 days. The slight bump around the greyscale value of 200 would be the minimal anhydrous material. The right side of Figure 10 shows the cumulative greyscale histogram used with the overflow method to determine the greyscale value for thresholding.
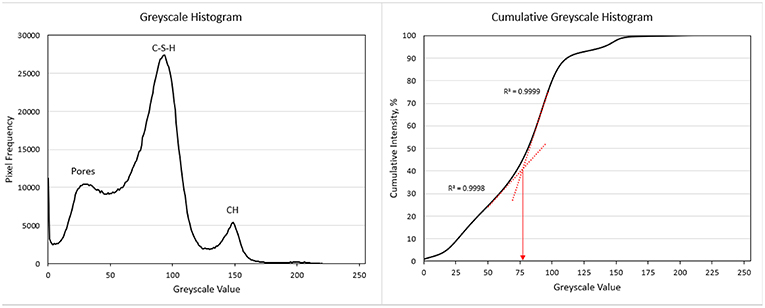
Figure 10. On the left is the typical greyscale histogram seen throughout the images taken of the samples. The peaks correspond to porosity, C-S-H, and CH (from left to right). The slight bump around the greyscale value of 200 would be the minimal anhydrous material. The right side shows the cumulative greyscale histogram used with the overflow method to determine the greyscale value for thresholding.
As previously discussed, there is a visual difference between the porosity of the ground and space samples (Figure 7) that was confirmed by the image analysis. The calculated porosity by the area fraction shows porosities for the ground and space samples of 48.1 and 71.7 percent, respectively (Table 2). These values show that the porosity in the space sample is over 20 percent higher than in the ground sample. The lower porosity in the ground sample could be partially attributed to the bleeding effect, which would lower the effective w/c ratio of the sample and therefore the porosity (Han and Wang, 2016). It is important to keep in mind that high values of porosity were expected due to the samples having a w/c of 2.0. This analysis further confirms the effect that gravity has on the densities of the samples.
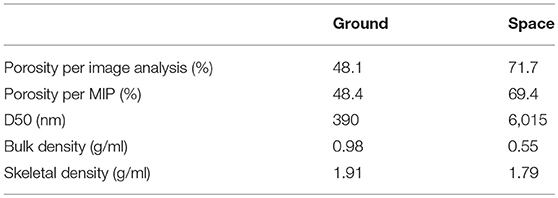
Table 2. Summary of measured porosity, pore size (D50), and densities of ground and space samples.
MIP
The results obtained from MIP, summarized in Table 2, support the SEM observations and are in good agreement with the image analysis. As expected, the porosity [i.e., the network of interconnected pores (Aligizan, 2006)] is over 20 percent higher in the space sample than in the ground control. It should be noted that the air bubbles (voids) (Figure 4) are not included in the measurements of interconnected porosity.
By comparison, the samples hydrated on Earth and space not only differ in terms of the total porosity and density (Table 2), but also in terms of pore size distribution. The pore size distribution in cement pastes strongly affects permeability, ion diffusivity (Halamickova et al., 1995; Kim et al., 2012), conductivity (Rajabipour et al., 2007), and mechanical properties (Zhang and Wang, 2016) of cement pastes. As shown in Figure 11, the ground sample develops well-distributed pore sizes, ranging between 15 and 10,000 nm. The sample hydrated in space, contrarily, develops over 50 percent of its pores between 6,000 nm and 10,000 nm, which is characterized by the steep slope (Figure 9). The calculated D50s (i.e., the pore diameter (nm) at which 50% of the pores are smaller than) are summarized in Table 2.
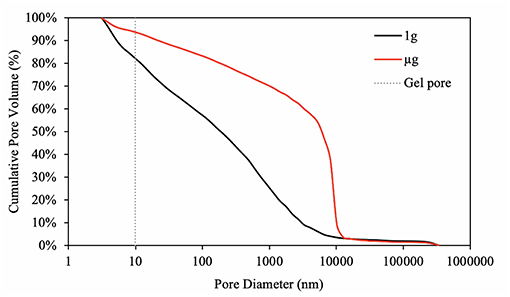
Figure 11. Pore size (diameter) distribution of C3S paste hydrated in 1 g (black) and μg (red). The dashed line indicates the size limit between gel pores (<10 nm) and capillary pores (10 nm <capillary pore <10,000 nm). The paste hydrated in 1 g condition develops well-distributed pore sizes, whereas the paste hydrated in μg condition develops 50 percent of the pores larger than 6,015 nm (D50). This can be seen graphically by the steep slope at the range of 6,000–10,000 nm.
Also shown in Figure 11, the curve representing the pore size distribution of the ground control ends abruptly on a steep slope, whereas the curve representing the space sample seems to be slowly plateauing. This suggests that percentage of pores smaller than 3 nm is likely to be greater in the ground sample than the in the space one. The inability of mercury to penetrate into pores smaller than 3 nm (Aligizan, 2006) limits the measurements of pore size distribution but still support the differences found in the skeleton densities (Table 2). Additionally, it needs to be mentioned here that MIP measures the entry pore diameter only.
Another important feature pointed out by MIP is the bulk density, which also differs significantly between the space and ground control samples. ASTM D3766-08 (2012) defines bulk density as one including the skeleton of the paste, connected pores, non-connected pores, and air bubbles. The ground control under the influence of a gravity-driven compaction becomes denser, i.e., each gram of hydrated paste should occupy a predictable volume, which can be theoretically calculated (Young and Hansen, 1987) or modeled (Lothenbach et al., 2011). Both the empirical equations and model for volume changes would not apply for cements hydrated in μg. In the absence of gravity, cement-based materials should occupy a larger volume, given the lower bulk density (Table 2), as verified by visual comparison of the 1g and μg samples. The skeleton density also differs between the space sample and ground control. In this case, the volume of the sample excludes the connected porosity from the volume calculations (ASTM D3766-08, 2012), and most likely the air bubbles, suggesting a possible variability of the C-S-H hydrated in μg.
TGA
While it is possible that gravity impacts reaction rates, the results obtained here suggest similar reaction rates between ground and space samples. Figure 12 shows that the mass of portlandite produced is essentially unaffected by the gravity level, despite the discussed morphological and spatial differences. The analysis of the collected data to quantify the amount of portlandite was performed as suggested by Kim and Olek (Kim and Olek, 2012). The portlandite content in space and ground samples are 35.3 and 37.2 percent by mass, respectively. This difference of <2 percent is attributed to sampling and/or instrumentation errors.
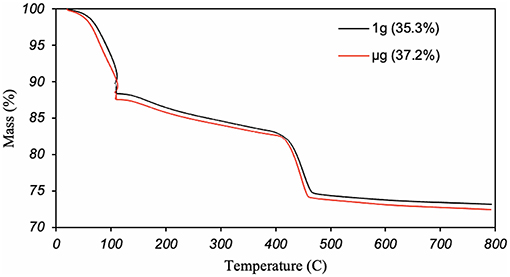
Figure 12. Thermogravimetric curves of C3S pastes hydrated in 1 g (black) and μg (red), showing mass loss upon heating. The steep slope at 110°C is characteristic of loss of free-water, and the steep slope around 400°C is characteristics of dehydration of CH. The numbers within the brackets are the calculated masses of CH, which possibly includes some unreacted lime.
The degree of hydration (α) can also be inferred from the TGA curves through Equation 1 (Zhang and Scherer, 2011):
where Wn is the normalized weight loss of the sample, n is the mass of non-evaporable water of the fully hydrated paste, and LOI is the loss on ignition or the normalized weight loss of the anhydrous cement. The non-evaporable water for C3S paste is a fixed value of 0.21 determined by Young and Hansen (Young and Hansen, 1987), whereas the LOI, measured according to ASTM C114 (ASTM C114 – 18., 2018) is 0.9 percent. That gives an 88 percent degree of hydration for both ground and space samples.
XRD
Qualitative XRD data, shown in Figure 13, points out the presence of two crystalline phases, identified as portlandite and calcite. Firstly, the diffraction pattern confirms that μg tends to change the growth kinetics of portlandite, resulting in different crystal morphology. More specifically, the length-to-width or aspect ratio of portlandite is reduced in space samples in comparison to the ground control. The diffraction pattern presents several discrepancies among the intensities most pronounced in the indexed portlandite peaks. The main difference observed is at the peak corresponding to the (001) basal plane (2θ = 18.066°) of calcium hydroxide. According to the Powder Diffraction File no. 01-076-0571 (Kabekkodu S. (ed)., 2018), the most intense peak (100% intensity) should be that of (011) (2θ = 34.101°). The presented spectrum (Figure 13) is subject to preferred orientation effects, or the tendency of dish-like crystals to lie on the basal plane, parallel to the surface, rather than being randomly oriented in the prepared sample (Grattan-Bellew, 1975). For portlandite, this effect erroneously enhances the relative intensity of the diffracted (001) hexagonal bases, while decreasing the intensity of peaks corresponding to other planes, such as the lateral facets. Despite the error, the diffraction pattern coupled with SEM observations highlight the influence of gravity level on crystal morphology.
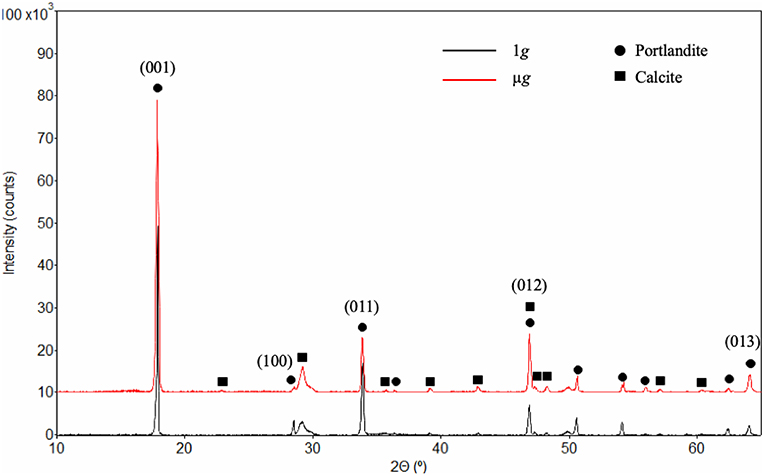
Figure 13. X-ray diffraction pattern collected from C3S pastes hydrated in 1 g (black) and μg (red), both indicating portlandite and calcite phases. Despite the preferred orientation, the indexed peaks correspond to those of portlandite showing the most pronounced differences in intensity, which reflect the morphological dissimilarities between the crystals formed in 1 g and μg. It should be mentioned that the background was removed resulting in a flat, horizontal diffraction pattern.
Secondly, the peaks resulting from the presence of calcite indicates that the samples experienced carbonation. It is believed that carbonation occurred during sample preparation, since the pouches were sealed and contained limited air. Furthermore, during the extensive SEM analysis on fractured samples, crystals resembling the possible forms of calcite crystals (Mason and Berry, 1968) were not found.
Another important observation inferred from the diffraction pattern is that the peak positions (2θ) corresponding to portlandite in the space samples have not changed relative to the ground control. As such, it implies that the atom positions of the unit cell are the same as those measured by Busing and Levi (Busing and Levy, 1957). The results (Figure 13) are also in line with the NaCl crystal grown aboard the ISS (Fontana et al., 2011), which presented morphological differences from those typically grown on Earth, while maintaining the lattice parameters.
Conclusions
This research presents an experimental comparison between high water-to-cement ratio C3S pastes hydrated under terrestrial gravity and microgravity conditions. The results revealed that microgravity alters several features of the microstructure of high water-to-cement ratio C3S paste, including, but not limited to the following:
• Bleeding and sedimentation effects are minimized in microgravity resulting in a paste with a uniform distribution of hydrated phases and, consequently, a uniform density and porosity.
• The lack of self-weight consolidation and segregation in μg leads to 20 percent increase in porosity confirmed by both image analysis and MIP. Moreover, the pore diameters for μg are one order of magnitude larger than the ground control.
• Air bubbles remain intermixed within the cementitious paste due to lack of buoyancy forces in microgravity.
• TGA analysis revealed that both ground and space samples reached a degree of hydration of 88% at 151 days.
• The link between microgravity and different crystal morphology is the uniform spatial distribution of the phases in the μg hydrating paste. This, in addition to more room (i.e., higher porosity) allows portlandite to have a larger and more marked dish-like shape. In 1g, bleeding creates a gradient w/c and smaller porosity, which limits the crystal growth.
The results presented here provide a first comparison of cement samples processed on the ground and in a microgravity environment. Lack of physical factors, including buoyancy, sedimentation, and fluid convection resulted in samples with uniform phase distribution and distinct morphologies. Despite using a very high w/c, the observations made here call attention to aspects worthy of being explored in future studies.
Author Contributions
JM collected and interpreted most of the data, as well as wrote the manuscript. PC was responsible for image analysis and helped substantially with writing the manuscript. RW contributed by collecting several XRD diffraction patterns and helped analyzing and interpreting the data. RG was present during SEM investigation, provided valuable mentoring and insights about his experience with microgravity research. AR is the principal investigator, advisor, and was awarded with the NASA grant.
Funding
All the funding was provided by NASA.
Conflict of Interest Statement
The authors declare that the research was conducted in the absence of any commercial or financial relationships that could be construed as a potential conflict of interest.
Acknowledgments
The authors gratefully acknowledge the financial support from the National Aeronautics and Space Administration (NASA)-Grant No. NNX17AC48G, as well as use of MSFC's EM31 Materials Diagnostics laboratory and precious insights from David Donovan, Karen Stephens, and Pam Denkins. Appreciation is expressed to Reviewers of the manuscript, Dr. Farshad Rajabipour, Dr. Barry Scheetz for their feedback during manuscript writing, and the Science Concept Review committee: Jan Olek, Maria Juenger, Kim Kurtis, Jason Ideker, and Sulapha Peethamparan for their valuable suggestions in research planning stages. The authors also express gratitude for collaboration with NIST, in particular Dale Bentz and Jeff Bullard. Thanks to the Leidos team, particularly Micah Johnson, Cole Nelson, and Kile Mouch, for the pre-launch preparation of the samples. Lastly, the authors express immense gratitude for the astronauts of Expedition 56: Drew Fuestel, Serena M. Auñón-Chancellor, Ricky Arnold, Alexander Gerst, Sergey Prokopyev, and Oleg Artemyev, who executed the experiments aboard the ISS.
Footnotes
1. ^The usual cement chemistry notation is used throughout this manuscript, where C = CaO, S = SiO2, and H = H2O for both the anhydrous and hydrated phases.
References
Aligizan, K. K. (2006). Pore Structure of Cement-Based Materials - Testing, Interpretation and Requirements. New York: Taylor & Francis.
ASTM C114 – 18. (2018). Standard test methods for chemical analysis of hydraulic cement. Annu. B. ASTM Stand. 1–33. doi: 10.1520/C0114-18.1.3
ASTM D3766-08 (2012). Standard Terminology Relating to Catalysts and Catalysis. Annu. B. ASTM Stand. 08, 26–27. doi: 10.1520/D3766-08.2
Barge, L. M., Cardoso, S. S. S., Cartwright, J. H. E., Cooper, G. J. T., Cronin, L. A., et al. (2015). From chemical gardens to chemobrionics. Chem. Rev. 115, 8652–8703. doi: 10.1021/acs.chemrev.5b00014
Bazzoni, A. (2014). Study of Early Hydration Mechanisms of Cement by Means of Electron Microscopy. Lausanne: Ecole Polytechnique Federale de Lausane. doi: 10.5075/epfl-thesis-6296
Bentz, D. P., and Garboczi, E. J. (1991). Percolation of phases in a three-dimensional cement paste microstructural model. Cem. Concr. Res. 21, 325–344.
Bogue, R. H. (1947). The Chemistry of Portland Cement. New York, NY: Reinhold Publishing Corporation.
Boistelle, R., and Astier, J. P. (1988). Crystallization mechanisms in solution. J. Cryst. Growth. 90, 14–30. doi: 10.1016/0022-0248(88)90294-1
Bullard, J. W., Enjolras, E., George, W. L., Satterfield, S. G., and Terrill, J. E. (2010). A parallel reaction-transport model applied to cement hydration and microstructure Development. Model. Simulat. Mater. Scie. Eng. 18, 1–16. doi: 10.1088/0965-0393/18/2/025007
Bullard, J. W., Jennings, H. M., Livingston, R. A., Nonat, A., Scherer, G. W., Scheitzer, J. S., et al. (2011). Mechanisms of cement hydration. Cem. Concr. Res. 41, 1208–1223. doi: 10.1016/B978-0-08-100693-1.00008-4
Busing, W. R., and Levy, H. A. (1957). Neutron diffraction study of calcium hydroxide. J. Chem. Phys. 26, 563–568.
Fontana, P., Schefer, J., and Pettit, D. (2011). Characterization of sodium chloride crystals grown in microgravity. J. Cryst. Growth. 324, 207–211. doi: 10.1016/j.jcrysgro.2011.04.001
Futron Corporation. (2002). Space Transportation Costs: Trends in Price Per Pound to Orbit 1990–2000. Bethesda, MD: Futron Corporation.
Gallucci, E., and Scrivener, K. (2007). Crystallisation of calcium hydroxide in early age model and ordinary cementitious systems. Cem. Concr. Res. 37, 492–501. doi: 10.1016/j.cemconres.2007.01.001
Glasser, F. P. (2001). “The role of Ca(OH)2 in Portland cement concretes,” in Materials of Science and Concrete, Calcium Hydroxide in Concrete, Vol. 58 (New York, NY: Wiley) 11–36.
Grattan-Bellew, P. E. (1975). Effects of Preferred Orientation on X-Ray Diffraction Patterns of Gypsum. Am. Mineral. 60, 1127–1129.
Halamickova, P., Detwiler, R. J., Bentz, D. P., and Garboczi, E. J. (1995). Water permeability and chloride ion diffusion in portland cement mortars: relationship to sand content and critical pore diameter. Cem. Concr. Res. 25, 790–802. doi: 10.1016/0008-8846(95)00069-O
Han, J., and Wang, K. (2016). Influence of bleeding on properties and microstructure of fresh and hydrated Portland cement paste. Constr. Build. Mater. 115, 240–246. doi: 10.1016/j.conbuildmat.2016.04.059
Harutyunyan, V. S., Kirchheim, A. P., Monteiro, P. J. M., Aivazyan, A. P., and Fischer, P. (2009). Investigation of early growth of calcium hydroxide crystals in cement solution by soft X-ray transmission microscopy. J. Mater. Sci. 44, 962–969. doi: 10.1007/s10853-008-3198-5
Hu, Q., Aboustait, M., Kim, T., Ley, M. T., Bullard, J. W., Scherer, G., et al. (2016a). Direct measurements of 3d structure, chemistry and mass density during the induction period of C3S hydration. Cem. Concr. Res. 89, 14–26. doi: 10.1016/j.cemconres.2016.07.008
Hu, Q., Aboustait, M., Kim, T., Ley, M. T., Hanan, J. C., Bullard, J., et al. (2016b). Direct three-dimensional observation of the microstructure and chemistry of C3S hydration. Cem. Concr. Res. 88, 157–169. doi: 10.1016/j.cemconres.2016.07.006
Joseph, S., Bishnoi, S., Van Balen, K., and Cizer, Ö. (2017). Modeling the effect of fineness and filler in early-age hydration of tricalcium silicate. J. Am. Ceram. Soc. 100, 1178–1194. doi: 10.1111/jace.14676
Kabekkodu, S. (ed). (2018). PDF-04-10-3117 2011 (Database). New Square, PA: The International Centre for Diffraction Data.
Khoshnevis, B. (2004). Automated construction by contour crafting — related robotics and information technologies. Autom. Constr. 13, 5–19. doi: 10.1016/j.autcon.2003.08.012
Kim, K. Y., Yun, T. S., Park, K. P., Mo, L., Panesar, D. K., Hu, J., et al. (2012). Pore structure characterization of cement pastes blended with high-volume fly-ash. Cem. Concr. Res. 42, 769–777. doi: 10.1016/j.cemconres.2013.03.020
Kim, T., and Olek, J. (2012). Effects of sample preparation and interpretation of thermogravimetric curves on calcium hydroxide in hydrated pastes and mortars effects of sample preparation and interpretation of thermogravimetric curves on calcium hydroxide in hydrated pastes and morta. Transp. Res. Board. 2290, 10–18. doi: 10.3141/2290-02
Lei, L., Meier, M. R., Rinkenburger, A., Zheng, B., Fu, L., and Plank, J. (2016). Early hydration of portland cement admixed with polycarboxylates studied under terrestric and microgravity conditions. J. Adv. Concr. Technol. 14, 102–107. doi: 10.3151/jact.14.102
Lothenbach, B., Scrivener, K., and Hooton, R. D. (2011). Supplementary cementitious materials. Cem. Concr. Res. 41, 1244–1256. doi: 10.1016/j.cemconres.2010.12.001
lsson-Francis, K. O., Billi, D., Teske, A., and de Vera, J.-P. P. (2018). Editorial: habitability beyond earth. Front. Microbiol. 9:2645. doi: 10.3389/fmicb.2018.02645
Mason, B., and Berry, L. G. (1968). Elements of Mineralogy. San Francisco, CA: W.H. Freeman and Company.
Meier, M. R., and Plank, J. (2016). Crystal growth of [Ca3Al(OH)6.12H2O]2.(SO4)3.2H2O (ettringite) under microgravity: on the impact of anionicity of polycarboxylate comb polymers. J. Cryst. Growth. 446, 92–102. doi: 10.1016/j.jcrysgro.2016.04.049
Meier, M. R., Sarigaphuti, M., Sainamthip, P., and Plank, J. (2015). Early hydration of Portland cement studied under microgravity conditions, Constr. Build. Mater. 93, 877–883. doi: 10.1016/j.conbuildmat.2015.05.074
Mindess, S., Young, J. F., and Darwin, D. (2003). Concrete, Second Edition. Upper Saddle River, NJ: Pearson Education, Inc.
National Research Council (2012). NASA Space Technology Roadmaps And Priorities: Restoring NASA's Technological Edge and Paving the Way for a New Era in Space. Washington, DC: National Academy Press. doi: 10.17226/13354
Powers, T. C. (1958). Structure and physical properties of hardened Portland cement paste. J. Am. Ceram. Soc. 41, 1–6.
Powers, T. C., and Brownyard, T. L. (1946). Studies of the physical properties of hardened portland cement paste. J. Proc. 43, 101–132.
Powers, T. C., Copeland, L. E., Hayes, J. C., and Mann, H. M. (1954). The properties of fresh concrete. J. Proc. 51, 285–298.
Provis, J. L. (2015). Grand Challenges in Structural Materials, Front. Mater. 2, 8–11. doi: 10.3389/fmats.2015.00031
Qi, X. B., Chen, Y., Kang, X. H., Li, D. Z., and Gong, T. Z. (2017). Modeling of coupled motion and growth interaction of equiaxed dendritic crystals in a binary alloy during solidification. Sci. Rep. 7, 1–16. doi: 10.1038/srep45770
Rajabipour, F., Giannini, E., Dunant, C., Ideker, J. H., and Thomas, M. D. A. (2015). Alkali – silica reaction: current understanding of the reaction mechanisms and the knowledge gaps. Cem. Concr. Res. 76, 130–146. doi: 10.1016/j.cemconres.2015.05.024
Rajabipour, F., Sant, G., and Weiss, J. (2007). “Development of electrical conductivity-based sensors for health monitoring of concrete materials,” in TRB Annual Conference, CD-Rom Paper# 07-1765 (Washington, DC: Transportation Research Board), 1–16.
Scrivener, K. L. (1989). The Microstructure of Concrete. Mater. Sci. Concr. III. 1, 127–161. doi: 10.1016/0008-8846(95)00036-C
Scrivener, K. L. (2004). Backscattered electron imaging of cementitious microstructures: understanding and quantification, Cem. Concr. Compos. 26, 935–945. doi: 10.1016/j.cemconcomp.2004.02.029
Scrivener, K. L., Juilland, P., and Monteiro, P. J. M. (2015). Advances in understanding hydration of Portland cement. Cem. Concr. Res. 78, 38–56. doi: 10.1016/j.cemconres.2015.05.025
Thomas, J., and Jennings, H. (2019). The Science of Concrete. Evanston: Northwester University. Available online at: http://iti.northwestern.edu/cement/index.html
Thomas, J. J., Jennings, H. M., and Chen, J. J. (2009). Influence of nucleation seeding on the hydration mechanisms of tricalcium silicate and cement. J. Phys. Chem. C. 113, 4327–4334. doi: 10.1021/jp809811w
Wong, H. S., Head, M. K., and Buenfeld, N. R. (2006). Pore segmentation of cement-based materials from backscattered electron images. Cem. Concr. Res. 36, 1083–1090. doi: 10.1016/j.cemconres.2005.10.006
Young, J. F., and Hansen, W. (1987). Volume relationships for C-S-H formation based on hydration stoichiometries. Mater. Res. Soc. 85, 313–322.
Zhang, J., and Scherer, G. W. (2011). Cement and concrete research comparison of methods for arresting hydration of cement. Cem. Concr. Res. 41, 1024–1036. doi: 10.1016/j.cemconres.2011.06.003
Keywords: microgravity, C3S hydration, microstructure, porosity, portlandite CH, sedimentation, bleeding, phase distribution
Citation: Moraes Neves J, Collins PJ, Wilkerson RP, Grugel RN and Radlińska A (2019) Microgravity Effect on Microstructural Development of Tri-calcium Silicate (C3S) Paste. Front. Mater. 6:83. doi: 10.3389/fmats.2019.00083
Received: 19 January 2019; Accepted: 08 April 2019;
Published: 24 April 2019.
Edited by:
Maria Juenger, University of Texas at Austin, United StatesReviewed by:
Jinrui Zhang, Tianjin University, ChinaHongyan Ma, Missouri University of Science and Technology, United States
Copyright © 2019 Moraes Neves, Collins, Wilkerson, Grugel and Radlińska. This is an open-access article distributed under the terms of the Creative Commons Attribution License (CC BY). The use, distribution or reproduction in other forums is permitted, provided the original author(s) and the copyright owner(s) are credited and that the original publication in this journal is cited, in accordance with accepted academic practice. No use, distribution or reproduction is permitted which does not comply with these terms.
*Correspondence: Juliana Moraes Neves, am1uMjczQHBzdS5lZHU=