 Feifei Sun1
 Jiaqi Yang
- 1State Key Laboratory of Disaster Reduction in Civil Engineering, Tongji University, Shanghai, China
- 2Department of Structure Engineering, College of Civil Engineering, Tongji University, Shanghai, China
Viscous damping wall (VDW) is an effective velocity-dependent damper, which can dissipate earthquake energy by shear strain of viscous material. The damping force equation of VDW can only be obtained from regression of VDW dynamic test results, as velocity exponent of power-law material can not be obtained from rheometers. In this study, a Dynamic Sandwich-Type Shear test was designed matching the design working conditions of VDW. A series of experiments with different frequencies and strain amplitudes were conducted. Simple data procession methods were proposed to calculate velocity exponent and storage/loss modulus of polymer from experimental data. Comparison with methods adapted from those for VDW formula validated that radial linear regression method was proper to separate stress components and pivotal point method was accurate to evaluate velocity exponent. The velocity exponents obtained varied from 0.8 to 1, with various loading frequency and strain amplitude. Finally, the differences between the results of storage/loss modulus in DSTS test and ARES test were compared. Due to the extrusion effect caused by engineering working condition, the storage and loss modulus obtained by DSTS test was larger than the modulus obtained by ARES test.
Introduction
One of the most challenging tasks for civil engineers in recent decades has been solving overwhelming earthquake problems, which may cause heavy casualties. Besides vibration isolation design (Xu et al., 2019), researchers have been focusing on seismic mitigation technologies using viscous damping components (Xu et al., 2003, 2004, 2016; Xu, 2007). Viscous damping wall (VDW) is a new type of wall-shaped energy absorber, which can be hidden in building walls and provides large energy absorbing capacity. The performance of VDW is largely dependent on its viscous material. However, the investigations on mechanical properties of such viscous materials are insufficient, causing a major obstacle for in-depth research on VDW.
Researchers have investigated the performance of VDW itself and damping force formula. Miyazaki et al. (1986) carried out a series of cyclic tests to investigate the performance of VDW itself and obtained a design formula. Ou et al. (2005a) proposed a VDW damping force model by regression method and conducted a series of dynamic experiments to study the dynamic performance of VDW with variable temperature, displacement amplitude, velocity, and vibration frequency. Sasaki et al. (2012) conducted a series of oscillation tests against large earthquakes to clarify the characteristics of VDW. A simplified design formula neglecting the influence of stiffness was proposed and compared with experimental curves. Experimental results showed that VDW can still dissipate energy of oscillations even though the damping force decreased over a long time. Sun et al. (2018) conducted a small-scale shaking table test and a large-scale dynamic actuator test to investigate the influence of loading frequency on VDW's performance, and proposed a unified model considering the influence of loading frequency by means of introducing the effect of loading history.
Viscous materials for VDW are mainly semi-solid material such as polymer having both elastic properties and viscous properties. In the field of civil engineering, the investigations of polymer's mechanical properties are insufficient. Ou et al. (2005b) investigated the stability under high temperatures, durability, chemical security and dynamic performance of a new type of viscous material for VDW. Bouix et al. (2009) investigated the compressive stress- strain behavior of Polypropylene over a wide range of engineering strain rates from 0.01 to 1,500 microstrain/s. Drozdov et al. (2010) conducted a uniaxial tensile test for polypropylene/polyethylene blends with constant strain rates, relaxation tests and creep tests at room temperature. Ardakani et al. (2012) studied the rheology of Polypropylene/polybutene-1 blend with low frequency and large shear rate.
Several kinds of testing methods have been used to measure the mechanical parameters of polymer. A cone-and-plate method was used to investigate the storage and loss modulus of viscous fluid (Makris et al., 1993). Several scholars used a non-linear ultrasound method called Dynamic Acoustoelastic Testing (DAET) to assess the non-linear mechanical properties of viscoelastic material. The DAET method is based on the interaction between a low-frequency acoustic wave to successively compress and expand the material, and ultrasound pulse to probe this medium. The Time of Flight Modulations (TOFM) of the ultrasound pluses are plotted as a function of the low-frequency pressure amplitude on DAET diagrams (Trarieux et al., 2013). The mechanical properties of silicone oils were investigated by DAET. An analytical model to describe non-linear viscoelastic properties of silicone oil was proposed and validated the accuracy by comparing analytical results with DAET results (Trarieux et al., 2012, 2013). However, DAET cannot measure the parameters of polymer under shear strain excitation. Rheometer is another technique to investigate the mechanical properties of polymer under shear strain. Dynamic Shear Rheometer (DSR) was used to investigated the effect of time and temperature on blending level between fresh and actual RAP blinders (Yousefi Rad et al., 2014). ARES system is a is an advanced strain controlled rheometer, which tests the polymer's modulus precisely. ARES test usually used to measure the linear mechanical property under shear strain of polymer. Polymers such as SBR and PEKK were investigated on the influences of frequencies, strain rates and strain amplitudes on modulus of polymers (Hu et al., 2008; Snijkers and Vlassopoulos, 2011; Dessi et al., 2016; Coulson et al., 2018). However, polymers are usually shear-thinning material and following the power-law whose velocity exponent is not equal to 1 (Fatkullin et al., 2011; Li et al., 2013), while rheometers assume that the velocity exponent is always equal to 1 during measuring process. Therefore, a method to measure the velocity exponent is needed.
Rheometers and other testing methods do not consider velocity exponent's effects and the working condition of viscous material in VDW. In order to solve these problems, a new DSTS (Dynamic Sandwich-Type Shear) test was designed and used in this research. Moreover, a processing method is proposed in order to measure the storage/loss modulus and velocity exponent of polymer. The influence of loading frequency and strain amplitude on storage, loss modulus and velocity exponent was also studied in this paper by DSTS test.
Materials and Methods
In this experiment, Oppanol-B12-PIB supplied by BASF SE (BASF SE, Ludwigshafen, Germany) has been used. Oppanol-B12-PIB is a kind of polymer containing 200 mg/kg of hexane and 4 mg/kg of fluorine with viscose average molecular weight of 60,000 and specific gravity 0.92 g/cm3. Viscosity of Oppanol-B12-PIB under 100 degree Celsius is 30,000 mPa·s and coefficient of expansion under 20 degree Celsius is 6.3·10−4k−1. The dissipation coefficient of Oppanol-B12-PIB under the loading frequency 50 Hz is 5·10−4. The melting point of Oppanol-B12-PIB is −64 degree Celsius.
Storage Modulus and Loss Modulus
Consider an oscillatory shear flow between two parallel plates at a distance h apart, where the bottom plate is stationary and top plate is sinusoidal displaced by a small amount δsin(ωt). According to Boltzmann's concept of fading memory (Phan-Thien, 2002), shear stress can be obtained as
where ω is angular frequency (rad/s), γ(t) is the shear strain and , is shear strain rate, and (microstrain/s). G′(ω) is the storage modulus (N/m2), μ′(ω) is the dynamic viscosity (N·s/m2). The other two related quantities, the loss modulus G″(ω) (N/m2), and the storage viscosity μ″(ω) (N·s/m2) are defined as
Power Law
Polymers are usually Non-Newtonian material, and the velocity exponent α of Non-Newtonian fluid does not equal to 1. In the other words, the relationship between viscous stress and strain rate of polymers is non-linear, which is called power law.
The constitutive equation of power law is
where α is velocity exponent, τV is viscous shear stress, is shear strain rate, μ′ is viscosity.
Concept of DSTS Test
To investigate the mechanical properties of PIB under shear strain like VDW, and to obtain the velocity exponent, a Dynamic Sandwich-Type Shear test (DSTS test) is proposed with schematic diagram shown in Figure 1. As in the actual engineering condition in VDW, the shear plate is sandwiched in the polymers, and the PIB is bonding on the surface of shear plate. When the shear plate undergoes displacement, the shear plate drives PIB to move together, which causes shear strain of PIB. At the same time, the PIB provides corresponding shear stress on bonding surface of shear plate, and the resultant force of the shear stress is damping force. The shear force and displacement can be converted into shear stress and shear strain as:
Where Q is damping force, S is displacement of shear plate, and H is the gap between polymers A is the area of shear plate that inserted in the polymer, A = 2ab, a is the width of shear plate and b is the insertion depth, γ is shear strain τ is shear stress.
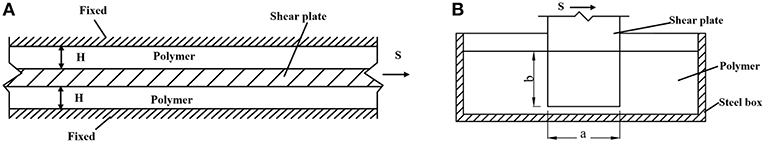
Figure 1. Schematic diagram of Dynamic Sandwich-Type Shear test. (A) Top view (B) Front view.
According to the material mechanic of viscoelastic material and power law, the constative equation can be written as:
where τV is viscous shear stress, τE is elastic shear stress. α is velocity exponent, is shear strain rate. γ is shear strain, μ′ is viscosity, G′is storage modulus.
Methods for Data Processing
Radial Linear Regression for Stress Separation
As indicated in Equation (7), the measured shear stress is a direct sum of two components of τV and τE. Given the complexity due to the power of the first derivative combined with a linear term, it is not a straightforward issue to separate the stress components. Observing the symmetry of the hysteresis curve, radial linear regression is proposed to regress the linear term from the hysteretic curve, and the slope of the regression line is the storage modulus G′ which is shown in Figure 2A. Thus, the viscous shear stress can be isolated from total shear stress as:
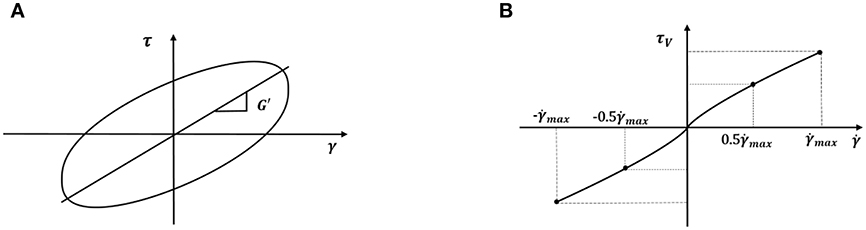
Figure 2. Data procession. (A) Radial linear regression (B) Pivotal points.
Pivotal Point Method for Velocity Exponent
As there are two undetermined quantities in Equation (4), two conditions are needed to solve the velocity exponent and loss modulus. This paper used maximum strain rate point and 0.5 times maximum strain rate point to calculate the parameters, as the two pivotal points shown in Figure 2B.
The equations are expressed as:
where is the maximum strain rate, , τVγmax is the stress at , is the stress at .
Fitting Method for Strain Rate
The shear stain γ can be obtained from the measured displacement S by Equation (6). Regarding the shear strain rate , as the pivotal point method is sensitive to its accuracy, it is not appropriate to use numerical differences to calculate the first derivate of γ. Therefore, the strain curves were fitted by sinusoidal functions firstly, and then the strain rates were derived as the first derivate of the fitted sinusoidal functions, as illustrated later in sub-section Calculation Results.
Experimental Set-Up
As shown in Figure 3A, the test specimen is composed of a steel plate sandwiched by PIB filled in a steel box. The insertion depth of shear plate is 25 mm, and the gap distance between steel shear plate and steel box is 5 mm, which is shown in Figure 3A. The width of shear plate is 40 mm (shown in Figure 3B), and the overall dimensions of steel box are 138 × 22 × 49 mm (shown in Figure 3C).
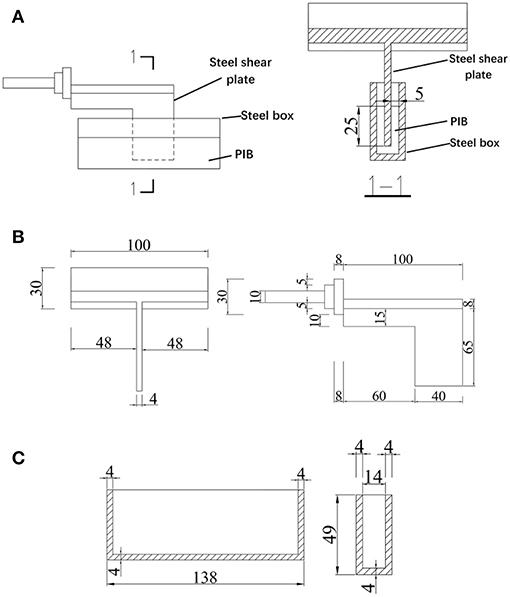
Figure 3. Test specimen, shear plate and steel box (unit: mm). (A) Installed specimen (B) Steel plate (C)Steel box.
The experiments were conducted at the Structural Laboratory of Tongji University. The Instrumentation schematic is shown in Figure 4A and the actual installation of DSTS test is shown in Figure 4B. The reaction frame is fixed and load cell is fixed on the end of the reaction frame. The shear plate is connected on the load cell rigidly, and the shear plate is inserted in the steel box which is filled with PIB. And the steel box is rigidly connected on the shake table.
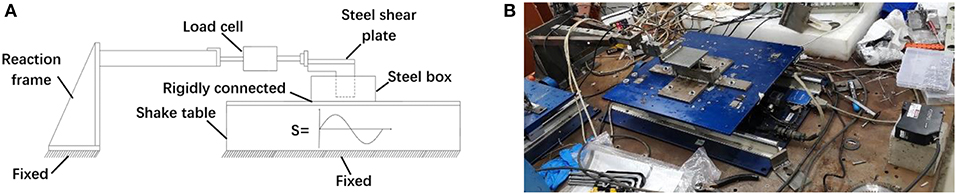
Figure 4. Instrumentation schematic and Actual installation of DSTS test. (A) Instrumentation schematic (B) Actual Installation of DSTS test.
During the experiment, the shake table is going to provide sinusoidal excitation and the steel box which is rigidly connected on shake table is going to move together, the load cell is going to receive reaction force signal and laser displacement meter is going to receive displacement signal.
A series of test cases were conducted and the test cases are shown in Table 1. In variable frequency test, the imposed displacement amplitude was 4 mm, while the angular frequencies of loading sine wave were 0.63, 1, 1.6, 2.5, 4, 6.3 rad/s, respectively. During variable frequency test, the excitation angular frequencies of ARES tests were 0.63, 1, 1.6, 2.5, 4, 6.3 rad/s, respectively which were set in the ARES's program and cannot be changed. In order to compare with the results of ARES test, this paper selected the same test cases as ARES test during DSTS test. In variable strain test, the imposed displacement amplitudes were 1.25, 2.5, 4, 6, 8, 10 mm, respectively, while the angular frequency of loading sine wave was 6.3 rad/s. In order to investigate the behavior of PIB under small and large shear strain, this paper selected small displacement amplitudes 1.25 and 2.5 mm, while the large displacement amplitudes were 4, 6, 8, 10 mm. Cycles of each testing case were 5. Sine wave used as excitation wave in the loading process according to the displacement control scheme. The displacement was measured by laser displacement meters with measurement period of 20 ms, and the force was measured by load cell with period of 20 ms.
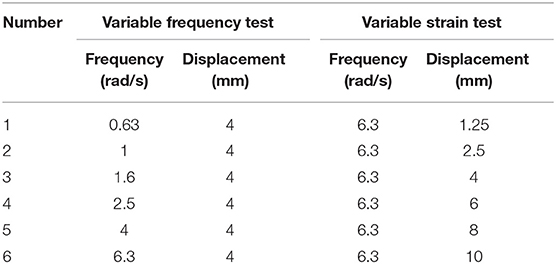
Table 1. Test cases.
Results
Hysteretic Curve
The hysteretic curves of variable loading frequency test are shown in Figure 5A. As the frequency increases, the peak stress increases, and the slope of the hysteretic curve increases gradually. The hysteretic curves under 4 and 6.3 rad/s are almost overlapping, indicating that PIB is insensitive to frequency variations over this frequency range.
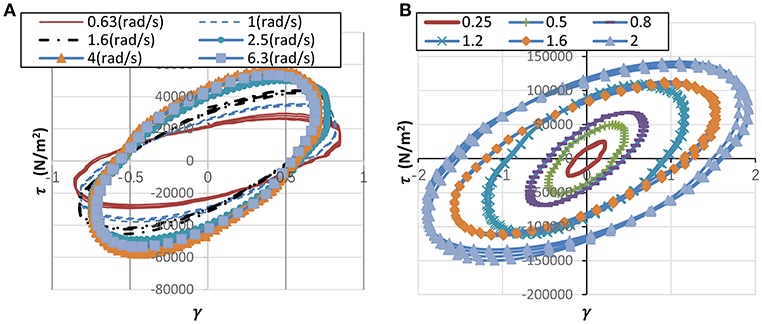
Figure 5. Hysteretic curves of DSTS test. (A) Variable loading frequency (B) Variable loading strain.
The hysteretic curves of variable strain amplitude test are shown in Figure 5B. The displacement amplitudes were transformed into strain amplitudes by Equation (6) and strain amplitudes were shown in the legend of Figure 5B. As the strain amplitude increases, the area of hysteretic loop increases rapidly, the peak stress also increases and the slope of the hysteretic curve decreases.
Calculation Results
Taking the third cycle of hysteretic loop for calculation. The strain time history curves were fitted by sinusoidal functions. Taking the case at the frequency of 0.63 Hz and the strain amplitude of 0.8 as an example, the strain time history was fitted as 0.7293sin(3.958t+0.6208), with a coefficient of regression of R2 = 0.991. The needed strain rates of the pivotal points were then calculated with the first derivative of the fitting function.
The relationship between frequency and mechanical parameters of PIB are shown in Figure 6. As the frequency increases, the storage modulus and loss modulus increase (shown in Figure 6A). And these phenomena are typical for polymer in the test results obtained in other investigations (Ardakani et al., 2012). As the frequency increases, velocity exponents decreases in the range of 0.94~1.02 (shown in Figure 6B).
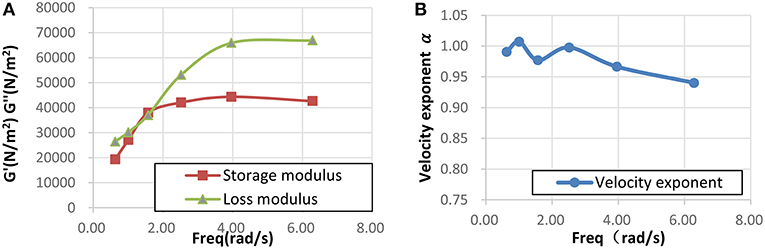
Figure 6. Results of DSTS test (variable loading frequency test). (A) Storage/loss modulus (B) Velocity exponent.
The relationship between strain amplitude and mechanical parameters of PIB are shown in Figure 7. As the amplitude increases, the storage modulus decreases, and the loss modulus increases (shown in Figure 7A). And these phenomena are typical for polymer in the test results obtained in other investigations (Ou et al., 2005b). Velocity exponent exhibits no clear trend with the frequency increase, and fluctuates within the range of 0.8~1 (shown in Figure 7B).
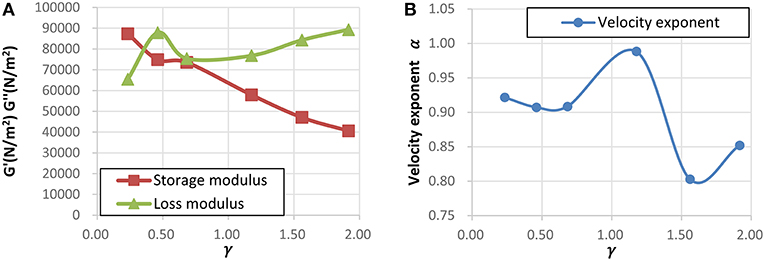
Figure 7. Results of DSTS test (variable strain amplitude test). (A) Storage/loss modulus (B) Velocity exponent.
Discussion
Validation of Stress Separation Method
In comparison with the radial linear regression method mentioned in sub-section Radical Linear Regression for Stress Separation, the maximum strain point, adapted from the approach often intuitively used for VDW, is also applied here to separate the stress components with the following equation.
where τγmax is stress at the maximum strain, γmax is the maximum strain.
The test case with frequency 2.5 rad/s, strain 0.8 is taken as an example to illustrate effect of two different ways of stress separation. After calculating storage modulus, bringing storage modulus into Equation (8) can separate elastic stress and obtain viscosity hysteretic curve. Figure 8 presents the comparison of viscous stress-strain hysteretic curves obtained by radial linear method and maximum strain point method. It can be seen from Figure 8, the curve obtained by the former method is symmetric while the other one is obviously asymmetric about horizontal axis, indicating that some elastic strain has not been taken out. Therefore, the radial linear method is more suitable to separate stress components.
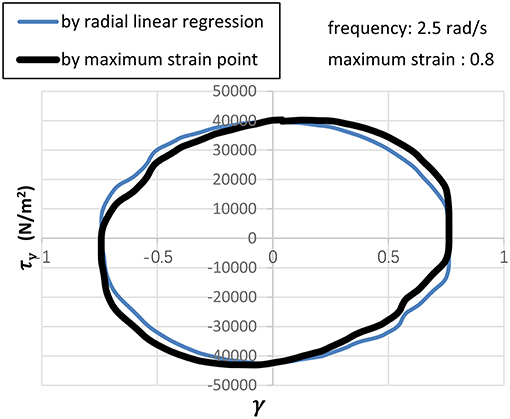
Figure 8. Viscous stress hysteretic curve.
Validation of Pivotal Point Method
Qualitative Validation
The following Equation (12) (Japan Society of Seismic Isolation, 2008) was adapted from the regressed energy formula of the relationship between dissipation energy and velocity power exponent of VDW based on enormous amount of test data of VDWs.
where Ed is the dissipated energy Ed equals to the area of hysteretic loop. α is velocity exponent, γγ, max is the maximum strain, τVγ, max is the corresponding viscous shear stress when γ is the maximum strain.
The comparison of velocity exponents by pivotal point method and Equation (12) are presented in Figure 9. Under variable loading frequency test, the velocity exponent obtained from two methods both tend to decrease as the frequency increases. The velocity exponent obtained by Equation (12) is larger than 1, while the velocity exponent obtained by pivotal point method is smaller than 1. As the testing material in DSTS test is a kind of shear-thinning material for VDW, the results of pivotal point method are more acceptable.
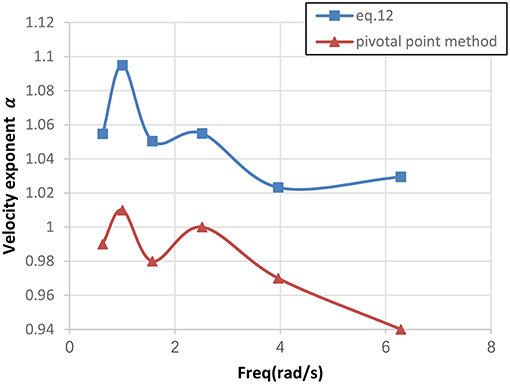
Figure 9. Comparison between velocity exponent between pivotal point method and Equation (12).
Accuracy Validation
In practice, viscous damping force of VDW is expressed as a power function of stroke velocity, which can be regressed with measured data of viscous damping force amplitudes and velocity amplitudes of a series of test cases with different loading frequencies. The same regression approach was applied herein for the present data of viscous shear stress amplitudes and shear strain rate amplitudes under variable loading frequencies, which were separated by radial linear regression. As shown in Figure 10, the regression produces parameters value G″ = 26942N/m2 and α = 0.32. In this way the obtained α is smaller than 1, and is far from the values in Figure 6B, which is qualitatively acceptable. This approach produces a single set of parameters over a range of loading frequency.
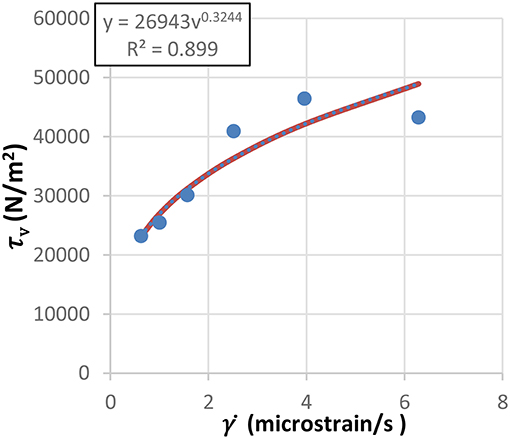
Figure 10. Regression results of viscous stress amplitudes.
Figure 11 presents the comparison of hysteresis curve between experimental results and simulated results by Equation (7) with the parameters obtained by pivotal point method and the above regression approach. It can be seen that all the simulated curves obtained by the pivotal point method fit experimental curves well, while the other simulated curves depart significantly from experimental curve. Therefore, the pivotal point method is quite accurate and more reasonable to calculate velocity exponent.
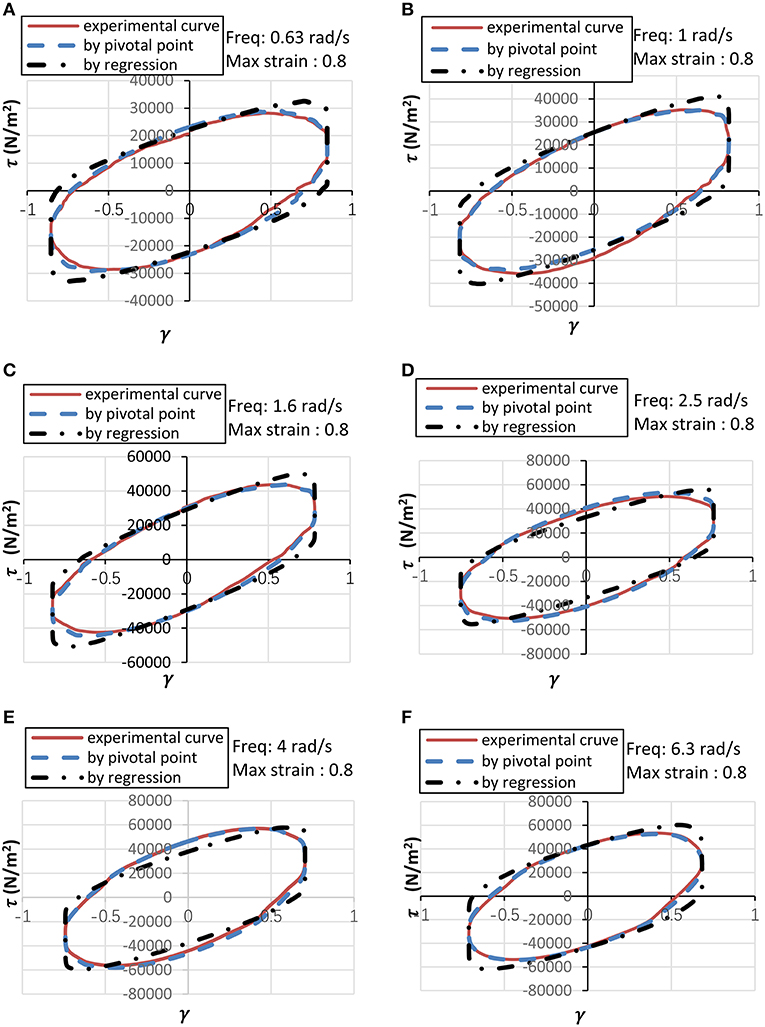
Figure 11. Comparison of hysteretic curves between experimental results and simulated results with Equation (7).
Comparison of Modulus Between ARES Test and DSTS Test
ARES system is an advanced strain controlled rheometer, which tests the specimen's storage modulus and loss modulus precisely. This paper also conducted an ARES test on the same material and the results of ARES test and DSTS test are compared. In the ARES test, the diameter of plate is 25 mm, the gap between two plate is 1 mm and the frequency ranges from 0.63 to 6.3 rad/s.
The comparison of storage modulus between ARES test and DSTS test is shown in Figure 12A. It is shown that the storage modulus increases as the frequency increases in ARES test. The storage modulus obtained by DSTS test is 1.4~3.5 times ARES's result. This phenomenon was caused by extrusion effect. When the shear plate was moving in the steel box, the moving path of shear plate and surface of polymer did not fit smoothly which can cause additional lateral compression, namely the extrusion effect, while the ARES test is pure shear test without the extrusion effect. The extrusion effect does unavoidably exist in the behavior of VDW, showing the necessity of DSTS test.
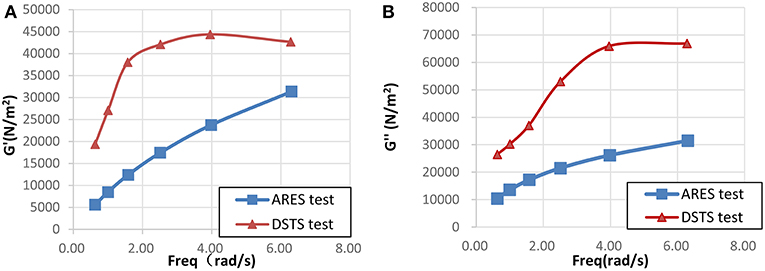
Figure 12. Comparison of storage modulus and loss modulus between ARES test and DSTS test. (A) Storage modulus (B) Loss modulus.
The comparison of loss modulus between ARES test and DSTS test is shown in Figure 12B. It is shown that the loss modulus increases as the frequency increases in ARES test. The loss modulus obtained by DSTS test is 2.1~2.5 times ARES's result. This phenomenon was also caused by the extrusion effect. The comparison here above indicates that the DSTS test can capture dynamic mechanical properties of materials under engineering condition.
Conclusion
The influence of loading frequency and strain amplitude on mechanical properties of PIB has been investigated by DSTS test which was designed by considering the engineering working condition of PIB in VDW. The main conclusion can be summarized as follow:
1. Radial linear regression method was proposed to calculate storage modulus and pivotal point method was proposed to calculate loss modulus and velocity exponent. The radial linear regression method could accurately separate stress components The velocity exponent obtained by pivotal point method was both qualitatively reasonable and accurate to simulate the experimental curves.
2. The velocity exponent obtained was generally smaller than 1, and varied from 0.8 to 1. With strain amplitude in the range of “0.4~2.4” and the angular frequency in the range of “0.63 ~6.3 rad/s”, the velocity exponent tends to decrease with the increase of frequency and strain.
3. The storage modulus of PIB decreases as the strain amplitude increases, while it increases as the frequency increases. The loss modulus of PIB increases as the strain amplitude and frequency increase.
4. Due to the extrusion effect caused by engineering working condition, Storage modulus obtained by DSTS test is 1.4~3.5 times ARES's result, and loss modulus obtained by DSTS test is 2.1~2.5 times ARES's result.
In the variable strain amplitude test cases, the modulus and velocity exponent of PIB exhibited obvious fluctuation with the increase of strain amplitude. This phenomenon will affect the performance of VDW, and it will be systematically studied in the future. The suitable viscous materials for VDW are rare, therefore only DSTS tests of one kind of PIB were conducted in this paper. In the future, DSTS test will be used to find more material that suitable for VDW.
Data Availability
All datasets generated for this study are included in the manuscript and/or the supplementary files.
Ethics Statement
The testing material and the parameters were supplied by the Chinese agent of BASF SE.
Author Contributions
FS contributed experimental design, result discussion and data analysis. JY designed DSTS test, collected and analyzed data, interpreted results, and drafted the manuscript. TW conducted ARES test and collected data.
Funding
Financial support by the National Key Research and Development Program of China (Project No. 2016YFC0701203) and Financial support by National Natural Science Foundation of China (No. 51778488) are greatly acknowledged.
Conflict of Interest Statement
The authors declare that the research was conducted in the absence of any commercial or financial relationships that could be construed as a potential conflict of interest.
References
Ardakani, F., Jahani, Y., and Morshedian, J. (2012). Dynamic viscoelastic behavior of polypropylene/polybutene-1 blends and its correlation with morphology. J. Appl. Polym. Sci. 125, 640–648. doi: 10.1002/app.36324
Bouix, R., Viot, P., and Lataillade, J. L. (2009). Polypropylene foam behaviour under dynamic loadings: strain rate, density and microstructure effects. Int. J. Impact Eng. 36, 329–342. doi: 10.1016/j.ijimpeng.2007.11.007
Coulson, M., Quiroga Cortés, L., Dantras, E., Lonjon, A., and Lacabanne, C. (2018). Dynamic rheological behavior of poly (ether ketone ketone) from solid state to melt state. J. Appl. Polym. Sci. 135:46456. doi: 10.1002/app.46456
Dessi, C., Tsibidis, G. D., Vlassopoulos, D., De Corato, M., Trofa, M., D' Avino, G., et al. (2016). Analysis of dynamic mechanical response in torsion. J. Rheol. 60, 275–287. doi: 10.1122/1.4941603
Drozdov, A. D., Christiansen, J. D., Klitkou, R., and Potarniche, C. G. (2010). Viscoelasticity and viscoplasticity of polypropylene/polyethylene blends. Int. J. Solids Struct. 47, 2498–2507. doi: 10.1016/j.ijsolstr.2010.05.010
Fatkullin, N., Mattea, C., and Stapf, S. (2011). A simple scaling derivation of the shear thinning power-law exponent in entangled polymer melts. Polymer 52, 3522–3525. doi: 10.1016/j.polymer.2011.06.009
Hu, Y. T., Palla, C., and Lips, A. (2008). Comparison between shear banding and shear thinning in entangled micellar solutions. J. Rheol. 52:379. doi: 10.1122/1.2836937
Japan Society of Seismic Isolation (2008). Passive Damping Structure Design and Construction Manual. Translated by T. Jiang. Beijing: China Architecture & Building Press [in Chinese].
Li, J. J., Jiang, H. Q., and Liu, Y. (2013). The viscoelastic effect of polymer on tracer dispersion. J. Dispers. Sci. Technol. 34, 222–227. doi: 10.1080/01932691.2012.658318
Makris, N., Dargush, G. F., and Constantinou, M. C. (1993). Dynamic analysis of generalized viscoelastic fluids. J. Eng. Mech. 119, 1663–1679.
Miyazaki, M., Kitada, Y., Arima, F., and Hristov, I. (1986). “Earthquake response control design of buildings using viscous damping walls,” in Proceedings of the 1st East Asian Conference on Structural Engineering and Construction (Bangkok), 1882–1891. doi: 10.1016/j.engstruct.2008.05.023
Ou, J., Liu, W. Q., and Zhang, Z. T. (2005a). Experimental study on dynamic performance of viscous damping wall [in Chinese]. Earthq. Resist. Eng. Retrofit. 27, 55–59. doi: 10.3969/j.issn.1002-8412.2005.06.011
Ou, J., Liu, W. Q., and Zhang, Z. T. (2005b). Experimental research on a new type of viscous damping material [in Chinese]. J. Earthq. Eng. Eng. Vibr. 25, 108–112. doi: 10.3969/j.issn.1000-1301.2005.01.019
Phan-Thien, N. (2002). Understanding Viscoelasticity. Berlin: Springer, 101–102. doi: 10.1007/978-3-642-32958-6
Rad, F., Sefidmazgi, N., and Bahia, H. (2014). Application of diffusion mechanism. Transp. Res. Rec. 2444, 71–77. doi: 10.3141/2444-08
Sasaki, K., Miyazaki, M., and Sawada, T. (2012). “Characteristics of viscous wall damper of intense oscillation test against large earthquakes,” in Proceedings of the 15th World Conference on Earthquake Engineering (Lisbon), 1742–1750.
Snijkers, F., and Vlassopoulos, D. (2011). Cone-partitioned-plate geometry for the ARES rheometer with temperature control. J. Rheol. 55:1167. doi: 10.1122/1.3625559
Sun, F. F., Wu, T. Y., and Mo, G. (2018). Resistant force model of viscous damping wall considering influence of loading frequency. Eng. Struct. 161, 96–107. doi: 10.1016/j.engstruct.2018.01.071
Trarieux, C., Callé, S., Moreschi, H., Poulin, A., Tranchant, J. F., and Defontaine, M. (2013). “An analytical model to describe nonlinear viscoelastic properties of fluids measured by Dynamic Acoustoelastic Testing,” in Ultrasonics Symposium (Glasgow: IEEE). doi: 10.1109/ULTSYM.2012.0182
Trarieux, C., Callé, S., Poulin, A., Tranchant, J. F., and Defontaine, M. (2012). Measurement of nonlinear viscoelastic properties of fluids using dynamic acoustoelastic testing. IOP Conf. Ser. Mater. Sci. Eng. 42:2026. doi: 10.1088/1757-899X/42/1/012026
Xu, Z. D. (2007). Earthquake mitigation study on viscoelastic dampers for reinforced concrete structures. J. Vibr. Control 13, 29–45. doi: 10.1177/1077546306068058
Xu, Z. D., Huang, X. H., Xu, F. D., and Yuan, J. (2019). Parameters optimization of vibration isolation and mitigation system for precision platforms using non-dominated sorting genetic algorithm. Mech. Syst. Signal Process. 128, 191–201. doi: 10.1016/j.ymssp.2019.03.031
Xu, Z. D., Liao, Y. X., Ge, T., and Xu, C. (2016). Experimental and theoretical study on viscoelastic dampers with different matrix rubbers. J. Eng. Mech. ASCE 142: 04016051.
Xu, Z. D., Shen, Y. P., and Zhao, H. T. (2003). A synthetic optimization analysis method on structures with viscoelastic dampers. Soil Dyn. Earthq. Eng. 23, 683–689. doi: 10.1016/j.soildyn.2003.07.003
Keywords: polymer, dynamic mechanical property, velocity exponent, viscous damping wall, dynamic sandwich-type shear (DSTS) test
Citation: Sun F, Yang J and Wu T (2019) Dynamic Mechanical Property Experiment of Viscous Material for Viscous Damping Wall. Front. Mater. 6:112. doi: 10.3389/fmats.2019.00112
Received: 26 February 2019; Accepted: 30 April 2019;
Published: 17 May 2019.
Edited by:
Yong Lu, University of Edinburgh, United KingdomReviewed by:
Ionut Ovidiu Toma, Gheorghe Asachi Technical University of Iaşi, RomaniaAntonio Caggiano, Darmstadt University of Technology, Germany
Copyright © 2019 Sun, Yang and Wu. This is an open-access article distributed under the terms of the Creative Commons Attribution License (CC BY). The use, distribution or reproduction in other forums is permitted, provided the original author(s) and the copyright owner(s) are credited and that the original publication in this journal is cited, in accordance with accepted academic practice. No use, distribution or reproduction is permitted which does not comply with these terms.
*Correspondence: Jiaqi Yang, eWpxamFydmlzQHRvbmdqaS5lZHUuY24=