 Abderrahmane Ayadi
 Mylène Deléglise-Lagardère
 Chung Hae Park
 Patricia Krawczak
- 1IMT Lille Douai, Institut Mines-Télécom, Polymers and Composites Technology & Mechanical Engineering (TPCIM) Research Lab, Douai, France
- 2Université de Lille, Lille, France
Absorption-based microcomputed tomography (μCT) scans using polychromatic X-ray sources are frequently used to analyse the microstructure of polymer-matrix composites. Assuming the proportionality between linear X-ray attenuation coefficients and gray levels in the reconstructed μCT images, segmentation techniques can be used to conduct qualitative and quantitative analyses. Nevertheless, the reliability of such analyses is limited in partially consolidated composites formed of commingled yarns due to low contrast induced by beam hardening and partial volume effect. This paper aims at investigating the possibility of using low-contrast μCT images to analyse fiber bed deformation and impregnation mechanism by staged consolidation of a weft-knitted fabric of commingled thermoplastic/glass yarns. The experimental work is focused on the effect of the compaction ratio of the consolidation cycle. Absorption-based μCT analyses are conducted for representative samples using a voxel size of 10 μm and a constant energy-level of the X-rays source. Preliminary qualitative analyses of the raw reconstructed images indicate that beam hardening is the most significant in the case of the non-consolidated sample and that partial volume effect makes it difficult to visually distinguish between dry and impregnated zones inside the yarns at a compaction ratio of 63%. Thus, two image-quality descriptors, viz. contrast and signal-to-noise ratio are evaluated based on the K-means clustering method to follow their variation for four consolidation levels. The corresponding volume fractions of glass fibers, thermoplastic matrix, and voids are compared with the results of a second weight-controlled thresholding method. Considering that the weight-controlled thresholding method is less sensitive to beam hardening, it is confirmed that obtaining reliable segmentation results based on the K-means method requires a contrast around 0.5 and signal-to-noise ratio lower than 3. The results from the comparison with the classical consolidation scenario of commingled yarns confirm the potential of using μCT images of different qualities to characterize partially consolidated weft-knitted fabrics.
Introduction
In the automotive industry, the transfer of composite manufacturing technologies from the laboratory to the industrial scales is mainly determined by the productivity level and the quality of the produced parts. The basic concept to prepare structural composite materials consists in impregnating a fiber reinforcement by a liquid resin and then consolidating or curing the fiber-resin system under controlled temperature and pressure. Thermoplastic matrix composites are gaining their popularity because of their recyclability and high impact resistance. Another advantage of thermoplastic matrix composites is their shorter processing time than that of thermoset counterparts where a long resin curing reaction is required. Nevertheless, one of the main challenges of thermoplastic matrix composites is the relatively high viscosity of thermoplastic melts compared with thermosets (Alagirusamy and Ogale, 2004; Risicato et al., 2014), which makes impregnation more difficult. Among the potential solutions to reduce the manufacturing cycle time of structural thermoplastic composites while keeping the high quality of a final part are the reduction of the flow length by means of through-thickness impregnation (Kim and Park, 2017), the use of low viscosity engineering thermoplastics (Studer et al., 2019) or the thermo-consolidation of fiber-matrix premixed semi-products. The existent technologies using pre-mixed semi-products include the stacking of polymer film between fiber plies, the powder impregnation of bundles or the commingling polymer and reinforcing fibers inside the yarns (Svensson et al., 1998). In the recent years, numerous technologies were adapted to process thermoplastic prepreg or pre-mixed semi-products. For example, automated tape laying processes are used to fabricate composite laminates from prepreg tapes. The local and online consolidation of thermoplastic tapes during an automated placement has become possible by using a robotic deposition head with laser heating (Schaefer et al., 2017) or ultrasonic energy sources (Lionetto et al., 2015). Over-molding processes can add some technological functionalities to thermoplastic prepreg sheets (Studer et al., 2019). Hot-press processes are also used for the manufacturing of long fiber reinforced thermoplastic composites (Wang et al., 2011). The use of induction-heating systems is recently reported to reduce the consolidation duration of a woven commingled fabric of flax/polypropylene to avoid the thermal degradation of natural fibers (Ramakrishnan et al., 2019). Another potential method to reduce the cycle time of hot-press processes is by combining consolidation and shaping of pre-impregnated or semi-impregnated thermoplastic composites (Wysocki et al., 2008). By combining a commingling method of reinforcement and thermoplastic filaments with a weft-knitting technology, pre-mixed dry semi-products may present a promising alternative to reduce cycle-time. In particular, biaxial weft-knitted fabrics (BWKF) are potential candidates to obtain composite parts with a complex geometry at a reduced cycle-time (Li and Bai, 2009; Risicato et al., 2014; Demircan et al., 2015). However, the better understanding of the consolidation mechanism is still required to optimize the impregnation quality of obtained products.
In the literature, numerous studies have been conducted to characterize the effect of consolidation parameters namely temperature, pressure and impregnation duration (Ye et al., 1995; Trudel-Boucher et al., 2006; Liu et al., 2014). Based on the 2D characterization techniques, such as reflexion light microscopy and SEM micrographs, the chronological sequence of consolidation steps of commingled yarn composites is generally considered to analyse multiple primary phenomena. During the consolidation cycle, the initiation of the fabric compression after melting the matrix is associated with the elastic deformation of reinforcement filaments and the compression of yarns. These two processes lead to a quasi-instantaneous squeeze-out of the molten matrix from the core of the reinforcement yarns which result in the formation, bridging and coalescence of molten matrix pools outside the yarns (Phillips et al., 1998; Bernet et al., 1999). With the increase of the pressure holding time, the pressure builds up inside the fiber bed and the molten thermoplastic matrix impregnates the individual reinforcing fibers inside the yarns. The excessive resin is then squeezed-out from the reinforcement yarns and is forced to flow between the yarns to evacuate air (Van West et al., 1991; Long et al., 2001). This consolidation mechanism has been proposed from 2D surface observations which have a limitation to provide further information about the real 3D arrangements of the matrix and of voids in consolidated fabrics.
X-ray microcomputed tomography (μCT) is a non-destructive imaging technique which describes the internal microstructure of materials at different length scales. Thanks to the progress in X-ray CT imaging during the last decade, several recent studies have focused on composite material applications. For instance, conventional or laboratory scale μCT equipment can be used to analyse the fibrous architecture in composites (Centea and Hubert, 2011; Pazmino et al., 2014; Straumit et al., 2018) and to characterize process-induced defects, such as voids (Nikishkov et al., 2013; Mehdikhani et al., 2019). The obtained real microstructure can be used as an input for the numerical estimation of a preform permeability (Plank et al., 2015; Soltani et al., 2015) or the development of mesoscopic mechanical models of textile composites while considering the local artifacts, such as voids (Liu et al., 2017a; Chen et al., 2018). Higher energy X-ray beams, such as those in synchrotron facilities are more adapted to the in-situ μCT imaging which is required for the in-situ characterization at high time resolution and at resolutions lower than one micrometer. In-situ μCT analyses are more suitable to monitor damage (Böhm et al., 2015; Rolland et al., 2017; Yang et al., 2017; Jespersen et al., 2018; Wang et al., 2018), to characterize time dependent phenomena taking place during the process, such as the impregnation of reinforcement (Vilà et al., 2015; Sisodia et al., 2016; Larson and Zok, 2018) and the fiber bed compression (Latil et al., 2011; Ferré Sentis et al., 2017). In case the readers need more information about application of μCT characterization of polymer matrix composites, some reviews are already available in the literature (Maire and Withers, 2014; Duchene et al., 2018; Garcea et al., 2018).
In the case of commingled yarn thermoplastic matrix composites, μCT-based studies are still far from evaluating the impregnation quality and residual voids of totally consolidated composites (Madra et al., 2014; Patou et al., 2019), where a void represents an unfilled space within the composite due to the poor impregnation of fibers or the entrapment of air bubble. To the best knowledge of the authors, due to the limited energy level of laboratory X-ray sources compared to high resolution μCT imaging facilities, the absorption-based μCT has not yet been used to characterize the consolidation mechanism of BWKF (Carmignato et al., 2018). Based on the physics of X-ray/material interaction in absorption-based μCT scans, the gray level of each voxel encodes physical information about X-ray absorption at the corresponding spatial position within the analyzed object. Nikishov et al. have investigated the effect of X-ray energy levels on the contrast of some reference materials used, such as air, low density polyethylene, and glass (Nikishkov et al., 2013). They concluded that attenuation coefficients of X-rays are proportional to the material density in the cases of high beam energy (>100 kV) and of materials with low effective atomic numbers, such as epoxy and thermoplastic macromolecules. Consequently, the density of the constitutive materials of the analyzed objects is proportional to the gray levels of the reconstructed μCT images. In practice, the gray levels in μCT images not only encode physical information but also are affected by noise from the electronic detection equipment, such as dead pixels resulting in ring artifact after reconstruction (Maire and Withers, 2014). The local density variation inside the analyzed object where the regions including low density materials are in the vicinity of high density ones can also cause a local change of gray levels by beam hardening. Indeed, beam hardening is an artifact which takes place during the acquisition step using polychromatic beams generated by X-ray tubes in laboratory CT systems. By passing through an object, the photons of lower energy levels forming the X-ray beam are more easily filtered than those of higher energy. Thus, the average energy level increases. This effect is known as the “hardening” of the X-ray beam. By increasing the average energy levels of photons, the apparent density of a material increases and leads to a localized density variation. During the post-acquisition step, beam hardening is manifested in a homogeneous object (composed of the same material) according to a gradual darkening toward the interior in the reconstructed images. In the objects composed of different materials including voids (which can be considered as a very low density material), the regions with lower density materials which are in close proximity to higher density materials are affected. In fact, the lower density materials may appear to have higher densities than their effective ones. Consequently, it is difficult to distinguish between actual material variations and beam hardening artifacts. Technologically, beam hardening can be reduced by filtering low energy X-rays during the calibration step of the CT system before scanning the object. It can also be filtered during the post-acquisition step by using calibrations and filters which are integrated in data reconstruction software. For more detailed information the reader may refer to the following references (Ketcham and Carlson, 2001; Djukic et al., 2013; Maire and Withers, 2014; Hanna and Ketcham, 2017;Carmignato et al., 2018).
The achievable voxel size has also a direct incidence on the discretization of the analyzed sample. When an elementary volume representing a discrete region of a material includes more than one single phase, the resulted linear attenuation coefficient encodes a single equivalent linear attenuation coefficient corresponding to the mixture of the phases. Such effect is known as the partial volume effect and it is more significant for relatively coarse voxel sizes and near interfacial domains separating different materials (Schell et al., 2006; Bull et al., 2013; Kierklo et al., 2014; Léonard et al., 2017). As reported by Schell et al. the achievable resolution has a significant influence on the segmentation quality and it is dependent on the diameter of the virtual tube overlapping the scanned domain of a sample (Schell et al., 2006). In the case of polymer matrix/glass fiber composites the achievable voxel size can get down to 2 μm for sample sizes ranging between 2 and 20 mm by animating the scanned object according to helical acquisition path during the scan procedure (Ayadi et al., 2016).
There are numerous image segmentation techniques including manual operations based on the strong ability of human eyes to differentiate between objects (Arbeláez et al., 2011; Borra et al., 2019) and more automated operations. In the case of μCT images, manual segmentation operations are not reliable to conduct quantitative analyses. Berg et al. provided an overview of potential segmentation methods including absolute thresholding, region growing, contour detection and automatic clustering method involving machine learning (Berg et al., 2018). For composite materials, segmentation techniques are required to separate the constituents of the composite for numerous reasons, such as monitoring the geometric changes of the cross-sectional shapes of reinforcement yarns (Liu et al., 2017b), monitoring the compressibility of a fiber bed (Ferré Sentis et al., 2017) and inspecting the impregnation quality (Madra et al., 2014; Patou et al., 2019). Nevertheless, the aforementioned μCT flaws prohibit the existence of a standard segmentation method and thus, may limit the reliability of quantitative analyses (Berg et al., 2018).
The present study combines the partial consolidation of biaxial weft-knitted fabrics of commingled thermoplastic/glass fibers and the μCT scans using laboratory systems to investigate the impregnation mechanisms. First, the qualitative and quantitative evaluation of reconstructed μCT images is performed considering the effect of compaction ratio. Second, two segmentation methods are compared to better understand the effect of beam hardening and the partial volume effect. Third, the segmented images are used to analyse the consolidation mechanism of the commingled yarn fabric material. It should be kept in mind that the porosity levels in partially consolidated sample are very high. Hence, the mechanical characterization is not performed because of its low reliability.
Materials and Methods
Materials
In the current study, biaxial weft-knitted fabrics (BWKF) are consolidated to form thermoplastic composite plates. By varying the mold cavity height, composite plates with different thickness values are fabricated. BWKF is a semi-product which is composed of hybrid yarns which, in turn, are obtained by commingling polypropylene (PP) and glass fiber (GF) filaments. The yarns are arranged into a 3D architecture formed of horseshoe-shaped loops and of unidirectional (UD) reinforcement yarns (Figure 1A). The UD reinforcement yarns are arranged into four layers by alternating their alignment along the wale and course directions. Further information of the BWKF is provided in Table 1.
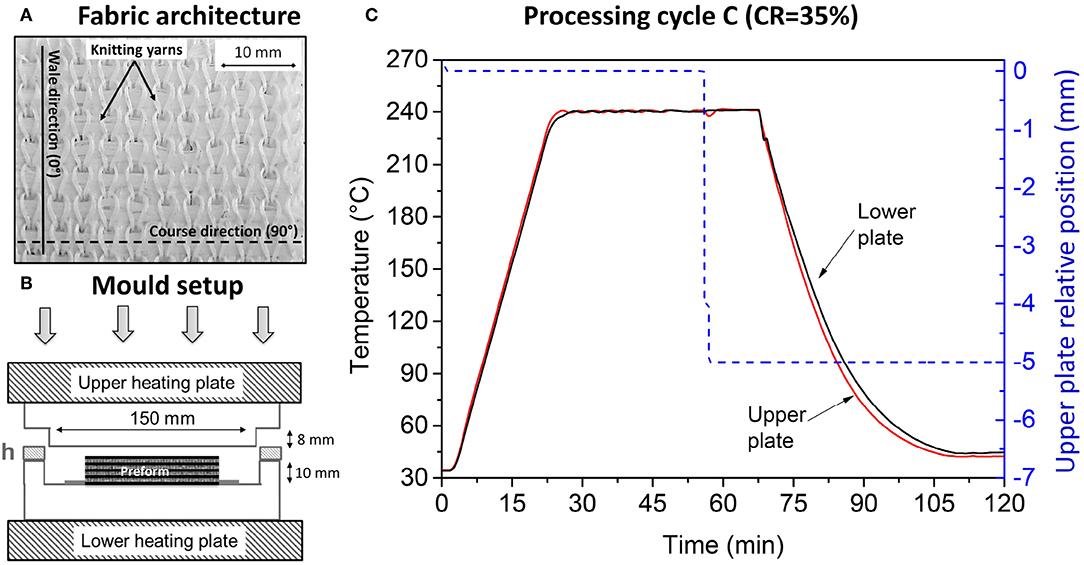
Figure 1. Biaxial weft-knitted fabric and manufacturing process. (A) Arrangement of yarns of the biaxial weft-knitted fabric (top-left). (B) Schematic of the mold set-up (bottom-left). (C) Temperature and mold plate displacement cycles during the compression molding at cycle C (CR = 35%) (right).
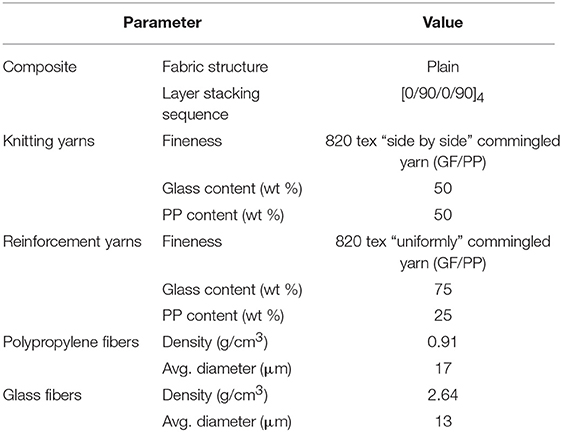
Table 1. Parameters of the biaxial weft-knitted fabric.
Staged Consolidation
The compression molding process is conducted on a 120T press (Pinette PEI, France) equipped with a mold of a single rectangular cavity of 100 × 100 × 2.1 mm3, in the POPCOM advanced composites manufacturing platform. An optimized consolidation cycle similar to the one reported in Madra et al. (2014) is adopted to consolidate a stack of four plies (with a layer stacking sequence of [0/90]s) of the BWKF. The processing sequence begins by placing the stack of fabrics inside the mold cavity (Figure 1B) and closing down the upper platen of the press to get in contact with the top surface of the preform without applying any compressive force. Then, the material is heated up to 240°C at a constant heating rate of 10°C/min. After maintaining this temperature (i.e., 240°C) for 30 min to ensure a homogeneous temperature distribution of the preform, a compression force of 60 kN is applied to close the mold and consolidate the composite. For 15 min, the mold is maintained to be closed. Then, the temperature is decreased by the air circulation in the cooling circuit of the press while maintaining the compression force. The composite plate is taken from the mold once the temperature reaches 40°C (Figure 1C). The staged consolidation procedure consists of using the same sequence and processing parameters of the optimized cycle to form partially consolidated plates by applying different compaction ratios (CR) which is defined by the following equation.
where th0 is the initial thickness of the fabrics stack and th is the final thickness of the consolidated plate.
For this purpose, polished metallic spacers are used to control the final mold cavity height. A total of four processing cycles are considered (Table 2).
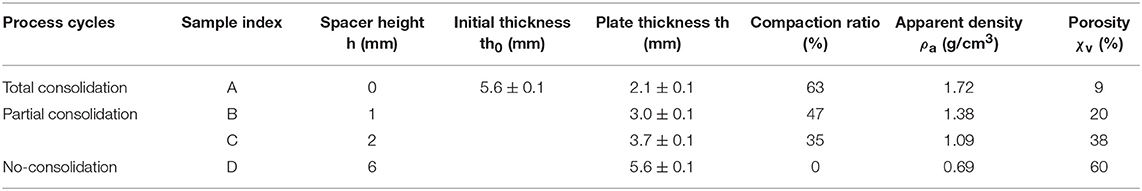
Table 2. Compaction ratios and porosity volume fraction of the thermoplastic composite plates manufactured by different process cycles.
Absorption-Based μCT Scans
To perform μCT scans, representative samples of almost 10 × 10 × th (mm3) dimensions are cut off at the center of the consolidated plates using a diamond saw and water lubrication to avoid over-heating of the thermoplastic matrix. The exact dimensions of the samples after the cutting operation are provided in Table 3. The dimensions in XY plane were defined to include at least two or three adjacent horseshoe-shaped knitting loops in each direction. The fiber and matrix weight fractions of the cut specimen were calculated using a burn-off test according to ASTM D 2584. The specimens were inserted into a furnace in an inert environment for 4 h at 450°C. The fiber mass fraction was then calculated based on the specimen weights before and after burn-off test. Average void contents from at least three adjacent specimens were calculated according to Equation (2):
where, ρa is the apparent density which is measured using Archimedes principle according to ASTM D 792 and ρt is the theoretical density of the composite, which is evaluated by Equation (3) using the densities (ρFand ρM) and the mass fractions of fiber and matrix (wt%M and wt%F):
The characterization results from density measurements and burn-off tests are provided in Tables 2, 3, respectively.
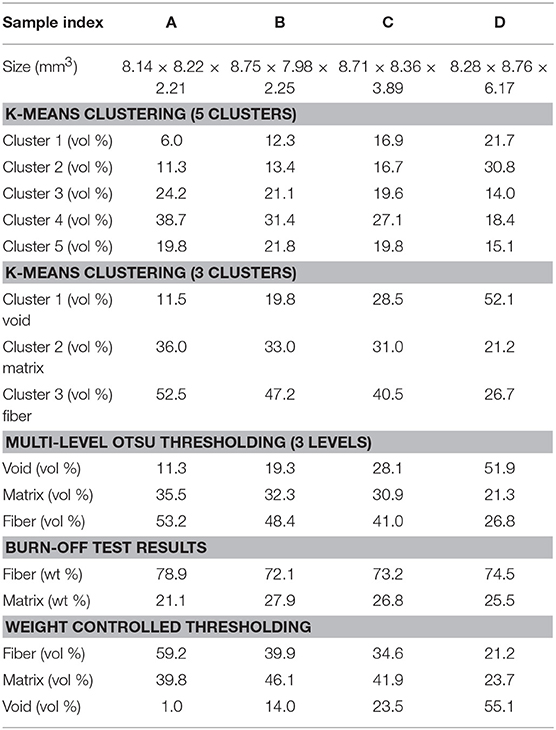
Table 3. Volume fractions of the segmented μCT images according to the K-means clustering and to the weight-controlled-methods.
Absorption-based μCT scans are conducted using a CT system (UltraTom, RX-Solutions, France) equipped with a flat-panel-detector of 1,920 × 1,536 pixels (Varian, USA). The imaging protocol consists of mounting a sample on a cylindrical holder located, by a controllable distance, between the aligned detector and the punctual source X-ray photons (Figure 2). Particular attention is paid to the orientation of the samples within the manufactured plates. This distance is adjusted to expose the entire volume of the sample to a conical beam emerging from the source of X-rays. A voxel size of 10 μm is chosen using an acceleration voltage of 80 kV, a current of 115 μA and a beam power of 9.2 W. The same voxel size is used to analyse all the composite samples with respect to two considerations. The first consideration is to achieve a highest possible resolution to detect individual glass fibers (13 μm of diameter). The second consideration is to analyse the complete volume of each sample. Given that the achievable image resolution is inversely proportional to the diameter of a scanned volume (Schell et al., 2006), the lowest voxel size which satisfies both considerations was 10 μm. During each scan, the sample holder is animated at an angular increment of 0.25° to collect a single radiograph from average six X-ray projections. In total, 1,440 radiographs are obtained by describing a complete rotation (360°) at a cumulated duration of 17 min. During all the conducted acquisitions, no metallic filter was mounted on the X-Ray tube to reduce the beam hardening artifact.
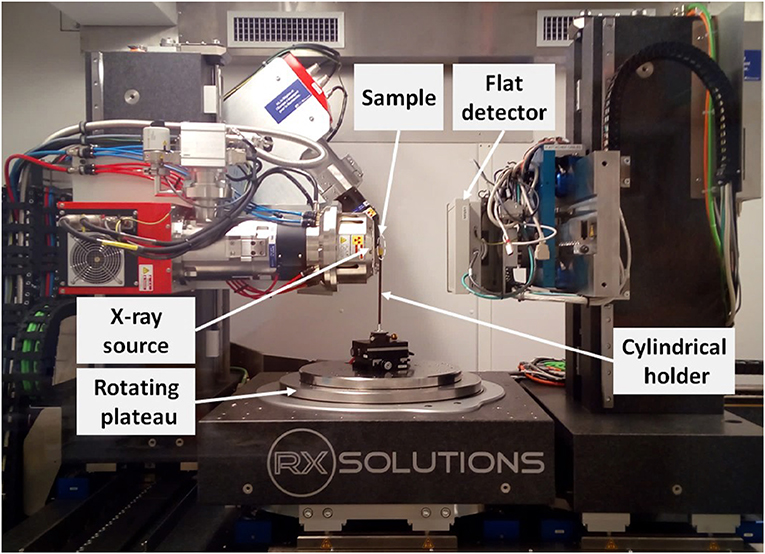
Figure 2. Photo of the computed tomography system of the ISIS4D Platform.
Reconstruction of μCT Images
X-Act software (RX-Solutions, France) is used to reconstruct a 3D digital clone for each scanned sample from the collected radiographs by applying the filtered back-projection method (Zhuang et al., 2004). 3D images are then reoriented in the Cartesian coordinate of the manufactured composite plates and then cropped by defining the narrowest region of space delimiting the analyzed sample from surrounding air (Figures 3A–D). The exact dimensions of the scanned composite samples are provided in Table 3. The output data is stored as a sequence of 2D images coded in 16-bit (i.e., gray levels range between 0 and 65,535). To make direct comparisons between reconstructed images possible, operations, such as smoothing, filtering and histogram normalization are avoided. The data set includes four 3D images and constitutes the basis of all the following qualitative and quantitative results. Avizo Fire software (Thermo Fisher Scientific, USA), Matlab (MathWorks, France), and the open-source software ImageJ (NIH, USA) are used to segment and visualize μCT images. All image post-processing operations are conducted on a workstation (HP Z840) equipped with 192 GB of RAM.
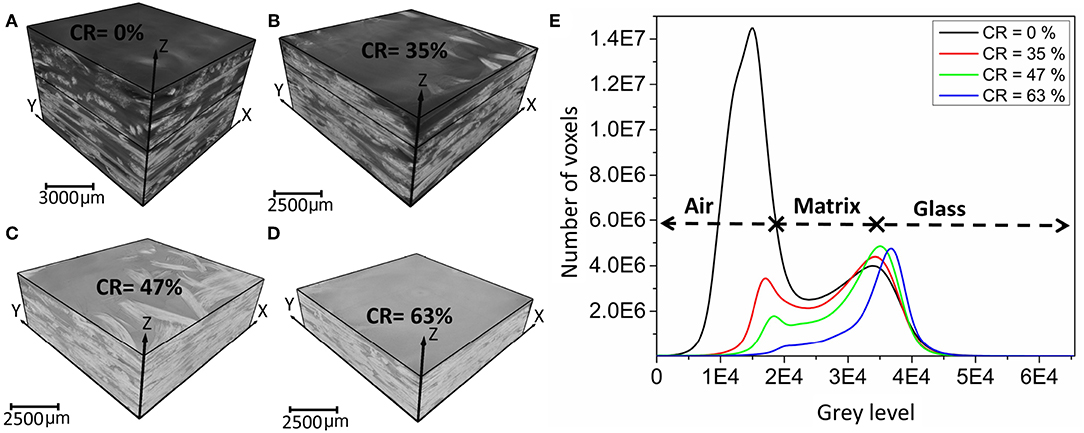
Figure 3. (A–D) μCT images for all the compaction ratios. (E) Corresponding histograms of gray levels.
Qualitative Analysis of Gray Levels in μCT Images
The histograms of the reconstructed 3D images indicate the co-existence of at least three classes of voxels (Figure 3E). The first class which represents glass fibers, is identified by a bell-shape distribution at the highest gray levels. The second class is indicated by the decreased number of voxels at low gray levels following the increase of the compaction ratio. It corresponds to air within the non-filled zones within the composite, because air is considered as void in this study. The third class is the voxels of intermediate gray levels between the two major peaks. These intermediate gray levels may correspond to a mixture of voxels located within spatial domains of PP matrix or include more than one phase due to the partial volume effect. In fact, the considered voxel size of 10 μm is relatively coarse to detect microstructural arrangements at lower length scales. Consequently, a single voxel may induce the linear attenuation from a region including more than one phase (Schell et al., 2007). Due to the absence of a clear distinction among the three classes in the non-bimodal histograms, it is difficult to perform any quantitative measurement based on gray levels thresholding techniques, such as IsoData, Maximum of Entropy, Otsu (Sezgin and Sankur, 2004).
By considering a few representative raw μCT slices (Figure 4), it can be seen that beam hardening flaw which can be verified by the contrast of the gray levels in the porous zones (for example in zone “i” in Figure 4A), is the most significant for the non-consolidated sample (CR = 0%) and decreases as the fiber bed is more and more compacted. Moreover, the partially consolidated samples do not exhibit any difference between impregnated and dry zones in the cross sections of the reinforcement yarns. To clearly show the effect of staged consolidation on the obtained gray levels, the profiles along the dashed lines (from right to left) in Figure 4 are presented in Figure 5. All the profiles show significant transitions between maximum peaks (higher than 3.5 × 10⁴) of glass fiber and low gray levels (around 2 × 10⁴). Nevertheless, the transitions between void and matrix are relatively limited and range between 1.5 × 10⁴ (CR = 0%) and 2 × 10⁴ (CR = 63%).
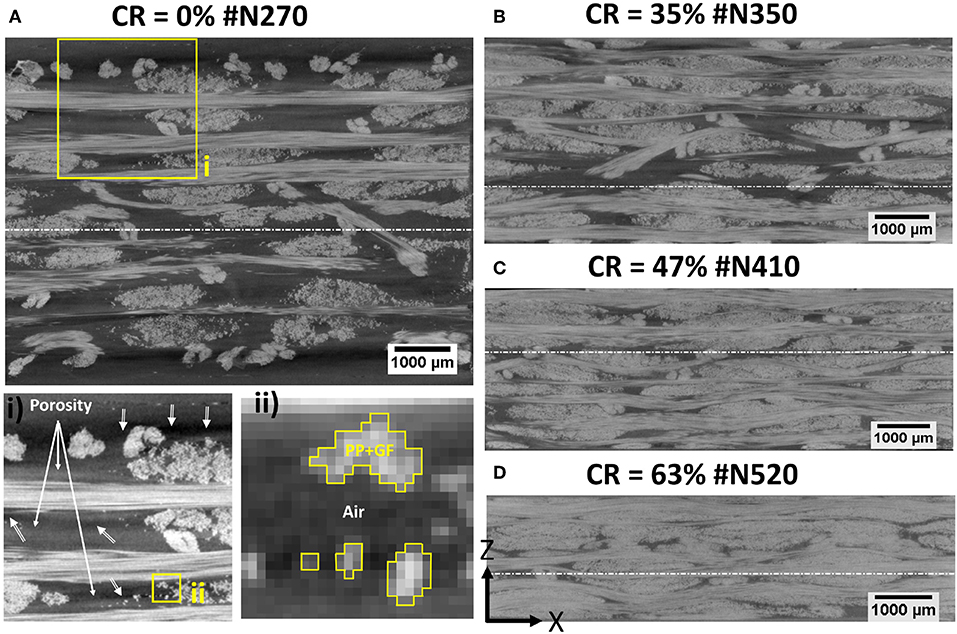
Figure 4. (A–D) Representative 2D slices from four different samples. Z direction corresponds to the thickness of the manufactured plates and arrows indicate the direction of compression inside the mold in partially consolidated samples. Subdomain (i) illustrates beam hardening artifact in porosity domains. Subdomain (ii) shows the variation of pixel gray levels representing glass fibers due to partial volume effect.
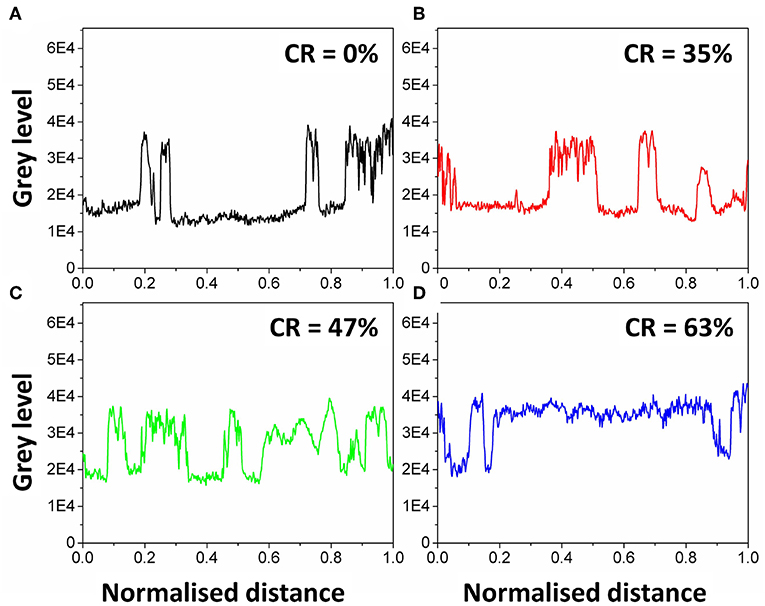
Figure 5. Gray levels variation along the dashed lines indicated respectively in Figures 4A–D. (A–D) Correspond respectively to the compaction ratios of 0; 35; 47 and 63%.
Quality Measurement of the 3D μCT Images
From the set of reconstructed μCT images, background voxels (which theoretically represent air in non-filled spaces within the composite formed of commingled yarns) do not have uniform gray levels according to the imposed compaction ratio (Figure 4). An automatic gray-level clustering technique based on K-means algorithm was adopted using Matlab's built-in functions. The clustering algorithm included three main steps: (i) initialization of the centroids of a pre-defined number (k) of clusters, (ii) identification of the similarity of each voxel to the initial centroids based on the squared Euclidean distance as a distance metric (Singh et al., 2013), and (iii) updating the gray levels of the k centroids based on the newly formed clusters. The algorithm consists of iteratively repeating steps (ii) and (iii) to minimize the intra-cluster variance. More details about this method can be found in the literature (Gonsalves et al., 2015; Chauhan et al., 2016).
In this study, two computations are conducted on the set of 3D μCT images. The number of clusters is set as three during the first series of computations (designated by K-means-3c) by assuming that a voxel can only provide information from the attenuation of X-rays by void, matrix or glass fibers. For the second series of computations (designated by K-means-5c) this number is increased to five assuming a higher influence of the partial volume effect. In the literature, the k-means clustering method is known to provide local optima and to depend on gray levels attributed to the centroids at the initialization step. In the current study, two verification procedures were considered to check the convergence of the k-means clustering algorithm. The first verification procedure relied on conducting the k-mean clustering procedure for five times using different centroids at the initialization step. In this context, the initial centroids were defined by using a random 2D slice from the μCT data and a random seeding technique built in Matlab (Arthur and Vassilvitskii, 2007). The second verification procedure consisted of using the multilevel Otsu thresholding (MLT) as an equivalent global image segmentation technique which relies also on an intra-cluster variance minimization criterion (Liu and Yu, 2009; Singh et al., 2013). Nevertheless, unlike the k-means clustering technique, the MLT requires the computation of the histogram of gray levels of the 3D μCT image to be segmented and it provides (k-1) thresholds (or cut-off gray levels) as output. This global histogram-based segmentation method was only conducted to obtain two gray level thresholds to distinguish between void/matrix and matrix/fibers. To compare both segmentation techniques, the thresholds of gray levels were computed as the average of consecutive optima identified by the k-means clustering technique. The results of all the thresholds of gray levels are presented in Figures 6A–D and the corresponding volume contents of the different clusters are provided in Table 3. The results in Table 3 obtained from both the local and global segmentation methods (with consideration of three clusters of voxels) indicate that the variation between volume contents of all three phases (void, matrix and fiber) does not exceed 3%.
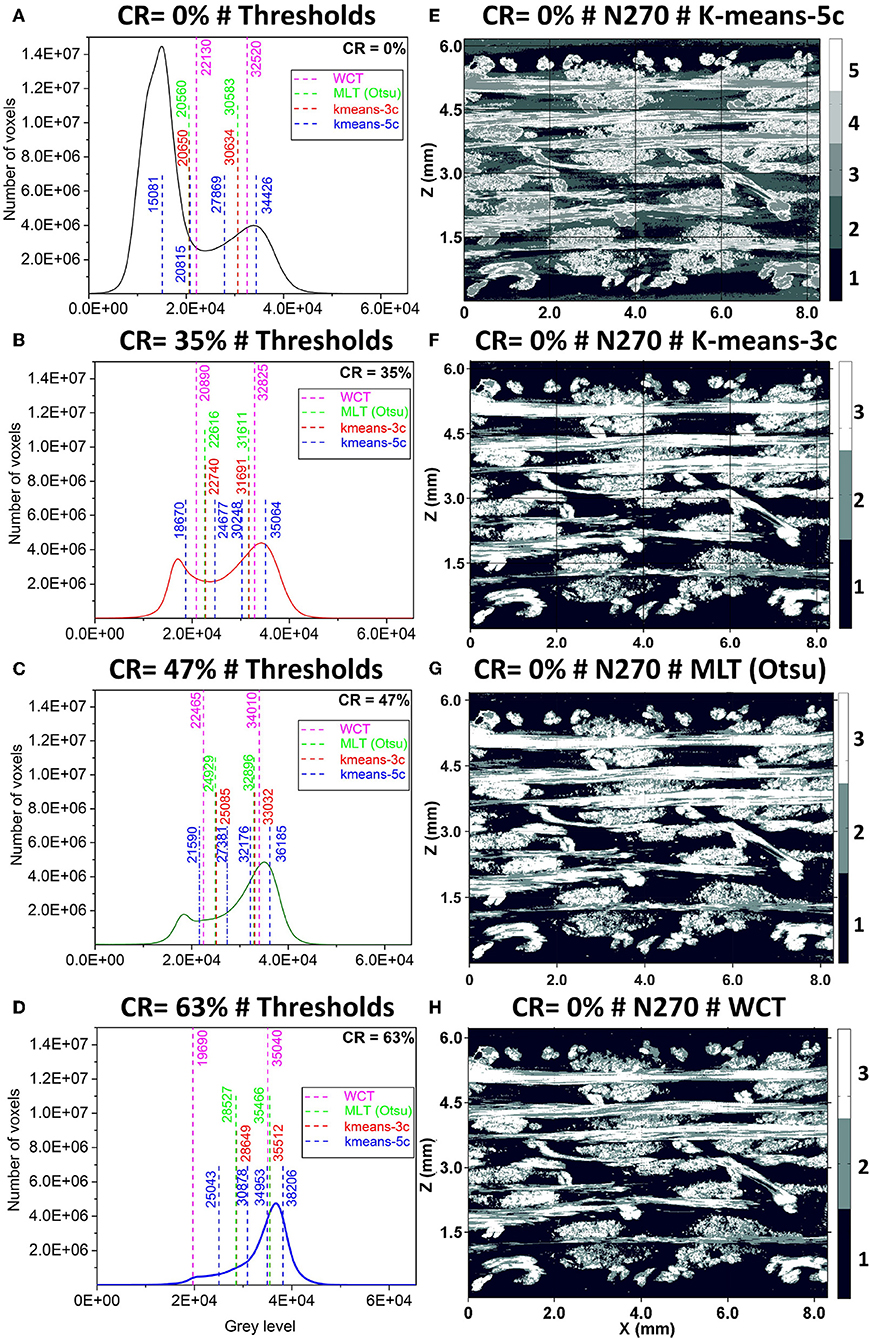
Figure 6. (A–D) Gray level histogram of the segmented 3D μCT images with the thresholds evaluated according to the WCT, k-means-3c, k-means-5c, and MLT methods. (E–H) Segmentation out-put of the same 2D slice from the non-consolidated sample (CR = 0%) according to the four methods. Numbers correspond to the obtained clusters sorted in an increasing order of gray levels.
Figure 6 shows the segmentation output obtained by the local and global segmentation methods based on the intra-cluster variance minimization criterion. The difference in the background voxels which correspond to cluster number 1 in Figure 6F (segmented using K-means-3c) is composed of two clusters of voxels in Figure 6E (segmented using K-means-5c). Such a difference provides the quantitative information about the beam hardening effect which mostly affects low gray levels representing voids. The volume fraction of beam hardening affected voxels (cluster number 2 of μCT 3D images segmented using K-means-5c) presents a gradual drop from 30.8; 16.7; 13.4 to 11.3% (Table 3). On the other hand, the K-means-3c method provides three clusters of voxels representative of the three phases of the polymer composite (glass fibers, matrix and void).
Nevertheless, as the image clustering method is sensitive to the low-contrast in μCT images, objective indicators about the image quality are required and the results should be compared with those by a more physically controlled segmentation method. Kraemer et al. and Yu et al., reported the use of signal-to-noise and contrast to evaluate the quality of μCT images (Kraemer et al., 2015; Yu et al., 2016). Contrast in absorption-based μCT scans can be quantified as expressed by Equation (4).
where mvoid is the mean gray level of background voxels which corresponds to void and mcomposite is the mean gray level of the complementary population of voxels within the reconstructed μCT image.
Signal-to-Noise Ratio (SNR) is defined as the ratio of the mean gray level (m) of a considered volume of interest (containing preferably void, matrix and fiber voxels) to the noise of gray levels which corresponds to the standard deviation (σvoid). Thus, the SNR can be expressed by Equation (5).
The evaluation of both quality descriptors is based on the output of the K-means-3c method. Despite using the same μCT acquisition parameters, the increase of the CR caused a decrease of contrast from 0.51 to 0.33 and an increase of the SNR from 2.6 to 7.1 (Figure 7). Both trends indicate that the consolidation of the same fabric (which couples densification of the fiber bed and impregnation of the fibers) requires the development of a calibration procedure of the energy of the X-ray source to obtain similar image qualities.
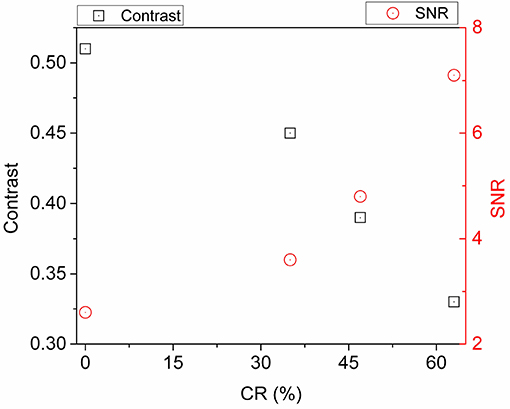
Figure 7. Variation of image quality indicator according to the compaction ratio of scanned samples.
Weight-Controlled Thresholding Method
Based on the previously observed sharp transition in profiles of gray levels (Figure 5) and the localization of beam hardening effect in unfilled area within the composite, a weight-controlled thresholding (WCT) method is suggested. The procedure consists of measuring the mass of the organic and non-organic constituents of the scanned samples using the results of burn-out tests in Table 3. First, the mass of the non-organic residue (i.e., glass fibers) is measured. Then, it is used as a target criterion of an iterative and decreasing sweep of gray levels from 65,535 to 0. For each step, the total mass corresponding to the voxels of gray levels which are higher than the considered threshold is calculated based on the known density of glass fibers (Table 1). The same procedure is then applied to define the threshold of the PP matrix based on the mass of the burned organic matrix. By using the scanned composite sample and its exact μCT 3D image, the thresholds of fiber and matrix gray levels are identified. The WCT method consists in using these identified thresholds to segment fiber and matrix voxels in any sub-domain extracted from the same μCT data. As can be noticed from Table 3, the obtained matrix mass fractions at CR of 47 and 35% are higher than the corresponding value in the case of the non-consolidated sample (27.9 and 26.8 > 25.5). Such variation can be related to the poor control of the size of the used μCT samples according to the cutting technique. The lowest matrix content is obtained from the totally consolidated sample (CR = 63%) which can be explained by an expulsion of thermoplastic matrix. Because the WCT method is also based on the global histogram of the reconstructed 3D images, it can be sensitive to the increase of the noise-to-contrast ratio. Thus, relative errors which may result from an inaccurate evaluation of both thresholds of glass fibers and of PP are calculated as indicated by Equation (6).
where Voli is the volume fraction of residual void for the modified couple gray level thresholds of glass fibers and PP. Vol0 is the volume fraction of residual void obtained by the WCT method. Figure 8 shows that relative errors are below 10% with a variation of ±0.5% around the identified glass fibers and PP thresholds from the 16-bit coded μCT images. With the increase of the CR, an inaccurate choice of the threshold for glass fibers clearly induces greater errors than the gray values threshold for PP. Such variation is mostly related to the partial volume effect (zone “ii” in Figure 4A) and the more significant wetting of fibers by the matrix. As a matter of fact, partial volume effect takes place when the gray level of a single voxel encodes the information from more than one single material. An increase of the CR induces higher packing of the fiber bed and better impregnation of the fibers. Given the voxel size of 10 μm, the same elementary volume elements encode potentially more than a single phase in the most compacted composite samples.
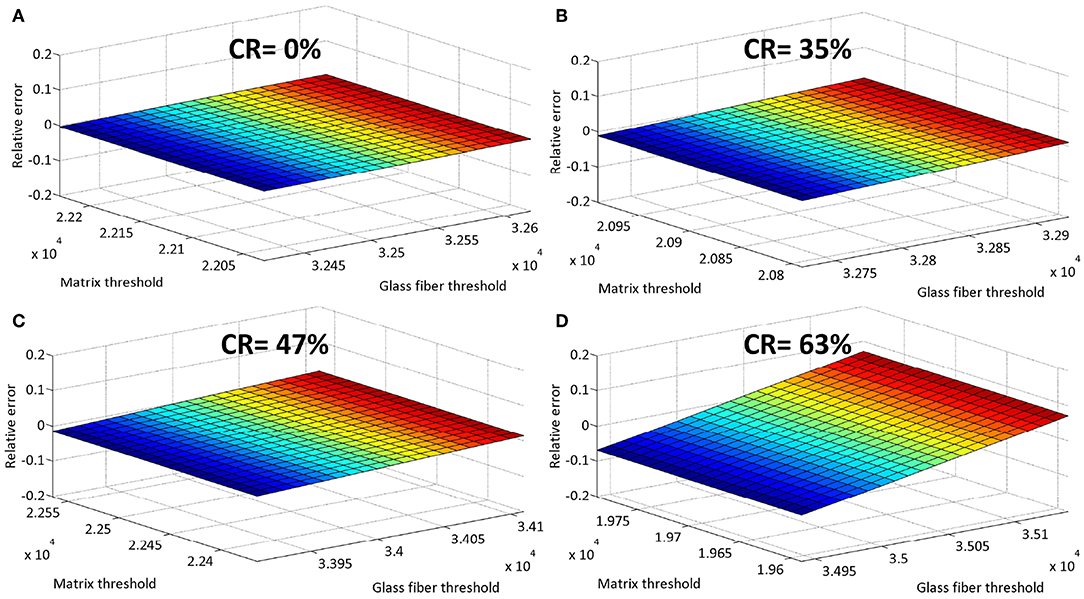
Figure 8. Relative error distributions due to the imposed changes of gray level threshold for glass fibers and PP matrix. (A–D) Correspond respectively to the compaction ratios of 0; 35; 47 and 63%.
Results and Discussion
Comparison Between K-Means-3c and WCT Segmentation Methods
The evolution of volume contents of void, matrix and fibers obtained from μCT images after segmentation operations according to the K-means-3c and the WCT methods exhibits similar trends (Table 3). At a CR of 0%, the void contents are 52.1 and 55.1% for the K-means-3c and the WCT methods, respectively. With the increase of CR, the difference between these void contents becomes more significant. The void contents are 11.5 and 1% for the K-means-3c and the WCT methods, respectively, in the case of the totally compacted sample. According to the variation of contrast and SNR along the increase of CR (Figure 7), a contrast value which ranges between 0.45 and 0.5 (with a SNR ranging between 2.6 and 3.8) seems to guarantee comparable values for both the image segmentation methods. However, this result still requires more extensive μCT characterizations on other samples of compaction ratios lower than 35% while using the same acquisition parameters. Complementarily, according to density measurements in Table 2, the K-means-3c method seems to provide more reliable estimation of porosity contents when the partial volume effect is the most significant (at the highest compaction ratios).
As indicated in section Quality Measurement of the 3D μCT Images, the beam hardening artifact affects the low density materials, in particular air in non-filled zones (zone “I” in Figure 4A). Because of the sequential segmentation of fibers, matrix, and voids, the WCT method can be considered less sensitive to the beam hardening artifact. The comparison between both the segmentation methods also confirms that the efficiency of automatic gray-level-based clustering is decreased by partial volume effect rather than by beam hardening. For the subsequent analyses, only the segmented images obtained by the WCT method are considered.
Impregnation Mechanisms
The consolidation of commingled yarns is involved in both the mechanical deformation of the fiber bed and the polymer impregnation between the yarns and inside the yarns. For the sake of clarity, these two phenomena are analyzed in the subsequent sections.
Effect of the Staged Consolidation on Fiber Bed Deformation
Because the analysis of μCT images of the BWKF requires a priori knowledge of the arrangement of yarns, a color coding operation based on the structure tensor computation is considered (Rezakhaniha et al., 2012; Naouar et al., 2014). The computations were conducted slice by slice with consideration of a 2D Gaussian window of one pixel. The fiber orientation in the XY plane is considered to separate the reinforcement yarns aligned in the X direction (90°) and those in Y direction (0°). By this color coding operation, knitting yarns appear in a myriad of non-homogeneous colors due to their horseshoe-shape in the XY plane (Figures 9A,B). Based on the structure tensor data, the fiber area fractions along the thickness (Z direction) of each analyzed sample were quantified and presented in Figures 9C–F. Angular deviations <15° from the X and Y direction were tolerated. Qualitative analyses of μCT images in Figure 4 show that at the non-consolidated state of the BWKF, inter-yarn voids form a microscopic network of open pores resulting from the characteristic arrangement of the plies and from the overlaying sequence of preform in the thickness direction (Z direction). Given the voxel size of 10 μm, it is very difficult to draw any conclusions about intra-yarn porosity. The fiber area fractions in Figure 9C show a clear alternation between optima in X and Y directions. These optima correspond to the alternating four plies of reinforcement yarns of the used commingled yarn fabric. The increase of the CR gradually affects the fiber bed deformation and the network of macro-voids. At a CR of 35%, the compression of the fiber bed in the thickness direction (Z direction) is associated with a compaction of the cross sections of the reinforcement yarns and the width of the area fraction peaks in Figure 9D. However, the compression force is not high enough to close macroscale voids between the plies, which represent 23.5% of the volume. At a CR of 47%, the cross-sectional shape of the yarns is significantly flattened. Also, the visual inspection of reinforcement yarns which are aligned in the X direction show an increased tortuosity and intra-yarn voids are located within the plies of the fabric. From the results of the fiber area fractions, it is demonstrated the number of peaks of fibers aligned in the X direction (Figure 9E) is decreased compared with the non-consolidated sample (Figure 9C). These observations imply the initiation of yarn nesting between the fabric layers (Djukic et al., 2013; Doitrand et al., 2015). At the highest CR (63%) the reinforcement yarns are more flattened and the residual voids between the yarns are located in the vicinity of the knitting bundles.
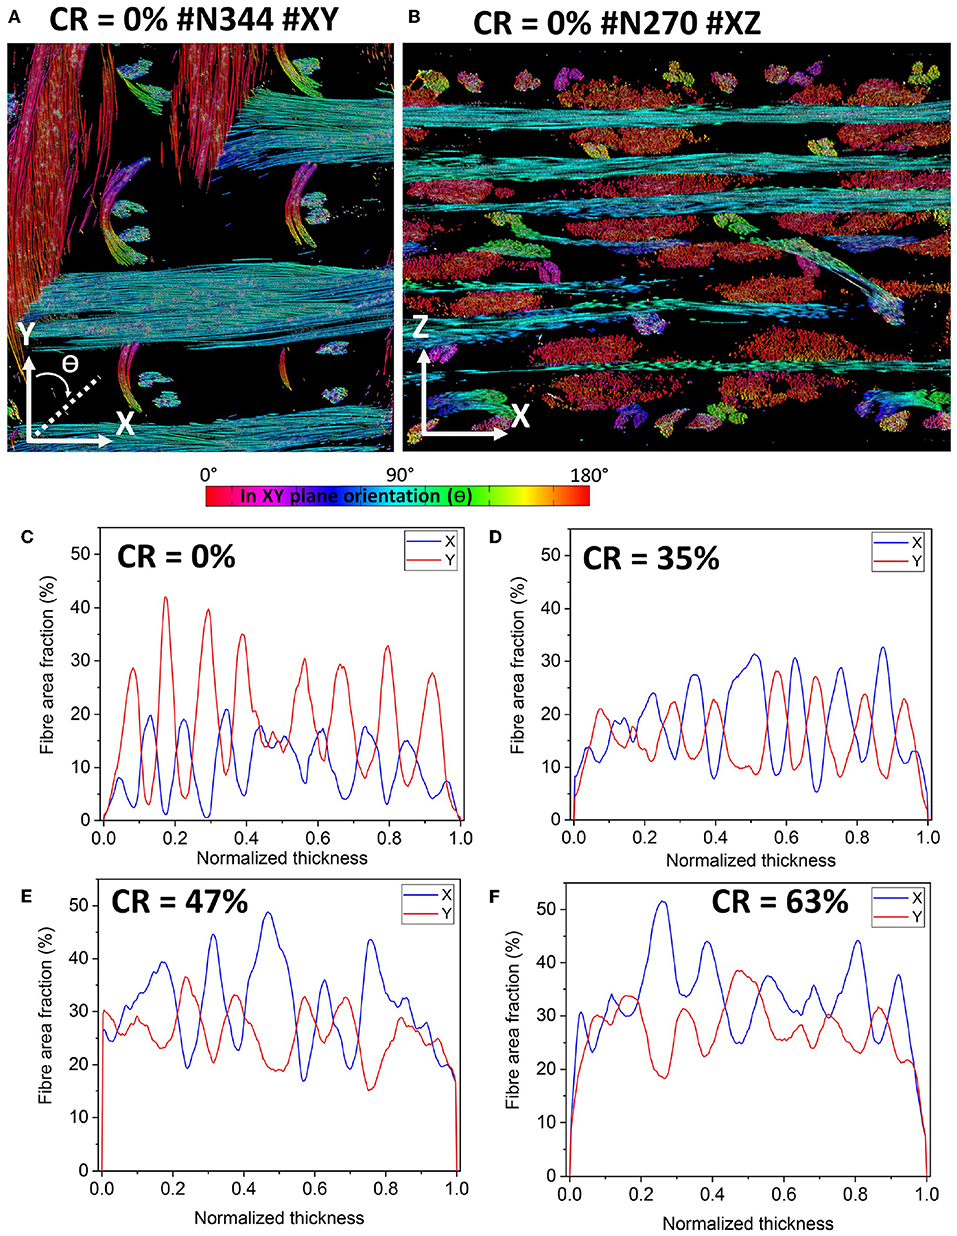
Figure 9. (A,B) Color coded glass fiber orientations from μCT 3D images which were segmented using the WCT method. (C–F) Fiber area fraction distributions along the Z direction with glass filaments aligned in the X and Y directions.
Effect of the Staged Consolidation on Matrix Localization
Given the proportionality between gray levels and X-ray attenuation coefficients, the shift of the gray levels from low to medium and to high range values encodes the information about the localization of each voxel. In fact, the matrix voxels of high gray level range are in the vicinity of glass fibers viz. at the interface and imply good impregnation. Conversely, a matrix voxel of lower gray level range represents a localization of neat matrix far from glass fibers viz. outside the yarns. In line with this speculation, only the gray levels of voxels representing the matrix are kept unchanged in the segmented 3D images (Figure 10). Due to partial volume effect, voxels encoding impregnated and/or dry glass fibers are coded as fiber voxels. The localization of the matrix is inspected at the macro- and meso-scales and results are confronted to representative optical microscopy based observations (Figure 10). Macro-scale qualitative analyses indicate a non-homogeneous distribution of the matrix through the thickness of the samples. The impregnation of yarns depends on their contact with neighboring yarns and on the commingling method which is different between the reinforcement and knitting yarns. In fact, in the non-consolidated sample (Figure 10A), the polymer melt is likely to impregnate the non-packed isolated filaments of glass fibers. Due to the absence of any external load applied to the fiber bed, the impregnation of fibers is supposed to be related to the initial distribution of PP filaments. By using black ink to dye the partially impregnated yarns, the optical micrographs of the same plate show that the ink easily infiltrates non-packed clusters of dry glass fibers and non-contact zones between neighboring yarns (Figure 10B). With the increase of the CR (CR = 35 and 47%) the compression of the fiber bed enhances the penetration of the matrix in the yarns with a relatively low packing of glass fibers (Figures 10C–F). The presence of macro-voids confirms that the matrix does not fill the macroscopic channels between the yarns (Figure 10E). At the highest compaction level (CR = 63%), the matrix is squeezed out from the fiber bed and is more agglomerated in some pockets between crossing over yarns (Figure 10G). The optical micrograph in Figure 10H shows that the squeeze out of the matrix from a yarn results in a partially impregnated center of packed glass filaments behind the matrix front. With consideration of the partial volume effect in conventional absorption-based μCT analyses, the large gray spots defined according to the color coding seem to represent the zones of poor impregnation of glass fibers with relatively low concentration of matrix.
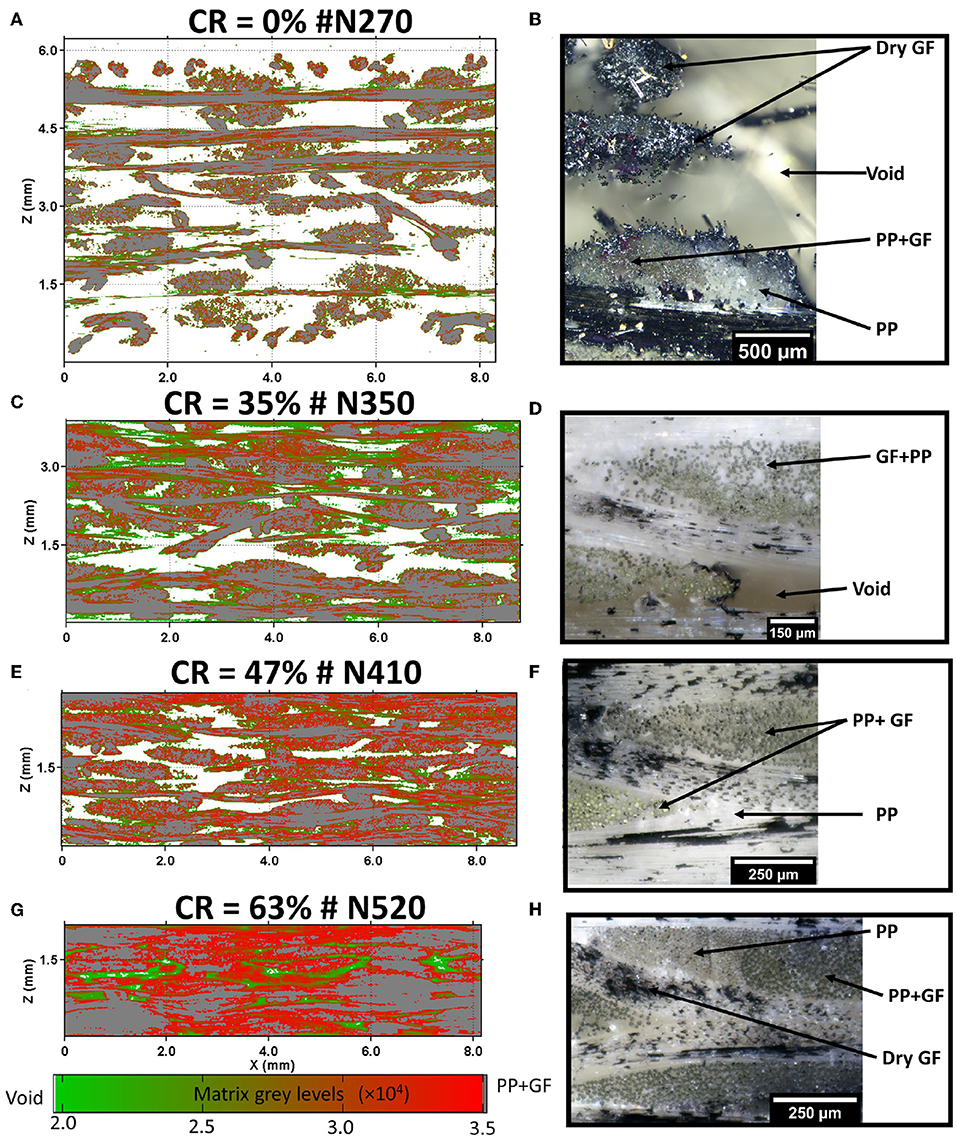
Figure 10. (A,C,E,G) Color coded matrix voxels from μCT 3D images which were segmented using the WCT method using the same scale bar. (B,D,F,H) Optical microscopy observations in the XZ plane of the composites samples.
A local analysis is conducted to provide more insight about the impregnation mechanisms at the yarns scale. Qualitative analyses show a difference between knitting and reinforcement yarns and a dependence on the contact or non-contact with adjacent yarns. Without application of a compaction pressure on the heated preform, the melted PP filaments form matrix pools and coalesce inside and outside the yarn by surrounding the clusters of glass filaments. Tubular pores parallel to glass fibers are formed inside the yarns by bridging the matrix pools at the interface of adjacent clusters of glass filaments (Figure 11). However, the infiltration of PP in the yarn cross-section is more significant far from the contact area. At a CR of 35%, glass fibers are impregnated especially in the regions adjacent to macro- and meso-scopic voids. The deformation of yarn cross-sections can be observed and the local deviation of glass fibers at the external layer of the yarns is detected. The compression pressure in the contact zone between crossing-over yarns is high enough to decrease the yarn permeability which makes the impregnation difficult. At a CR of 47%, the polymer is squeezed out from the core of yarns due to the high compaction of the filaments of glass fibers. The core becomes a potential dry zone and the PP matrix is more localized along the confined edges of the yarns. This implies that the flow is more significant along the main direction of the reinforcement yarns. At a high compaction ratio (CR = 63%), the macroscopic pockets of matrix agglomerate around the contact areas formed after yarn nesting. The matrix also agglomerates in confined spaces delimited by contact surfaces between the reinforcement yarns (oriented at 0 and 90° in the XY plane) and inside the flattened horseshoe-shaped knitting loops. Meanwhile, the matrix infiltrates mainly between glass fibers in the vicinity of these matrix pockets. In the case of the knitting yarns, the mesoscale observations in Figure 12 indicate a significant out-of-plane deformation of those yarns with poor impregnation of the side zones of glass fiber yarn. It is also noticeable that the horseshoe-shaped loops are potential sites for macroscale void formation.
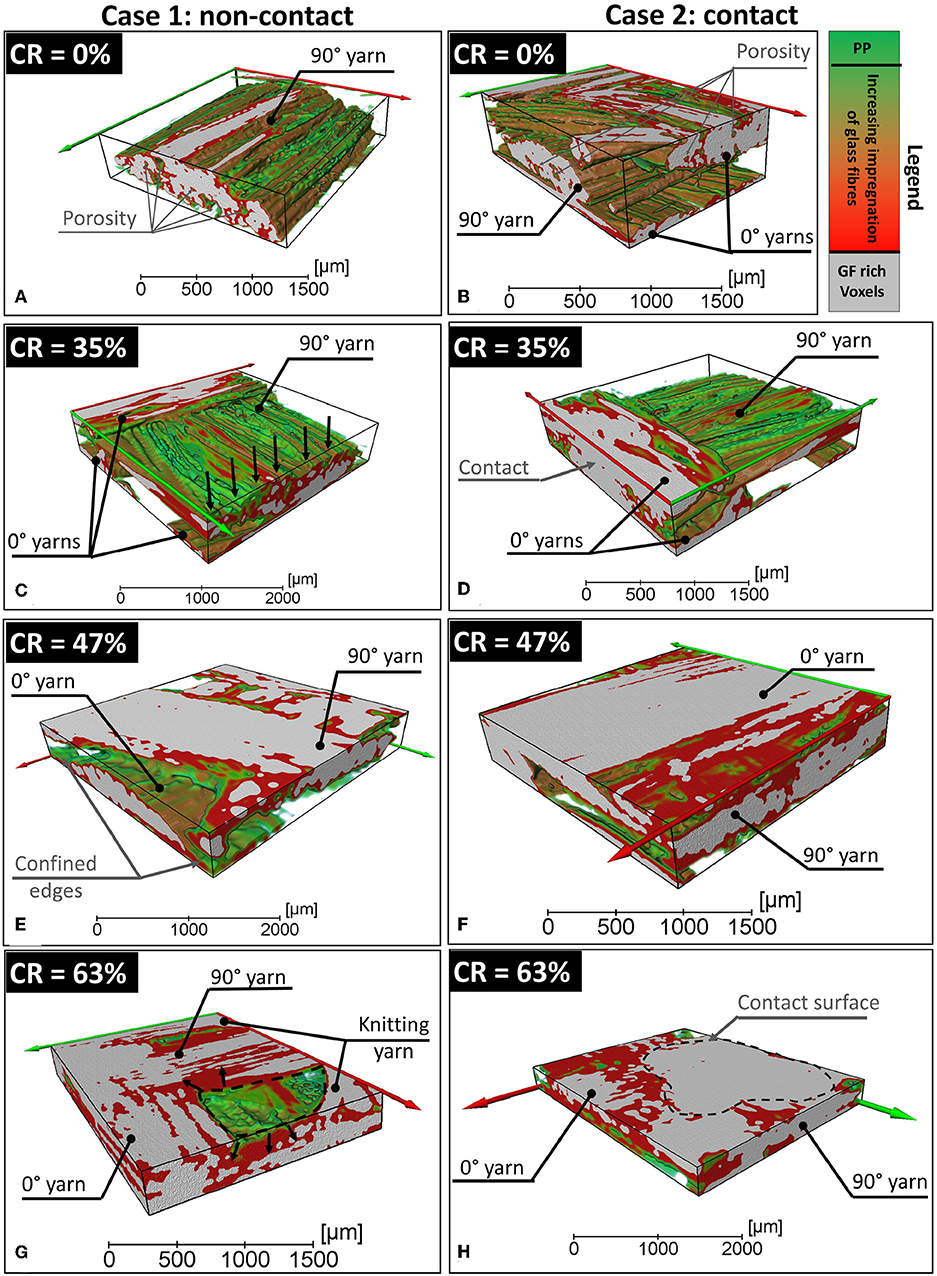
Figure 11. Impregnation degree of reinforcement yarns in the case of non-contact (A,C,E,G) and contact (B,D,F,H).
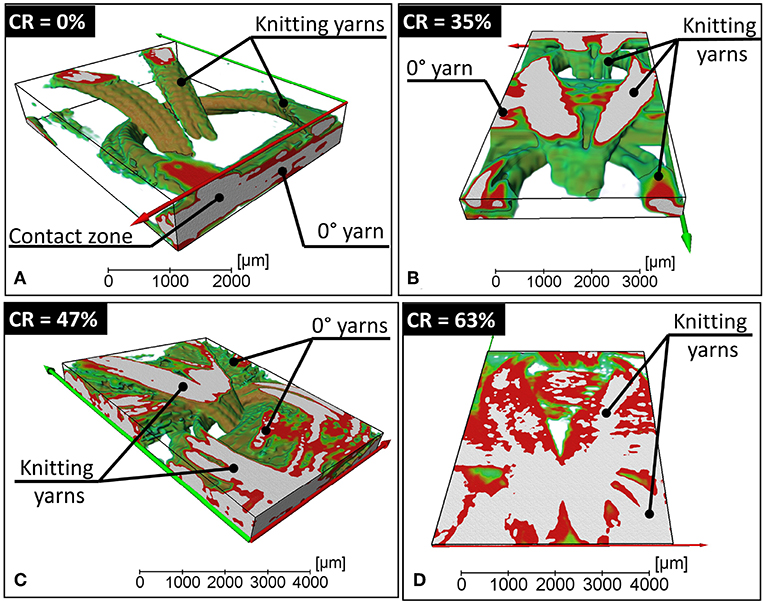
Figure 12. Impregnation degree of knitting yarns. (A–D) Correspond respectively to the compaction ratios of 0; 35; 47 and 63%.
Conclusions
In the current study, the combination of staged consolidation and laboratory μCT scans was proved to be as a promising method to analyse the consolidation mechanisms for biaxial weft-knitted fabrics made of commingled glass/thermoplastic yarns. The results of the K-means and weight controlled thresholding methods indicated that the use of automatic algorithms based only on gray levels requires a contrast value which ranges between 0.45 and 0.5 (with a signal-to-noise ratio ranging between 2.6 and 3.8) seems to guarantee comparable values for both image segmentation methods. Nevertheless, this result still requires more extensive μCT characterizations on other samples of compaction ratios lower than 35% for the same acquisition parameters. It was also demonstrated that partial volume effect is more critical than beam hardening of X-rays.
Based on the structure-tensor-based coding of segmented glass fiber and on the localization of the thermoplastic matrix, the impregnation mechanisms were analyzed. The qualitative analyses demonstrated a high correlation between the fiber bed compaction and the localization of the matrix as well as a difference of the impregnation mechanism between the reinforcement and knitting yarns. The knitting yarns are the most difficult to impregnate due to their high out-of-plane deformation and their initial side by side arrangement of thermoplastic and glass fiber filaments. The horseshoe-shaped loops have been identified to be potential zones for the residual intra-yarns void formation. From a processing point of view, the impregnation of glass fiber yarns by the thermoplastic is the most efficient at a compression ratio that ranges between 35 and 47% rather than at 63%. Thus, the increase of dwell time at an intermediate compaction ratio employing a low compaction speed before the final closure of the mold during consolidation may enhance the impregnation quality of a final part.
More work is needed to identify the optimal sequence of compaction to further reduce air entrapment and hence the amount of residual voids. The current study represents a first step toward developing a consolidation model for biaxial weft-knitted fabrics made of commingled thermoplastic/reinforcement fibers. Taking into consideration the physics provided by μCT scans, the coupling between the mechanical deformation of the fiber bed and the flow of the thermoplastic matrix should not be neglected.
Data Availability Statement
The datasets for this manuscript are the property of IMT Lille Douai and are not publicly available. Requests to access the datasets should be directed to the corresponding author and to Ayadi, YWJkZXJyYWhtYW5lLmF5YWRpQGltdC1saWxsZS1kb3VhaS5mcg==.
Author Contributions
AA contributed to the design of the X-ray micro-tomography based experimental work, to the image post-processing and to the interpretation of experimental data, and also contributed substantially to the drafting of the article. MD-L provided her expertise to manufacture composite specimens and contributed to draft checking. CP contributed significantly to the interpretation of the impregnation mechanism and to the drafting of the article. PK was in charge of the global project management, the POPCOM action coordination and the draft checking.
Conflict of Interest
The authors declare that the research was conducted in the absence of any commercial or financial relationships that could be construed as a potential conflict of interest.
Acknowledgments
The authors acknowledge the European Union (European Regional Development Fund FEDER), the French state and the Hauts-de-France Region council for co-funding the ELSAT 2020 by CISIT project (POPCOM action), and especially AA post-doctoral grant.
The ISIS4D X-Ray CT platform has been funded by International Campus on Safety and Intermodality in Transportation (CISIT), the Nord-Pas-de-Calais Region, the European Community, and the National Center for Scientific Research. The authors also gratefully acknowledge the support of these institutions.
The authors are also grateful to the Institute of Textile Machinery and Textile High Performance Technology (Dresden, Germany) for providing the weft-knitted fabrics.
References
Alagirusamy, R., and Ogale, V. (2004). Commingled and air jet-textured hybrid yarns for thermoplastic composites. J. Ind. Text. 33, 223–243. doi: 10.1177/1528083704044360
Arbeláez, P., Maire, M., Fowlkes, C., and Malik, J. (2011). Contour detection and hierarchical image segmentation. IEEE Trans. Pattern Anal. Mach. Intell. 33, 898–916. doi: 10.1109/TPAMI.2010.161
Arthur, D., and Vassilvitskii, S. (2007). “K-means++: the advantages of careful seeding,” in Proceedings of the Eighteenth Annual ACM-SIAM Symposium on Discrete Algorithms (New Orleans, LA), 1027–1035.
Ayadi, A., Nouri, H., Guessasma, S., and Roger, F. (2016). Large-scale x-ray microtomography analysis of fiber orientation in weld line of short glass fiber reinforced thermoplastic and related elasticity behavior. Macromol. Mater. Eng. 301, 907–921. doi: 10.1002/mame.201500463
Berg, S., Saxena, N., Shaik, M., and Pradhan, C. (2018). Generation of ground truth images to validate micro-CT image-processing pipelines. Lead. Edge 37, 412–420. doi: 10.1190/tle37060412.1
Bernet, N., Michaud, V., Bourban, P. E., and Manson, J. A. E. (1999). Impregnation model for the consolidation of thermoplastic composites made from commingled yarns. J. Compos. Mater. 33, 751–772. doi: 10.1177/002199839903300806
Böhm, R., Stiller, J., Behnisch, T., Zscheyge, M., Protz, R., Radloff, S., et al. (2015). A quantitative comparison of the capabilities of in situ computed tomography and conventional computed tomography for damage analysis of composites. Compos. Sci. Technol. 110, 62–68. doi: 10.1016/j.compscitech.2015.01.020
Borra, S., Thanki, R., and Dey, N. (2019). “Satellite image clustering,” in Springer Briefs in Applied Sciences and Technology (Singapore: Springer Singapore), 31–52.
Bull, D. J., Helfen, L., Sinclair, I., Spearing, S. M., and Baumbach, T. (2013). A comparison of multi-scale 3D X-ray tomographic inspection techniques for assessing carbon fibre composite impact damage. Compos. Sci. Technol. 75, 55–61. doi: 10.1016/j.compscitech.2012.12.006
Carmignato, S., Dewulf, W., and Leach, R. (eds.). (2018). Industrial X-ray Computed Tomography. Cham: Springer International Publishing.
Centea, T., and Hubert, P. (2011). Measuring the impregnation of an out-of-autoclave prepreg by micro-CT. Compos. Sci. Technol. 71, 593–599. doi: 10.1016/j.compscitech.2010.12.009
Chauhan, S., Rühaak, W., Anbergen, H., Kabdenov, A., Freise, M., Wille, T., et al. (2016). Phase segmentation of X-ray computer tomography rock images using machine learning techniques: an accuracy and performance study. Solid Earth 7, 1125–1139. doi: 10.5194/se-7-1125-2016
Chen, Y., Vasiukov, D., and Park, C. H. (2018). Influence of voids presence on mechanical properties of 3D textile composites. IOP Conf. Ser. Mater. Sci. Eng. 406:012006. doi: 10.1088/1757-899X/406/1/012006
Demircan, Ö., Ashibe, S., Kosui, T., and Nakai, A. (2015). Effect of various knitting techniques on mechanical properties of biaxial weft-knitted thermoplastic composites. J. Thermoplast. Compos. Mater. 28, 896–910. doi: 10.1177/0892705713519121
Djukic, L. P., Pearce, G. M., Herszberg, I., Bannister, M. K., and Mollenhauer, D. H. (2013). Contrast enhancement of microct scans to aid 3D modelling of carbon fibre fabric composites. Appl. Compos. Mater. 20, 1215–1230. doi: 10.1007/s10443-013-9326-7
Doitrand, A., Fagiano, C., Chiaruttini, V., Leroy, F. H., Mavel, A., and Hirsekorn, M. (2015). Experimental characterization and numerical modeling of damage at the mesoscopic scale of woven polymer matrix composites under quasi-static tensile loading. Compos. Sci. Technol. 119, 1–11. doi: 10.1016/j.compscitech.2015.09.015
Duchene, P., Chaki, S., Ayadi, A., and Krawczak, P. (2018). A review of non-destructive techniques used for mechanical damage assessment in polymer composites. J. Mater. Sci. 53, 7915–7938. doi: 10.1007/s10853-018-2045-6
Ferré Sentis, D., Orgéas, L., Dumont, P. J. J., Rolland du Roscoat, S., Sager, M., and Latil, P. (2017). 3D in situ observations of the compressibility and pore transport in sheet moulding compounds during the early stages of compression moulding. Compos. A Appl. Sci. Manuf. 92, 51–61. doi: 10.1016/j.compositesa.2016.10.031
Garcea, S. C., Wang, Y., and Withers, P. J. (2018). X-ray computed tomography of polymer composites. Compos. Sci. Technol. 156, 305–319. doi: 10.1016/j.compscitech.2017.10.023
Gonsalves, A., Machado, R., Michael, G., and Yadav, O. (2015). Comparative evaluation of thresholding and segmentation algorithms. Int. J. Comput. Sci. Inf. Technol. 6, 1107–1110. doi: 10.1109/ICISET.2018.8745612
Hanna, R. D., and Ketcham, R. A. (2017). X-ray computed tomography of planetary materials: a primer and review of recent studies. Chem. Erde Geochem. 77, 547–572. doi: 10.1016/j.chemer.2017.01.006
Jespersen, K. M., Glud, J. A., Zangenberg, J., Hosoi, A., Kawada, H., and Mikkelsen, L. P. (2018). Ex-situ X-ray computed tomography, tension clamp and in-situ transilluminated white light imaging data of non-crimp fabric based fibre composite under fatigue loading. Data Brief 21, 228–233. doi: 10.1016/j.dib.2018.09.109
Ketcham, R. A., and Carlson, W. D. (2001). Acquisition, optimization and interpretation of X-ray computed tomographic imagery: applications to the geosciences. Comput. Geosci. 27, 381–400. doi: 10.1016/S0098-3004(00)00116-3
Kierklo, A., Tabor, Z., Petryniak, R., Dohnalik, M., and Jaworska, M. (2014). Application of microcomputed tomography for quantitative analysis of dental root canal obturations. Postepy Hig. Med. Dosw. 68, 310–315. doi: 10.5604/17322693.1095271
Kim, S. H., and Park, C. H. (2017). Direct impregnation of thermoplastic melt into flax textile reinforcement for semi-structural composite parts. Ind. Crops Prod. 95, 651–663. doi: 10.1016/j.indcrop.2016.11.034
Kraemer, A., Kovacheva, E., and Lanza, G. (2015). “Projection based evaluation of CT image quality in dimensional metrology,” in International Symposium on Digital Industrial Radiology and Computed Tomography (DIR 2015). (Ghent).
Larson, N. M., and Zok, F. W. (2018). Insights from in-situ X-ray computed tomography during axial impregnation of unidirectional fiber beds. Compos. A Appl. Sci. Manuf. 107, 124–134. doi: 10.1016/j.compositesa.2017.12.024
Latil, P., Orgéas, L., Geindreau, C., Dumont, P. J. J., and Rolland du Roscoat, S. (2011). Towards the 3D in situ characterisation of deformation micro-mechanisms within a compressed bundle of fibres. Compos. Sci. Technol. 71, 480–488. doi: 10.1016/j.compscitech.2010.12.023
Léonard, F., Stein, J., Soutis, C., and Withers, P. J. (2017). The quantification of impact damage distribution in composite laminates by analysis of X-ray computed tomograms. Compos. Sci. Technol. 152, 139–148. doi: 10.1016/j.compscitech.2017.08.034
Li, X. K., and Bai, S. L. (2009). Sheet forming of the multi-layered biaxial weft knitted fabric reinforcement. Part I: on hemispherical surfaces. Compos. A Appl. Sci. Manuf. 40, 766–777. doi: 10.1016/j.compositesa.2009.03.007
Lionetto, F., Dell'Anna, R., Montagna, F., and Maffezzoli, A. (2015). Ultrasonic assisted consolidation of commingled thermoplastic/glass fiber rovings. Front. Mater. 2:32. doi: 10.3389/fmats.2015.00032
Liu, D., Ding, J., Fan, X., Lin, X., and Zhu, Y. (2014). Non-isothermal forming of glass fiber/polypropylene commingled yarn fabric composites. Mater. Des. 57, 608–615. doi: 10.1016/j.matdes.2014.01.027
Liu, D., and Yu, J. (2009). “Otsu method and K-means,” in 2009 Ninth International Conference on Hybrid Intelligent Systems (Shenyang), 344–349.
Liu, Y., Straumit, I., Vasiukov, D., Lomov, S. V., and Panier, S. (2017a). Prediction of linear and non-linear behavior of 3D woven composite using mesoscopic voxel models reconstructed from X-ray micro-tomography. Compos. Struct. 179, 568–579. doi: 10.1016/j.compstruct.2017.07.066
Liu, Y., Vasiukov, D., and Panier, S. (2017b). “A numerical approach to reconstruct mesoscopic yarn section of textile composites based upon X-ray,” in CFM2017: 23ème Congrès Fr. Mécanique, 2017 Aug 28–Sept 1 (Lille).
Long, A. C., Wilks, C. E., and Rudd, C. D. (2001). Experimental characterisation of the consolidation of a commingled glass/polypropylene composite. Compos. Sci. Technol. 61, 1591–1603. doi: 10.1016/S0266-3538(01)00059-8
Madra, A., Hajj, N. El., and Benzeggagh, M. (2014). X-ray microtomography applications for quantitative and qualitative analysis of porosity in woven glass fiber reinforced thermoplastic. Compos. Sci. Technol. 95, 50–58. doi: 10.1016/j.compscitech.2014.02.009
Maire, E., and Withers, P. J. (2014). Quantitative X-ray tomography. Int. Mater. Rev. 59, 1–43. doi: 10.1179/1743280413Y.0000000023
Mehdikhani, M., Straumit, I., Gorbatikh, L., and Lomov, S. V. (2019). Detailed characterization of voids in multidirectional carbon fiber/epoxy composite laminates using X-ray micro-computed tomography. Compos. A Appl. Sci. Manuf. 125:105532. doi: 10.1016/j.compositesa.2019.105532
Naouar, N., Vidal-Sallé, E., Schneider, J., Maire, E., and Boisse, P. (2014). Meso-scale FE analyses of textile composite reinforcement deformation based on X-ray computed tomography. Compos. Struct. 116, 165–176. doi: 10.1016/j.compstruct.2014.04.026
Nikishkov, Y., Airoldi, L., and Makeev, A. (2013). Measurement of voids in composites by X-ray computed tomography. Compos. Sci. Technol. 89, 89–97. doi: 10.1016/j.compscitech.2013.09.019
Patou, J., Bonnaire, R., De Luycker, E., and Bernhart, G. (2019). Influence of consolidation process on voids and mechanical properties of powdered and commingled carbon/PPS laminates. Compos. A Appl. Sci. Manuf. 117, 260–275. doi: 10.1016/j.compositesa.2018.11.012
Pazmino, J., Carvelli, V., and Lomov, S. V. (2014). Micro-CT analysis of the internal deformed geometry of a non-crimp 3D orthogonal weave E-glass composite reinforcement. Compos. B Eng. 65, 147–157. doi: 10.1016/j.compositesb.2013.11.024
Phillips, R., Akyüz, D. A., and Månson, J. A. E. (1998). Prediction of the consolidation of woven fibre-reinforced thermoplastic composites. Part I. Isothermal case. Compos. A Appl. Sci. Manuf. 29, 395–402. doi: 10.1016/S1359-835X(97)00099-7
Plank, B., Wevers, M., Lomov, S. V., Straumit, I., Hahn, C., Winterstein, E., et al. (2015). Computation of permeability of a non-crimp carbon textile reinforcement based on X-ray computed tomography images. Compos. A Appl. Sci. Manuf. 81, 289–295. doi: 10.1016/j.compositesa.2015.11.025
Ramakrishnan, K. R., Le Moigne, N., De Almeida, O., Regazzi, A., and Corn, S. (2019). Optimized manufacturing of thermoplastic biocomposites by fast induction-heated compression moulding: Influence of processing parameters on microstructure development and mechanical behaviour. Compos. A Appl. Sci. Manuf. 124:105493. doi: 10.1016/j.compositesa.2019.105493
Rezakhaniha, R., Agianniotis, A., Schrauwen, J. T. C., Griffa, A., Sage, D., Bouten, C. V. C., et al. (2012). Experimental investigation of collagen waviness and orientation in the arterial adventitia using confocal laser scanning microscopy. Biomech. Model. Mechanobiol. 11, 461–473. doi: 10.1007/s10237-011-0325-z
Risicato, J. V., Kelly, F., Soulat, D., Legrand, X., Trümper, W., Cochrane, C., et al. (2014). A complex shaped reinforced thermoplastic composite part made of commingled yarns with integrated sensor. Appl. Compos. Mater. 22, 81–98. doi: 10.1007/s10443-014-9400-9
Rolland, H., Saintier, N., Wilson, P., Merzeau, J., and Robert, G. (2017). In situ X-ray tomography investigation on damage mechanisms in short glass fibre reinforced thermoplastics: effects of fibre orientation and relative humidity. Compos. B Eng. 109, 170–186. doi: 10.1016/j.compositesb.2016.10.043
Schaefer, P. M., Gierszewski, D., Kollmannsberger, A., Zaremba, S., and Drechsler, K. (2017). Analysis and improved process response prediction of laser-assisted automated tape placement with PA-6/carbon tapes using design of experiments and numerical simulations. Compos. A Appl. Sci. Manuf. 96, 137–146. doi: 10.1016/j.compositesa.2017.02.008
Schell, J. S. U., Deleglise, M., Binetruy, C., Krawczak, P., and Ermanni, P. (2007). Numerical prediction and experimental characterisation of meso-scale-voids in liquid composite moulding. Compos. A Appl. Sci. Manuf. 38, 2460–2470. doi: 10.1016/j.compositesa.2007.08.005
Schell, J. S. U., Renggli, M., van Lenthe, G. H., Müller, R., and Ermanni, P. (2006). Micro-computed tomography determination of glass fibre reinforced polymer meso-structure. Compos. Sci. Technol. 66, 2016–2022. doi: 10.1016/j.compscitech.2006.01.003
Sezgin, M., and Sankur, B. (2004). Survey over image thresholding techniques and quantitative performance evaluation. J. Electron. Imaging 13:146. doi: 10.1117/1.1631315
Singh, A., Yadav, A., and Rana, A. (2013). K-means with three different distance metrics. Int. J. Comput. Appl. 67, 13–17. doi: 10.5120/11430-6785
Sisodia, S. M., Garcea, S. C., George, A. R., Fullwood, D. T., Spearing, S. M., and Gamstedt, E. K. (2016). High-resolution computed tomography in resin infused woven carbon fibre composites with voids. Compos. Sci. Technol. 131, 12–21. doi: 10.1016/j.compscitech.2016.05.010
Soltani, P., Johari, M. S., and Zarrebini, M. (2015). Tomography-based determination of transverse permeability in fibrous porous media. J. Ind. Text. 44, 738–756. doi: 10.1177/1528083713512357
Straumit, I., Baran, I., Gorbatikh, L., Farkas, L., Hahn, C., Ilin, K., et al. (2018). “Micro-CT-based analysis of fibre-reinforced composites: applications,” in ECCM18–18th European Conference on Composite Materials (Athens), 1–8. Available online at: www.composites-kuleuven.be
Studer, J., Dransfeld, C., Jauregui Cano, J., Keller, A., Wink, M., Masania, K., et al. (2019). Effect of fabric architecture, compaction and permeability on through thickness thermoplastic melt impregnation. Compos. A Appl. Sci. Manuf. 122, 45–53. doi: 10.1016/j.compositesa.2019.04.008
Svensson, N., Shishoo, R., and Gilchrist, M. (1998). Manufacturing of thermoplastic composites from commingled yarns–a review. J. Thermoplast. Compos. Mater. 11, 22–56. doi: 10.1177/089270579801100102
Trudel-Boucher, D., Fisa, B., Denault, J., and Gagnon, P. (2006). Experimental investigation of stamp forming of unconsolidated commingled E-glass/polypropylene fabrics. Compos. Sci. Technol. 66, 555–570. doi: 10.1016/j.compscitech.2005.05.036
Van West, B. P., Pipes, R. B., and Advani, S. G. (1991). The consolidation of commingled thermoplastic fabrics. Polym. Compos. 12, 417–427. doi: 10.1002/pc.750120607
Vilà, J., Sket, F., Wilde, F., Requena, G., González, C., and LLorca, J. (2015). An in situ investigation of microscopic infusion and void transport during vacuum-assisted infiltration by means of X-ray computed tomography. Compos. Sci. Technol. 119, 12–19. doi: 10.1016/j.compscitech.2015.09.016
Wang, Q. M., Hu, X. Y., Tan, L., and Gao, J. (2011). Effect of hot press parameters on the consolidation quality of biaxial knitted composites from commingled yarn. Adv. Mater. Res. 332–334, 2069–2073. doi: 10.4028/www.scientific.net/AMR.332-334.2069
Wang, Y., Mikkelsen, L. P., Pyka, G., and Withers, P. J. (2018). Time-lapse helical X-ray computed tomography (CT) study of tensile fatigue damage formation in composites for wind turbine blades. Materials (Basel) 11:E2340. doi: 10.3390/ma11112340
Wysocki, M., Toll, S., Larsson, R., and Asp, L. E. (2008). “Hyperelastic constitutive models for consolidation of commingled yarn based composites,” in FPCM9: The 9th International Conference on Flow Processes in Composite Materials, 2008 July 8–10 (Montréal, QC).
Yang, Z., Ren, W., Sharma, R., McDonald, S., Mostafavi, M., Vertyagina, Y., et al. (2017). In-situ X-ray computed tomography characterisation of 3D fracture evolution and image-based numerical homogenisation of concrete. Cem. Concr. Compos. 75, 74–83. doi: 10.1016/j.cemconcomp.2016.10.001
Ye, L., Friedrich, K., and Kästel, J. (1995). Consolidation of GF/PP commingled yarn composites. Appl. Compos. Mater. 1, 415–429. doi: 10.1007/BF00706502
Yu, B., Bradley, R. S., Soutis, C., and Withers, P. J. (2016). A comparison of different approaches for imaging cracks in composites by X-ray microtomography. Philos. Trans. R. Soc. A Math. Phys. Eng. Sci. 374:20160037. doi: 10.1098/rsta.2016.0037
Keywords: X-ray computed tomography, thermoplastic composites, commingled yarns, consolidation, impregnation
Citation: Ayadi A, Deléglise-Lagardère M, Park CH and Krawczak P (2019) Analysis of Impregnation Mechanism of Weft-Knitted Commingled Yarn Composites by Staged Consolidation and Laboratory X-Ray Computed Tomography. Front. Mater. 6:255. doi: 10.3389/fmats.2019.00255
Received: 09 July 2019; Accepted: 25 September 2019;
Published: 11 October 2019.
Edited by:
Laurent Orgéas, UMR5521 Sols, Solides, Structures, Risques (3SR), FranceReviewed by:
Francesca Lionetto, University of Salento, ItalyFlorian Martoia, Institut National des Sciences Appliquées de Lyon (INSA Lyon), France
Baris Caglar, École Polytechnique Fédérale de Lausanne, Switzerland
Copyright © 2019 Ayadi, Deléglise-Lagardère, Park and Krawczak. This is an open-access article distributed under the terms of the Creative Commons Attribution License (CC BY). The use, distribution or reproduction in other forums is permitted, provided the original author(s) and the copyright owner(s) are credited and that the original publication in this journal is cited, in accordance with accepted academic practice. No use, distribution or reproduction is permitted which does not comply with these terms.
*Correspondence: Chung Hae Park, Y2h1bmctaGFlLnBhcmtAaW10LWxpbGxlLWRvdWFpLmZy