 Julian Walker1,2
 Celina Bernal
- 1Engineering Faculty, University of Buenos Aires, Buenos Aires, Argentina
- 2Engineering Faculty, Institute of Technology in Polymers and Nanotechnology (ITPN), University of Buenos Aires, Buenos Aires, Argentina
- 3National Institute of Industrial Technology (INTI), General San Martín, Buenos Aires, Argentina
- 4National Research Council of Argentina (CONICET), Buenos Aires, Argentina
In the present work, solid-state drawing of commercial PLA-based extruded filaments was investigated. Two different filaments were used: one based on neat PLA and the other based on PLA filled with copper particles. The effect of the processing parameters such as the drawing temperature and the draw ratio on the materials morphology and thermal and mechanical behavior was analyzed. A specially designed device which simulates the solid-stated drawing stage frequently used for fibers manufacturing was applied. The drawing effects were evidenced by the results of the degree of crystallinity and tensile parameters, as well as by SEM analysis and topographical observations of the surfaces of the filaments. From these results, it was concluded that the draw ratio is more important than the drawing temperature as a determining factor of the tensile performance of the PLA-based filaments investigated. However, the drawing temperature plays a key role to establish the critical draw ratio to obtain stable solid-state drawing.
Introduction
The production of high-modulus and high-strength polymeric fibers has been the subject of many investigations for a long time focusing on different types of polymers such as polyethylene terephthalate (PET) (Rudolf et al., 2012), polyethylene (PE) (D'Amato et al., 2012) or aramid resins (Mai et al., 2015), among others.
Melt spinning is one of the most widely used processes for fibers production at industrial level (Walczak, 2002). It is based on drawing the material over its melting temperature by taking advantage of the polymer high molecular mobility under this condition. Although it is the simplest fiber process, it has the important disadvantage that the polymer has a great mobility and capacity of rearrangement at high temperature, leading to a fast molecular relaxation (Alccock, 2005). However, fibers with higher stiffness and strength than the original isotropic polymer can be obtained by this process but with less improvement of properties than those obtained by solid-state drawing.
Solid-state drawing, on the other hand, is performed between the material glass transition (Tg) and melting temperatures (Tm) (Alccock, 2005). Below the melting temperature, molecular mobility decreases and relaxation of strained structures is significantly lower. However, a minimum temperature is required for drawing. If the drawing temperature is lower than Tg, the polymer will usually exhibit brittle fracture without significant deformation. In practice, there is a processing window narrower than the interval between Tg and Tm.
In the light of the characteristics of the above mentioned processes, melt spinning and subsequent drawing are frequently preferred in order to produce high performance polymeric fibers (D'Amato et al., 2012).
In addition, biodegradable textiles have attracted considerable interest in many technological applications (Gupta et al., 2007). One of the most promising and innovative biodegradable polymers that also can be transformed into filaments for subsequent fabrication of specific textile structures is poly(lactic acid) (PLA). It has many advantages such as renewability, processability, mechanical property profile and biocompatibility. It can also be recycled without significant loss of mechanical properties. Poly(lactic acid) has a wide spectrum of applications, especially in those applications with high level of residual materials. As a result of its biocompatibility, PLA is used in medical devices and pharmaceutical products as well (Rothen-Weinhold et al., 1999; Wu et al., 2008; Armentano et al., 2010; Hao et al., 2016; Narayanan et al., 2016).
In the form of fibers, PLA has the advantage of being more or less crystallizable depending on the purity of its stereoisomers and the presence of branches in its molecular structure (Henton et al., 2005; Huneault et al., 2012; Fang, 2015). When crystallizing under strain and from orientation in the drawing direction, material properties become anisotropic and significantly improve, making PLA especially suitable for certain applications such as the production of biodegradable textiles.
For crystallizable PLA, the formation of crystals is possible in two different ways. First, upon cooling from its melting temperature or as a result of heating between its glass transition and melting temperatures from molecular rearrangement, as mentioned before. Second, crystallization might be induced by the material stretching under stress which can be the result of the forming process or a desirable effect.
However, the transformation of PLA into textile structures is very complex and depends on the polymer structural changes derived from processing (Gupta et al., 2007). Orientation as a result of drawing of PLA under appropriate conditions can be strongly affected by several material properties (Singh et al., 2018). For example, Mai et al. (2015) reported that the mechanical properties of drawn PLA tapes significantly depend on the draw ratio and the drawing temperature. Modulus, strength and toughness can be improved by the strain-induced crystallization as well as the orientation promoted by drawing (Mai et al., 2015; Singh et al., 2018).
The production of PLA fibers from different processing methods such as melt spinning, dry spinning, wet spinning and dry-jet-wet spinning has been already the subject of many investigations for a long time (Gupta et al., 2007 and references therein). The effect of the solid-state drawing conditions (draw ratio and drawing temperature) and the molecular weight on PLA fibers mechanical properties was analyzed by Eling et al. (1982) many years ago. Later, the same authors (Gogolewski and Pennings, 1983) also studied the morphology and the mechanical response of fibers spun from PLA solutions as a function of the drawing conditions, molecular weight and polymer concentration. In addition, taking into account the potential use of PLA fibers in medical applications, Pennings and his colleagues also investigated the effect of the processing conditions on the structure and in vitro degradation of highly fibrillated fibers obtained by dry-spinning (Leenslag et al., 1984). Thereafter, Fambri et al. (1997) analyzed the effect of the processing parameters of melt-extrusion combined with hot-drawing to produce high strength PLA fibers. Since then, a significant number of papers have been published regarding the production of PLA fibers as it has been comprehensively reviewed by (Gupta et al., 2007).
In the present work, solid-state drawing of commercial extruded filaments was investigated. Two different filaments were studied, they were based on neat PLA and on PLA filled with copper particles. The aim of using a Cu-filled PLA filament was only to determine the influence of drawing on a two-phase material composed of a PLA matrix modified with rigid particles. The effect of the processing parameters such as drawing temperature and draw ratio on the materials morphology and thermal and mechanical behavior was analyzed. A specially designed home-made device which simulates the solid-stated drawing stage frequently used for fibers manufacturing was applied. The drawn filaments developed in this work could have potential application as reinforcement in all-PLA composites provided a sufficiently wide processing window could be obtained by using different PLA grades.
Experimental
Two different commercial extruded filaments for 3D printing based on neat PLA (Ingeo™ Biopolymer 4043D from NatureWorks LLC with a melt flow rate (210°C/2.16 kg) = 16.5 g/10 min) and a PLA-copper compound (PLA matrix with a melt flow rate (210°C/2.16 kg) = 170 g/10 min) were used. They were provided by PrintaLot® and High QS e-Printing, respectively with a nominal diameter of 1.75 mm.
A home-made solid-state drawing machine with two tube furnaces was used for drawing the filaments (Figure 1). The first furnace was applied for pre-heating the filaments at 45°C and the second furnace was set at different drawing temperatures from 65 to 100°C. Variable draw ratios were obtained by changing the speed ratio between the 2nd and the 3rd pulley trains.
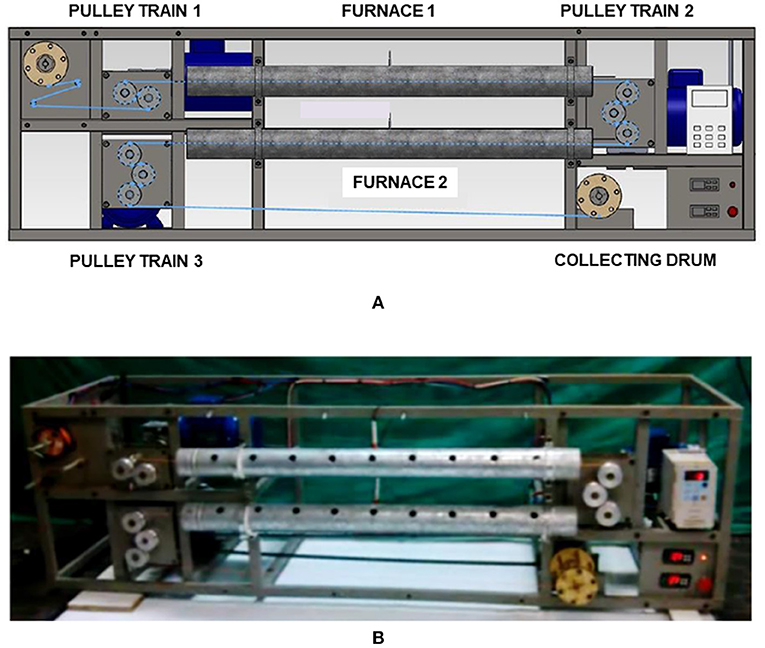
Figure 1. Home-made solid-state drawing machine. (A) Schematic representation and (B) photograph.
The draw ratio (DR) was defined as the ratio between the filaments initial (Ai) and final cross sectional area (Af), as follows:
Where Di and Df are the filaments diameter before and after drawing, respectively (D'Amato et al., 2012).
The thermal behavior of undrawn and drawn filaments was characterized by Differential Scanning Calorimetry (DSC) in a Shimadzu DSC-60 by heating the samples from 20 to 200°C at a heating rate of 10°C/min.
The degree of crystallinity (Xc) was determined using Equation (2):
Where ΔHm is the melting enthalpy, ΔHcc is the cold crystallization enthalpy, ΔHmo is the melting enthalpy for 100% crystalline PLA (93 J/g) (Eling et al., 1982; Singh et al., 2018) and w is the weight fraction of PLA in the sample.
The Tg, ΔHcc and ΔHm were obtained from the DSC thermograms.
Samples morphology was investigated by Scanning Electron Microscopy (SEM) in a Phenom World Pro X microscope from lateral surfaces of both undrawn and drawn filaments. Conventional SEM as well as topographical images were obtained.
In order to better observe the differences in the surface topography of undrawn and drawn filaments, etching was performed using a sodium hydroxide (NaOH) solution which has been reported to etch the PLA amorphous fraction as a result of the hydrolysis of ester linkage (Sun et al., 2009; Jain et al., 2012). For etching, filaments were immersed in a solution of 70:30 water-methanol with 0.04 M NaOH for 6 h followed by washing with distilled water and then kept at 35°C for at least 12 h prior to SEM observations.
In addition, in the case of the Cu-filled PLA filaments, filler volume fraction and characteristic dimensions were also determined from SEM micrographs of cryo-fractured cross-section surfaces obtained at liquid nitrogen temperature. Images were converted from gray scale to binary for better processing with the help of the software ImageJ® (NIH). Dimensions were determined from measurements done on 210 particles.
Uniaxial tensile tests were also performed on the different filaments in an Instron dynamometer 5,982 at 10 mm/min at room temperature by following ASTM D 3379 standard recommendations. Stress-strain curves were obtained from these tests and tensile parameters values (tensile modulus, tensile strength and strain at break) were determined. At least 5 samples were tested for each material and average values and their deviations were reported.
Results and Discussion
Initially, the filaments were drawn at fixed temperatures up to different draw ratios to obtain the processing window to warrant that significantly long segments can be drawn in a stable condition. Drawing temperature range was determined based on the materials glass transition and melting temperatures obtained by DSC.
Within the processing window for each material, the drawing temperature and the draw ratio were varied in order to analyze their effect on the materials morphology and thermal and mechanical behavior.
PLA Filaments
DSC heating scans for the different filaments obtained at different draw ratios and drawing temperatures are presented in Figure 2. It can be seen in this figure, that some filaments presented the glass transition temperature (Tg) endotherm exhibiting a sharp glass transition in the form of a hysteresis peak which can be related to a change in the kinetics of unfreezing derived from the physical aging upon stretching (Struik, 1978). The undrawn filament and the filament drawn at 100°C and DR = 3.5 also displayed the cold crystallization peak due to the lower level of ordering induced by drawing at higher temperatures without significant restriction to molecular relaxation, leading to cold crystallization during heating in DSC (Gupta et al., 2007). Most drawn filaments, on the other hand, only displayed the melting peaks in agreement with the results of Yuan et al. (2001) for hot-drawn PLA fibers and Mai et al. (2015) for PLA drawn tapes.
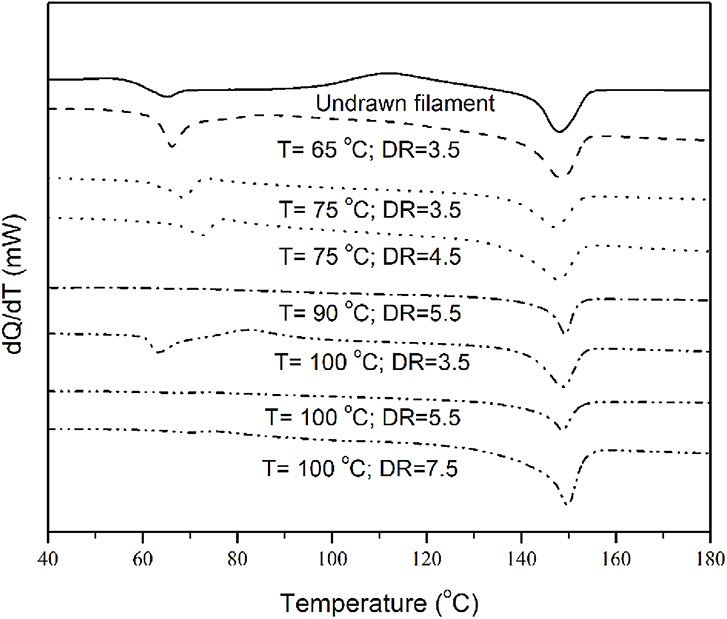
Figure 2. DSC heating scans for the PLA-based undrawn filament and the filaments drawn at different draw ratios and drawing temperatures.
The crystalline fraction (Table 1) in the drawn filaments was found to be significantly higher than that of the original filament as a result of the molecular ordering induced by drawing which consequently, hindered cold crystallization during heating in DSC (Gupta et al., 2007).
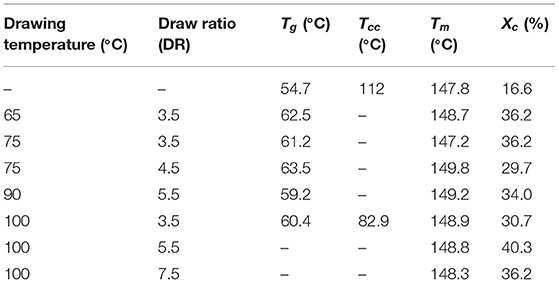
Table 1. Thermal parameters for the undrawn PLA filament and the filaments drawn at different drawing conditions.
Other authors (Singh et al., 2018) also confirmed by x-ray diffraction analysis that the crystallinity of drawn PLA was higher than the undrawn material.
Cicero et al. (2002) showed that drawing leads to molecular orientation and crystallization develops where microfibrils are aligned along the fiber axis. They proposed a representation of PLA molecular structure where the alignment of microfibers along the fiber axis is determined by the draw ratio. The tendency of microfibrils to align along the fiber axis increases with DR. Crystalline and amorphous regions form stacks within the microfibrils while the interfibrillar region is constituted by amorphous chains.
SEM micrographs of the etched surface of the undrawn filament and the filament drawn at 100°C and DR = 5.5 (as an example) are presented in Figures 3A,B, respectively. The change in the surface morphology induced by drawing is clearly observed in this figure. While the surface of the undrawn filament appeared rather smooth, longitudinal dark lines were clearly seen on the surface of the highly drawn filament as a result of the selective etching of the interfibrillar region constituted by amorphous chains (Cicero et al., 2002). It has been proposed by Peterlin that during drawing of semi-crystalline polymers the morphology changes from a spherulite structure to a filbrillar structure (Meinel et al., 1970; Peterlin, 1971), being the interfibrillar region constituted by the amorphous chains, as mentioned before. Similar SEM images (not shown here) were observed for the filaments obtained at the other drawing conditions.
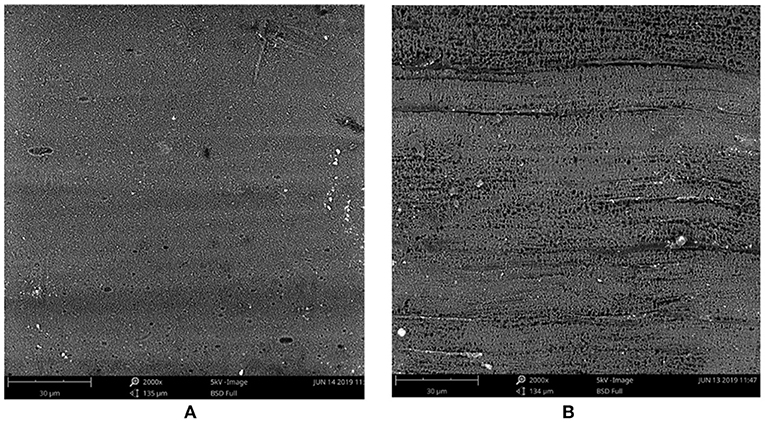
Figure 3. SEM micrographs of the etched surface of (A) the undrawn filament and (B) the filament drawn at 100°C and DR = 5.5.
As it can be observed in Figure 4, a much smoother surface morphology was observed for the undrawn filament respect to the filament obtained at 100°C and DR = 5.5, which exhibited the fibrillar structure developed upon solid-state drawing.
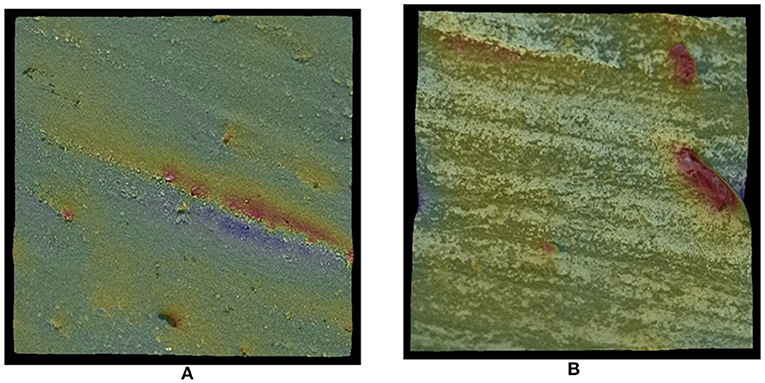
Figure 4. SEM topographical images of the etched surface of (A) the undrawn filament and (B) the filament drawn at 100°C and DR = 5.5.
Stress-strain curves for the PLA filaments after drawing at different temperatures and at two different draw ratios are presented in Figures 5A,B. It can be observed that significant changes in the material tensile behavior were induced by drawing. Samples obtained at a relatively low draw ratio (DR = 3.5) displayed fully ductile behavior, irrespectively of the drawing temperature. This behavior is characterized by a defined yield point followed by strain softening, a plateau and some degree of strain hardening before final fracture (Young and Lovell, 1991). Samples drawn at a higher draw ratio (DR = 5.5), on the other hand, presented a different tensile behavior exhibiting much more significant strain hardening as a result of the higher degree of chain orientation induced by solid-state drawing at this DR (Lin et al., 2019). Mai et al. (2015) also observed that strain hardening was greater as higher was the draw ratio in the solid-state drawing of PLA tapes, and they attributed this result to the strain-induced crystallization and orientation promoted by drawing.
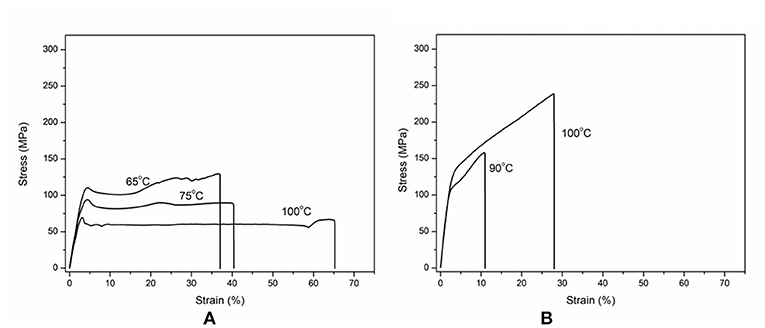
Figure 5. Typical stress-strain curves for the filaments drawn at different drawing temperatures and draw ratios. (A) DR = 3.5. (B) DR = 5.5.
Figures 6A–C shows tensile parameters values as a function of drawing temperature at two different draw ratios. It can be noted that drawn samples were always much stiffer than the original filament with no significant differences among Young's modulus values for the drawn filaments processed at different temperatures and constant DR. In addition, a remarkable higher increase of stiffness was obtained at the highest draw ratio assayed, being Young's modulus values in the same range of values reported in the literature for PLA drawn tapes (Mai et al., 2015) and fibers (Yuan et al., 2001). The improvement of the elastic properties of drawn fibers cannot be only attributed to the orientation-induced crystallization but also to changes in the crystal size and distribution derived from drawing (Humphreys et al., 1985; D'Amato et al., 2012; Rudolf et al., 2012).
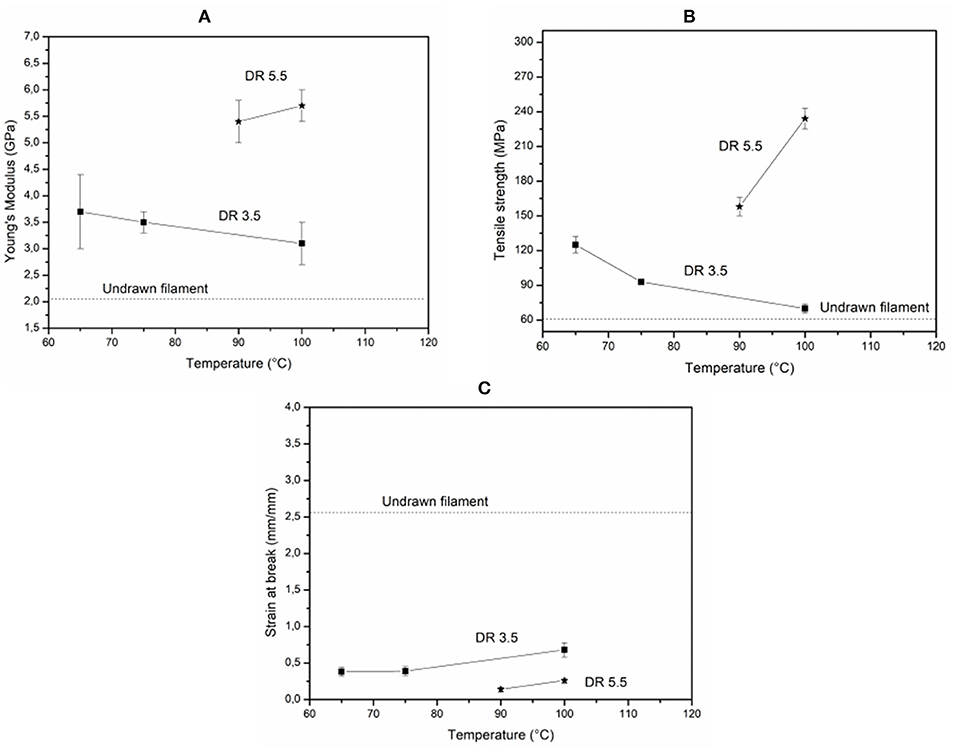
Figure 6. Tensile parameters values as a function of the drawing temperature for the PLA filaments drawn at two different draw ratios. (A) Young's modulus. (B) Tensile strength. (C) Strain at break.
On the other hand, different trends of strength values with processing temperature were observed depending on the draw ratio (Figure 6B). At DR = 3.5, strength values were found to decrease as the drawing temperature increased as a result of the higher degree of molecular chain relaxation (molecular rearrangement) (Alccock, 2005) and hence, the reduction in the number of taut tie molecules and the degree of molecular chain orientation promoted by higher temperatures (Lin et al., 2019). At a higher draw ratio, in contrast, an important increasing trend of strength with drawing temperature was observed. This is probably because molecular relaxation was efficiently limited by the higher degree of chain orientation at this DR.
Regarding ductility, all processing conditions led to significantly lower strain at break values for drawn filaments respect to the undrawn one with no important effects of the drawing temperature.
From the above results for the PLA filaments, the draw ratio seems to be more important than the drawing temperature for determining the material tensile performance. In addition, a high draw ratio is an essential requisite in order to obtain highly stiff and strong PLA filaments.
Cu-filled PLA Filaments
In the case of the commercial Cu-filled PLA filament, scanning electron microscopy (SEM) analysis was developed on cryogenic fracture surfaces of the undrawn filament to determine the morphology and dimensions of Cu particles and their dispersion and distribution within the PLA matrix. Filler content was also estimated from SEM micrographs with the help of the image processing softwar ImageJ®. As it can be seen in Figure 7, Cu inclusions were present in the form of flakes which were also observed to be rather randomly and homogeneously distributed within the PLA matrix. In addition, these flakes were mostly ellipsoidally shaped having average major and minor axis of 2.15 (1.12) and 1.23 (0.60) μm, respectively. In addition, filler volume fraction was found to be 5.6 (0.8) %.
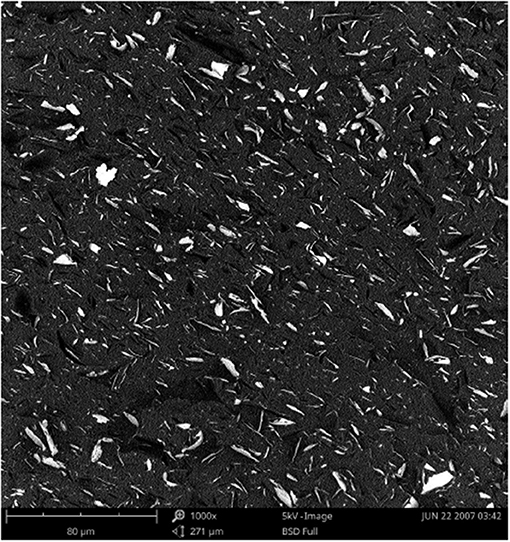
Figure 7. Typical SEM micrograph of a cryogenic fracture surface of the Cu-filled PLA undrawn filament.
DSC heating scans (Figure 8) for most of the PLA-Copper compound filaments drawn at different conditions displayed the melting endothermic peak and only the undrawn filament presented the cold crystallization peak at a relatively low temperature (85.2°C). In addition, similarly to what happened in the case of the PLA filaments, crystallinity values for the Cu-filled PLA filaments significantly increased after drawing (Table 2), as a result of the molecular orientation induced by this process mentioned before.
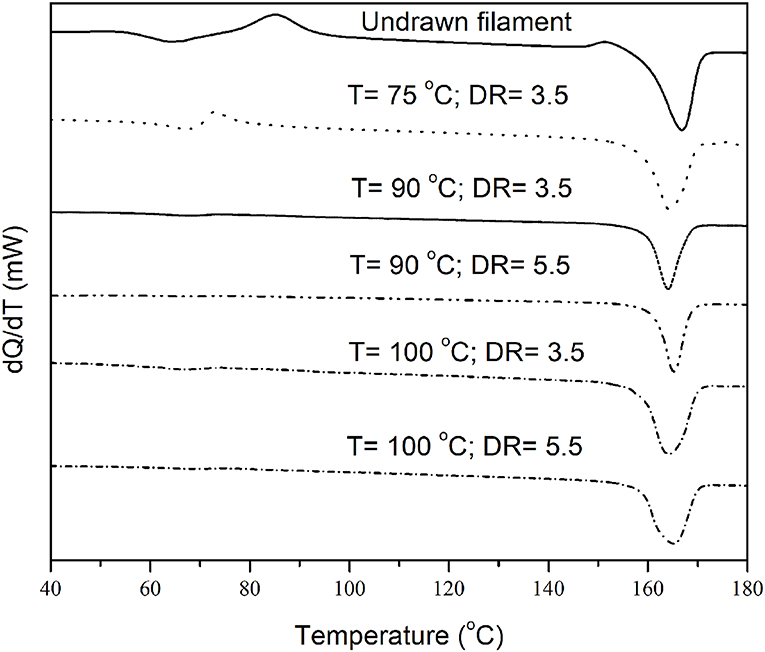
Figure 8. DSC heating scans for the Cu-filled PLA undrawn filament and the filaments drawn at different draw ratios and drawing temperatures.
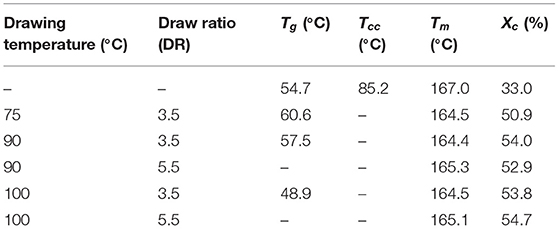
Table 2. Thermal parameters for the undrawn Cu-filled PLA filament and the filaments drawn at different drawing conditions.
Figures 9A,B presents SEM micrographs for the etched surface of the undrawn Cu-filled PLA filament and the filament drawn at 100°C and DR = 5.5 (as an example), respectively. It can be observed (Figure 9A) that in the undrawn filament Cu flakes were randomly distributed within the PLA matrix, whereas in the drawn filament (Figure 9B) filler particles were rather aligned along the drawing direction. Longitudinal dark lines are also observed in this figure, which were attributed to the selective etching of the amorphous interfibrillar region (Cicero et al., 2002). Similar micrographs were obtained for the other drawn filaments (not shown here). These SEM observations are in accordance with those for PLA drawn filaments presented before.
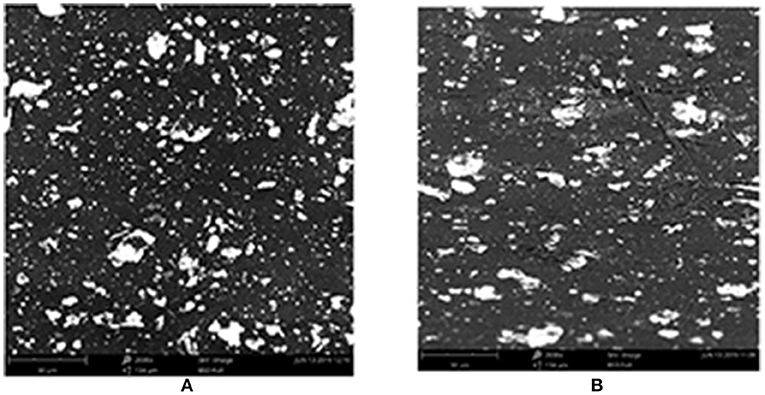
Figure 9. SEM micrographs of the etched surface of (A) the undrawn Cu-filled PLA filament and (B) the filament drawn at 100°C and DR = 5.5.
Also in agreement with the observations for PLA filaments, a completely different topography was found for the undrawn Cu-filled PLA filament respect to the filament drawn at 100°C and DR = 5.5 (Figure 10). In the undrawn filament, Cu flakes were observed to be randomly distributed within the PLA matrix, whereas in the drawn filament the particles were aligned along the drawing direction and longitudinal dark lines attributed to the selective etching of the amorphous chains within the interfibrillar region were also seen. In addition, Cu particles were significantly more separated in this filament as a result of drawing.
Figure 10. SEM topographical images of the etched surface of (A) the undrawn Cu-filled PLA filament and (B) the filament drawn at 100°C and DR = 5.5.
Regarding the mechanical behavior (Figure 11), all tensile stress-strain curves for the Cu-filled PLA filaments presented ductile behavior with a high degree of strain hardening, irrespectively of the drawing conditions. Moreover, the strain hardening effect was significantly higher for the filaments drawn at the highest draw ratio investigated (DR = 5.5) as a result of the higher molecular orientation promoted by drawing (Mai et al., 2015).
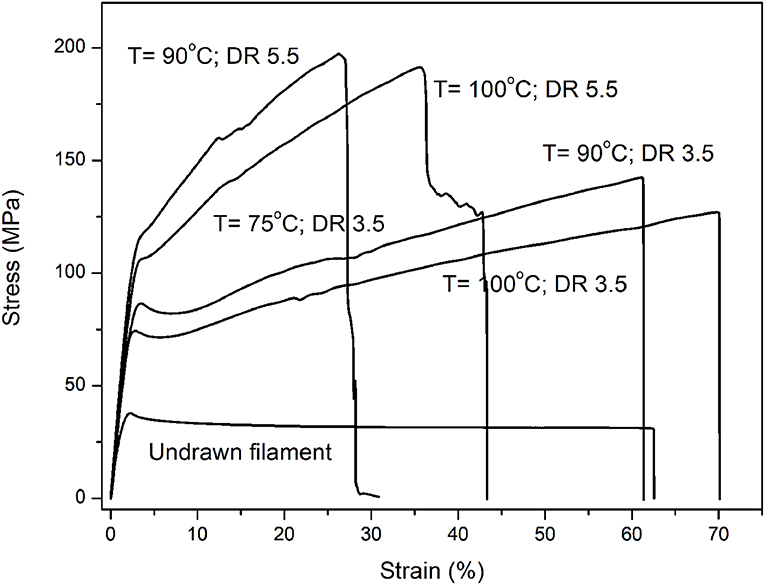
Figure 11. Typical stress-strain curves for the Cu-filled PLA filaments drawn at different drawing conditions.
It can be observed in Figure 12A that all drawn filaments were significantly stiffer than the undrawn filament as a result of both the crystallinity increase induced by molecular orientation as well as from the possible changes in the crystal size/morphology promoted by cold drawing, as mentioned before (Humphreys et al., 1985; D'Amato et al., 2012; Rudolf et al., 2012).
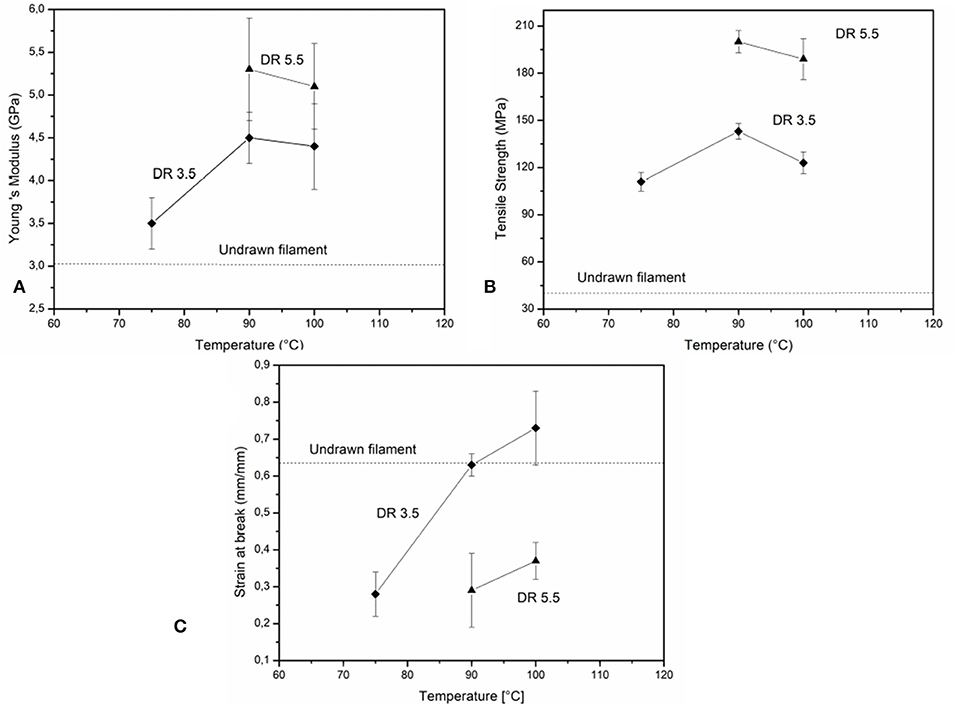
Figure 12. Tensile parameters values as a function of the drawing temperature for the Cu-filled PLA filaments drawn at two different draw ratios. (A) Young's modulus. (B) Tensile strength. (C) Strain at break.
In addition, for the filaments drawn at the lowest draw ratio assayed (DR = 3.5) an increase in the Young's modulus was observed for drawing temperatures higher than 90°C, but further increase in the drawing temperature did not lead to any change in the material stiffness (Figure 12A). For the filaments drawn at DR = 5.5, on the other hand, no significant differences with drawing temperature were found within the range of temperature investigated.
Tensile strength values (Figure 12B), on the other hand, presented a maximum at a drawing temperature of 90°C for the filaments drawn at DR = 3.5 which could be related to the counteracting effects of the higher molecular orientation and strain-induced crystallization and the increased molecular relaxation promoted by higher temperatures. At a higher draw ratio, no significant differences in the strength values with increasing temperature were observed and remarkable stronger filaments were obtained. This could be explained in terms of the significantly higher molecular orientation and stretching able to hinder or even completely avoid molecular relaxation, independently of the drawing temperature.
Finally, the ductility of the Cu-filled PLA filaments was also greatly affected by the drawing temperature and the draw ratio (Figure 12C). While an increasing trend of strain at break values was observed as the temperature increased for the filaments drawn at DR = 3.5, reaching similar values than that for the undrawn filament or even higher, for drawing temperatures higher than 90°C the filaments drawn at DR = 5.5 were much more brittle and roughly independent of the drawing temperature. Unsufficiently restricted molecular rearrangement could be responsible for the increase in ductility with the drawing temperature in the filaments drawn at DR = 3.5.
Conclusions
In the present work, commercial extruded PLA-based filaments could be successfully drawn by solid-state drawing at different temperatures and draw ratios by using a home-made drawing machine.
The drawing effects were evidenced by the results of the degree of crystallinity and tensile parameters, as well as by SEM analysis and topographical observations of filaments surfaces.
From the above results it can be concluded that the draw ratio is more important than the drawing temperature as a determining factor of the tensile behavior of the PLA-based filaments investigated. However, the drawing temperature plays a key role to establish the critical draw ratio to obtain stable solid-state drawing.
Data Availability Statement
The datasets generated for this study are available on request to the corresponding author.
Author Contributions
JW carried out the drawing and mechanical characterization. MM and RG contributed with the etching and SEM micrographs. EP performed the thermal analysis. CB designed the experiments and prepared the manuscript.
Conflict of Interest
The authors declare that the research was conducted in the absence of any commercial or financial relationships that could be construed as a potential conflict of interest.
Acknowledgments
The authors want to thank the National Research Council of Argentina (CONICET PIP 2015 0660), the ANPCyT (PICT 2014 1955), and the University of Buenos Aires (UBACyT 2018 20020170100696BA) for financial support of this investigation.
References
Alccock, B. (2005). Single polymer composites based on polypropylene: processing and properties (PhD dissertation). Queen Mary, University of London, London, United Kingdom.
Armentano, I., Dottori, M., Fortunati, E., Mattioli, S., and Kenny, J. M. (2010). Biodegradable polymer matrix nanocomposites for tissue engineering. A review. Pol. Deg. Stab. 95, 2126–2146. doi: 10.1016/j.polymdegradstab.2010.06.007
Cicero, J. A., Dorgan, J. R., Janzen, J., Garrett, J., Runt, J., and Lin, J. S. (2002). Supramolecular morphology of two-step, melt-spun poly(lactic acid) fibers. J. Appl. Polym. Sci. 86, 2839–2846. doi: 10.1002/app.11268
D'Amato, M., Dorigato, A., Fambri, L., and Pegoretti, A. (2012). High performance polyethylene nanocomposite fibers. Express Polymer Lett. 6, 954–964. doi: 10.3144/expresspolymlett.2012.101
Eling, B., Gogolewski, S., and Pennings, A. J. (1982). Biodegradable materials of poly(L-lactic acid): 1. Melt-spun and solution-spun fibres. Polymer 23, 1587–1593. doi: 10.1016/0032-3861(82)90176-8
Fambri, L., Pegoretti, A., Fenner, R., Incardona, S. D., and Migliaresi, C. (1997). Biodegradable fibres of poly(L-lactic acid) produced by melt spinning. Polymer 38, 79–85. doi: 10.1016/S0032-3861(96)00486-7
Fang, M. (2015). Processing and properties of multifunctional bio-based poly(lactic acid) composites (PhD dissertation). Queen Mary, University of London, London, United Kingdom.
Gogolewski, S., and Pennings, A. J. (1983). Resorbable materials of poly(L-lactide). II. Fibers spun from solutions of poly(L-lactide) in good solvents. J. Appl. Polymer Sci. 28, 1045–1061. doi: 10.1002/app.1983.070280312
Gupta, B., Revagade, N., and Hilborn, J. (2007). Poly(lactic acid) fiber: an overview. Prog. Polym. Sci. 32, 455–482. doi: 10.1016/j.progpolymsci.2007.01.005
Hao, X., Kaschta, J., and Schubert, D. W. (2016). Viscous and elastic properties of polylactide melts filled with silica particles: effect of particle size and concentration. Comp. Part B 89, 44–53. doi: 10.1016/j.compositesb.2015.11.030
Henton, D. E., Gruber, P., Lunt, J., and Randall, J. (2005). Polylactic acid technology. Nat. Fibers Biopolym. Biocompos. 16, 527–278. doi: 10.1201/9780203508206.ch16
Humphreys, J., Ward, I. M., Nix, E. L., McGrath, J. C., and Emi, T. (1985). A study of the drawing behavior of polyvinylidene fluoride. J. Appl. Polym. Sci. 30, 4069–4079. doi: 10.1002/app.1985.070301010
Huneault, M. A., Li, H., Park, C. B., and Saeidlou, S. (2012). Poly(lactic acid) crystallization, Progr. Polym. Sci. 37, 1657–1677. doi: 10.1016/j.progpolymsci.2012.07.005
Jain, S., Misra, M., Mohanty, A. K., and Ghosh, A. K. (2012). Thermal, mechanical and rheological behavior of poly(lactic acid)/talc composites. J. Polym. Environ. 20, 1027–1037. doi: 10.1007/s10924-012-0500-z
Leenslag, J. W., Gogolewski, S., and Pennings, A. J. (1984). Resorbable materials of poly(L-lactide). V. Influence of secondary structure on the mechanical properties and hydrolyzability of poly(L-lactide) fibers produced by a dry-spinning method. J. Appl. Polym. Sci. 29, 2829–2842. doi: 10.1002/app.1984.070290913
Lin, Y., Patel, R., Cao, J., Tu, W., Zhang, H., Bilotti, E., et al. (2019). Glass-like transparent high strength polyethylene films by tuning drawing temperature. Polymer 171, 180–191. doi: 10.1016/j.polymer.2019.03.036
Mai, F., Tu, W., Bilotti, E., and Peijs, T. (2015). The influence of solid-state drawing on mechanical properties and hydrolytic degradation of melt-spun poly(lactic acid) (PLA) tapes. Fibers 3, 523–538. doi: 10.3390/fib3040523
Meinel, G., Morosoff, N., and Peterlin, A. (1970). Plastic deformation of polyethylene. I. Change of morphology during drawing of polyethylene of high density. J. Polym. Sci. Part B Polym. Phys. 8 1723–1740. doi: 10.1007/BF02084721
Narayanan, G., Vernekar, V. N., Kuyinua, E. L., and Laurencin, C. T. (2016). Poly(lactic acid)-based biomaterials for orthopaedic regenerative engineering. Adv. Drug. Del. Rev. 107 247–276. doi: 10.1016/j.addr.2016.04.015
Peterlin, A. (1971). Molecular model of drawing polyethylene and polypropylene. J. Mater. Sci. 6 490–508. doi: 10.1007/BF00550305
Rothen-Weinhold, A., Besseghir, K., Vuaridel, E., Sublet, E., Oudry, N., Kubel, F., et al. (1999). Injection-molding versus extrusion as manufacturing technique for the preparation of biodegradable implants. Eur. J. Pharma. Biopharma. 48, 113–121. doi: 10.1016/S0939-6411(99)00034-X
Rudolf, A., Gersak, J., and Smole, M. (2012). The effect of heat treatment conditions using the drawing process on the properties of PET filament sewing thread. Textile Res. J. 82 161–171. doi: 10.1177/0040517511413318
Singh, A., Geng, S., Herrera, N., and Oksman, K. (2018). Aligned plasticized polylactic acid cellulose nanocomposite tapes. Effect of drawing conditions. Compos. Part A 104 101–107. doi: 10.1016/j.compositesa.2017.10.019
Struik, L. G. E. (1978). Physical Aging in Amorphous Polymers and Other Materials. Amsterdam: Elsevier.
Sun, S. P., Wei, M., Olson, J. R., and Shaw, M. T. (2009). Alkali etching of a poly(lactide) fiber. ACS Appl. Mater. Interfaces 1, 1572–1578. doi: 10.1021/am900227f
Wu, D., Zhang, Y., Zhang, M., and Zhou, W. (2008). Phase behavior and its viscoelastic response of polylactide/poly(epsilon-polycaprolactone) blend. Eur. Pol. J. 44, 2171–2183. doi: 10.1016/j.eurpolymj.2008.04.023
Young, R. J., and Lovell, P. A. (1991). Introduction to Polymers, 2nd Edn. London: Chapman and Hall.
Keywords: poly(lactic acid), solid-state drawing, polymeric filaments, mechanical properties, processing conditions
Citation: Walker J, Melaj M, Giménez R, Pérez E and Bernal C (2019) Solid-State Drawing of Commercial Poly(Lactic Acid) (PLA) Based Filaments. Front. Mater. 6:280. doi: 10.3389/fmats.2019.00280
Received: 31 July 2019; Accepted: 21 October 2019;
Published: 07 November 2019.
Edited by:
Patricia Krawczak, IMT Lille Douai, FranceReviewed by:
Alessandro Pegoretti, University of Trento, ItalyPhilippe Boisse, Institut National des Sciences Appliquées de Lyon (INSA Lyon), France
Copyright © 2019 Walker, Melaj, Giménez, Pérez and Bernal. This is an open-access article distributed under the terms of the Creative Commons Attribution License (CC BY). The use, distribution or reproduction in other forums is permitted, provided the original author(s) and the copyright owner(s) are credited and that the original publication in this journal is cited, in accordance with accepted academic practice. No use, distribution or reproduction is permitted which does not comply with these terms.
*Correspondence: Celina Bernal, Y2Jlcm5hbEBmaS51YmEuYXI=