 Andrea A. Piarristeguy
 Rozenn Le Parc
 Michel Ramonda
 Raphaël Escalier1
- 1ICGM, Univ Montpellier, CNRS, ENSCM, Montpellier, France
- 2Laboratoire Charles Coulomb (L2C), UMR 5221 CNRS-Université de Montpellier, Montpellier, France
- 3Centre de Technologie de Montpellier, Université de Montpellier, Montpellier, France
Peak Force Quantitative Nano-Mechanical property mapping (PF-QNM) was used to explore the nanomechanical properties of binary GeySe100−y glasses and phase-separated Agx(Ge0.25Se0.75)100−x glasses. The indentation modulus decreases when the selenium content increases in the binary glasses and when the silver content increases in phase-separated ternary glasses as a consequence of the increasing flexibility of the network. At nanoscale level, PF-QNM measurements highlighted a higher indentation modulus for the Ag-rich phase than for the Ag-poor phase, together with a decrease of both local indentation moduli with the increase of silver content in the glass. A model to gain a further insight in the mean coordination numbers and compositions of the Ag-rich and Ag-poor phases, based upon the assumption of a decoupled effect of the variations in Ag and in Ge on the mechanical properties, is described in detail. In the framework of the model, the mean coordination numbers for the Ag-rich phase <NR> and Ag-poor phase <NP> keep on decreasing when the total silver content in the glasses increases. The Ge concentration differs in Ag-rich and Ag-poor phases. When the silver content in the glass increases, the Ge concentration decreases in both phases. The result, in turn, indicates that an increase in the conductivity of the Ag-rich phase when the total silver content increases, as shown previously by C-AFM, would not be only explained by an increase in silver content but also by a softening of the network and consequently by an increase of charge carrier mobility.
Introduction
Owing to their remarkable properties (IR transparency, high ionic conduction, photo-diffusion, etc.), chalcogenide glasses aroused strong interest in both the academic community and private companies. Among potential applications, the Conductive-Bridging Random Access Memories (CB-RAM), susceptible to replace the current flash memories, take advantage of two properties of chalcogenide films, their sensitivity to photo-diffusion and their high ionic conductivity when doped with silver. A CB-RAM memory typically comprises a Ag-photo-doped glassy thin film of composition ~Ge0.25Se0.75 placed between two electrodes, a silver one and a nickel one for example. The conductivity of the film is reversibly changed by several orders of magnitude when a low voltage is applied (~0.2V). When applied to nanometric devices (when the thickness of the glassy film is typically 20–30 nm), the phenomenon is characterized by a very short time for commutation (~10 ns) and a very high cyclability (>106 cycles) (Kozicki et al., 2005).
In order to explain the operation of this memory and in particular its very short switching time hardly compatible with the mobility of Ag+ ions, various hypotheses have been proposed and among them, the presence of pre-existing silver-rich zones within the amorphous film—which would be heterogeneous—and the creation of conduction paths between these zones. To confirm this hypothesis and to better understand the phenomena at the origin of the switching from a resistive state to a conductive state in CB-RAM memories, the electrical, structural, and thermal properties of bulk Ag-Ge-Se glasses have been widely studied (Dejus et al., 1988, 1991, 1992; Kawasaki et al., 1999; Mitkova et al., 1999; Iyetomi et al., 2000; Piarristeguy et al., 2000, 2003, 2007a, 2012; Ureña et al., 2003, 2005; Wang et al., 2003; Cervinka et al., 2005; Tafen et al., 2005; Cuello et al., 2007; Prasai and Drabold, 2011; Le Parc et al., 2013; Stellhorn et al., 2016a,b; Zeidler et al., 2016, 2018). It was shown that the conductivity of Agx(Ge0.25Se0.75)100−x glasses with 1 < x < 30 at. % increases suddenly by seven to eight orders of magnitude at 7–10 at. % Ag.
Insight into the microstructure of these glasses was clearly needed. However, owing to the ease of diffusion of silver in these materials (Kolobov and Elliott, 1991), the use of classical microscopy techniques to probe the structure of Ag-based glasses is tricky; a risk of altering the Ag-centered local structures exists if the light or electron beam energy is too high. As a matter of fact, few papers on the electrical properties of chalcogenide glasses report attempts to get insights into the homogeneity of the materials.
Gutenev et al. (1991) and Wang et al. (2003) indicated for the first time that the glasses were phase separated according to optical microscopy and modulated differential scanning calorimetry (MDSC) experiments, respectively. However, these experiments cannot provide insight on, for example, the evolution of the composition or the conductivity of each phase with increasing silver content. Several years later, the ability and the complementarity of near field microscopy techniques provided insight into the intrinsic electrical properties of each phase present in bulk Agx(Ge0.25Se0.75)100−x glasses and their composition dependence (Balan et al., 2006; Piarristeguy et al., 2007b, 2010a,b). Electrostatic force microscopy (EFM) was indeed used to get images of electrical contrasts (dielectric permittivity) in phase separated glasses. Combined with electrical conductivity measurements using complex impedance spectroscopy, EFM helped in understanding the jump in conductivity at 7–10 at% in Agx(Ge0.25Se0.75)100−x glasses. While a Ag-rich phase is embedded in a Ag-poor phase for the low conductivity region (x < 7–10 at. % Ag), the reverse is true for high conductivity region (x > 7–10 at. % Ag) with the Ag-rich phase controlling the silver diffusion throughout the material. The percolation of the Ag-rich phase was at the origin of a sudden jump in conductivity (Balan et al., 2006; Piarristeguy et al., 2007b).
Recently another near field microscopy technique, i.e., the Contact Resonance Atomic Force Microscopy (CR-AFM) in combination with Raman mapping was used to get additional information on the phase compositions in bulk Agx(Ge0.25Se0.75)100−x glasses (Piarristeguy et al., 2018). The results suggested a different Ge/Se ratio in Ag-poor and Ag-rich phases, the first one being richer in selenium than the second one.
In this work, an innovative and complementary technique, the Peak Force Quantitative Nano-Mechanical mapping (PF-QNM) was used to explore the nano-mechanical properties of GeySe100−y and Agx(Ge0.25Se0.75)100−x glasses and get information on the topology of these phase-separated glasses. A model, based upon the assumption of a decoupled effect of the variations in Ag and in Ge on the mechanical properties, helped to gain a further insight in the mean coordination numbers and compositions of the Ag-rich and Ag-poor phases.
Materials and Methods
Sample Preparation and Characterization
Bulk GeySe100−y glasses (y = 15, 20, 25, 30, and 33 at. %) and Agx(Ge0.25Se0.75)100−x glasses (x = 0, 7, 15, and 20 at. %) were synthesized from a mixture of high-purity starting elements [Ag (Aldrich, 99.9 %), Ge (Aldrich, 99.999 %) and Se (Aldrich, 99.99 %)] Three grams of the stoichiometric powders were placed in a cylindrical quartz ampoule (11 mm inner diameter, 1 mm thick) sealed under secondary vacuum (10−5 mbar). The tube was subsequently heated with a low heating rate of 6°C/h up to 600°C for Ge15Se85, 700°C for Ge20Se80 and 850°C for Ge30Se70 and Ge33Se67, held at this temperature for 12 h, and finally quenched in air. For the Agx(Ge0.25Se0.75)100−x glasses, the powder was heated up to 950°C with a 10°C/h heating rate and kept at this temperature for 8 h for homogenization before being quenched in a salt-ice-water mixture. The samples were named Agx according to the concentration of Ag (in at. %) and the nomenclature R-Agx and P-Agx was used for the Ag-rich and Ag-poor phases, respectively.
The amorphous nature of the ingots was confirmed by performing X-Ray diffraction using a PANalytical X'Pert diffractometer. A Cu (Kα) source (λ = 1.5406Å) was used with an operating voltage of 40 kV and a beam current of 30–40 mA.
Peak Force Quantitative Nano-Mechanical Property Mapping (PF-QNM)
The mechanical characterization was performed with a Multimode AFM instrument (from Bruker Corporation, USA) upgraded with Nanoscope V using PF-QNM imaging mode and a special RTESPA-525-30 (BatchA050 wafer1 Box9 probe#3) (Bruker) probe with a lever spring constant of 167 N/m and a tip radius of 34 nm. A FSILICA-12M sample from Bruker Instruments was first used to calibrate sensitivity deflection and sync distance QNM. The calibration was checked by measuring a sample (given by Arnould et al., 2017) consisting in a mixture of resin and fiber of K28 grade Kevlar, providing indentation moduli of around 4 GPa ± 0.4 GPa and 23 GPa ± 4 GPa, respectively, in agreement with the data of Arnould et al. (2017). The applied maximum load was set at 200 nN for all the measurements. Different mechanical properties, i.e., adhesion force, elastic modulus, deformation, energy dissipation, were obtained by a real time analysis of the “force versus separation” curves. The well-known Derjaguin-Muller-Toporov (DMT) model (Derjaguin et al., 1975) was used to fit the retract curves and calculate the indentation moduli (Poisson coefficient set at 0).
Measurements were performed on the surfaces of freshly fractured glass to avoid any problem due to surface oxidation. The experiments were carried out within the following hours.
Results
Ge-Se Glasses
PF-QNM experiments allowed getting information about the mechanical properties of glasses. The indentation moduli, reported for glasses for the first time, were estimated from data recorded over 5 × 5 μm images. Figure 1 shows the indentation moduli for the different GeySe100−y glasses. A monotonous increase in modulus with increasing germanium concentration (y) is observed, which is in agreement with Vickers and Meyer's hardness and Young's modulus measured by conventional mechanical techniques (Guin et al., 2002). The insert in Figure 1 shows both the indentation moduli obtained by PF-QNM measurements and the Young's moduli for the same glassy compositions (Guin et al., 2002). Similar trends are observed, which allows to validate the PF-QNM technique to evaluate realistic glass indentation moduli.
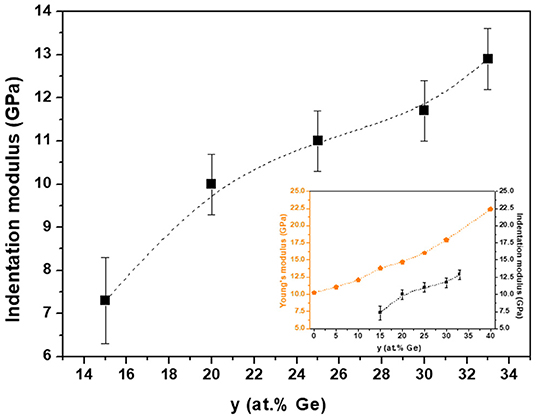
Figure 1. Indentation moduli for bulk GeySe100−y glasses. Insert shows the comparison between Young's modulus (Guin et al., 2002) and indentation modulus obtained by PF-QNM measurements. The broken lines are drawn as guides for the eye. The indentation modulus values and the error bars were calculated from an average of three PF-QNM measurements and standard deviation evaluation.
Because of similar Se-Se and Se-Ge bond strengths (223 and 230 kJ/mol, respectively) and only slightly weaker Ge-Ge bond strength (186 kJ/mol), Guin et al. (2002) claimed that the source for the increase of the hardness has to be topological in nature. Consequently, the continuous increase of hardness is of the same origin as the increase of the elastic moduli, and it results from the increasing number of strong covalent bonds with increasing Ge concentration.
Ag-Ge-Se Glasses
Figure 2 shows the topography and the indentation modulus images (PF-QNM) for the Agx(Ge0.25Se0.75)100−x glasses. These images (Figures 2b,d,f) clearly show heterogeneous domains, which indicates that the PF-QNM technique is sensitive to modulation of mechanical properties at the local stage. The heterogeneous domains are similar to those already reported for this family of glasses using Electrostatic Force Microscopy (EFM) and Conductive-Atomic Force Microscopy (C-AFM) (Balan et al., 2006; Piarristeguy et al., 2007b, 2010a,b). For glassy compositions belonging to the low-conductivity region (x < 10 at. % Ag, Figure 2b), nodules of a Ag-rich (R-Agx) phase (light region) are embedded in a connected Ag-poor (P-Agx) phase (dark region). At the opposite, for the glassy compositions belonging to the high conductivity region (x = 15 and 20), a connected R-Agx phase contains nodules of P-Agx phase (Figures 2d,f). Depending upon the quenching conditions, spinodal or nucleation/growth phase separation can occur in these glasses (Piarristeguy et al., 2018). In this work, the images show a morphology typical of nucleation/growth phase separation.
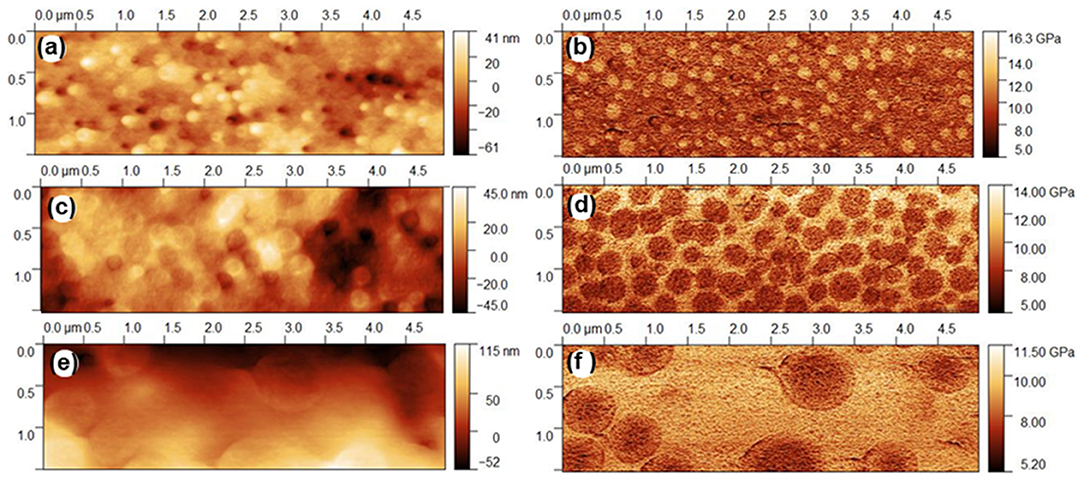
Figure 2. PF-QNM mapping of the Agx(Ge0.25Se0.75)100−x glasses: (a) x = 7, topography, (b) x = 7, indentation modulus, (c) x = 15, topography, (d) x = 15, indentation modulus, (e) x = 20, topography and (f) x = 20, indentation modulus.
As an example, the analysis of a small zone of the indentation modulus mapping for a typical phase-separated Ag20(Ge0.25Se0.75)80 glass is detailed (Figure 3). This glass presents nodules of about 0.7 μm (P-Agx phase) immersed in a conductive matrix (R-Agx phase). The indentation moduli of both phases are visible in Figure 3A. The variation of modulus along the white line in Figure 3A is shown in Figure 3B. The modulus of the R-Agx phase, i.e., ~9 GPa, corresponds to the domains of the line from 0 to ~0.5 μm and from ~1.3 to 2 μm. The modulus for the R-Agx phase between ~0.5 and ~1.3 μm has a value of ~7.2 GPa.
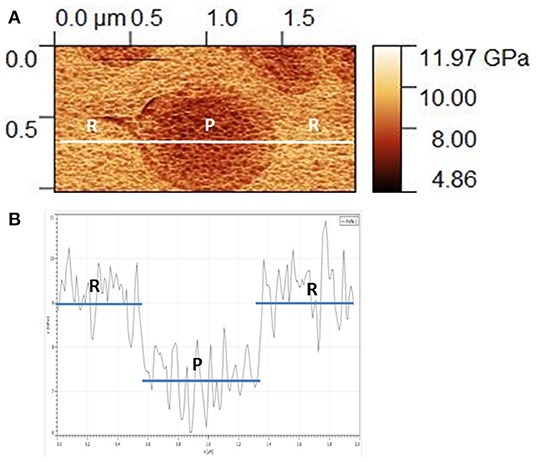
Figure 3. (A) Detailed mapping of indentation modulus for the Ag20(Ge0.25Se0.75)80 glass and (B) variation of the indentation modulus along the profile drawn in (A). In both images, “R” and “P” correspond to R-Agx and P-Agx phases, respectively.
Three different values of indentation modulus for each of these phase-separated glasses were extracted from the PF-QNM experiments. The first one corresponds to an average value and is evaluated by taking into account the whole region included in the blue parallelepiped in Figure 4, the second one corresponds to the indentation modulus for the R-Agx phase and is obtained from regions included in the red parallelepiped in Figure 4, the third one corresponds to the P-Agx phase (regions in the green parallelepiped in Figure 4). The average indentation modulus, estimated from data recorded over the whole 5 × 1.5 μm image is equivalent to a “macroscopic measurement.” At least thirty different regions were taken into in the PF-QNM image to estimate the value of and the uncertainty on the indentation modulus for each phase.
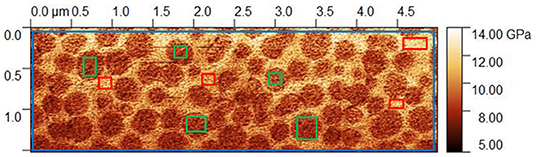
Figure 4. PF-QNM mapping of indentation modulus for Ag15(Ge0.25Se0.75)85 glass. The blue, red and green regions correspond to the average (or macroscopic) indentation modulus, the R-Agx phase and the P-Agx phase modulus, respectively.
The indentation moduli for R-Agx and P-Agx phases as well as the “average modulus” as a function of the silver content are presented in Figure 5. The “average modulus” decreases with the increase of silver concentration in the glass, which is in agreement with previous Vickers microhardness measurements (Piarristeguy et al., 2018). This decrease is a consequence of the structural changes induced by the introduction of Ag in the Ge25Se75 glass. Introduction of silver affects the tetrahedral network through changes in bond angles, eventual ES to CS tetrahedra transformation associated to network disruption and selenium chains breaking. At high silver content, a high flexibility of the network is expected as a consequence of depolymerization of the glass network. Based on this statement, the local mechanical measurements present an apparent contradiction since the indentation modulus value is higher for the R-Agx phase than for the P-Agx phase (it will be discussed in the next section). A decrease of both local indentation moduli with the increase of the silver content in the glass is also observed.
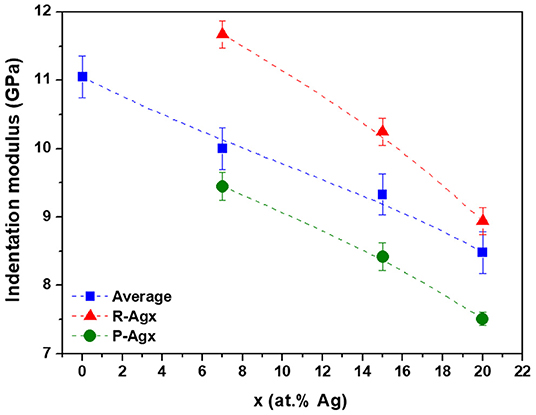
Figure 5. Indentation moduli for bulk Agx(Ge0.25Se0.75)100−x glasses. Blue, red and green symbols correspond to the “average modulus,” R-Agx and P-Agx phases moduli, respectively. The broken lines are drawn as guides for the eye. The indentation modulus values and the error bars were calculated from: i) an average of three PF-QNM measurements and standard deviation evaluation for the “average modulus” and ii) an average of PF-QNM measurements over thirty different regions (see green and red regions in Figure 4) and subsequent standard deviation evaluation for the Ag-rich and Ag-poor phases.
Discussion
Mean Coordination Number and Composition
The results above show a decrease in the “average” indentation modulus M (symbols in blue, Figure 5) when the Ag content increases in the glasses. However, for a given Ag content, the R-Agx phase systematically exhibit a higher modulus than the P-Agx phase. The explanation has to be searched in difference in compositions and, consequently in average coordination numbers, between R-Agx and P-Agx.
In GeySe100−y glasses, assuming <NGe> = 4 and <NSe> = 2 for the mean coordination numbers of Ge and Se, respectively, the mean coordination number can be estimated
In Agx(Ge0.25Se0.75)100−x glasses, when ionic bonds are participating to the structure, the determination of the mean coordination is more complex. Zeidler et al. (2018) have estimated the nearest-neighbor coordination numbers <Nij> extracted from neutron diffraction experiments on glasses along the Agx(Ge0.25Se0.75)100−x tie line. Taking into account that the first coordination sphere implies only <NGeSe>, <NSeSe>, and <NSeGe>, the mean coordination number for this family of glasses can be estimated
Figure 6 shows the mean coordination number <N> for GeySe100−y and Agx(Ge0.25Se0.75)100−x glasses. As expected, we observe that the mean coordination number decreases monotonously with the increase of silver content in the glass, with values comprised between <N> = 2.50 for Ag0 to <N> = 1.62 for Ag25. Silver incorporation is expected to depolymerize the network, searching for selenium to compensate its positive charge, leading to inter-tetrahedral Ge-Se-Ge, and selenium chains breaking. Therefore, the introduction of silver is expected to introduce some flexibility into the network.
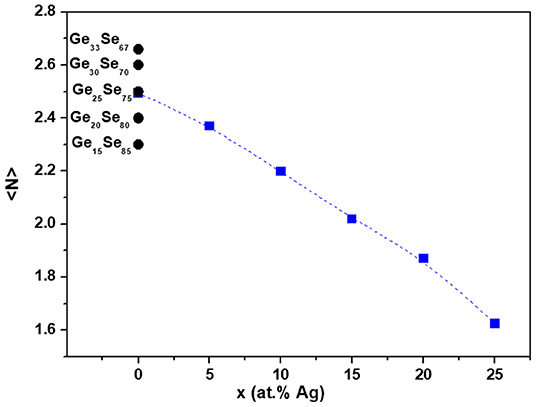
Figure 6. Mean coordination number <N> for Agx(Ge0.25Se0.75)100−x glasses estimated using Zeidler et al. (2016). For comparison, mean coordination number <N> for GeySe100−y glasses are presented assuming <NGe> = 4 and <NSe> = 2 for the mean coordination numbers of Ge and Se, respectively.
An attempt to gain a further insight into the mean coordination numbers of the R-Agx and P-Agx phases in Agx(GezSe1−z)100−x glasses is described below.
As a first approximation, the dependence of the indentation modulus MGe on Ge content in GeySe100−y glasses, shown in Figure 7 (black symbols), can be taken as linear with
In the same way, the dependence of the indentation modulus MAg on Ag content for Agx(Ge0.25Se0.75)100−x glasses, shown in Figure 7 (blue symbols), can be taken as linear with
On the whole, the effect of Ge modulation is almost three times more impacting on the indentation modulus than the evolution of the average Ag content and evolves in the opposite direction.
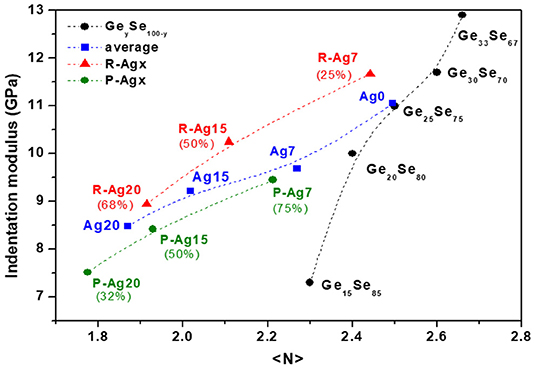
Figure 7. Indentation moduli in function of the mean coordination number for GeySe100−y glasses (black symbols), Agx(Ge0.25Se0.75)100−x glasses (bleu symbols), and R-Agx (red symbols) and P-Agx (green symbols) phases. Percentages correspond to the proportion of R-Agx and P-Agx phase for each composition Agx. The broken lines are drawn as guides for the eye.
With the assumption that the difference of indentation moduli ΔMR−P = M(R-Agx)-M(P-Agx) between the Ag-rich phase and the Ag-poor phase , for a given glass composition, can be related to the decoupled effect of both the variation in Ag content, = x′ – x″, and the variation in Ge content, = 100.z′ – 100. z″, one can write
where is the modulus difference related to a Ag variation and a modulus difference related to Ge variation .
Taking into account Equations (3–4), the equation (5) can be written
The modulus difference between R-Agx and P-Agx phases, ΔMR−P, for a given glass, can be calculated from the experimental data shown in Figure 5. These values are 2.33, 1.85, 1.43, for Ag7, Ag15, and Ag20 glasses respectively, which corresponds (see Equation 6) to Δ <N> values of 0.23, 0.18, and 0.14 with the Ag content increasing in the glass.
Additional information can help to estimate the mean coordination number for R-Agx (<NR>) and P-Agx (<NP>) phases. The PF-QNM images (Figures 2b,d,f) indeed allow to calculate the surface percentage for the R-Agx (% R) and P-Agx (% P) phases. Assuming that the volume percentage is equivalent to the surface percentage, the mean coordination number is therefore a linear combination of the mean coordination number in R-Agx and P-Agx phases:
where we have assumed that <NR> = <NP> + Δ <N> because R-Agx phase presents a high indentation modulus in comparison with the P-Agx phase. The mean coordination numbers <NR> and <NP> are presented in Figure 7.
It can be seen that, consistently with the average coordination number, both <NR> and <NP> decrease with increasing Ag content. These decreases in coordination number can be understood by a decrease in Ge (z′, z″) and/or an increase of Ag (x′, x″). The differences <NR> – <NP> for a specific Agx composition decreases when Ag content increases (respectively equal to 0.23, 0.18, 0.14 for Ag7, Ag15, and Ag20). Interestingly, depending upon the preparation procedure, the glass Ag 25, not measured here, is either homogeneous or shows only very small inhomogeneities.
As a matter of fact, compositions of the P-Agx and R-Agx phases should not only differ in Ag composition (x′, x″), but also in Ge composition (z′, z″) as already suggested by the results from CR-AFM data shown in a previous (Piarristeguy et al., 2018). Indeed, one expects a R-Agx phase with a higher Ge content (z′) than the P-Agx one (see Figure 8).
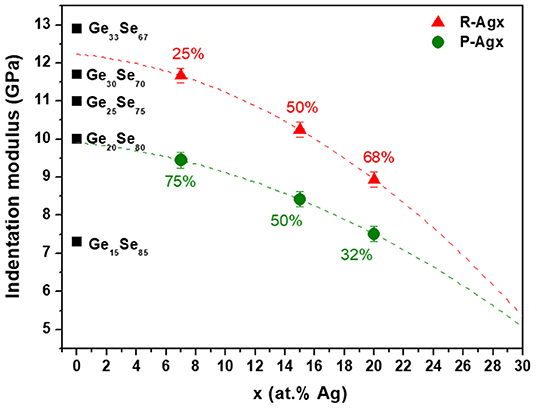
Figure 8. Indentation moduli for R-Agx (red symbols) and P-Agx (green symbols) phases in Agx(Ge0.25Se0.75)100−x glasses and for GeySe100−y glasses (black symbols). Percentages correspond to the proportion of R-Agx and P-Agx phases for each composition Agx. The broken lines are drawn as guides for the eye.
In the following, we aim at gaining a further insight in the compositions of the R-Agx phase and of the P-Agx phase . As already mentioned, according PF-QNM images (Figures 2b,d,f), the average composition is a linear combination of the compositions in R-Agx and P-Agx phases:
with
where (% R) and (% P) correspond, respectively to the surface percentage for R-Agx and P-Agx phases.
Combining these equations leads to a great number of potential compositions, however further restrictions on the Ge content can be considered and reduce the number of suitable compositions.
At first, the Ge content for the R-Agx phase (z′) has to be larger than 0.25 since it was shown that the R-Agx phase is richer in Ge than the P-Agx one, and obviously to the average composition (z). A second set of restrictions can be estimated from the difference of indentation moduli ΔMR−P = M(R-Agx)-M(P-Agx) between R-Agx and P-Agx phases, assuming once again that the modulus dependence on Ag and Ge can be decoupled (Equation 5).
where and were obtained from a linear dependences of the indentation modulus MGe on Ge content in GeySe100−y glasses (Figure 1) and the indentation modulus MAg on Ag content for Agx(Ge0.25Se0.75)100−x glasses, shown in Figure 5 (blue symbols).
With the above information, it is possible to access to the possible values for each Agx composition. Figure 9 shows the indentation modulus differences ΔMR−P predicted as a function of in the form of several linear curves, each one corresponding to possible values of . Intercepts between experimental ΔMR−P and the line network give access to the potential values for each Agx composition. On can deduce that
- For Ag 7: = [0-7], ΔMR−P = 2.33 and [8.2–11.3]
- For Ag 15: = [0-15], ΔMR−P = 1.85 and = [6.5–13]
- For Ag 20: = [0-20], ΔMR−P = 1.43 and = [5–13.7]
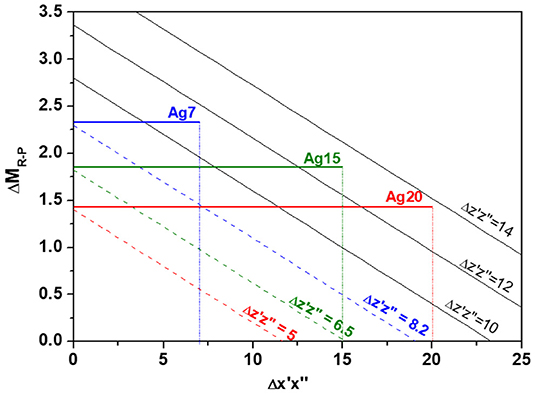
Figure 9. Indentation modulus differences ΔMR−P predicted as a function of in the form of several linear curves each one corresponding to possible values of . Horizontal lines correspond to experimental ΔMR−P for Ag7, Ag15, and Ag20.
Taking into account all the previous constraints that include z′ > 0.25, x′ > x, 0 < x″ < x, Equations (8–11) and estimated from Figure 9, several compositions for the R-Agx phase (x′ and z′) and for the P-Agx phase (x″ and z″) can be proposed. They are reported in Figure 10. Among these compositions, some might not be realistic, in particular if they do not contain a sufficient Se ratio to compensate the positive charges brought by Ge and Ag (compositions not shown in Figure 10).
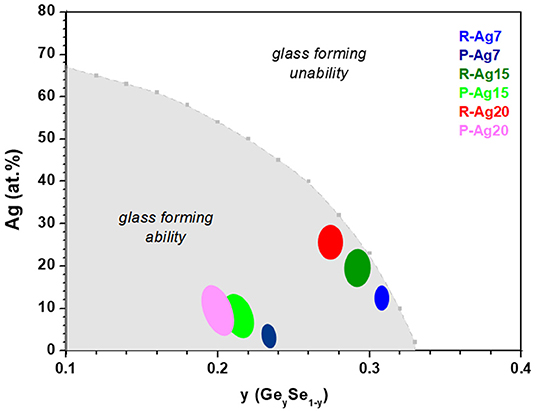
Figure 10. Curve showing the limiting values of x (Ag) for each composition y (Ge) on the basis of the validity of criteria of . Color regions show compositions found for R-Agx and P-Agx phases.
Therefore, a last restriction is proposed inspired from the limit of Agx(Ge0.25Se0.75)100−x glass forming ability proposed by Zeidler et al. (2018). This limit corresponds to the consumption of all Se-Se homopolar bonds, can be estimated when the concentration of Ge, Se, and Ag lead to the mean coordination number associated to the number of Se-Se bonds . Then can be calculated from this relation
where ZSe and ZGe are the overall coordination numbers of Se and Ge equal to 2 and 4 respectively, and is the mean number of broken Se-Se bonds per silver atoms estimated around 0.33 (Zeidler et al., 2018). The criteria of has been used to find the limit between the compositions lying within the glass forming ability and those beyond. The composition limit is shown in Figure 10. Most compositions found for R-Agx and P-Agx phases are in the glass forming compositions.
An exact value of Ag concentration in R-Agx and P-Agx phases cannot be given from the previous analyses but some interesting information can be brought: (i) the Ge concentration differs in R-Agx and P-Agx phases with Ge concentration being larger in R-Agx phase, (ii) when the average silver content increases, the Ge concentration decreases in both phases, (iii) z′ and z″ lie in the range 19–31 at. % Ge.
Conductivity
The PF-QNM images (Figure 2) show a nucleation/growth type phase separation in the Agx(Ge0.25Se0.75)100−x glasses, in agreement with previous papers (Balan et al., 2006; Piarristeguy et al., 2007b, 2010a,b, 2018). The heterogeneous structure has been used to explain the sudden jump in conductivity by 8 orders of magnitude at a silver content lying in the range 7–10 at. % Ag. Indeed, while the Ag-rich phase is embedded in a Ag poor phase for the low conductivity region (x < 7–10% at Ag), the reverse is true for the high conductivity region (x > 7–10% at Ag), with the silver rich phase then controlling the silver diffusion throughout the material. Additional nanoscale electrical characterization of the R-Agx phases by conductive atomic force microcopy (C-AFM) showed that the conductivity increased in R-Agx phases with the increase in total Ag content of the glass (x) (Piarristeguy et al., 2010a). Such an increase can be explained by the increase in the Ag content of the R-Agx phase (x′) (see blue, dark green, and red regions in Figure 10). However, the present data also show that with increasing Ag content, a softening of the network in R-Agx phases occurs due to a decrease in Ge (z′). Such a softening could also contribute to an increase in conductivity due to an increase in charge carrier mobility. This proposal agrees with Micoulaut et al. (2009) that states “The ease of conduction in an ion conducting glass could indeed be related to the mechanical nature of the host network.”
Conclusion
Peak Force Quantitative Nano-Mechanical (PF-QNM) mapping was used to characterize a series of binary GeySe100−y glasses and phase-separated Agx(Ge0.25Se0.75)100−x glasses. This technique proved to be efficient to obtain mechanical information at the nanoscale in a system where information at the nanoscale are difficult to obtain due to the fast silver photo-diffusion under energetic (light or electron beam) stimulus, leading to modification of Ag-centered local structures. As expected, a decrease in the indentation modulus when the selenium content increased in the binary glasses and when the silver content increased in phase-separated ternary glasses, as a consequence of the increasing flexibility of the network, was observed. At nanoscale level, the sensitivity of PF-QNM measurements allowed to observe a difference in the indentation moduli of the two phases, i.e., high and low for Ag-rich (R-Agx) and Ag-poor (P-Agx) phases, respectively.
A model that contributes to a better understanding of the topology of this phase-separated system has been proposed. It is based on the assumption that the change in nanomechanical properties of the Ag-rich and Ag-poor phases depends on the change in Ag and Ge in an independent way. Within this assumption, the mean coordination numbers and compositions for Ag-rich (R-Agx) and Ag-poor (P-Agx) phases can be qualitatively estimated from PF-QNM data. When the silver content in the glass increases, the mean coordination numbers of the R-Agx phase <NR> and P-Agx phase <NP> decrease continuously. This is accompanied with a decrease of the Ge concentration in both phases but with the average Ge concentration remaining equal to 25.
Finally, these data helped in providing new information about the increase of conductivity in the Ag-rich (R-Agx) phase when silver content increases in the glasses, as observed by C-AFM measurements. As a matter of fact, it would not only be explained by an increase in silver content in the Ag-rich phase but also by a softening of the network and consequently by an increase of charge carrier mobility.
These promising results provide prospects likely to contribute to the understanding of the topology of phase-separated glasses as well as other bi-phase systems such as glass ceramics or composite materials.
Data Availability Statement
All datasets generated for this study are available on request to the corresponding author.
Author Contributions
All authors listed have made a substantial, direct and intellectual contribution to the work, and approved it for publication.
Conflict of Interest
The authors declare that the research was conducted in the absence of any commercial or financial relationships that could be construed as a potential conflict of interest.
Acknowledgments
The authors acknowledge M. Bigot for its help in sample preparation and O. Arnould and R. Arinero for fruitful discussions on PF-QNM image analysis.
References
Arnould, O., Siniscalco, D., Bourmaud, A., Le Duigou, A., and Baley, C. (2017). Better insight into the nano-mechanical properties of flax fibre cell walls. Industr. Crops Prod. 97, 224–228. doi: 10.1016/j.indcrop.2016.12.020
Balan, V., Piarristeguy, A., Ramonda, M., Pradel, A., and Ribes, M. (2006). Phase separation and ionic conductivity: an electric force microscopy investigation of silver chalcogenide glasses. J. Optoelectron. Adv. Mater. 8, 2112–2116.
Cervinka, L., Bergerová, J., Tichý, L., and Rocca, F. (2005). A contribution to the structure of Ge–Se–Ag glasses. Phys. Chem. Glasses 46, 444–450.
Cuello, G. J., Piarristeguy, A. A., Fernández-Martínez, A., Fontana, M., and Pradel, A. (2007). Structure of chalcogenide glasses by neutron diffraction. J. Non-Cryst. Solids 353, 729–732. doi: 10.1016/j.jnoncrysol.2006.12.036
Dejus, R. J., Le Poire, D. J., Susman, S., Volin, K. J., and Price, D. L. (1991). Dynamics of vitreous Ag-Ge-Se. Phys. Rev. B 44, 11705–11713. doi: 10.1103/PhysRevB.44.11705
Dejus, R. J., Susman, S., Volin, K. J., Montague, D. G., and Price, D. L. (1992). Structure of vitreous AgGeSe. J. Non-Cryst. Solids 143, 162–180. doi: 10.1016/S0022-3093(05)80565-4
Dejus, R. J., Susman, S., Volin, K. J., Price, D. L., and Montague, D. G. (1988). The structure of silver/germanium/selenium glass. J. Non-Cryst. Solids 106, 34–37. doi: 10.1016/0022-3093(88)90222-0
Derjaguin, B. V., Muller, V. M., and Toporov, Y. P. (1975). Effect of contact deformations on the adhesion of particles. J. Colloid Interface Sci. 53, 314–326. doi: 10.1016/0021-9797(75)90018-1
Guin, J., Rouxel, P., Sangleboeuf, T. J.-C., Melscoet, I., and Lucas, J. (2002). Hardness, toughness, and scratchability of germanium–selenium chalcogenide glasses. J. Am. Ceram. Soc. 85 1545–1552. doi: 10.1111/j.1151-2916.2002.tb00310.x
Gutenev, M., Tabolin, A., and Rykova, A. (1991). Dielectric loss in Ag-Ge-Se system glasses. Fiz. Khim. Stakla 17, 36–40.
Iyetomi, H., Vashishta, P., and Kalia, R. K. (2000). Incipient phase separation in Ag/Ge/Se glasses: clustering of Ag atoms. J. Non-Cryst. Solids 262, 135–142. doi: 10.1016/S0022-3093(99)00692-4
Kawasaki, M., Kawamura, J., Nakamura, Y., and Aniya, M. (1999). Ionic conductivity of Agx(GeSe3)1−x (0 ≤ x ≤ 0.571) glasses. J. Non-Cryst. Solids 123, 259–269. doi: 10.1016/S0167-2738(99)00117-4
Kolobov, A. V., and Elliott, S. R. (1991). Photodoping of amorphous chalcogenides by metals. Adv. Phys. 40, 625–684. doi: 10.1080/00018739100101532
Kozicki, M. N., Balakrishnan, M., Gopalan, C., Ratnakumar, C., and Mitkova, M. (2005). “Programmable metallization cell memory based on Ag-Ge-S and Cu-Ge-S solid electrolytes,” in Procedings of Symposium Non-Volatile Memory Technology (Dallas, TX), 83–89. doi: 10.1109/NVMT.2005.1541405
Le Parc, R., Piarristeguy, A. A., Frolet, N., Pradel, A., and Ribes, M. (2013). Ag–Ge–Se glasses: a vibrational spectroscopy study. J. Raman Spectrosc. 44, 1049–1057. doi: 10.1002/jrs.4320
Micoulaut, M., Malki, M., Novita, D. I., and Boolchand, P. (2009). Fast-ion conduction and flexibility and rigidity of solid electrolyte glasses. Phys. Rev. B 80, 184205-1–184205-10. doi: 10.1103/PhysRevB.80.184205
Mitkova, M., Wang, Y., and Boolchand, P. (1999). Dual chemical role of Ag as an additive in chalcogenide glasses. Phys. Rev. Lett. 83, 3848–3851. doi: 10.1103/PhysRevLett.83.3848
Piarristeguy, A., Conde Garrido, J. M., Ureña, M. A., Fontana, M., and Arcondo, B. (2007a). Conductivity percolation transition of Agx(Ge0.25Se0.75)100−x glasses. J. Non-Cryst. Solids 353, 3314–3317. doi: 10.1016/j.jnoncrysol.2007.05.078
Piarristeguy, A., Cuello, G. J., Fernández-Martínez, A., Cristiglio, V., Johnson, M., Ribes, M., et al. (2012). Short range order and Ag diffusion threshold in Agx(Ge0.25Se0.75)100−x glasses. Phys. Status Solidi B 249, 2028–2033. doi: 10.1002/pssb.201200384
Piarristeguy, A., Fontana, M., and Arcondo, B. (2003). Structural considerations about the (Ge0.25Se0.75)100−xAgx glasses. J. Non-Cryst. Solids 332, 1–10. doi: 10.1016/j.jnoncrysol.2003.09.011
Piarristeguy, A., Le Parc, R., Ramonda, M., Escalier, R., Grillo, I., Cuello, G. J., et al. (2018). Local vibrational and mechanical characterization of Ag conducting chalcogenide glasses. J. Alloys Compounds 762, 906–914. doi: 10.1016/j.jallcom.2018.05.280
Piarristeguy, A., Ramonda, M., Frolet, N., Ribes, M., and Pradel, A. (2010a). High resolution electrical characterisation of Ag-conducting heterogeneous chalcogenide glasses. Solid State Ionics 181, 1205–1208. doi: 10.1016/j.ssi.2010.06.050
Piarristeguy, A., Ramonda, M., and Pradel, A. (2010b). Local electrical characterization of Ag conducting chalcogenide glasses using electric force microscopy. J. Non-Cryst. Solids 356, 2402–2405. doi: 10.1016/j.jnoncrysol.2010.03.024
Piarristeguy, A., Ramonda, M., Ureña, A., Pradel, A., and Ribes, M. (2007b). Phase separation in Ag–Ge–Se glasses. J. Non-Cryst. Solids 353, 1261–1263. doi: 10.1016/j.jnoncrysol.2006.09.065
Piarristeguy, A. A., Mirandou, M., Fontana, M., and Arcondo, B. (2000). X-ray analysis of GeSeAg glasses. J. Non-Cryst. Solids 273, 30–35. doi: 10.1016/S0022-3093(00)00141-1
Prasai, B., and Drabold, D. A. (2011). Ab initio simulation of solid electrolyte materials in liquid and glassy phases. Phys. Rev. B 83, 094202-1–094202-8. doi: 10.1103/PhysRevB.83.094202
Stellhorn, J. R., Hosokawa, S., Kawakita, Y., Gies, D., Pilgrim, W. C., Hayashi, K., et al. (2016a). Local structure of room-temperature superionic Ag–GeSe3 glasses. J. Non- Cryst. Solids 431, 68–71. doi: 10.1016/j.jnoncrysol.2015.02.027
Stellhorn, J. R., Hosokawa, S., Pilgrim, W. C., Kawakita, Y., Kamimura, K., Kimura, K., et al. (2016b). Structural aspects of the superionic conduction mechanism in Ag-GeSe3 glasses. Z. Phys. Chem. 230, 369–386. doi: 10.1515/zpch-2015-0667
Tafen, D. N., Drabold, D. A., and Mitkova, M. (2005). Silver transport in GexSe1−x:Ag materials: Ab initio simulation of a solid electrolyte. Phys. Rev. B 72, 054206-1–054206-9. doi: 10.1103/PhysRevB.72.054206
Ureña, M. A., Fontana, M., Arcondo, B., and Clavaguera-Mora, M. T. (2003). Crystallization processes of Ag–Ge–Se superionic glasses. J. Non-Cryst. Solids 320, 151–167. doi: 10.1016/S0022-3093(03)00022-X
Ureña, M. A., Piarristeguy, A. A., Fontana, M., and Arcondo, B. (2005). Ionic conductivity (Ag+) in AgGeSe glasses. Solid State Ionics 176, 505–512. doi: 10.1016/j.ssi.2004.09.008
Wang, Y., Mitkova, M., Georgiev, D. G., Mamedov, S., and Boolchand, P. (2003). Macroscopic phase separation of Se-rich (x <1/3) ternary Agy(GexSe1−x)1−y glasses. J. Phys.: Condens. Matter. 15, S1573–S1584. doi: 10.1088/0953-8984/15/16/307
Zeidler, A., Salmon, P. S., Piarristeguy, A., Pradel, A., and Fischer, H. E. (2016). Structure of glassy Ag–Ge–Se by neutron diffraction with isotope substitution. Z. Phys. Chem. 230, 417–432. doi: 10.1515/zpch-2015-0727
Keywords: Ag-doped chalcogenide glasses, phase separation, ionic conduction, near field microscopy, nano-mechanical mapping
Citation: Piarristeguy AA, Le Parc R, Ramonda M, Escalier R and Pradel A (2020) Topological Study of Phase-Separated Ag-Conducting Chalcogenide Glasses Using Peak Force Quantitative Nano-Mechanical Characterization. Front. Mater. 6:340. doi: 10.3389/fmats.2019.00340
Received: 15 June 2019; Accepted: 11 December 2019;
Published: 10 January 2020.
Edited by:
Punit Boolchand, University of Cincinnati, United StatesCopyright © 2020 Piarristeguy, Le Parc, Ramonda, Escalier and Pradel. This is an open-access article distributed under the terms of the Creative Commons Attribution License (CC BY). The use, distribution or reproduction in other forums is permitted, provided the original author(s) and the copyright owner(s) are credited and that the original publication in this journal is cited, in accordance with accepted academic practice. No use, distribution or reproduction is permitted which does not comply with these terms.
*Correspondence: Andrea A. Piarristeguy, YW5kcmVhLnBpYXJyaXN0ZWd1eUB1bW9udHBlbGxpZXIuZnI=