 Yue Li
 Guosheng Zhang
 Zigeng Wang
- Key Laboratory of Urban Security and Disaster Engineering of Ministry of Education, Beijing Key Laboratory of Earthquake Engineering and Structural Retrofit, Beijing University of Technology, Beijing, China
The magnesium phosphate cement (MPC) is a carbon-free cementitious material, widely used in solidification of nuclear waste, heavy metals, and repair and reinforcement. The magnesium potassium phosphate hexahydrate (MgKPO4·6H2O, MKP) is the main hydration product of MPC, seriously affecting the mechanical properties of the MPC. Therefore, this paper presented an experimental-computational approach to investigate the mechanical properties of the MKP through nanoindentation with X-ray Computed Tomography (X-CT) technique and finite element analysis. Firstly, the micro-mechanical properties and structural distribution characteristics of the MKP were tested based on the nanoindentation and the X-CT technique, respectively. Then, the 3D structure grid model of the MKP was obtained based on X-CT data, imported into the ABAQUS software for the finite element simulation. Besides, considering the effect of porosity and pore distribution on the damage, the modified MKP constitutive relation was proposed and input into the X-CT nanoindentation model and the RAP nanoindentation model, respectively. It was found that those two models can effectively describe the mechanical and deformation characteristics of the MKP, which verified the correctness of the modified constitutive relationship of MKP. Finally, the influence of pore distribution on the nanoindentation results was predicted based on the RAP nanoindentation model.
Introduction
The production of widely used Portland cement consumes a lot of energy and emits a large amount of carbon dioxide, causing serious environmental pollution. Green building materials are urgently needed in today's world to avoid the deterioration of ecosystems and the intensification of global warming. Magnesium phosphate cement (MPC) is a carbon-free cement that does not emit carbon dioxide during the production process (Walling and Provis, 2016). MPC is considered as a new type of environmentally friendly cement (Haque and Chen, 2019). Additionally, it is believed as a cementitious material formed by acid-base chemical reaction between water, magnesium oxide, and phosphate. The main chemical reaction equation of potassium MPC is shown in Equation (1):
where potassium hexahydrate hexahydrate (MKP) is the main hydration product of the MPC (Vinokurov et al., 2018a).
Furthermore, MPC is widely used in solidification of nuclear waste, heavy metals and repair and reinforcement due to its advantages of fast hardening, early high strength, and high viscosity (Li et al., 2017; He et al., 2019; Mestres et al., 2019; Zhenghua et al., 2019), which attracts many scholars to do enormous research on hydration mechanism, durability, and mechanical properties (Ma et al., 2014; Li et al., 2015, 2016).
Liquid radioactive waste (LRW) containing elements such as uranium and thorium is the product of nuclear industry activities which has great harm to the environment and human health. Long-term controlled storage or disposal of LRW is one of the key links in the safe management of radioactive waste (Stefanovsky et al., 2017). Solidification/stabilization (S/S) is the mixing of LRW and binder, thus fixing the LRW in the binder for long-term safe disposal. The S/S is a very effective technique for handling large amounts of the LRW and the MPC is one of the most promising materials for solidifying the radioactive waste (Vinokurov et al., 2019). Four different leaching tests were conducted to determine the effect of the MPC on solidifying heavy metal-containing waste liquid. The results showed that the MPC could successfully solidify the solution containing Cd, Cr, Cu, N, Pb, or Zn (Buj et al., 2010). The radioactive waste containing metal uranium is incompatible with conventional ordinary Portland cement (OPC)-based encapsulation matrices. The reason is that the high alkaline environment and high free water content in the OPC result in volume change of the system and hydrogen generation. Since the MPC has lower pH value and less free water content, it can encapsulate the radioactive waste containing active metals such as uranium (Covill et al., 2011). In addition, the researchers found that the MPC can solidify radioactive waste within actinide and rare earth elements. The method of the MPC curing the LRW has the advantages of simple technology and high physical and chemical stability (Vinokurov et al., 2009, 2018b).
Heavy metals such as Zn, Pb, Cd, As contaminate soils, which are also increasingly serious environmental problems. Heavy metals not only pose a threat to the human health and the environment, but also deteriorate the mechanical properties of the soil, limit the reuse of contaminated sites, and even pose a safety threat to engineering in the polluted areas (Du et al., 2014). As mentioned above, the S/S technique is an effective and economical remediation technology. It mixes the binder MPC with contaminated soil to physically fix or chemically bind harmful contaminants, thus preventing heavy metals from migrating to the environment and enhancing the strength of the soil (Wang Y.S. et al., 2018; Xu et al., 2018). Aiming at the environmental problem of high lead content in soil polluted by lead-acid batteries, researchers found that the MPC could effectively fix lead in soil and convert lead in polluted areas into less mobile contaminant binding forms at an acceptable cost, effectively increasing the strength of polluted soil (Zhang et al., 2015). The factors affecting the solidification effect of the MPC are metal concentration in soil and water-binder ratio of the MPC, curing age and dosage (Wang P. et al., 2017, 2018). In addition, municipal solid waste incineration (MSWI) fly ash pollution is highly toxic, threatening human living environment and health. The MPC can also effectively reduce the toxic pollution of the MSWI fly ash (Fan et al., 2018).
Energy demand and resource extraction activities are one of the major environmental concerns of modern society. The MPC has a good repair and reinforcement effect on concrete structures due to its characteristics of fast hardening and early high strength. The MPC can be injected into cracks from old buildings or bonded with CFRP to reinforce damaged structures, thus delaying the demolition of old buildings and the construction of new buildings, reducing energy, and resource consumption (Li et al., 2017). In addition, the MPC can be produced from industrial by-products, which has a positive impact on the environment and sustainability (Maldonado-Alameda et al., 2017). For example, boron-containing magnesium oxide (B-MgO) was a byproduct of the production of Li2CO3 from salt lakes. B-MgO can be used as raw materials to produce MPC (Tan et al., 2014; Formosa et al., 2015). The MPC even can upcycle construction wood waste into rapidshaping cement-bonded particleboards, reducing environmental burden and increasing economic value (Wang L. et al., 2017).
In summary, the mechanical properties of the MPC have an important influence on the solidification of heavy metal contaminated soil and the repair and reinforcement of engineering structures. The main hydration product MKP determines the mechanical properties of the MPC. However, most researches only focus on the application and macro-mechanical properties of the MPC, which do not involve the mechanical properties of the MKP. Therefore, in this paper, the micro-mechanical properties and structural characteristics of the MKP are studied in detail.
Nanoindentation technique and X-ray Computed Tomography (X-CT) technique are the state of the art technologies, which can measure the micro-mechanical properties and 3D structure distribution characteristics of materials. The micro-mechanical properties and creep behavior of cement paste were attained by the nanoindentation technique. The factors affecting the test results of nanoindentation and the contact creep function of various phases in cement paste were determined (Liang et al., 2017a,b; Wei et al., 2017). CT technology was used for in-situ monitoring of water and ion intrusion into cement paste and the erosion process was visualized in three dimensions (Yang et al., 2015, 2018). Based on the CT images, pore-scale modeling and micromechanical modeling of cement paste could be obtained (Zhang and Jivkov, 2016; Zhang, 2017). The combination of X-CT and finite element method can more accurately simulate the properties of the materials (Skarzynski and Tejchman, 2016).
Therefore, based on nanoindentation and X-CT techniques, the micro-mechanical properties and structural distribution characteristics of the MKP were investigated. The nanoindentation model of the MKP was established based on the X-CT and the random aggregate placement method. From the perspective of damage factor, the modified constitutive relation of the MKP considering porosity and pore distribution was proposed. Firstly, the 3D microstructure distribution characteristics of the MKP were obtained based on the X-CT technique. The MKP was tested by the nanoindentation to attain the elastic modulus and the indentation load-displacement curves. Then based on the X-CT images, the MKP 3D structure grid model was obtained and imported into ABAQUS software as the nanoindentation model. In addition, the influence equation of pores on the damage factor in MKP constitutive was proposed. The effect of porosity and pore distribution on the MKP damage was studied in detail and the modified MKP constitutive relation considering porosity and pore distribution was verified. Finally, based on the random aggregate placement method (RAP), the RAP nanoindentation model of the MKP was established and the effect of pore distribution on the nanoindentation results was predicted.
Materials and Methods
Materials and Specimen Preparation
The experimental material in this research was magnesium potassium phosphate hexahydrate (MgKPO4·6H2O, MKP). The MKP granules were obtained from a pharmaceutical reagent factory in Xuzhou City, Jiangsu Province, China, with a purity of over 99%.
The elastic modulus and internal structure of MKP were tested by nanoindentation and X-CT techniques, respectively. Before the nanoindentation test, the specimens needed to be pretreated: the mass ratio of MKP particles to epoxy resin is 1/10, and these two materials were stirred for 5 min, then the epoxy resin hardened after 6 h as the specimens for the nanoindentation test. Since the nanoindentation test requires high flatness on the surface of specimens, it is necessary to perform smooth pretreatment on the test piece (Zhao et al., 2005; Zheng et al., 2008; Han et al., 2012). The surfaces of the specimens were polished in the order of 400–4,000 mesh sandpaper, canvas, and silk. The surface roughness of the polished specimens was tested by an atomic force microscope to ensure that the roughness was <100 nm. After smoothing the MKP, the testing region was marked and then the structure distribution characteristics of the region was obtained by X-CT.
Methods
X-CT Test
X-ray Computed Tomography (X-CT) technique is one of the most advanced non-destructive testing techniques, which can obtain the internal structure of materials. The density difference between the MKP and the pores leads to the difference of X-ray absorption coefficient and gray value in the X-CT images. Therefore, the two materials can be distinguished according to the gray value division (Sun et al., 2014). The X-ray projections were obtained with an exposure time of 0.32 s at an accelerating voltage of 150 kV and 140 μA beam current using a tungsten target.
Nanoindentation Test
In nanoindentation test, the elastic modulus of the specimens was measured by nanoindentation instrument manufactured by Agilent Company, USA with the Berkovich indenter (a positive triangular pyramid with an angle of 65.35° between the center line and the side). The appropriate loading depth and indentation spacing should be selected for nanoindentation test (Al-Amoudi, 2002; Němeček et al., 2009; Wang et al., 2009; Chen et al., 2010). Since in this study the nanoindentation test was simulated, a larger indentation depth was required to match the X-CT resolution and obtain a sufficient number of finite element meshes. The maximum indentation depth of the nanoindentation instrument used in this study is 20 μm. Hence, the indentation depth was set to 20 μm and the indentation point spacing was set to 200 μm.
Figure 1A displays a typical Scanning Electron Microscope (SEM) image of the nanoindentation. However, the indentation area includes not only the matrix MKP but also the pores, shown in Figure 1B. Therefore, the material properties, volume fractions and distribution characteristics of the matrix and pores both affect the test results of the nanoindentation test. The nanoindentation process can be divided into three stages: first, the elastic deformation of the specimen occurred at the loading stage, followed by the plastic deformation with the increase of the load. Then the constant loading stage appeared when the maximum indentation depth was reached. Finally, the unloading stage took place, reflecting the elastic recovery of the indentation points. The typical load-displacement curve of the nanoindentation is shown in Figure 1C. The curve consists of three parts: the loading stage, the constant loading and the unloading stage. The loading time of the loading stage was 1,000 s. When the indentation depth reached 20 μm, the constant loading kept for 100 s, followed by the unloading stage for 300 s. The contact stiffness S is fitted by the upper elastic part of the unloading curve. According to the Oliver-Pharr principle (Oliver and Pharr, 2011), the elastic modulus of the indentation point can be calculated by Equation (1).
where E and ν indicate the elastic modulus and Poisson's ratio of tested material, γ is a correction factor (γ = 1.034), S is the contact stiffness, A is the contact area, νi and Ei denote the parameters of indenter (νi = 0.07, Ei = 1,141 GPa).
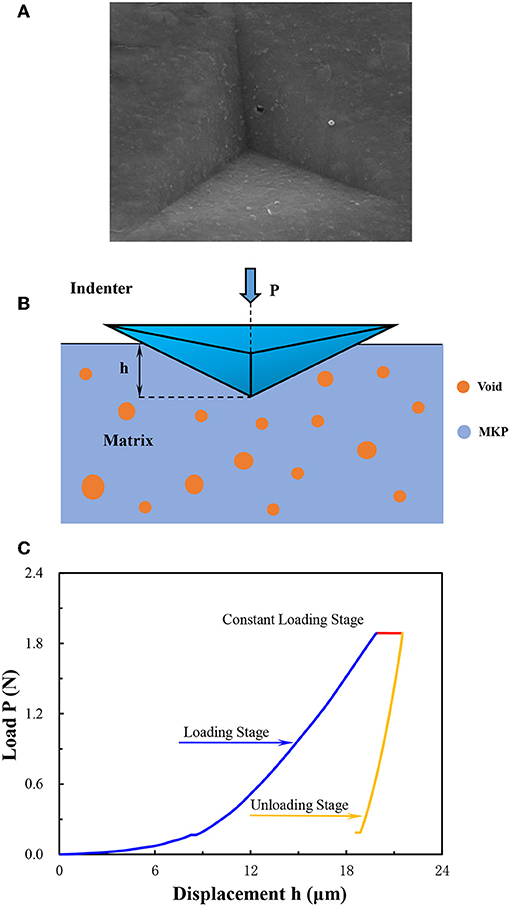
Figure 1. (A) A typical SEM image of the nanoindentation; (B) The schematic diagram of nanoindentation; (C) The typical load-displacement curve of nanoindentation.
Random Aggregate Placement Method
In the mesoscopic numerical analysis of cement-based materials, it is important to study the numerical morphology and gradation of aggregates, pores and other phases, which directly affect the mechanical properties of the materials (Wang et al., 2016).
In order to improve the accuracy of numerical simulation in material mesomechanics, a 3D random concave-convex aggregate modeling method with grid pre-generated was proposed (Wang B. et al., 2018). Before placing the aggregate, grid partition was needed to record all node information and unit information in the model. In the three-dimensional polar coordinate system, the position of any point in space could be determined by three parameters r, θ, φ. It is impossible to use infinite number of spherical aggregate surface nodes in the numerical modeling. It is found through trial calculation that the spherical aggregate established by the following method could meet the calculation requirements: take r as the aggregate radius and take a point, respectively, at every 45° in the direction of θ and φ, forming an approximate spherical area composed of 26 points in the space. The three-dimensional spherical aggregate had a total of 26 nodes and the surface was divided into 48 triangular regions. The generation of the concave-convex aggregate could be achieved when the apex of each aggregate fluctuates randomly with respect to its initial position. After the single concave-convex aggregate was generated, the aggregate library could be generated according to the required gradation.
The flow path of placing aggregate was as follows (Wang B. et al., 2017): firstly, the aggregates to be placed were sorted according to the radius from large to small. Secondly, the central point of the non-throwing unit was selected to place aggregate based on whether there was a geometric boundary point inside the aggregate. If there were any, the placing failed. Thirdly, if the interior of the aggregate did not contain the geometric boundary point and the outer boundary element point of the delivered aggregate, the delivery was successful. Fourthly, when the delivery failed, the aggregate was rotated to continue judging and the position was reselected after a certain number of rotations. If all the delivery failed in the center position of all the non-throwing areas, the aggregate failed to be delivered. In order to prevent the delivery process from entering an infinite loop, the failed aggregate was stored in the specified set. Fifthly, the aggregate information was updated after delivering successfully. In this study, when the random aggregate placement method was adopted to establish the MKP nanoindentation model, the pores were regarded as the aggregates and put into the MKP matrix.
The Results of Experiments and Random Aggregate Placement
The Results of X-CT
A total of 15 indentation area on the MKP specimens was scanned by X-CT. Three hundred and twenty two-dimensional CT slices with the resolution of 1,000 × 1,000 pixels were obtained by each X-CT scan and the spatial resolution was 0.5 μm voxel. Then the images were processed by the AVIZO software to gain the structural distribution characteristics and volume fraction of each phase in each indentation area. Subsequently, the tetrahedral mesh generated by AVIZO software was imported into ABAQUS software as the X-CT nanoindentation model of the MKP.
The X-CT images of the MKP was imported into the AVIZO software. Based on the difference of gray value between the MKP and pores, the slices were divided into two phases. Determining the threshold value of the phases was the premise to correctly distinguish MKP from pore. Therefore, a MKP particle with the size of about 3 mm was tested by mercury intrusion porosimeter (MIP) and X-CT, respectively. The porosity of the MKP particle was 28.43% from the MIP. Then the threshold of the X-CT slices of the particle was debugged. It was found that when the parts with the gray range of 0–149 and 149–207 were adopted to divide the pores and the MKP, the voxel number of the MKP and the pores were 5.33E8 and 2.12E8. So, that is to say, the porosity of the MKP particle is 2.12E8 ÷ (2.12E8 + 5.33E8) = 28.46%, which was almost consistent with the test result. Therefore, the gray threshold of distinguishing the MKP from pore was 149. For example, the gray value 149 was used as the threshold to divide the MKP and pores, when the X-CT data of the P14 indentation point region was processed. The 160th slice of the P14 indentation point is shown in Figure 2A. The dark gray area was the pores and the light gray area was the MKP. Figure 2B displays the result of the threshold segmentation of the 160th slice, where the red part indicates pores and the blue part represents the MKP. The distribution characteristics of the pores in the P14 indentation point are shown in Figure 2C and the green curve in Figure 2D denotes the statistical pore size distribution. The yellow curve in Figure 2D displays the pore distribution function curve, which will be discussed in detail in section The Effect of Porosity on the Damage Factor. Additionally, the voxel number of the two phases was 2.9412E8 and 2.528E7, respectively. In other words, the volume fractions of the MKP and pores after the threshold segmentation were 2.9412E8 ÷ (2.9412E8 + 2.528E7) = 92.1% and 2.528E7 ÷ (2.9412E8 + 2.528E7) = 7.9%, respectively. Similarly, the porosity of each indentation point region could be obtained. There were 15 indentation points numbered P11-P35, as shown in Table 1.
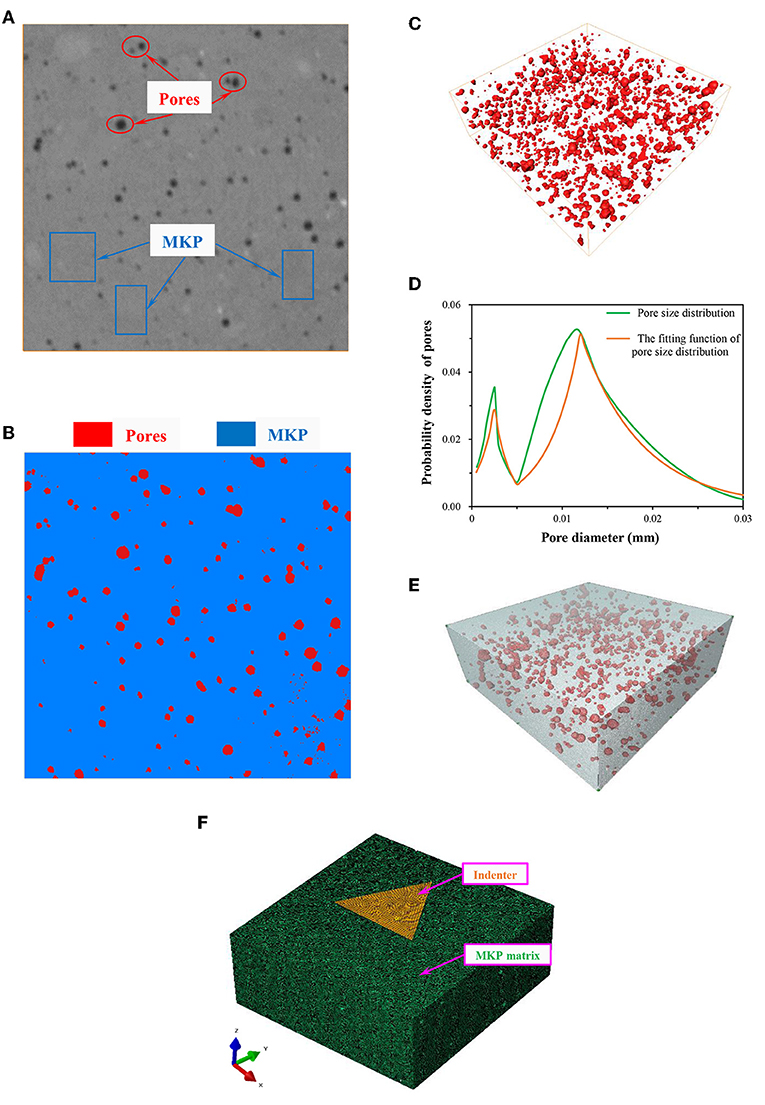
Figure 2. The modeling process of P14 indentation point based on X-CT (A) the 160th slice of the P14 indentation point; (B) the result of the threshold segmentation of the 160th slice; (C) the distribution characteristics of the pores; (D) the pore size distribution curve; (E) the tetrahedral meshes based on the X-CT model; (F) The X-CT nanoindentation model of the MKP.
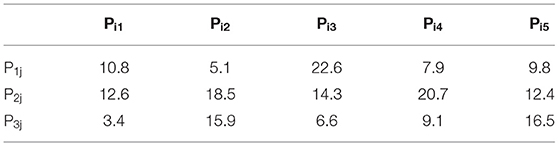
Table 1. The porosity of 15 indentation points (%).
Finally, the tetrahedral meshes were generated based on the X-CT model, as shown in Figure 2E, in which the gray portion indicates the MKP and the red portion represents the pores. The tetrahedral mesh model was imported into the finite element software ABAQUS and then the pore set was deleted. The remaining MKP set was used as the compressive matrix of the nanoindentation model. A triangular pyramid model with a height of 30 μm was established by CAD and imported into the finite element software ABAQUS as the indenter of the nanoindentation model. The X-CT nanoindentation model of the MKP was obtained by assembling the MKP matrix with the triangular pyramid indenter, as shown in Figure 2F, where the green part represents the MKP matrix and the yellow part denotes the triangular pyramid indenter. When the indenter was assembled with the MKP substrate, the upper surface of the triangular pyramid indenter was parallel to the upper surface of the MKP substrate, in which the central axes of the indenter and the MKP substrate were coincident. Additional details on the X-CT nanoindentation model were discussed in section Simulation Based on X-CT Results.
The Results of Nanoindentation
In this study, 15 marked areas were selected on the MKP specimens for nanoindentation test and the indentation points were numbered P11-P35 with the elastic modulus and the peak loads shown in Table 2. There are two data at each indentation point, the elastic modulus and the peak loads, respectively. For example, the data “22.52, 1.91” for the indentation point P11 indicates that the elastic modulus and the peak load at the indentation point P11 are 22.52 GPa and 1.91 N, respectively. It can be seen that the elastic modulus of all the indentation points are in the range of 17.66–26.14 GPa. The average elastic modulus of the indentation points is 21.91 GPa. Besides, the peak loads fluctuate in the range of 1.57–2.23 N and the average peak load is 1.88 N. The fluctuations of the elastic modulus and the peak loads are mainly caused by the difference in volume fraction and distribution characteristics of the matrix and pores in each indentation area.
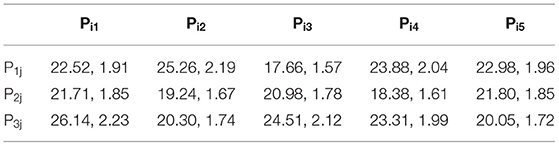
Table 2. The elastic modulus (GPa) and peak loads (N) of nanoindentation points.
The Results of Random Aggregate Placement
First, a matrix part of 500 × 500 × 160 μm was built in ABAQUS and was meshed with the grid unit size of 1.5 μm and the element type of linear hexahedral elements C3D8R. Then, based on the random aggregate placement method (RAP), the RAP nanoindentation model of the P14 indentation point was established. The pores were randomly placed in the matrix part and the porosity was set to 7.9%. Thus, the RAP nanoindentation model corresponding to the X-CT nanoindentation model was obtained. As shown in Figure 3A, the blue part indicates the MKP set and the white part represents the pores set. Subsequently, the pore set was deleted and the remaining MKP matrix was assembled with the triangular pyramid indenter. Hence, the RAP nanoindentation model of the P14 indentation point was displayed in Figure 3B, where the blue part denotes the MKP matrix and the yellow part indicates the triangular pyramid indenter. When the indenter was assembled with the MKP substrate, the upper surface of the triangular pyramid indenter was parallel to the upper surface of the MKP substrate, in which the central axes of the indenter and the MKP substrate were coincident. Additional details on the model were discussed in section Simulation Based on the Random Aggregate Placement Method (RAP). Similarly, the RAP nanoindentation models of other indentation points were obtained.
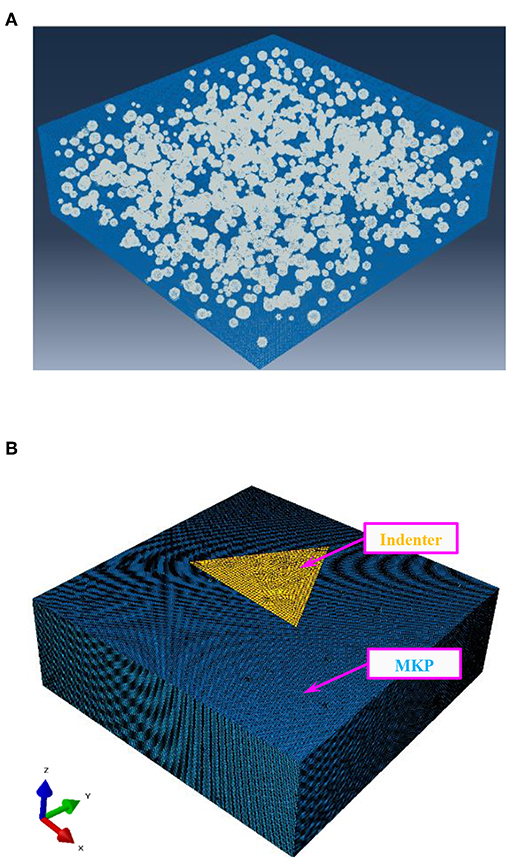
Figure 3. The modeling process of P14 indentation point based on RAP (A) the distribution characteristics of the pores; (B) the RAP nanoindentation model of the MKP.
Simulation Based on X-CT Results
In section Simulation Based on X-CT Results, the nanoindentation test of the MKP was simulated based on the X-CT nanoindentation model. Firstly, the input parameters and boundary conditions of the X-CT model were determined. Secondly, considering the effect of pores on damage, the modified MKP constitutive relation was proposed and input into the X-CT nanoindentation model. Then, the equations of influence of porosity and pore distribution on the damage factor were proposed. Finally, the correctness of the modified damage factor equation was verified with the average relative error of 3.2% by comparing the numerical results with the experimental results.
The X-CT Nanoindentation Model
The Input Parameters and Boundary Condition
Since the elastic modulus of the diamond indenter was much larger than the elastic modulus of the MKP, the deformation of the indenter during the indentation process was negligible. Consequently, the indenter in the nanoindentation model was set as a rigid body without deformation and was meshed with the mesh size of 5 μm. During the contact between the indenter and the MKP, the contact surface was assumed to be smooth. Material properties were the extremely critical input parameters for the finite element model. Material parameters were not required for the indenter as a rigid body. The material properties of the MKP were verified in the previous paper: the density was 1.864 g/cm3, the elastic modulus was 37.3 GPa, the Poisson's ratio was 0.2, and the compressive strength and tensile strength were 75.6 and 11.3 MPa, respectively (Li et al., 2018a). The above MKP material parameters were input into the nanoindentation model.
In the X-CT nanoindentation model, the six degrees of freedom of all nodes on the bottom surface of the MKP substrate were limited to zero, indicating that it was completely fixed, while the nodes of the other five surfaces were not limited. Five degrees of freedom of the indenter was restricted except Z direction, so they could only move in the directions of loading and unloading. Besides, the tip of the rigid indenter was regarded as a reference point applied with a displacement of about 20 μm. The model was solved by ABAQUS dynamic analysis with the total running time of 1.4 × 10⁻⁶. The loading time-amplitude conformed to the following rules. When the time was between 0 s and 10−6, the indenter was in the loading stage with the displacement from 0 to 20 μm. When the time was in the range of 10−6 to 1.1 × 10⁻⁶, the indenter was in the constant loading without movement. During the period of 1.1 × 10⁻⁶ to 1.4 × 10⁻⁶, the indenter was in the unloading phase with the displacement reducing from 20 to 16.2 μm. The relationship between amplitude and time is as follows:
when t ≤ 10−6,
when 10−6 < t < 1.1 × 10⁻⁶,
when 1.1 × 10⁻⁶ < t < 1.4 × 10⁻⁶,
where A is the amplitude, t represents time.
The Constitutive Relation of the MKP
The MKP constitutive relation was plastic damage model and determined in previous studies (Li et al., 2018a) as follows:
when ε < 0.4εc,
when 0.4εc ≤ ε ≤ εc,
when ε > εc,
where subscript c indicates “compressive,” εc is the corresponding peak compressive strain, fc denotes the compressive strength of the MKP, namely 75.6 MPa.
when ε ≤ εt,
when ε > εt,
where subscript t indicates “tensile,” εt is the corresponding peak tensile strain, ft denotes the peak tensile strength of the MKP, namely 11.3 MPa.
Damage Factor of the MKP and Simulation Results
According to the literature (Birtel and Mark, 2006), the classical damage factor can be calculated from Equations (12)–(14):
where d indicates the damage factor of the MKP, σ is the stress, E represents the elastic modulus, εin and εpl denote the inelastic strain and the plastic strain, b is the constant (bc = 0.7, bt = 0.1), subscript c and t indicate “compressive” and “tensile,” respectively.
Since the elastic modulus of MKP is 37,300 MPa, the compressive and tensile damage factor of the MKP are expressed as:
where the relationship between σ and ε can be calculated from Equations (6)–(11) in section The Constitutive Relation of the MKP. Thus, the curve of the classical damage factor is shown as the blue curves in Figure 4.
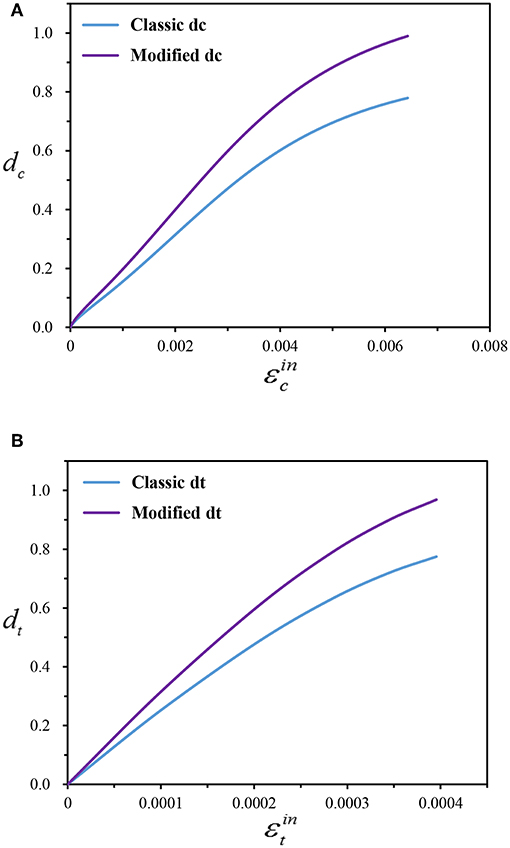
Figure 4. The curves of compressive and tensile damage factors: (A) the compressive factor (B) the tensile factor.
The above boundary conditions, MKP material parameters, constitutive relations and damage factors were input into the X-CT nanoindentation model of the P14 indentation point. Then the simulated load-displacement curve based on the classical damage factor were expressed as the red curve in Figure 5, in which the simulated peak load is 2.25 N. The blue curve in Figure 5 indicates the test load-displacement curve with a peak load of 2.04 N. The relative difference was used to compare the simulated peak loads with the experimental peak loads, defined as
where LE indicates the experimental peak load, LS is the simulated peak load. It can be seen that the relative error of the peak load of the classical simulation is 10.3% and the classical simulated load-displacement curve is above the experimental curve. The poor simulation result was because the classical simulation did not consider the damage contributed by the pores. Since the matrix in the nanoindentation model contained two phases: the MKP and pores, the pores inevitably affected the simulation results, so the influence coefficient of the pores on the damage factor was introduced as χ. Then the modified damage factor considering the influence of the pores was expressed as
The influence coefficient of P14 indentation point was debugged. It was found that the simulation result with the influence coefficient χ 1.262 was the closest to the experimental result. The modified damage factor with the influence coefficient of 1.262 is shown as the purple curve in Figure 4 and the yellow curve of Figure 5 displays the modified simulated load-displacement curve. The modified simulated peak load was 2.11 N with the relative error of only 3.4%. The modified simulation accuracy was greatly improved, indicating that it was necessary to consider the influence of pores on the damage. The modified simulated nephogram is shown in Figure 6.
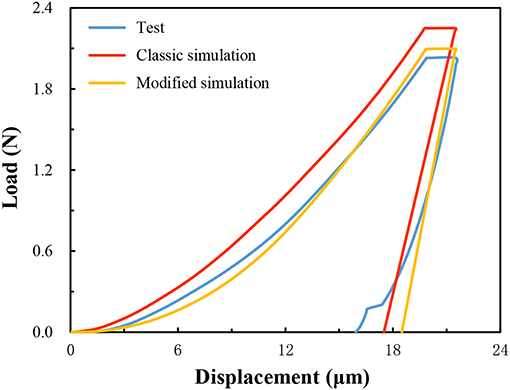
Figure 5. Comparison of the load-displacement curves of P14 indentation point between experimental results and simulation results.
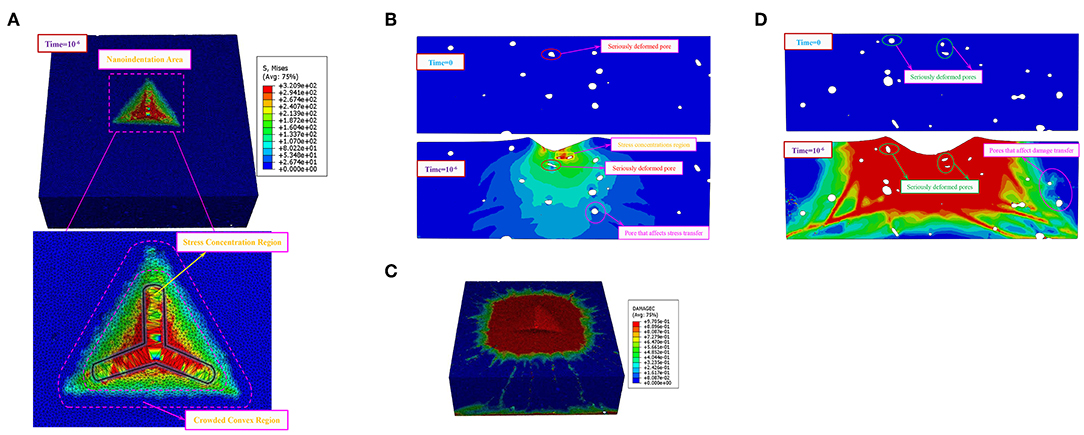
Figure 6. The modified simulated nephogram of P14 (A) the stress distribution of the model (B) the stress distribution of the middle section in the X direction (C) the distribution of the compressive damage of the model (D) the compressive damage distribution of the middle section in the Y direction.
Figure 6A shows the simulated stress nephogram of the model at the time 10−6. It can be seen that the shape of the indentation area is a triangular pyramid and the mesh deformity in contact with the three edges of the indenter is severe due to the stress concentration. The stress at the bottom of the indentation area is larger and the upward stress decreases gradually. As a result of the extrusion of the indenter, the upper end of the indentation region produces a crowding effect. The stress distribution of the middle section in the X direction is displayed in Figure 6B at time 0 and 10−6, respectively. It can be seen that the stress in the lower part of the indenter is larger and gradually decreases toward the far side. The stress nephogram shows an elliptic shape and extends outward in layers. During the loading process, the pores in the lower region of the indenter were squeezed and seriously deformed, such as the red marked pores being extruded from the initial quasi-circular into a long strip. In addition, the existence of pores may result in stress concentrations, just as the sudden increase of stress around the pore marked with yellow. Moreover, pores may affect the path of stress transfer. For instance the pink marked pore hindered the development of stress. Figure 6C is the distribution of the compressive damage of the model when the time is 10−6. It is observed that the element damage in the larger area around the indenter is serious, that is to say, the pressing of the indenter greatly affects the stress state of the surrounding area. Figure 6D displays the distribution of the compressive damage in the middle section of the Y direction at time 0 and 10−6, respectively. It can also be seen that the loading of the indenter leads to severe distortion of the pores, such as the green marked pores being significantly flattened. In addition, the development of damage may be affected by the pores, such as the damage transmission path in pink marked area was affected by the pores.
It was the same as the process of debugging the influence coefficient of P14 indentation point with the influence coefficient of 1.262 in the fourth paragraph of this subsection. The influence coefficient of the porosity of the other indentation point model on the damage factor was debugged, thereby making the simulation results most consistent with the experimental results. Thus, the optimal influence coefficient values and the optimal simulated peak loads of each indentation point were obtained as shown in Table 3. There are two data at each indentation point, the optimal influence coefficient values and the optimal simulated peak loads, respectively. For example, the data “1.248, 1.84” for the indentation point P11 indicates that the optimal influence coefficient value and the optimal simulated peak load at the indentation point P11 are 1.248 and 1.84 N, respectively. The average relative error of the peak load simulated by the X-CT nanoindentation model was 3.8%, which indicates that the accuracy of the model was greatly improved after debugging the optimal influence coefficient.
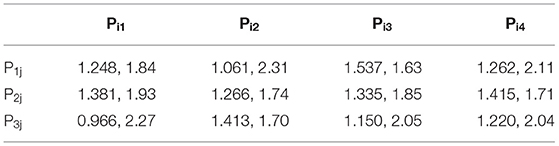
Table 3. Optimal influence coefficient χ and simulated peak loads (N) for each indentation point.
The Effect of Porosity and Pore Distribution on the Damage Factor
The influence of pores on the damage factor came from two aspects: on the one hand, the larger the porosity was, the greater the damage factor was. On the other hand, under the same porosity, different pore distributions led to differences in damage factors. Therefore, the total influence coefficient χ of pores on the damage factor was a comprehensive reflection of the influence of porosity and pore distribution. Then, the influence coefficient of porosity and pore distribution on the damage factor were defined as β and λ, respectively. Thus, the relationship of the three coefficients was assumed to be:
Considering the influence of porosity and pore size on the damage factor, the modified MKP damage factor is expressed as follows:
After obtaining the total pore influence coefficient of 12 indentation points, the effects of porosity and pore distribution on the damage factors were further discussed.
The Effect of Pore Size Distribution on the Damage Factor
The strength of the material was affected not only by the porosity, but also by the pore distribution. The pore structure of the material was complex and the pore size reflected the dominant characteristics of the pore structure (Hou et al., 2019). Therefore, the pore size was selected as an important factor affecting the damage factor. Considering the distribution and contribution of pore size, the effect of pore distribution on the damage factor was defined as λ.
First, the actual pore size distribution of the material was complex. Previous studies indicated that the pore distribution functions of cement-based materials and rock masses were similar, which all had an exponential function distribution (Ju et al., 2008). It was also assumed that the pore size distribution of MKP conformed to the exponential function distribution, as shown in Equation (23):
where D indicates the pore size (mm), E and F represent the parameter of the exponential function. The values of the parameters E and F can be solved by fitting the hole structure results based on the X-CT statistics.
Secondly, gray correlation analysis was a good method to reflect the correlation between various factors, which could be used to study the influence of pore size on strength. The correlation value had a power function relation with pore size. The larger the pore size was, the lower the strength of the material was Zhang and Zhang (2007); Li et al. (2018b). In addition, the influence coefficient was zero when the pore size was zero. Therefore, the influence function of pore size was assumed to be:
where λ(D) is the influence coefficient associated with the pore size, G and H denote the parameter of the influence function. By fitting the relationship between the strength and the test results of pore structure with gray correlation analysis, the values of the parameters G and H can be determined.
Combining the MKP pore distribution function with the pore size influence function, the influence coefficient of the pore size distribution on the damage factor was obtained as follows:
where λ is the influence coefficient depending on the pore size distribution, Dmin and Dmax indicate the minimum diameter and the maximum diameter (mm) of the pores, respectively.
Due to the complexity of the integration process, the Equation (25) was substituted by the Equation (26) for the sake of simplicity:
where ci and λi represent the porosity and the influence coefficient of the i-th interval when the pore size range is divided into n intervals. ci is related to the pore size distribution, namely, . The value of λi is the influence coefficient of the pore median of the i-th interval. c indicates the total porosity, namely, . The smaller the interval is, the closer the Equation (26) is based on the Equation (25).
The Effect of Porosity on the Damage Factor
According to the porosity results based on X-CT statistics, the porosity of the MKP nanoindentation area was between 3 and 23%. Therefore, the maximum porosity in this study was considered as 30%. According to the pore distribution curve of P14 in Figure 2D, the pore distribution function of the P14 indentation point was fitted as shown in the Equation (27). The yellow curve in Figure 2D displays the pore distribution function curve.
According to the Equation (27), the pore size range was divided into nine intervals, as listed in Table 4. The grading porosity indicates the percentage of the pore volume fraction in this interval. The regression values of the parameters G and H in Equation (21) were 2.4 and 0.18, respectively, by fitting the relationship between the load and the pore distribution of each indentation point. The parameters λ1, λ2, λ3, λ4, λ5, λ6, λ7, λ8, and λ9 were determined as 0.745, 0.878, 0.976, 1.052, 1.102, 1.137, 1.170, 1.207, and 1.253, respectively, according to the Equation (26). Thus, the influence coefficient λ of the pore distribution was 1.06. Because the total pore influence coefficient χ of P14 was 1.262, the influence coefficient β of porosity on damage was 1.191 according to the Equation (21). Similarly, the influence coefficient of the porosity of each indentation point could be obtained as Table 3. Figure 7 displays the scatter plot about the coefficient β and the porosity. Then the relationship between the porosity and the influence coefficient β was gained by fitting the scatter plot:
where c denotes the porosity, R2 represents the correlation coefficient of the fitted equation. The R2-value is 0.98, which means that the fitted curve has high accuracy.
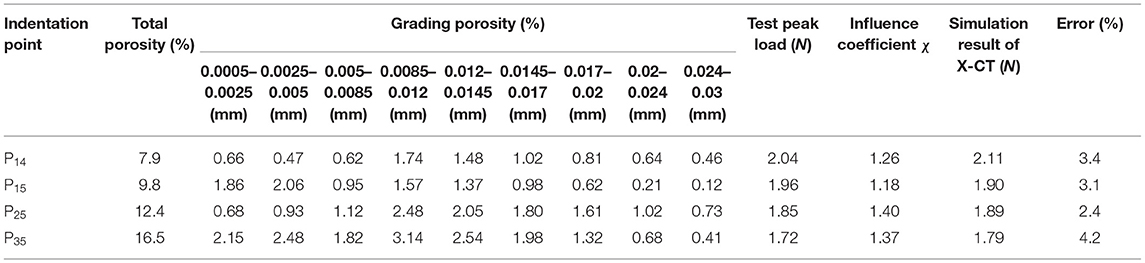
Table 4. Simulation result after considering the pores influence.
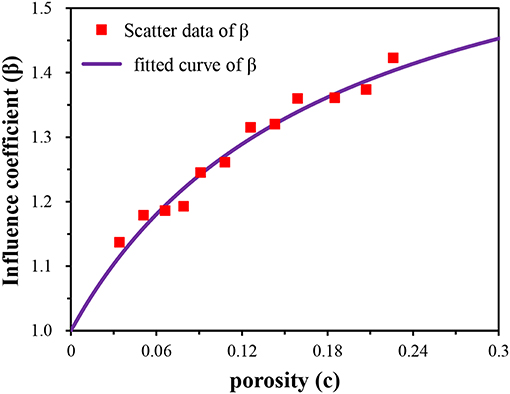
Figure 7. The scatter plot about the coefficient β and the porosity.
Considering the influence of porosity and pore size on the damage factor, the modified MKP damage factor is expressed as follows:
Verification of the Modified Damage Factor Equation
The damage factors calculated by Equations (29) and (30) were input into the X-CT nanoindentation model and the three indentation points of P15, P25, and P35 were simulated, respectively, to verify the accuracy of the modified damage factor equation. Table 4 shows some input parameters and simulation results. The simulated peak loads of the three indentation points were 1.90, 1.89, and 1.79 N with the relative errors of 3.1, 2.4, and 4.2%, respectively. The average relative error was 3.2%. Thus, the assumptions that the relationship between the influence coefficient β and λ, the MKP pores conforms to the exponential distribution and the influence function of the pore size distribution were correct. That is, the modified damage factor equation considering the pores influence was valid.
Simulation Based on the Random Aggregate Placement Method (RAP)
Verification of the RAP Nanoindentation Model
The nanoindentation test of P14 was simulated based on the random aggregate placement method (RAP). The relevant parameter settings for the RAP nanoindentation model were identical to those of the X-CT nanoindentation model in section The X-CT Nanoindentation Model. The MKP material properties were the same as those of the X-CT model: the MKP density was 1.864 g/cm3, the elastic modulus was 37.3 GPa, the Poisson's ratio was 0.2, and the compressive strength and tensile strength were 75.6 and 11.3 MPa, respectively. Besides, the same boundary conditions were set: the bottom of the matrix was fixed and the indenter could only move in the Z direction. Additionally, the modified damage factor considering the pores were input into the RAP model. Finally, the simulated peak load of P14 by the RAP model was 2.17 N with the relative error of 6.4%. The simulated nephogram of the RAP model is displayed in Figure 8.
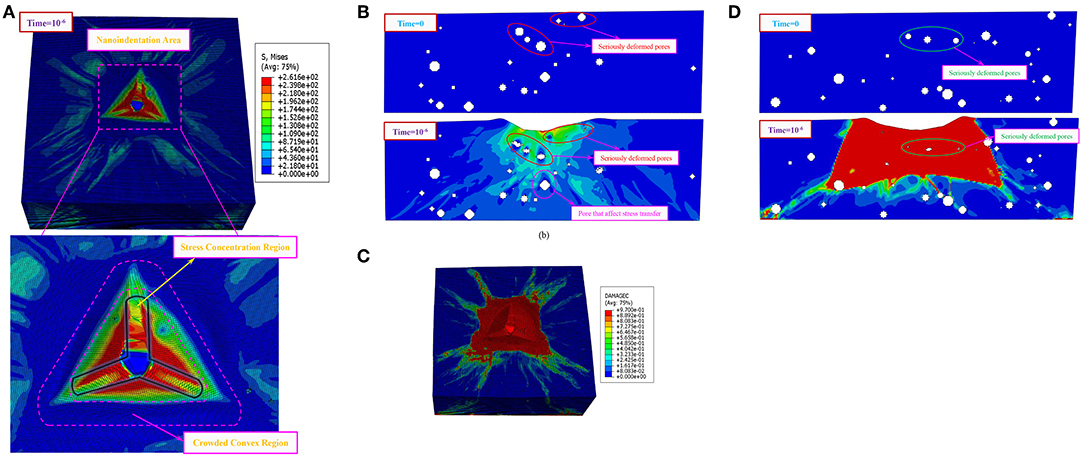
Figure 8. The simulated nephogram of P14 by the RAP model (A) the stress distribution of the model (B) the stress distribution of the middle section in the X direction (C) the distribution of the compressive damage of the model (D) the compressive damage distribution of the middle section in the Y direction.
It can be seen that the RAP nanoindentation model also exhibited stress concentration, severe mesh deformity and crowding effect. In addition, the pores in the lower region of the indenter were seriously deformed and the pores affected the transmission of stress and damage. That is to say, the simulation results of the RAP nanoindentation model were consistent with those of the X-CT model. According to the above steps, the simulation results of P15, P25, P35 were obtained by the RAP model, listed in Table 5. It was calculated that the average relative error of the peak load of was 5.9%, which verified the validity of the RAP nanoindentation model.
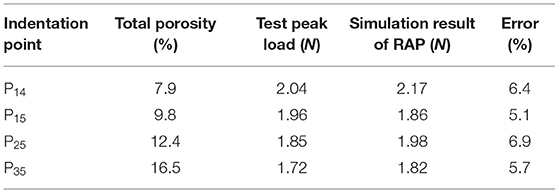
Table 5. The simulation results of the RAP nanoindentation model.
Prediction of Nanoindentation Test
The pore distribution certainly affected the results of the nanoindentation test, but it was difficult to find the indentation points with the same porosity in the X-CT model to study the effect of the pore distribution on the results alone. Therefore, the RAP model can be used to study the effect of pore distribution by controlling both porosity and pore distribution characteristics. The effect of the pore distribution on the total influence coefficient and peak load was predicted with the same porosity of 9% and the influence function k(D) = 2.45D0.18. Firstly, the pore distribution was in the range of 0.0005–0.03 mm. Then, the pore distribution dominated by small pores, medium pores and large pores were, respectively, set, listed in Table 6. Subsequently, according to Equations (29) and (30), the total influence coefficient and peak load prediction results are exhibited in Table 6 and Figure 9 displays the simulated displacement-load curve. It can be seen that at the same porosity, with the increase of the distribution of the large pore size, the total influence coefficient of MKP increased, the peak load decreased and the load-displacement curve as a whole was lower. It indicated that the effect of pore size on peak load should not be neglected.
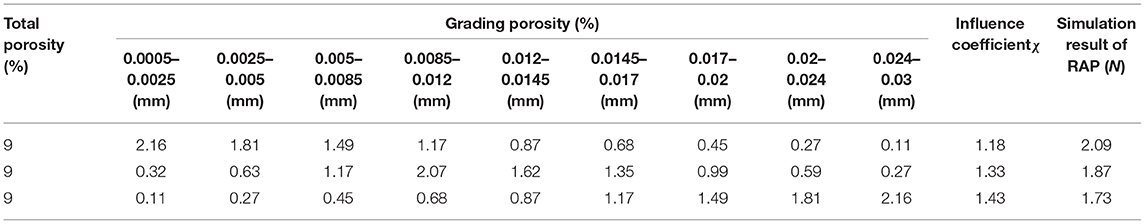
Table 6. The prediction of the effect of pore distribution.
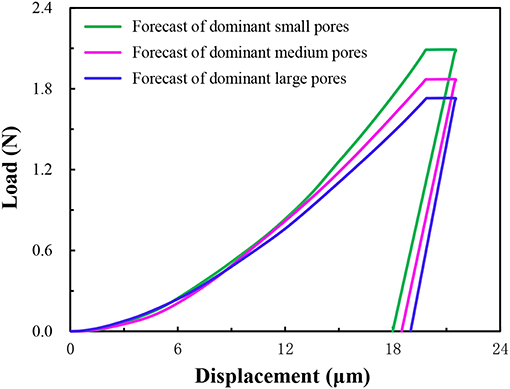
Figure 9. The simulated displacement-load curve.
Conclusions
In this study, the micro-mechanical properties and structural distribution characteristics of the MKP were investigated by nanoindentation and X-CT techniques. The MKP nanoindentation model was established based on X-CT and random aggregate placement method. The constitutive relationship of the MKP was modified considering the effects of porosity and pore distribution. The influence of pore distribution on the results was predicted by RAP model. The conclusions are as follows:
1. The elastic modulus of the indentation points of the MKP are in the range of 17.66–26.14 GPa with the average elastic modulus of 21.91 GPa while the peak loads of the indentation points fluctuate in the range of 1.57–2.23 N and the average peak load is 1.88 N.
2. The nanoindentation plastic damage model based on X-CT method can effectively describe the mechanical and deformation characteristics of the MKP.
3. The average relative error of simulated peak load is only 3.2% based on the X-CT model, which indicates that the hypothesis of the relationship between the influence coefficients β and λ, the MKP pores conforming to the exponential distribution and the influence function of pore size distribution are correct. That is, from the perspective of the damage factor, the modified mkp constitutive relation considering porosity and pore distribution is effective.
4. The mechanical and deformation characteristics of the MKP can also be described effectively by the RAP model, which verifies the valid of the modified constitutive relation of the MKP again.
Data Availability Statement
The raw data supporting the conclusions of this article will be made available by the authors, without undue reservation, to any qualified researcher.
Author Contributions
YL provided the research direction and funding equipment support. GZ was responsible for testing, simulating, and writing papers. ZW provided the detailed research ideas and suggestions for the research.
Funding
Beijing Municipal Project for Training Tens of Millions of Talent (No. 2018A37).
Conflict of Interest
The authors declare that the research was conducted in the absence of any commercial or financial relationships that could be construed as a potential conflict of interest.
Acknowledgments
The authors would like to acknowledge the financial support of National Natural Science Foundation of China (No. 51678011) and Beijing Municipal Project for Training Tens of Millions of Talent (No. 2018A37). Meanwhile, the authors would like to acknowledge the Avizo software package supported by Beijing Institute for Scientific and Engineering Computing, Beijing University of Technology.
References
Al-Amoudi, O. S. B. (2002). Attack on plain and blended cements exposed to aggressive sulfate environments. Cement Concrete Compos. 24, 305–316. doi: 10.1016/S0958-9465(01)00082-8
Birtel, V., and Mark, P. (2006). Parameterised Finite Element Modelling of RC Beam Shear Failure. Boston, MA: ABAQUS, Inc.
Buj, I., Torras, J., Rovira, M., and de Pablo, J. (2010). Leaching behaviour of magnesium phosphate cements containing high quantities of heavy metals. J. Hazard Mater. 175, 789–794. doi: 10.1016/j.jhazmat.2009.10.077
Chen, J. J., Sorelli, L., Vandamme, M., and Ulm, F.-J. (2010). A Coupled nanoindentation/SEM-EDS study on low water/cement ratio portland cement paste: evidence for C-S-H/Ca(OH)2 nanocomposites. J. Am. Ceram. Soc. 93, 1484–1493. doi: 10.1111/j.1551-2916.2009.03599.x
Covill, A., Hyatt, N. C., Hill, J., and Collier, N. C. (2011). Development of magnesium phosphate cements for encapsulation of radioactive waste. Adv. Appl. Ceram. 110, 151–156. doi: 10.1179/1743676110Y.0000000008
Du, Y.-J., Jiang, N. J., Liu, S., Jin, F., Singh, D. N., Puppala, A., et al. (2014). Engineering properties and microstructural characteristics of cement-stabilized zinc-contaminated kaolin. Can. Geotech. J. 51, 289–302. doi: 10.1139/cgj-2013-0177
Fan, C., Wang, B., and Zhang, T. (2018). Review on cement stabilization/solidification of municipal solid waste incineration fly ash. Adv. Mater. Sci. Eng. 2018, 1–7. doi: 10.1155/2018/5120649
Formosa, J., Lacasta, A. M., Navarro, A., del Valle-Zermeño, R., Niubó, M., and Rosell, J. R. (2015). Magnesium phosphate cements formulated with a low-grade MgO by-product: physico-mechanical and durability aspects. Constr. Build. Mater. 91, 150–157. doi: 10.1016/j.conbuildmat.2015.05.071
Han, J., Pan, G., and Sun, W. (2012). Elastic modulus change investigation of cement paste before and after carbonation using nanoindentation technique. Proc. Eng. 27, 341–347. doi: 10.1016/j.proeng.2011.12.461
Haque, M. A., and Chen, B. (2019). Research progresses on magnesium phosphate cement: a review. Constr. Build. Mater. 211, 885–898. doi: 10.1016/j.conbuildmat.2019.03.304
He, Y., Lai, Z., Yan, T., He, X., Lu, Z., Lv, S., et al. (2019). Effect of Cd2+ on early hydration process of magnesium phosphate cement and its leaching toxicity properties. Constr. Build. Mater. 209, 32–40. doi: 10.1016/j.conbuildmat.2019.03.075
Hou, D., Li, D., Hua, P., Jiang, J., and Zhang, G. (2019). Statistical modelling of compressive strength controlled by porosity and pore size distribution for cementitious materials. Cement Concrete Compos. 96, 11–20. doi: 10.1016/j.cemconcomp.2018.10.012
Ju, Y., Yang, Y., Song, Z., and Xu, W. (2008). A statistical model for porous structure of rocks. Sci. China Ser. E Technol. Sci. 51, 2040–2058. doi: 10.1007/s11431-008-0111-z
Li, D., Li, Z., Lv, C., Zhang, G., and Yin, Y. (2018a). A predictive model of the effective tensile and compressive strengths of concrete considering porosity and pore size. Constr. Build. Mater. 170, 520–526. doi: 10.1016/j.conbuildmat.2018.03.028
Li, Y., Bai, W., and Shi, T. (2017). A study of the bonding performance of magnesium phosphate cement on mortar and concrete. Constr. Build. Mater. 142, 459–468. doi: 10.1016/j.conbuildmat.2017.03.090
Li, Y., Li, Y., Shi, T., and Li, J. (2015). Experimental study on mechanical properties and fracture toughness of magnesium phosphate cement. Constr. Build. Mater. 96, 346–352. doi: 10.1016/j.conbuildmat.2015.08.012
Li, Y., Shi, T., and Li, J. (2016). Effects of fly ash and quartz sand on water-resistance and salt-resistance of magnesium phosphate cement. Constr. Build. Mater. 105, 384–390. doi: 10.1016/j.conbuildmat.2015.12.154
Li, Y., Zhang, G., Wang, Z., and Guan, Z. (2018b). Experimental-computational approach to investigate compressive strength of magnesium phosphate cement with nanoindentation and finite element analysis. Constr. Build. Mater. 190, 414–426. doi: 10.1016/j.conbuildmat.2018.09.145
Liang, S., Wei, Y., and Gao, X. (2017a). Strain-rate sensitivity of cement paste by microindentation continuous stiffness measurement: implication to isotache approach for creep modeling. Cement Concrete Res. 100, 84–95. doi: 10.1016/j.cemconres.2017.05.023
Liang, S., Wei, Y., and Wu, Z. (2017b). Multiscale modeling elastic properties of cement-based materials considering imperfect interface effect. Constr. Build. Mater. 154, 567–579. doi: 10.1016/j.conbuildmat.2017.07.196
Ma, H., Xu, B., and Li, Z. (2014). Magnesium potassium phosphate cement paste: Degree of reaction, porosity and pore structure. Cement Concrete Res. 65, 96–104. doi: 10.1016/j.cemconres.2014.07.012
Maldonado-Alameda, A., Lacasta, A. M., Giro-Paloma, J., Chimenos, J. M., and Formosa, J. (2017). Physical, thermal and mechanical study of MPC formulated with LG-MgO incorporating phase change materials as admixture. IOP Conf. Ser. Mater. Sci. Eng. 251:012024. doi: 10.1088/1757-899X/251/1/012024
Mestres, G., Fernandez-Yague, M. A., Pastorino, D., Montufar, E. B., Canal, C., Manzanares-Céspedes, M. C., et al. (2019). In vivo efficiency of antimicrobial inorganic bone grafts in osteomyelitis treatments. Mater. Sci. Eng C 97, 84–95. doi: 10.1016/j.msec.2018.11.064
Němeček, J., Šmilauer, V., and Kopecký, L. (2009). Characterization of alkali-activated fly-ash by nanoindentation. Nanotechnol. Constr. 3, 337–343. doi: 10.1007/978-3-642-00980-8_45
Oliver, W. C., and Pharr, G. M. (2011). An improved technique for determining hardness and elastic modulus using load and displacement sensing indentation experiments. J. Mater. Res. 7, 1564–1583. doi: 10.1557/JMR.1992.1564
Skarzynski, Ł., and Tejchman, J. (2016). Experimental investigations of fracture process in concrete by means of X-ray micro-computed tomography. Strain 52, 26–45. doi: 10.1111/str.12168
Stefanovsky, S., Yudintsev, S. V., Vinokurov, S. E., and Myasoedov, B. F. (2017). Chemical-technological and mineralogical-geochemical aspects of the radioactive waste management. Geochem. Int. 54, 1136–1155. doi: 10.1134/S001670291613019X
Sun, X., Dai, Q., and Ng, K. (2014). Computational investigation of pore permeability and connectivity from transmission X-ray microscope images of a cement paste specimen. Constr. Build. Mater. 68, 240–251. doi: 10.1016/j.conbuildmat.2014.06.049
Tan, Y., Yu, H., Li, Y., Wu, C., Dong, J., and Wen, J. (2014). Magnesium potassium phosphate cement prepared by the byproduct of magnesium oxide after producing Li2CO3 from salt lakes. Ceram. Int. 40, 13543–13551. doi: 10.1016/j.ceramint.2014.05.063
Vinokurov, S. E., Kulikova, S. A., Krupskaya, V., Danilov, S. S., Gromyak, I. N., Myasoedov, B. F., et al. (2018a). Investigation of the leaching behavior of components of the magnesium potassium phosphate matrix after high salt radioactive waste immobilization. J. Radioanal. Nucl. Chem. 315, 481–486. doi: 10.1007/s10967-018-5698-3
Vinokurov, S. E., Kulikova, S. A., and Myasoedov, B. F. (2018b). Magnesium potassium phosphate compound for immobilization of radioactive waste containing actinide and rare earth elements. Materials 11:E976. doi: 10.3390/ma11060976
Vinokurov, S. E., Kulikova, S. A., and Myasoedov, B. F. (2019). Solidification of high level waste using magnesium potassium phosphate compound. Nucl. Eng. Technol. 51, 755–760. doi: 10.1016/j.net.2018.12.009
Vinokurov, S. E., Kulyako, Y. M., Slyuntchev, O. M., Rovny, S. I., and Myasoedov, B. F. (2009). Low-temperature immobilization of actinides and other components of high-level waste in magnesium potassium phosphate matrices. J. Nucl. Mater. 385, 189–192. doi: 10.1016/j.jnucmat.2008.09.053
Walling, S. A., and Provis, J. L. (2016). Magnesia-based cements: a journey of 150 years, and cements for the future? Chem. Rev. 116, 4170–4204. doi: 10.1021/acs.chemrev.5b00463
Wang, B., Wang, H., Zhang, Z., and Zhou, M. (2018). Study on mesoscopic modeling method for three-dimensional random concave-convex concrete aggregate. Chin. J. Appl. Mech. 35, 1072–1076. doi: 10.11776/cjam.35.05.B062
Wang, B., Wang, H., Zhang, Z.-Q., and Zhou, M.-J. (2017). Mesoscopic modeling method of concrete aggregates with arbitrary shapes based on mesh generation. Chin. J. Comput. Mech. 34, 591–596. doi: 10.7511/jslx201705009
Wang, L., Yu, I. K. M., Tsang, D. C. W., Li, S., and Poon, C. S. (2017). Mixture design and reaction sequence for recycling construction wood waste into rapid-shaping magnesia–phosphate cement particleboard. Ind. Eng. Chem. Res. 56, 6645–6654. doi: 10.1021/acs.iecr.7b01175
Wang, P., Xue, Q., Li, J.-S., Zhang, T. T., Wang, S.-Y., Le, Z.-Z., et al. (2018). Factors affecting the leaching behaviours of magnesium phosphate cement-stabilised/solidified Pb-contaminated soil, part 1: water-to-solid ratio and Pb concentration. Int. J. Environ. Pollut. 63, 89–103. doi: 10.1504/IJEP.2018.093027
Wang, P., Xue, Q., Yang, Z., Li, J., Zhang, T., and Huang, Q. (2017). Factors affecting the leaching behaviors of magnesium phosphate cement-stabilized/solidified Pb-contaminated soil, part II: dosage and curing age. Environ. Progr. Sustain. Energy 36, 1351–1357. doi: 10.1002/ep.12588
Wang, X., Zhang, M., and Jivkov, A. P. (2016). Computational technology for analysis of 3D meso-structure effects on damage and failure of concrete. Int. J. Solids Struct. 80, 310–333. doi: 10.1016/j.ijsolstr.2015.11.018
Wang, X. H., Jacobsen, S., He, J., Zhang, Z. L., Lee, S. F., and Lein, H. L. (2009). Application of nanoindentation testing to study of the interfacial transition zone in steel fiber reinforced mortar. Cement Concrete Res. 39, 701–715. doi: 10.1016/j.cemconres.2009.05.002
Wang, Y. S., Dai, J. G., Wang, L., Tsang, D. C. W., and Poon, C. S. (2018). Influence of lead on stabilization/solidification by ordinary Portland cement and magnesium phosphate cement. Chemosphere 190, 90–96. doi: 10.1016/j.chemosphere.2017.09.114
Wei, Y., Liang, S., and Gao, X. (2017). Indentation creep of cementitious materials: experimental investigation from nano to micro length scales. Constr. Build. Mater. 143, 222–233. doi: 10.1016/j.conbuildmat.2017.03.126
Xu, S., Wu, X., Cai, Y., Ding, Y., and Wang, Z. (2018). Strength and leaching characteristics of magnesium phosphate cement-solidified zinc- contaminated soil under the effect of acid rain. Soil Sediment Contam. Int. J. 27, 161–174. doi: 10.1080/15320383.2018.1438364
Yang, L., Zhang, Y., Liu, Z., Zhao, P., and Liu, C. (2015). In-situ tracking of water transport in cement paste using X-ray computed tomography combined with CsCl enhancing. Mater. Lett. 160, 381–383. doi: 10.1016/j.matlet.2015.08.011
Yang, Y., Zhang, Y., She, W., Wu, Z., Liu, Z., and Ding, Y. (2018). Nondestructive monitoring the deterioration process of cement paste exposed to sodium sulfate solution by X-ray computed tomography. Constr. Build. Mater. 186, 182–190. doi: 10.1016/j.conbuildmat.2018.07.145
Zhang, M. (2017). Pore-scale modelling of relative permeability of cementitious materials using X-ray computed microtomography images. Cement Concrete Res. 95, 18–29. doi: 10.1016/j.cemconres.2017.02.005
Zhang, M., and Jivkov, A. P. (2016). Micromechanical modelling of deformation and fracture of hydrating cement paste using X-ray computed tomography characterisation. Compos. Part B Eng. 88, 64–72. doi: 10.1016/j.compositesb.2015.11.007
Zhang, Y., and Zhang, X. (2007). Grey correlation analysis between strength of slag cement and particle fractions of slag powder. Cement Concr. Compos. 29, 498–504. doi: 10.1016/j.cemconcomp.2007.02.004
Zhang, Z., Guo, G., Teng, Y., Wang, J., Rhee, J. S., Wang, S., et al. (2015). Screening and assessment of solidification/stabilization amendments suitable for soils of lead-acid battery contaminated site. J. Hazard Mater. 288, 140–146. doi: 10.1016/j.jhazmat.2015.02.015
Zhao, Q., Sun, W., Zheng, K., and Jiang, G. (2005). Comparison for elastic modulus of cement, ground granulated blast-furnace slag and fly ash particles. J. Chin. Ceram. Soc. 33:837. doi: 10.14062/j.issn.0454-5648.2005.07.009
Zheng, K., Sun, W., Lin, W., and Zhao, Q. (2008). Effects of blast furnace slag on micro-mechanical properties of interface transition zone. J. Nanjing Univ. Aero. Astr. 40, 407–411. doi: 10.16356/j.1005-2615.2008.03.021
Keywords: X-ray computed tomography, random aggregate placement method, damage factor, modified constitutive relation, pore distribution
Citation: Li Y, Zhang G and Wang Z (2020) Experimental-Computational Approach to Investigate Nanoindentation of Magnesium Potassium Phosphate Hexahydrate (MKP) With X-CT Technique and Finite Element Analysis. Front. Mater. 6:344. doi: 10.3389/fmats.2019.00344
Received: 09 November 2019; Accepted: 18 December 2019;
Published: 14 January 2020.
Edited by:
Dongshuai Hou, Qingdao University of Technology, ChinaCopyright © 2020 Li, Zhang and Wang. This is an open-access article distributed under the terms of the Creative Commons Attribution License (CC BY). The use, distribution or reproduction in other forums is permitted, provided the original author(s) and the copyright owner(s) are credited and that the original publication in this journal is cited, in accordance with accepted academic practice. No use, distribution or reproduction is permitted which does not comply with these terms.
*Correspondence: Zigeng Wang, emlnZW5nd0BianV0LmVkdS5jbg==