 Lisa McDonald
 Cristina Siligardi
 Marco Vacchi
 Adam Zieser1
 Mario Affatigato
- 1Center for the Study of Glass and Physics Department, Coe College, Cedar Rapids, IA, United States
- 2Department of Engineering Enzo Ferrari, University of Modena and Reggio Emilia, Modena, Italy
This research comes as part of a broader resurgence of study on the electrical conductivity of glasses—and the mechanism for electronic motion in the amorphous network—spurred by interest in using glasses as matrices for solid-state batteries, taking advantage of the glasses’ tailorable conductivity, chemical durability, and mechanical strength. The work presented in this study regards the preparation and characterization of some binary glasses belonging to the TeO2–V2O5 system. In particular, we focused on the glasses’ electrical conductivity at room temperature and at higher temperatures as a function of the V4+ ion content in the glass structure. The amount of V4+ in the glass was determined by a colorimetric method. Moreover, density and thermal properties (Tg, Cp) were measured, and scanning electron microscopy (SEM) and X-ray diffraction (XRD) measurements were performed as well.
Introduction
The strong demand for safe energy stimulates the scientific community to develop advanced materials able to be used in energy storage technology (Lebrun et al., 1990). Li-ion batteries represent the most promising electrical energy storage systems, but the existing limits in term of performance, safety, and cost lead to a critical socioeconomic impact. These limits encouraged the researchers of this study to investigate new solutions.
Among all possible matrices for solid-state batteries, glasses have recently attracted growing interest for their simple fabrication procedure, non-flammability, and the possibility to easily tune composition to obtain desired electrical properties. Another important aspect is related to the environmental sustainability of glass and glass-ceramics. In fact, the development of a glass or glass-ceramic battery would lead, with high probability, to the following:
• A complete recycling of the material; and
• A more predictable production efficiency, because glass does not require further processing operations.
Among the various material candidates for solid electrolytes in thin film batteries, the inorganic glasses are one frequently mentioned material. Oxide glasses have long been studied intensively because these glasses exhibit relatively stable chemical properties and can be easily made into thin films.
Several studies have been conducted so far to investigate the structure and electrical properties of tellurite glasses containing vanadium oxide as a dopant (low mol%) or as the active glass-forming component of the system (high mol%). Semiconducting behavior in these glasses is due to the transition metal ions (TMIs) being in more than one valence state (V4+ and V5+) (Dhawan et al., 1982), and the conduction takes place by electrons hopping from low- to high-valence sites. The charge transfer in such glasses is usually termed small polaron hopping (SPH) (Murawski et al., 1979; Souri, 2010), and the electrical conductivity strictly depends on the distance between these vanadium ions. Vanadium tellurite glasses generally change from a continuous tellurite network to a continuous vanadate network above 20 mol% of V2O5, whereas below 20 mol%, the three-dimensional tellurite networks are partially broken by the formation of TeO3 trigonal pyramids (Jayaseelan et al., 2004).
Previous research (Dimitriev et al., 1983; Barney et al., 2015) shows the binary tellurium vanadate glasses do indeed contain vanadium ions in two states: V4+ and V5+. As such, these glasses meet the general condition that TMIs be present in more than one valence state, and exploring this ratio is key to determining why these glasses display the conductivity they do. According to previous research (Baia et al., 2004), the increase of V2O5 concentration in binary tellurium vanadate glasses causes a significant change in the glasses’ physical properties, which could affect the percolation threshold. Specifically, the ratio of VO4 units to VO5 units increases as the percentage of V2O5 in the binary tellurium glass decreases. Additionally, Hoppe et al. (2002) showed TeO3 unit increase for glasses of higher V2O5 concentrations. How these structural changes impact the hopping distance between electron sites is investigated in this paper.
The work presented in this study regards the preparation and characterization of some binary glasses belonging to the TeO2–V2O5 system. In particular, we focus on the electrical conductivity at room temperature and at higher temperatures as a function of the V4+ ion content in the glass structure, determined via colorimetry. The amount of V4+ in the glass was obtained by a colorimetric method. Moreover, density and some thermal properties (such as Tg and Cp) were measured, and X-ray diffraction (XRD) and scanning electron microscopy (SEM) measurements were performed as well.
Experimental Methodology
Materials
Tellurium vanadate glasses prepared for these experiments were created using Te (Sigma-Aldrich, 99.99%), TeO2 (Sichuan Xinju Mineral Resource Development Co., 99.99%), and V2O5 (Sigma-Aldrich, 99.6%). Glasses were manufactured according to the following stoichiometries:
and
In the binary system, x (the molar fraction of tellurium dioxide) ranged from 0.40 to 0.70 in intervals of 0.10 (named A0.4, A0.5, A0.6, and A0.7, respectively). In the ternary system, z (the molar fraction of elemental tellurium) had values of 0.025, 0.05, 0.10, and 0.15 (named B025, B05, B10, and B15, respectively). The elemental tellurium was added in the second series to increase the amount of V4+ ions in the glass. The preparation of glasses was done as follows: 8 g of batch were mixed in an alumina crucible and subsequently put in a furnace at 850°C for 10 min. Then, each melt was poured and cooled through a steel plate quenching technique to obtain thin samples (thickness around 2 mm) so as to enhance electrical conductivity. Finally, each melt was annealed at 220°C for 30 min to relieve the thermal stress and to reduce the number of defects.
Experimental Measurements
Only the A glass series were fully characterized by using the following techniques because the Te° series (B glasses) tend to crystallize, increasing the metallic amount in the glass. The thermal behavior of each glass was measured using differential scanning calorimetry (DSC) analysis (Perkin Elmer Differential Scanning Calorimeter DSC 7) performed in air at the heating rate of 10°C/min on sample ground to an average particle size lower than 30 μm. The DSC measurements were carried out on ∼30 mg of powdered sample in a platinum crucible. The glass transition temperature (Tg) has been calculated as the cross point between the tangent on the initial straight line before baseline shifting and the tangent on the slope. The error on this measurement is equal to the sensitivity of the instrument (5°C).
The specific heat is calculated from DSC thermogram by using the following equation:
where
– ΔY is the difference in heat flow [W] at 100°C between the measure with the sample and the measure without the sample (baseline);
– m [mol];
– β is the heating rate [K/s]. In this work, β is 0.67 K/s (40 K/min).
Density was measured (McDonald, 2017) using a helium pycnometer with at least 1 cm3 of glass for each measure. Pycnometer testing was conducted with helium gas using the Quantachrome Micropycnometer MPY-2. Densities were determined for every tellurium vanadate glass. The estimated error in the density is approximately ±1.5%.
Structural properties were investigated through XRD (X’Pert PRO, PANalytical) by packing the finely ground both samples (A and B) into an aluminum sample holder at room temperature and scanning from 2θ = 10° to 75° with a step size of 0.01° 2θ in order to confirm the glassy nature of the studied samples.
The crystallized samples belonging to B series were attached on an aluminum disk by conductive adhesive tape and then coated by sputtering with a gold–palladium alloy. The polished surface of samples was analyzed by SEM (ESEM, Quanta 200, FEI), and the chemical composition was obtained by using energy-dispersive X-ray spectroscopy (EDXS; Oxford INCA-350).
The DC electronic conductivity of the glasses (for series A and B) was tested using a Keithley 6517B Electrometer/High Resistance Meter and a Rigol DS1052E Digital Oscilloscope. A sputter-coated gold guard was placed around the main electrode on each of the samples to avoid surface conduction. The binary system was tested using 100 V with alternating polarity to eliminate the impact of ionic motion, whereas the doped samples were tested using 10 V with alternating polarity due to their increased conductivities (Veatch, 2006).
Colorimetry testing (McDonald, 2017) was conducted using a PerkinElmer Lambda EZ 150 UV/VIS Spectrometer. The samples (A and B glasses) were powdered and dissolved in 0.2 M of sulfuric acid to produce a 0.05 M mixture. Standards of V4+ and V5+ were created from VO2 (Sigma-Aldrich, 99.99%) and V2O5 (Sigma-Aldrich, 99.6%), dissolved in 0.2 M of sulfuric acid. Standard measurements created a graph of absorbance to concentration. Using the standard form equations allowed the percentage of V4+ in the samples to be determined, with an estimated error of ±3.0%. The following standards were used:
• V4+ standards: 0.05, 0.025, 0.0125, 0.0025, and 0.00125 M
• V5+ standards: 0.1, 0.05, 0.025, 0.0125, and 0.0065 M
Both A and B samples were characterized using this procedure. It is important to note that the dissolution method does not alter the valence state of the vanadium ions. Various checks, carried out by Flynn (1977), bear this out. Two different tests—one in which the samples were heated for different times, and one in which a V4+-only sample was dissolved—were rerun, and they showed no evidence of valence state changes. Electron paramagnetic resonance (EPR) measurements on the same samples also showed no difference from the dissolution method results.
Results
All the glasses appeared dark colored (black), with smooth and shiny surfaces and apparently glassy. DSC thermograms (not shown) of the binary glass systems show only one crystallization peak. As reported in Table 1, both Tg and Tc temperatures tend to increase in a near liner manner with increasing TeO2 content. On the other hand, whereas Tg within the binary glasses increases from 231 to 263°C, the increase of the crystallization peak is more than 200°C for the same glasses. The Cp values show a slight decrease, dropping in value approximately 10% from sample A0.4 to sample A0.7.
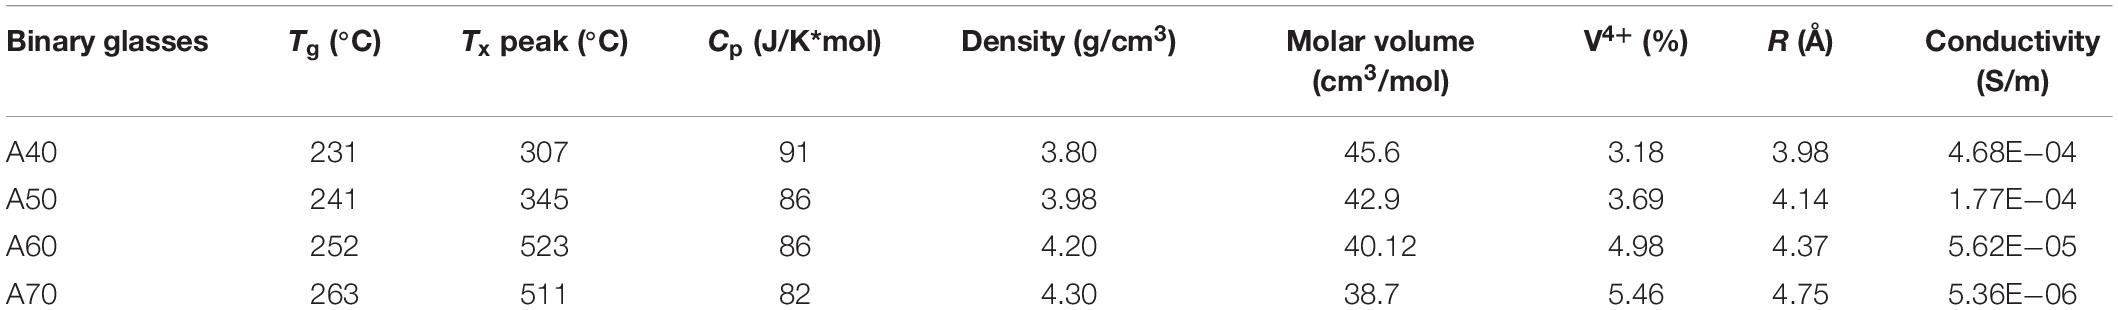
Table 1. Physical property results.
The density behavior of glass is generally explained in terms of the competition between the masses of the constituent ions and the volumes of the various structural groups present in it (Sidkey et al., 1997). Therefore, density is related to how tightly the atoms and atomic groups are placed together in the glass network. For the glasses considered in this paper, the density (ρ) increases systematically by substituting V2O5 with TeO2, as reported in Table 1. The obtained data are in excellent agreement with those reported in literature (El-Mallawany et al., 2010; Kjeldsen et al., 2014). The molar volume, in turn, decreases steadily from 45.6 to 38.7 cm3/mol.
The X-ray powder diffraction measurements confirmed the fully vitreous nature of all A samples (not shown) and the broad band detected in A samples at approximately 2θ = 27–30° are typical of a tellurite glass structure (Flynn, 1977; Dimltriev and Dimitrov, 1978), whereas for the B glasses (Figure 1), increasing the metallic Te°content resulted in the formation of a VO2 crystalline phase [International Centre for Diffraction Data (ICCD) no. 01-072-0514].
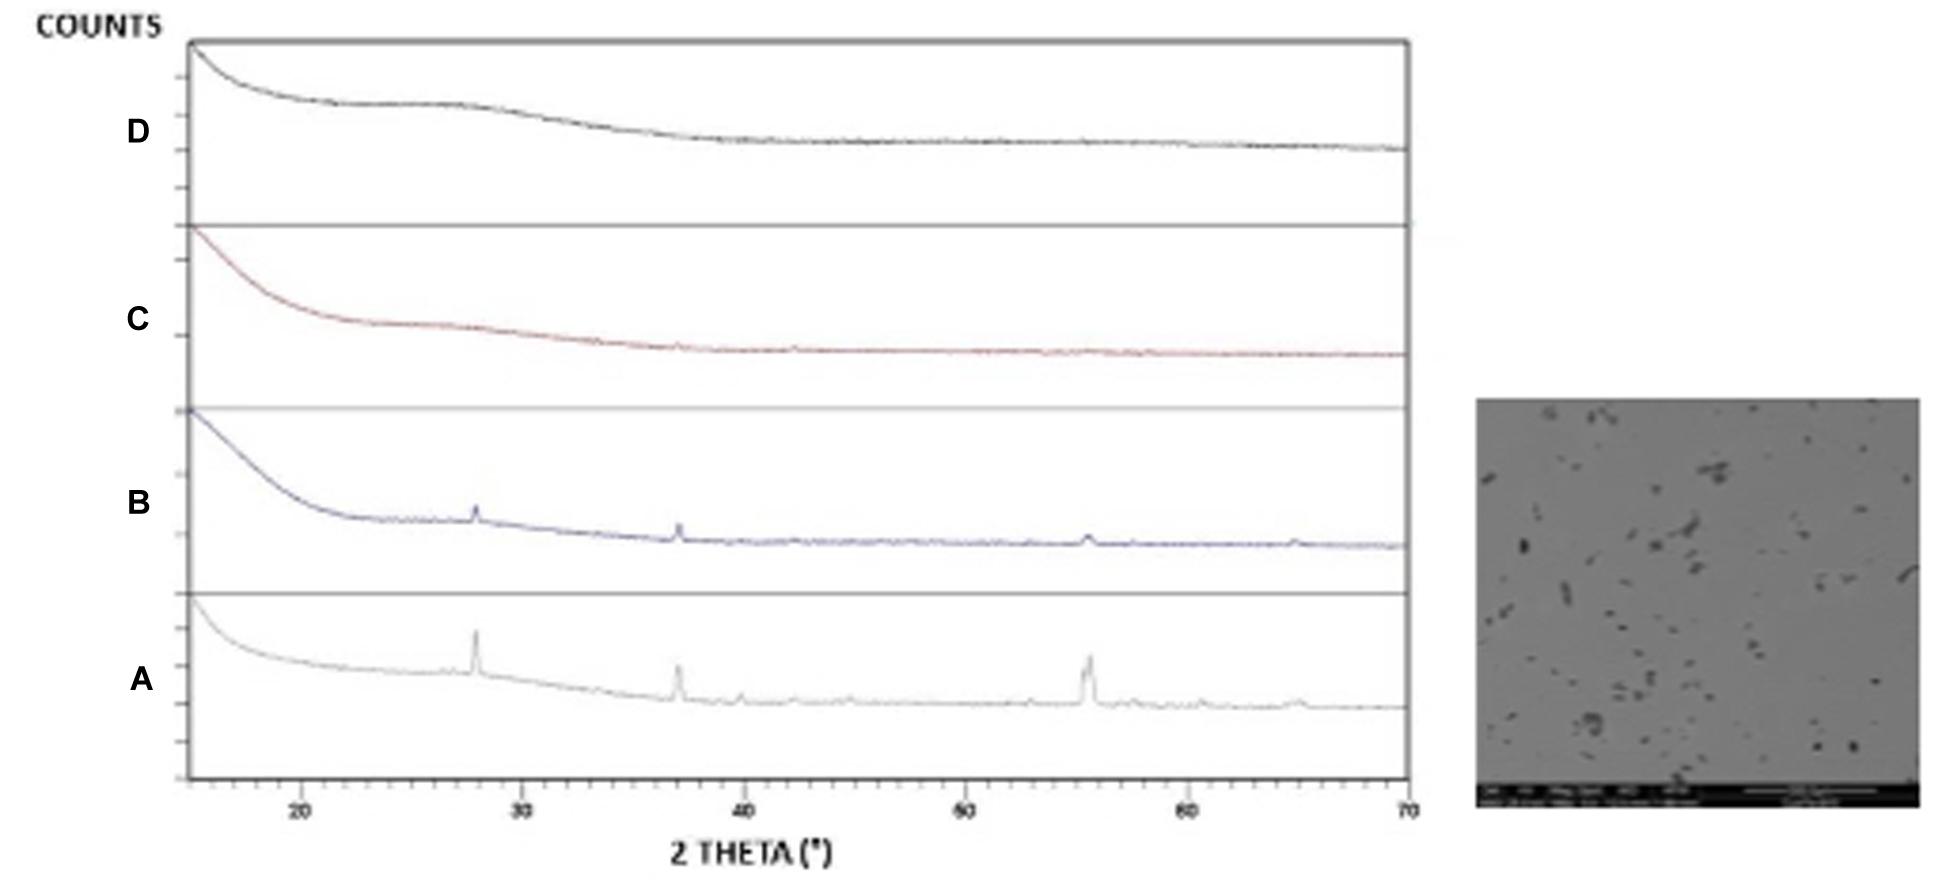
Figure 1. XRD patterns of B-serier glassses: (a) B15 and SEM IMAGe (b) B10 (c) B05 (d) B025 from (a) to (d) the amount of Te decreases.
SEM observations on polished B15 samples showed a crystalline phase (Figure 1). A more detailed analysis of the phenomenon indicates the formation of a fine dispersion of particles homogeneously distributed in the matrix (about 2 μm in diameter), which appear in dark color in the secondary electron (SE) detector. The energy-dispersive spectrometry (EDS) analysis of these particles showed a prevalence of V and O elements, whereas the surrounding glassy phase also contains tellurium oxide (not shown).
Colorimetry and conductivity tests were run on both the A and B series tellurium vanadate glasses, reported in Tables 1 and 2. These measurements produced a very clear result: as the percentage of tellurium increased in the binary (A series) glasses xTeO2⋅yV2O5, the ratio of V4+/Vtot also increased, going from 3% to almost 6%. This finding was supported by EPR data, as well as other academic papers (Baia et al., 2004). However, the conductivity of the binary glasses decreased, which was counter to the results observed by Flynn (1977), who showed that conductivity increased as the ratio V4+/Vtot increased.
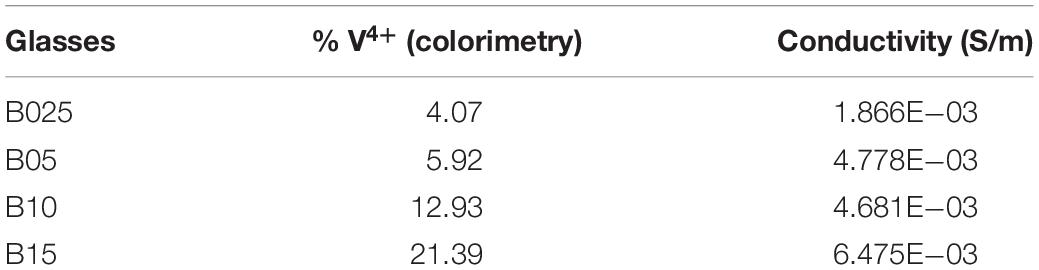
Table 2. V4+% versus conductivity of B-series glasses.
Discussion
When substituting V2O5 by TeO2, the Tg increases; this behavior can indicate more compact structural arrangements attributed to the increased polyhedral concentrations of TeO2. This supposition is confirmed by the decrease in molar volume. The increase in Tg implies an increase of the network rigidity, normally accompanied by an increase in the network bonds per unit volume. As the amount of tellurium oxide increases in the glass, it is indeed the case that the coordination number of the vanadium (NVO) increases (Hoppe et al., 2002) from 4.1, when x = 75 mol% of TeO2, to 5.0, when x = 96 mol% of TeO2. And this vanadium coordination increase is also accompanied by a growing tellurite fraction. As the Tg of a pure tellurite network is higher than that of a pure vanadate one, the simple replacement of vanadium glass-forming units (whether 4 or 5 coordinated) with tellurite ones will also contribute to a steady increase in the value of the Tg. Moreover, the replacements of V2O5 by TeO2 cause the formation of trigonal pyramids (Hoppe et al., 2002) joined vertex to vertex, which increases the glass rigidity.
As regards Cp, the trend is downward, a trend also reported by other authors (El-Mallawany, 2000). This trend is normally attributed to the lower degrees of freedom of the TeO4 trigonal bipyramids and the TeO3 trigonal pyramids (which also have two terminal oxygen atoms). As the amount of tellurium increases, the larger energy-storing vanadium contribution is decreased, and although the tellurium units become more coordinated, this change is not sufficient to compensate for the loss of the more highly coordinated vanadium molecular structures. Hence, the overall specific heat goes down.
According to preliminary visual inspections, the glasses generally appeared vitreous. The absence of peaks in the powder XRD patterns of A series confirmed the glassy state of all compositions. For the B glasses (Figure 1), XRD patterns of the B10 sample showed that a feeble crystallization is present and that increasing the amount of metallic Te° yields a VO2 crystalline phase, which is also confirmed through SEM observation on samples B10 and B15. The elemental tellurium added in Eq. 4 reduces some of the V2O5 by forming TeO2 in the melt via the reaction:
and the amount of crystalline phases increases (Figure 1).
Because the binary tellurium vanadate glasses had multiple variables beyond just the ratio of V4+/Vtot changing (like the amount of TeO2 to V2O5), we created several glasses holding the vanadium content steady so the only changing variable would be the ratio of V4+/Vtot. We accomplished this change in ratio by doping the binary system with pure tellurium to encourage the formation of V4+ ions rather than V5+ in the glass, via Eq. 4. Because the doped system xTe⋅yTeO2⋅(1−x−y)V2O5 introduced extra tellurium without added oxygen, it created more V4+ sites in the glass. More V4+ in the glass would normally allow more hopping opportunities for the electrons, which should increase conductivity. The (ternary) doped system held the vanadium oxide concentration constant at 0.60, while z = 0.025, 0.05, 0.10, and 0.15 [see stoichiometry (2)]. As hypothesized, increased concentrations of V4+ resulted in higher conductivity for the z = 0.025 and 0.05 samples. Although the samples with z = 0.10 and 0.15 have 12.93 and 21.39% V4+ content, respectively, they formed as crystals rather than glass. Previous papers observed that crystallization can cause a spike in conductivity (Hirashima et al., 1986; El-Mallawany, 2012), and these samples are unable to support or negate the hypothesis concerning the V4+/Vtot ratio effect on conductivity.
At this point, we can state that an increased V4+/Vtot ratio results in higher conductivity if it is the only variable changing. Because the conductivity decreased in the binary tellurium vanadate samples not held at a constant vanadium content, this observation led to a closer study of the glasses’ structure, namely, the hopping distances within the glass. Based on percolation theory (Frolov and Quinn, 2012), a system should demonstrate a significant drop in conductivity when the percolation threshold is crossed. Yet the conductivity decreases exponentially, without any sudden drops. We attribute this behavior to the corresponding increase in the hopping distance between vanadium sites as the tellurium content—which acts as a separator—is increased. Under these conditions, the percolation threshold does not stay constant across the binary tellurium vanadate system. To understand the conductivity, the hopping distance between sites (Frolov and Quinn, 2012) must be determined on a sample-by-sample basis rather than as an entire system.
where NA is Avogadro’s number. The results of the calculation (Table 1) do indeed point to a growing separation between the vanadium sites. As it is understood from the literature that the electronic hopping mechanism depends on the separation exponentially (Boutiche, 2001; Van Hapert, 2002), this can cause a severe decrease in the value of the conductivity. We note that this calculation is restricted to nearest-neighbor hopping, typically used for higher temperatures (as opposed to variable range hopping).
Thus, the explanation for the conductivity results can be attributed to the interacting variables of the ratio of V4+/Vtot and the increasing hopping distance between sites. Although increased amounts of V4+ will increase conductivity, this ability is offset by the fact the binary tellurium vanadate glasses obtain increased amounts of V4+ at the expense of increased hopping distances to the sites (and a decreased number of overall vanadium sites). Owing to this fact, it is difficult for percolation theory to provide an accurate model for this system.
Conclusion
The present work indicates that the electronic conductivity in tellurium vanadate glasses is due to a complex interplay between the changing populations of V4+ and V5+ ions—induced by the increase in the tellurium oxide concentration—and changes in the distances between the ionic hopping sites. The behaviors appear to run counter to one another, negating the overall impact on the conductivity. We also note that the formation of crystalline phases can add yet another element to the interpretation of the electron hopping, as it is likely to form crystalline structures with high conductivity (e.g., vanadium bronze).
Data Availability Statement
The raw data supporting the conclusions of this article will be made available by the authors, without undue reservation, to any qualified researcher.
Author Contributions
CS: experimental characterization XRD, SEM, manuscript preparation. MV: experimental characterization thermal properties. LM: glass preparation and characterization (colorimetric method). MA: team leader group and manuscript revision. AZ: conductivity measurements.
Funding
This material is based upon work done in part at Coe College, supported by the National Science Foundation under Grant No. DMR-RUI-1407404 and DMR-RUI-1745737.
Conflict of Interest
The authors declare that the research was conducted in the absence of any commercial or financial relationships that could be construed as a potential conflict of interest.
References
Baia, L., Bolboaca, M., Kiefer, W., Yousef, E. S., Rüssel, C., and Breitbarth, F. W. (2004). Spectroscopic studies on the structure of vanadium tellurite glasses. Phys. Chem. Glasses 45, 178–182.
Barney, E., Hannon, A. C., Holland, D., Umesaki, N., and Tatsumisago, M. (2015). Alkali environments in tellurite glasses. J. Non Cryst. Solids 414, 33–41.
Boutiche, S. (2001). Variable Range Hopping Conductivity: Case Of The Non-Constant Density Of States. London: HAL Archives-Ouvertes.
Dhawan, V. K., Mansingh, A., and Sayer, M. (1982). DC conductivity of V2O5 TeO2 glasses. J. Non Cryst. Solids 51, 87–103.
Dimitriev, Y., Dimitrov, V., Arnaudov, M., and Topalov, D. (1983). IR-spectral study of vanadate vitreous systems. J. Non Cryst. Solids 57, 147–156.
Dimltriev, Y., and Dimitrov, V. (1978). X-ray diffraction studies of glasses in the TeO2-V205 system. Mat. Res. Bull. 13, 1071–1075.
El-Mallawany, R. (2000). Specific heat capacity of semiconducting glasses: binary vanadium tellurite. Phys. Stat. Sol 177, 439–444.
El-Mallawany, R. (2012). Electrical Conductivity of Tellurite Glasses, in Tellurite Glasses Handbook: Physical Properties and Data. Boca Raton, FL: CRC.
El-Mallawany, R., Abdel-Kader, A., El-Hawary, M., and El-Khoshkhany, N. (2010). Volume and thermal studies for tellurite glasses. J. Mat. Sci. 45, 871–887.
Flynn, B. (1977). The Electrical and Optical Properties of Vanadium Tellurite Glasses. Edinburgh: University of Edinburgh.
Frolov, S., and Quinn, E. (2012). Hubbard-shastry lattics models. J. Phys. A Math. Theor. 45:095004. [arXiv]. doi: 10.1088/1751-8113/45/9/095004
Hirashima, H., Ide, M., and Yoshida, T. (1986). Memory Switching of V2O5TeO2 Glasses. J. Non Cryst. Solids 86, 327–335.
Hoppe, U., Rüssel, C., Neuefeind, J., and Hannon, A. C. (2002). Structure of vanadium tellurite glasses studied by neutron and X-ray diffraction. Solid State Commun. 123, 273–278.
Jayaseelan, S., Muralidharana, P., Venkateswarlub, M., and Satyanarayana, N. (2004). Ion transport and relaxation studies of silvervanadotellurite glasses at low temperatures. Mater. Chem. Phys. 87, 370–377.
Kjeldsen, J., Rodrigues, A. C., Mossin, S., and Yue, Y. (2014). Critical V2O5/TeO2 ratio inducing abrupt property changes in vanadium tellurite glasses. J. Phys. Chem. B 118, 14942–14948. doi: 10.1021/jp508910m
Lebrun, N., Lévy, M., and Souquet, J. L. (1990). Electronic conductivity in glasses of the TeO2-V2O5-MoO3 system. Solid State Ionics 40/41, 718–722.
McDonald, L. (2017). Honors Thesis: Tellurium Vanadate Glasses: Structure and Conductivity, in Physics. Cedar Rapids: Coe College, 1–61.
Murawski, L., Chung, C. H., and Mackenzie, J. D. (1979). Electrical properties of semiconducting oxide glasses. J. Non Cryst. Solids 32, 91–104.
Sidkey, M. A., El Mallawanyb, R., Nakhlac, R. I., and Abd El-Moneim, A. (1997). Ultrasonic studies of (TeO2)(1-x)-(V205)x glasses. J. Non Cryst. Solids 215, 75–82.
Souri, D. (2010). Small polaron hopping conduction in tellurium based glasses containing vanadium and antimony. J. Non Cryst. Solids 356, 2181–2184.
Van Hapert, J. J. (2002). Hopping Conduction And Chemical Structure - A Study On Silicon Suboxides. Utrecht: Utrecht University.
Keywords: tellurate, vanadate, glasses, electrical, conductivity
Citation: McDonald L, Siligardi C, Vacchi M, Zieser A and Affatigato M (2020) Tellurium Vanadate Glasses: V4+colorimetric Measure and Its Effect on Conductivity. Front. Mater. 7:103. doi: 10.3389/fmats.2020.00103
Received: 18 November 2019; Accepted: 06 April 2020;
Published: 13 May 2020.
Edited by:
Jincheng Du, University of North Texas, United StatesReviewed by:
Pierre Lucas, University of Arizona, United StatesMaria Jesus Pascual, Consejo Superior de Investigaciones Científicas (CSIC), Spain
Copyright © 2020 McDonald, Siligardi, Vacchi, Zieser and Affatigato. This is an open-access article distributed under the terms of the Creative Commons Attribution License (CC BY). The use, distribution or reproduction in other forums is permitted, provided the original author(s) and the copyright owner(s) are credited and that the original publication in this journal is cited, in accordance with accepted academic practice. No use, distribution or reproduction is permitted which does not comply with these terms.
*Correspondence: Mario Affatigato, bWFmZmF0aWdAY29lLmVkdQ==