 Imane Moulefera1,2
 Francisco J. García-Mateos1
 Abdelghani Benyoucef2
 Juana M. Rosas1*
 José Rodríguez-Mirasol1
 Tomás Cordero1
- 1Departamento de Ingeniería Química, Facultad de Ciencias, Universidad de Málaga, Andalucía TECH, Málaga, Spain
- 2Laboratory of Technique and Sciences of Water, Mustapha Stambouli University of Mascara, Mascara, Algeria
This work analyzes the effect of co-solution of carbon precursor and activating agent on the textural and surface chemistry properties of highly nanoporous activated carbons obtained by chemical activation of Alcell lignin with phosphoric acid. The success of this methodology highlights the possibility of directly using the liquors produced in organosolv process (Alcell) to prepare activated carbons by chemical activation with phosphoric acid. Co-solutions of lignin and phosphoric acid were submitted to a two steps thermal treatment, which consisted of a first oxidative treatment in air at 200°C, followed by a thermal treatment in N2 at 400°C, where activation of the oxidized lignin with phosphoric acid took place. A lignin-derived activated carbon with very high apparent surface area (2550 m2/g) and pore volume (1.30 cm3/g) was obtained with an initial phosphoric acid to lignin mass ratio of 2. Up to now, this is one of the highest values of apparent surface area reported not only for activated carbons prepared from lignin, but even for porous carbons prepared by chemical activation of other lignocellulosic materials with phosphoric acid. The use of lignin and phosphoric acid co-solution provided larger and more homogeneous effective interactions between the carbon precursor and the activating agent, by the formation of phosphate esters in the lignin matrix, which seems to be a key factor in the subsequent treatments: promoting crosslinking reactions in the carbonaceous matrix during the oxidative treatment in air at 200°C and enhancing the development of a wide porosity during the following activation thermal treatment.
Introduction
Within a biorefinery scheme, the conversion of the major components of lignocellulosic biomass (cellulose, hemicellulose, and lignin) into energy and chemicals is essential. However, lignin has been used, up to date, mainly, as a fuel to recover energy and chemical reactants in the pulp and paper industry and only a 2% of the produced lignin is currently commercialized (Higson and Smith, 2011; Smolarski, 2012; Laurichesse and Avérous, 2014; Rosas et al., 2014). There are different pretreatments to fractionate lignocellulosic biomass into their main components, but Organosolv process becomes an ideal candidate in the biorefinery context, given the need of using environmentally friendly treatments. During Organosolv process, lignin is fractionated into smaller parts, dissolved from the lignocellulosic biomass with organic compounds and separated in the form of a liquor rich in phenolic compounds (Xu et al., 2006; Ruiz et al., 2011; Espinoza-Acosta et al., 2014). The next step consists of lignin precipitation from the liquors by partially evaporating the organic solvent, lowering the temperature or a combination of those, followed by a separation step through centrifugation, filtration, etc. The lignin derived from this method presents lower molecular weight and higher purity than others obtained by other processes, such as Kraft one. All these properties make this type of lignin an ideal precursor for the preparation of activated carbon, an added-value material, whose production process would imply both economic and environmental advantages.
Chemical activation with phosphoric acid is a well-known method to prepare activated carbons from different biomass precursors (Jagtoyen and Derbyshire, 1998; Kennedy et al., 2004; Montané et al., 2005; Sych et al., 2012). Many papers have been reported dealing with the optimization of the preparation conditions in order to obtain activated carbons with a high development of the porous texture. The influence of the impregnation ratio and the activation temperature on the textural properties of activated carbons prepared from different biomassic waste has been deeply analyzed (Jagtoyen et al., 1993; Hayashi et al., 2000; Molina-Sabio and Rodríguez-Reinoso, 2004; Rosas et al., 2009; Puziy et al., 2020). However, the effect of the gas atmosphere during the activation step on these properties is not so clear and some contradictions have appeared in this respect in the literature. Generally, activation takes place under inert atmosphere, although some authors have proposed the preparation of activated carbons by chemical activation with phosphoric acid under air atmosphere in order to enhance the textural properties (increase apparent surface area, ABET) (Laine et al., 1989). However, (Benaddi et al., 1998) reported no significant influence of the atmosphere on the textural characteristics of activated carbons prepared by chemical activation of wood with phosphoric acid. They obtained values of apparent surface area of approximately 2100 m2/g, independently of the use of air or nitrogen as activation atmosphere. In contrast, Moreno Castilla et al. reported the preparation of activated carbons from olive-mill waste with similar ABET (∼ 400 m2/g), using either nitrogen, CO2 or H2O atmospheres (Moreno-Castilla et al., 2001), but the ABET value decreased (∼ 180 m2/g) when they used air as gas atmosphere.
With regard to lignin, activated carbons with very high ABET values (around 3000 m2/g) by chemical activation of Kraft lignin with KOH has been reported (Fierro et al., 2007a), but these carbon materials presented a very narrow microporosity. Chemical activation of Kraft lignin with zinc chloride and phosphoric acid gave rise to activated carbons with a much wider porosity, depending on the activation temperature and impregnation ratio, but with ABET values lower than 1800 m2/g (Gonzalez-Serrano et al., 1997, 2004; Guillén et al., 2009). However, no much information can be found in the literature regarding the preparation of activated carbons from Alcell lignin (Bedia et al., 2009; Rosas et al., 2012), a co-product that appears dissolved in the liquors produced in one of the most important Organosolv process.
Thus, the objective of this work was to analyze the effect of co-solution of carbon precursor and activating agent on the textural and surface chemistry properties of activated carbons obtained by chemical activation of Alcell lignin with phosphoric acid, in order to assess the possibility of directly using the liquors produced in the Organosolv process (Alcell), which would avoid the lignin precipitation and separation steps in this process. The influence of the use of a low temperature oxidative thermal treatment, previous to the activation process, on the surface chemistry and textural properties of the final lignin-derived carbons obtained was also studied.
Experimental Section
Activated Carbons Preparation
Alcell lignin (supplied by Repap Technologies Inc., Co.) was used as raw material for the activated carbons preparation. Different procedures were used for the preparation of activated carbons from lignin. Alcell lignin was dissolved in ethanol to simulate the composition of dissolved lignin in the Organosolv liquors. Solid Alcell lignin was directly impregnated with aqueous H3PO4 85% (w/w) at room temperature. Co-solution of lignin and the activating agent, H3PO4 85% (w/w), was also prepared at room temperature and the ethanol/lignin/H3PO4 solution was stirred until evaporation of the ethanol (which could be recovered). Both the impregnated lignin and the solid derived from the co-solution of lignin and H3PO4 were dried for 24 h at 60°C in a vacuum dryer. The amounts of lignin and H3PO4 used in both cases were those to obtain a final H3PO4/lignin mass ratio of 2. The as-received lignin and that dissolved in ethanol were denoted by L and LE, respectively. H3PO4 impregnated lignin and the solid derived from the lignin/ethanol/H3PO4 solution once dried were denoted as L2P and LE2P, respectively. These two samples were subsequently submitted to a low temperature oxidative treatment at 200°C in air atmosphere for 1.5 h, followed by an activation treatment under inert atmosphere at 400°C, both inside a laboratory horizontal tubular furnace. The heating rate to reach the oxidative and the activation temperature was 3 and 10°C/min, respectively. Once the activation temperature was reached the samples were cooled inside the furnace under inert atmosphere and then washed with distilled water at 60°C until neutral pH. The resulting activated carbons were dried at 60°C.
L2P and LE2P submitted to the oxidative treatment in air at 200°C for 1.5 h were denoted by adding the letter S to the corresponding names (L2PS and LE2PS, respectively). The final activated carbons obtained at 400°C in inert atmosphere were denoted by adding 400 to the respective notations (L2PS400 and LE2PS400, respectively). In case of oxidative treatments at different temperatures, the activated carbons notation will include at the end of the name the temperature of the treatment. For the sake of comparison, some samples were directly activated at 400°C under air atmosphere without being subjected to the previous oxidative low temperature treatment. In these cases, the letter S was not included in their corresponding notations (L2P400 and LE2P400) and the letter A was added at the end of its corresponding name. In order to also evaluate the influence of the gas atmosphere during the low temperature treatment, a sample was treated under inert atmosphere at 200°C for 1.5 h and was denoted by adding the letter N to its corresponding notation.
Activated Carbons Characterization
The porosity of the samples was characterized by N2 adsorption–desorption and CO2 adsorption at −196 and 0°C, respectively, using a micromeritics instrument (ASAP 2020 model). The samples were previously outgassed for at least 8 h at 150°C. From the N2 isotherm, the apparent surface area (ABET) was determined by applying the BET equation (Brunauer et al., 1938); micropore volume (Vt) and external surface area (At) were calculated using the t-method (Lippens and de Boer, 1965); mesopore volume (Vmes) was determined as the difference between the maximum adsorbed volume of N2 (Vp) at a relative pressure of 0.99 and the micropore volume (Vt) (Rodríguez-Reinoso et al., 1995). From the CO2 adsorption data, the narrow micropore volumen (VDR) and surface area (ADR) were calculated using the Dubinin–Radushkevich equation (Dubinin et al., 1947). Pore size distributions were obtaining by applying the 2D-NLDFT heterogeneous surface model from N2 adsorption isotherm (Jagiello and Olivier, 2013).
Thermal treatments of different samples were carried out in a gravimetric thermobalance system, CI electronics. The thermobalance automatically measures the weight of the sample and the temperature as a function of time. Experiments were carried out in inert atmosphere (N2) and in air atmosphere, for a total flow rate of 150 cm3 (STP)/min, employing sample mass of approximately 10 mg. The sample temperature was increased at a heating rate of 10°C/min. Differential scanning calorimetry (DSC) experiments were also obtained by a thermal analyzer (Mettler Toledo equipment) coupled to a Mass Spectrometer (Pfeiffer Vacuum model ThermoStar TM GSD 320).
The FTIR spectra of lignin and lignin-derived samples were recorded in a Bruker Optics Vertex 70 FTIR spectrometer, in the 500–4000 cm–1 range, in KBr disks [ca. 1% (w/w)]. A KBr beam splitter and a Golden gate single reflection diamond ATR system detector were used. The spectra were collected for 2 min, with 4 cm–1 resolution.
Solid-state 13C and 31P-NMR spectra of lignin and lignin-derived samples were recorded, as well, with a NMR spectrometer (400 WB Plus model from Bruker) using the Cross Polarization Magic Angle Spinning (CPMAS) and high power decoupling (HPDEC) techniques and a 3.2 mm MAS triple-channel probe at a spinning frequency of 15 kH, with SPINAL-64 1H decoupling conditions.
X-ray photoelectron spectroscopy (XPS) analyses of the samples were carried out in a PHI 5700C model Physical Electronics apparatus, with MgKα radiation (1253.6 eV). For the analysis of the XPS peaks, the C1s peak position was set at 284.5 eV and used as reference to position the other peaks. For the deconvolution of the peaks, Gaussian–Lorentzian curves were used. The deconvolution of the phosphorus spectrum was carried out by using two doublet peaks with an area ratio of 0.5 and a separation between peaks of 0.84 eV for each phosphorus groups. TPD experiments were carried out in a customized quartz fixed-bed reactor placed inside an electrical furnace. CO and CO2, as output gases, were measured by a non-dispersive infrared (NDIR) gas analyzer, Siemens ULTRAMAT 22 (Siemens AG, Munich, Germany). Eighty mg of dried carbon sample was heated from room temperature to 930°C at a heating rate of 10°C/min under N2 flow (200 cm3/min).
Results and Discussion
Surface Chemistry Characterization of As-Received and Ethanol-Dissolved Lignin
Alcell lignin is a type of lignin derived from Organosolv process, a pulping technique that uses an organic solvent to solubilize lignin and hemicellulose. This type of lignin contains very small amounts of inorganic compounds (Kubo and Kadla, 2004). Delignification is mostly the result of high-temperature uncatalyzed hydrolysis of lignin ether linkages by water. The solvent in the system mainly serves to dissolve the lignin fragments (Girard and van Heiningen, 2000). One of the most used solvents in the Organosolv process is ethanol, which has been the solvent selected in this work to dissolve lignin.
Figure 1A shows the normalized CPMAS 13C NMR spectra of the as-received Alcell lignin and that dissolved in ethanol. Some differences can be observed, which suggest modifications of the lignin structure by its solution in ethanol. The main difference of both spectra is observed in the range of 15–27 ppm, which can be associated to terminal CH3 groups. The increase of this signal suggests the accumulation of saturated alkyl structures after dissolving the lignin with ethanol. The predominant signal around 62–68 ppm, which remains practically the same after dissolving the lignin in ethanol, can be assigned to C5 in xylose internal unit and Cγ, in β-O-4-linked unit; C4 in xylose non-reducing end and Cγ, in β-O-4-linked unit with C = O. However, the signal around 144–148 ppm slightly increases after solution with ethanol, which can be associated to an increase of C3 and C4 in etherified guaiacyl; C4 and C4^′ in etherified 5-5′ units and Cα, in cinnamic acid and ester (Almendros et al., 1992), and maybe related to the interaction of -OH groups of ethanol with those of lignin, which would also explain the increase of the signal between 15 and 27 ppm.
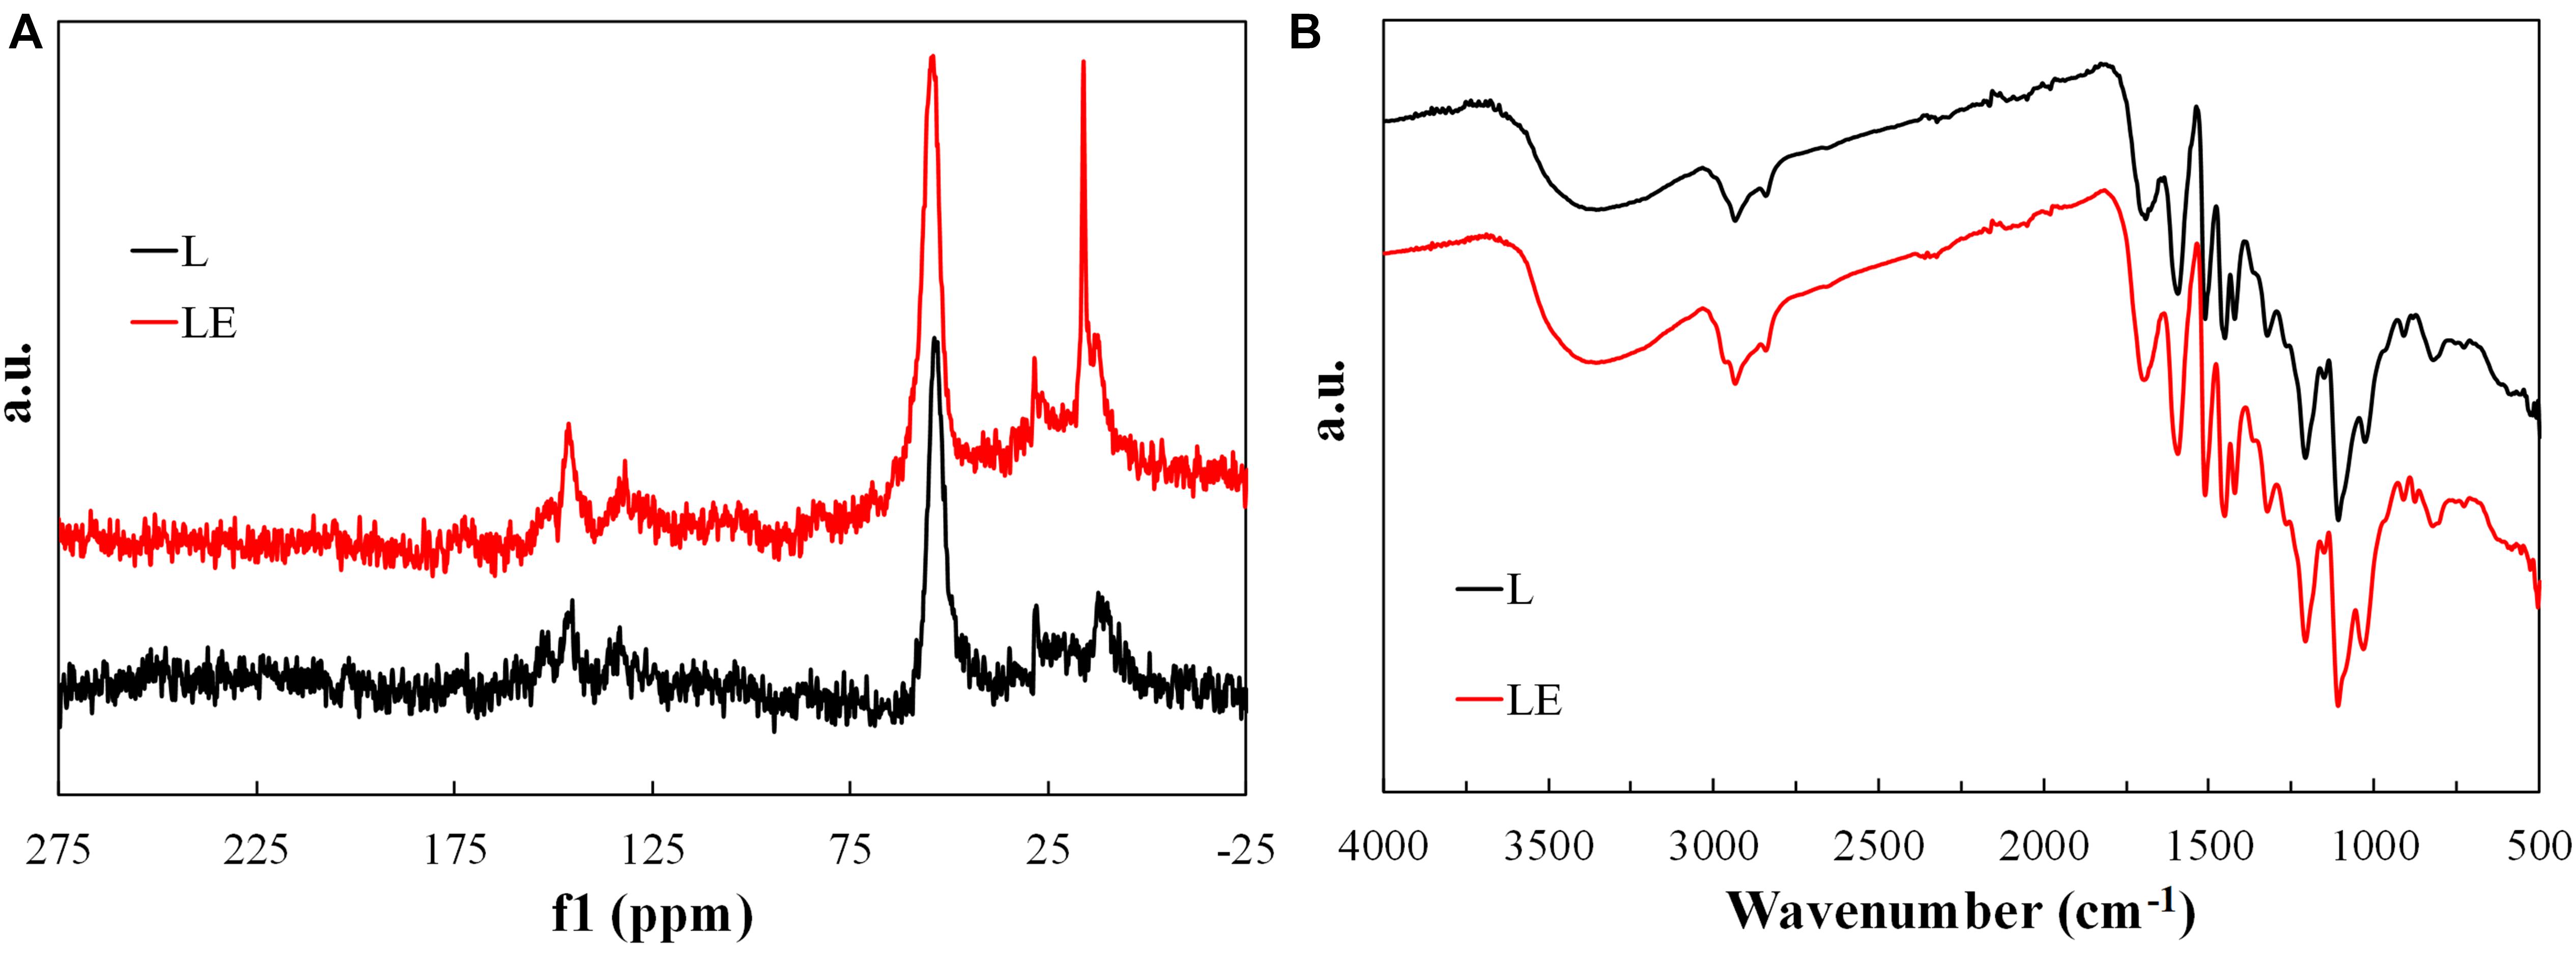
Figure 1. Normalized CPMAS 13C NMR spectra (A) and FTIR spectra (B) of as-received Alcell lignin and that dissolved in ethanol.
Figure 1B represents the corresponding FTIR spectra of both samples. The spectrum of lignin is complicated and most of the bands observed are produced by contribution of various types of vibrations of different functional groups. Therefore, assignment of the bands is possible only in the approximation of the predominant contribution of certain atomic groups (Fiţigău et al., 2013). Alcell lignin shows a broad band at 3410–3460 cm–1, attributed to the hydroxyl groups in phenolic and aliphatic structures, which remains the same after dissolving with ethanol. The bands centered around 2935 and 2840 cm–1 can be predominantly associated to CH stretching in aromatic methoxyl groups and in methyl and methylene groups of side chains. In the LE sample also appears a band around 2965 cm–1 related to stretching vibration of aliphatic C-H. This appearance is in concordance to the accumulation of saturated alkyl structures, suggested by CPMAS 13C NMR spectra, after dissolving lignin with ethanol. In the carbonyl/carboxyl region, a band around 1700 cm–1 is found, originating from unconjugated carbonyl/carboxyl stretching, which is more intense in the case of the sample LE. Typical bands of lignin are those at 1600, 1515, and 1425 cm–1 related to aromatic skeleton vibrations and at 1460 cm–1 associated to the C–H deformation combined with aromatic ring vibration (Vallejos et al., 2011; Fiţigău et al., 2013), which are practically the same in both samples.
The samples show the characteristic vibrations for the guaiacyl unit (G ring and C = O stretch at around 1260 cm–1; CH in-plane deformation at 1150 cm–1; and C–H out-of plane vibrations in position 2, 5, and 6 of guaiacyl units at 830 and 915 cm–1). Syringyl (S) and guaiacyl (G) units are detected by aromatic skeleton vibrations at 1600 and 1325 cm–1 (S), 1515 and 1260 cm–1 (G), and aromatic in plane C-H vibrations at 1110 (S) and 1030 cm–1 (G). This last band is more intense in case of the LE sample (Vallejos et al., 2011; Fiţigău et al., 2013). Another band at 880 cm–1, related to C-C asymmetrical stretching mode, is more accused in sample LE, which also evidences the modification of the chemical structure of lignin after dissolving it with ethanol.
Finally, both samples also contain a weak band at 1370–1375 cm–1 originating from phenolic OH and aliphatic C–H in methyl groups and a strong vibration at 1215–1220 cm–1 that can be associated with C–C, C–O, and/or C = O stretching. The aromatic C–H deformation at 1030 cm–1 appears as a complex vibration associated with the C–O, C–C stretching and C–OH bending in polysaccharides (Vallejos et al., 2011; Fiţigău et al., 2013).
Effect of H3PO4 and Low Temperature Oxidative Treatment on Lignin Surface Chemistry
Figure 2 shows the corresponding FTIR spectra of the H3PO4 impregnated lignin and the solid derived from the lignin/ethanol/H3PO4 solution, L2P and LE2P, respectively. Most of the absorption peaks corresponding to functional groups for these two samples were diminished compared to those corresponding to the samples L and LE. Spectra of samples L2P and LE2P are very similar, showing an important decrease of the intensity in the bands associated to the presence of O-H stretching of hydroxyl functional groups (3500 to 3300 cm–1). This reduction is due to the presence of phosphoric acid, which acts as dehydrating agent immediately after impregnation, even at room temperature. The band around 2965 cm–1 related to stretching vibration of aliphatic C-H is also substantially reduced due to the increase of aromaticity (conversion of aliphatic to aromatic compounds). This loss of aliphatic character takes place at low temperatures and is caused by the cleavage of aliphatic side chains. Jagtoyen and Derbyshire also reported that the primary effects of acid attack are to cleave aryl ether bonds in lignin, accompanied by dehydration, degradation and condensation reactions (Jagtoyen and Derbyshire, 1998), which are the responsible of the decrease observed at 1600, 1515, and 1425 cm–1,related to aromatic skeleton vibrations of phenyl skeletons and, at 1460 cm–1, associated to the C–H deformation, combined with aromatic ring vibration. Furthermore, the acid-catalyzed hydrolysis of ether linkages in lignin can lead to the formation of ketones, as can be observed in the characteristic band that appears at 1685 cm–1.
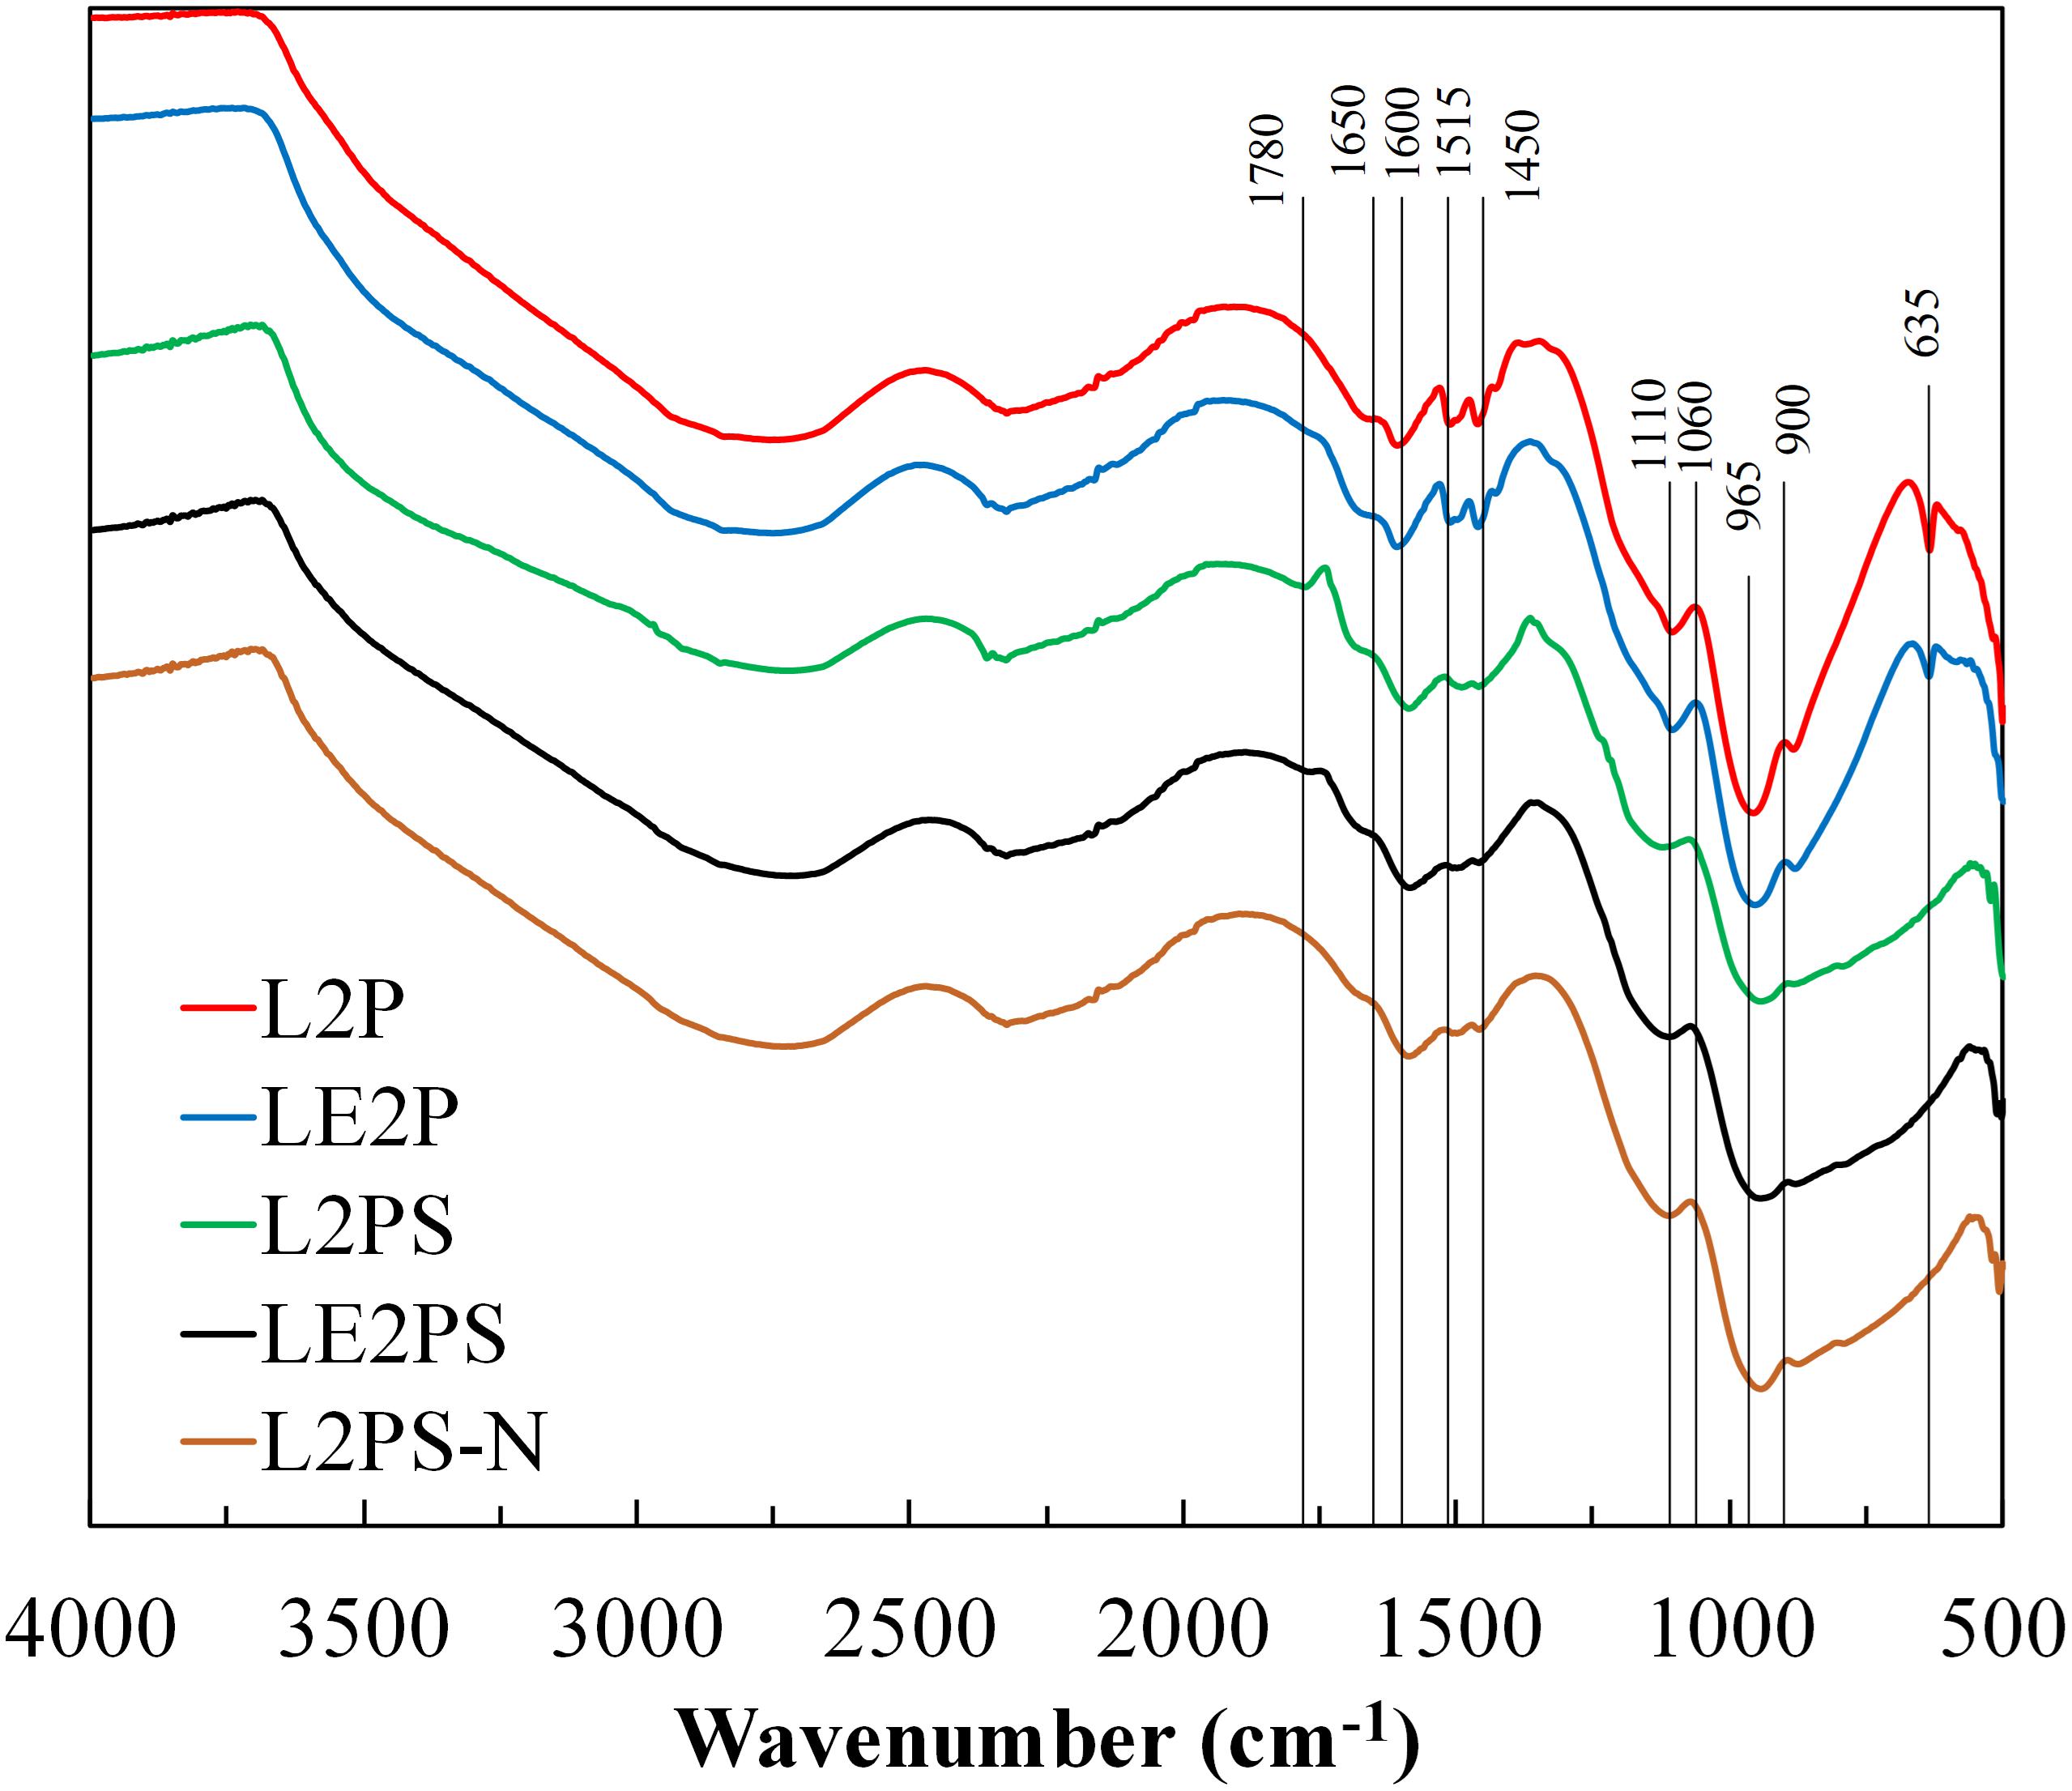
Figure 2. FTIR spectra of the different H3PO4-lignin derived samples.
The typical bands for guaiacyl unit are also significantly reduced, those at 1215–1220 cm–1 and at 1030 cm–1, associated to C–C, C–O, and/or C = O stretching and C–O, C–C stretching and C–OH bending in polysaccharides, respectively. However, the appearance of other bands probably related to phosphorus compounds is also observed. In this sense, the broad band at 965 cm–1 and the intense peak at 635 cm–1 could be initially associated to P-O-P and P-C bending of aromatic compounds, respectively, although the peak at 635 cm–1 can be also related to C ≡ CH bonds (Labruquère et al., 1998). In addition, disappearance of this band, at 635 cm–1, is observed for samples submitted to the oxidative treatment in air at 200°C (L2PS and LE2PS), which can be related to the formation of more oxidized species of phosphorus or to decomposition of non-stable species. Furthermore, a decrease of the intensity of the bands at 1600, 1515, 1460, and 1425 cm–1 was also detected after this low temperature treatment in air.
In order to analyze if phosphoric acid can act as an oxygen donor to the lignin matrix at this low temperature, sample L2P was treated at 200°C for 1.5 h, but under inert (N2) atmosphere (L2PS-N). The FTIR results for L2PS-N are also shown in Figure 2. As it can be seen, all the bands already mentioned were also reduced for L2PS-N, which suggests that the presence of oxygen coming from the H3PO4 is more than enough to produce crosslinking reactions (García-Mateos et al., 2018). In this sense, phosphoric species could be combined with organic species to form phosphate linkages that can serve to connect and crosslink lignin fragments (Jagtoyen and Derbyshire, 1998). These reactions are probably responsible for the reduction of these typical bands of lignin.
The results obtained from XPS analysis confirmed the presence of phosphorus groups on the surface of L2P, LE2P, L2PS, and LE2PS samples (see Figure 3). The XPS P2p spectrum for L2P showed a broad band with a main peak at a binding energy around 134.3 eV, characteristic of pentavalent tetracoordinated phosphorus, as in phosphates and/or polyphosphates (Wu and Radovic, 2006). The obtained P2p broad band indicated the presence of different surface phosphorus species. Lower binding energies (around 133 eV) are characteristic of C-P bonding, as in C-PO3 surface groups, which seem to be practically negligible in these samples (see Table 1); whereas higher values (134.2 eV) are ascribed to more oxidized phosphorus species, with C-O-P type bonds, as those in C-O-PO3 surface groups (Wu and Radovic, 2006; Puziy et al., 2008). The contribution of these species was higher than 85%, suggesting that all phosphorus was mainly present in form of C-O-PO3 surface groups. However, due to these samples were not yet activated, the presence of even more oxidized phosphorus species as P2O5 (135.7 eV) cannot be disregarded. It seems clear that co-solution of lignin with phosphoric acid generated a higher contribution of oxidized P surface groups to the total P surface groups than the traditional impregnation process (LE2P vs. L2P). On the other hand, the lower P content value observed for LE2P, when compared with that for L2P (see Table 1), suggests that this sample presents more P in the inner part of the lignin matrix, due probably to a better dispersion and to a more homogeneous distribution of P through the entire lignin matrix obtained by co-solution of the activating agent, phosphoric acid, and the carbon precursor, lignin. After the low temperature oxidative treatment both samples, L2PS and LE2PS, presented a similar surface P content value. However, the amount of surface O was significantly higher for the sample prepared by co-solution of lignin and H3PO4, LE2PS, which suggests that this preparation procedure enhances the lignin oxidation process at low temperature.
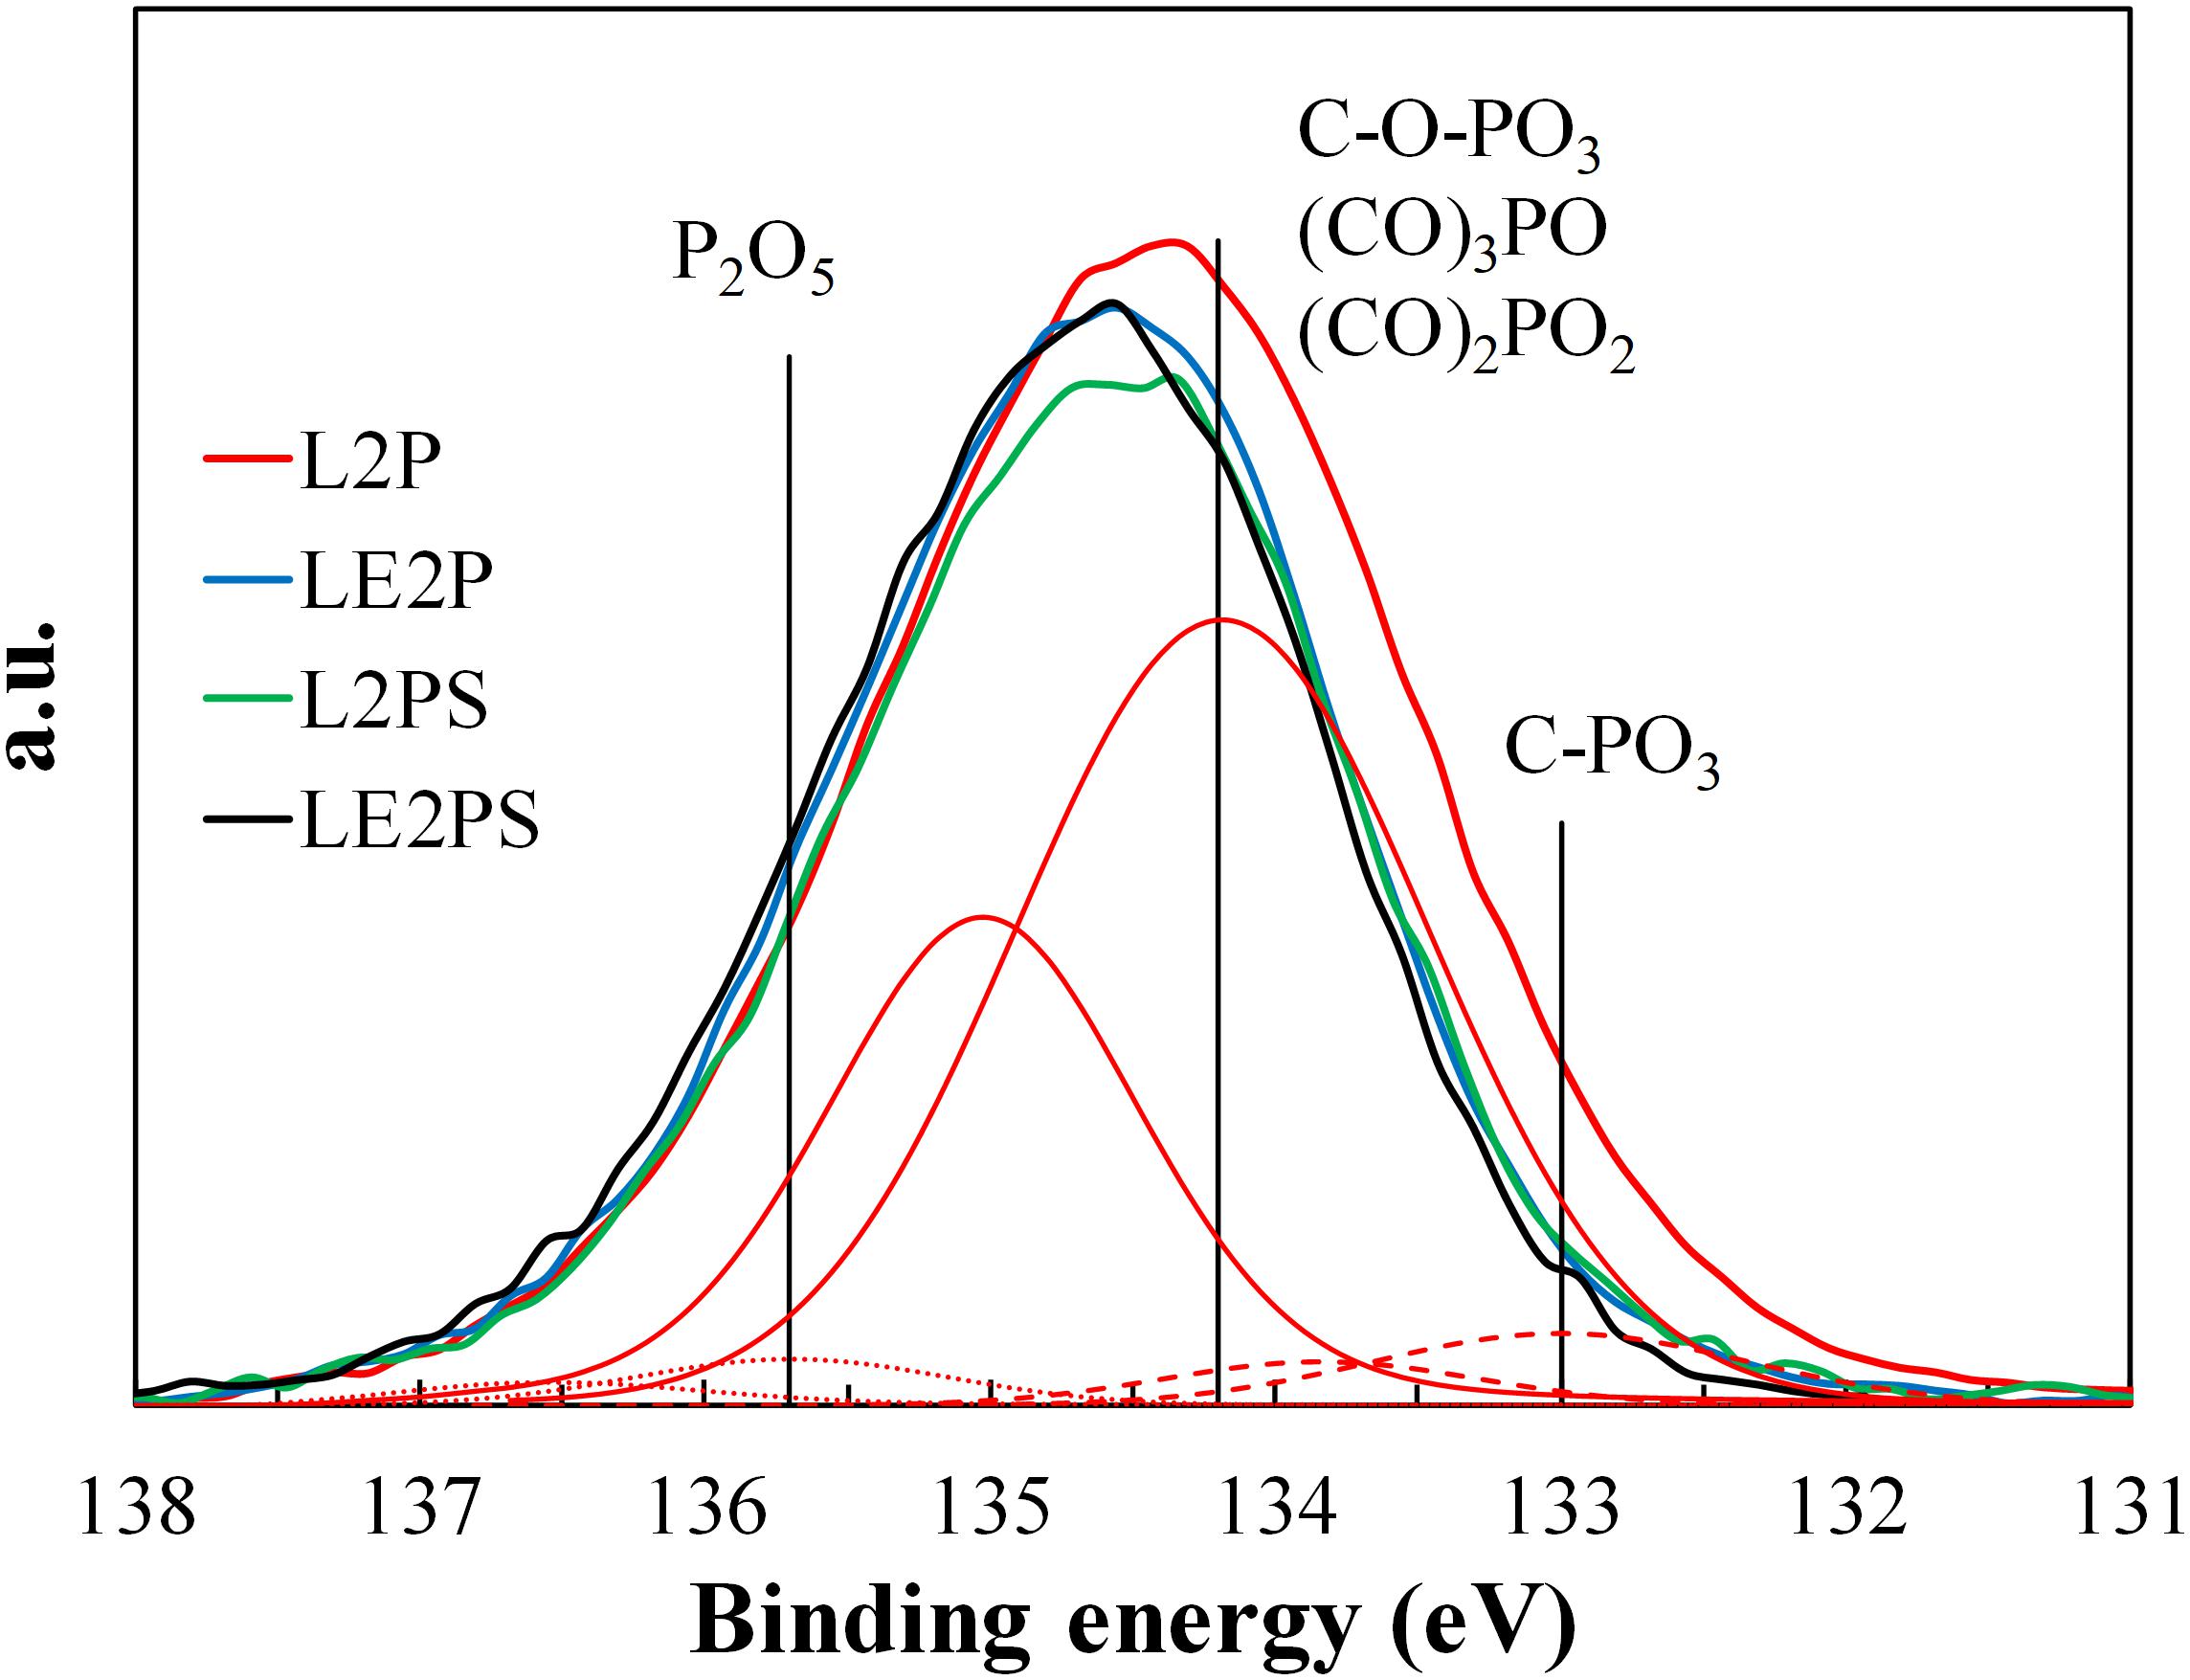
Figure 3. XPS P2p spectra of the different H3PO4-lignin derived samples and deconvolution of LE2PS sample (C-O-P groups: continuous line, P2O5: dotted line and C-PO3: dashed line).
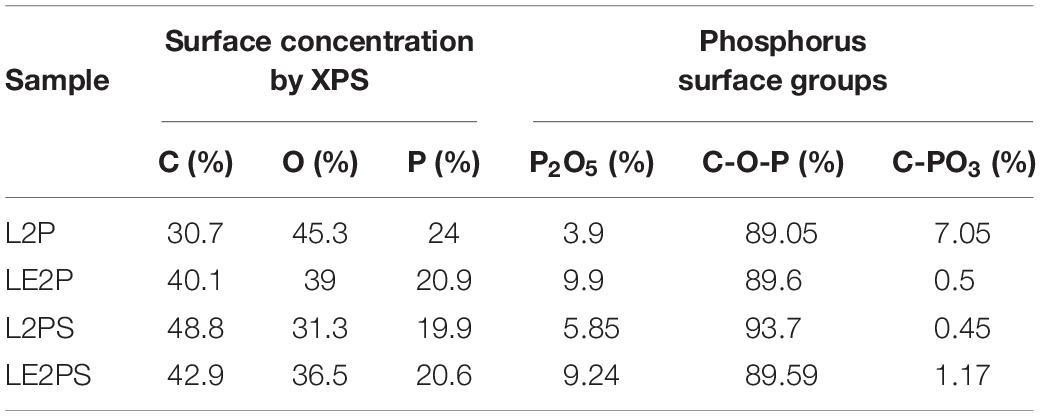
Table 1. Mass surface concentration of the different H3PO4-lignin derived samples and the corresponding contribution of different phosphorus surface group obtained by XPS analyses.
Thermal decomposition of the different lignin-derived samples was studied by TG analyses. Figure 4A represents the weight loss of the different lignin-derived samples as a function of temperature, under inert atmosphere and at a heating rate of 10°C/min. In general, three different ranges can be observed in all the samples. First, there is a small weight loss at temperatures lower than 200°C that can be partially attributed to release of water. Water can come from the phosphoric acid solution and produced by the reaction between phosphoric acid and lignin. As abovementioned, phosphoric acid cleaves aryl ether bonds in lignin, producing many transformations that include dehydration, degradation, and condensation (Jagtoyen and Derbyshire, 1998). At temperatures lower than 150°C, the acid catalyzes the hydrolysis of ether linkages, leading to the formation of ketones. These and other bond cleavage reactions that proceed through ionic mechanism promotes the release of H2O, CO, CO2, and CH4 at these low temperatures, and can contribute to the corresponding weight loss observed in Figure 4A.
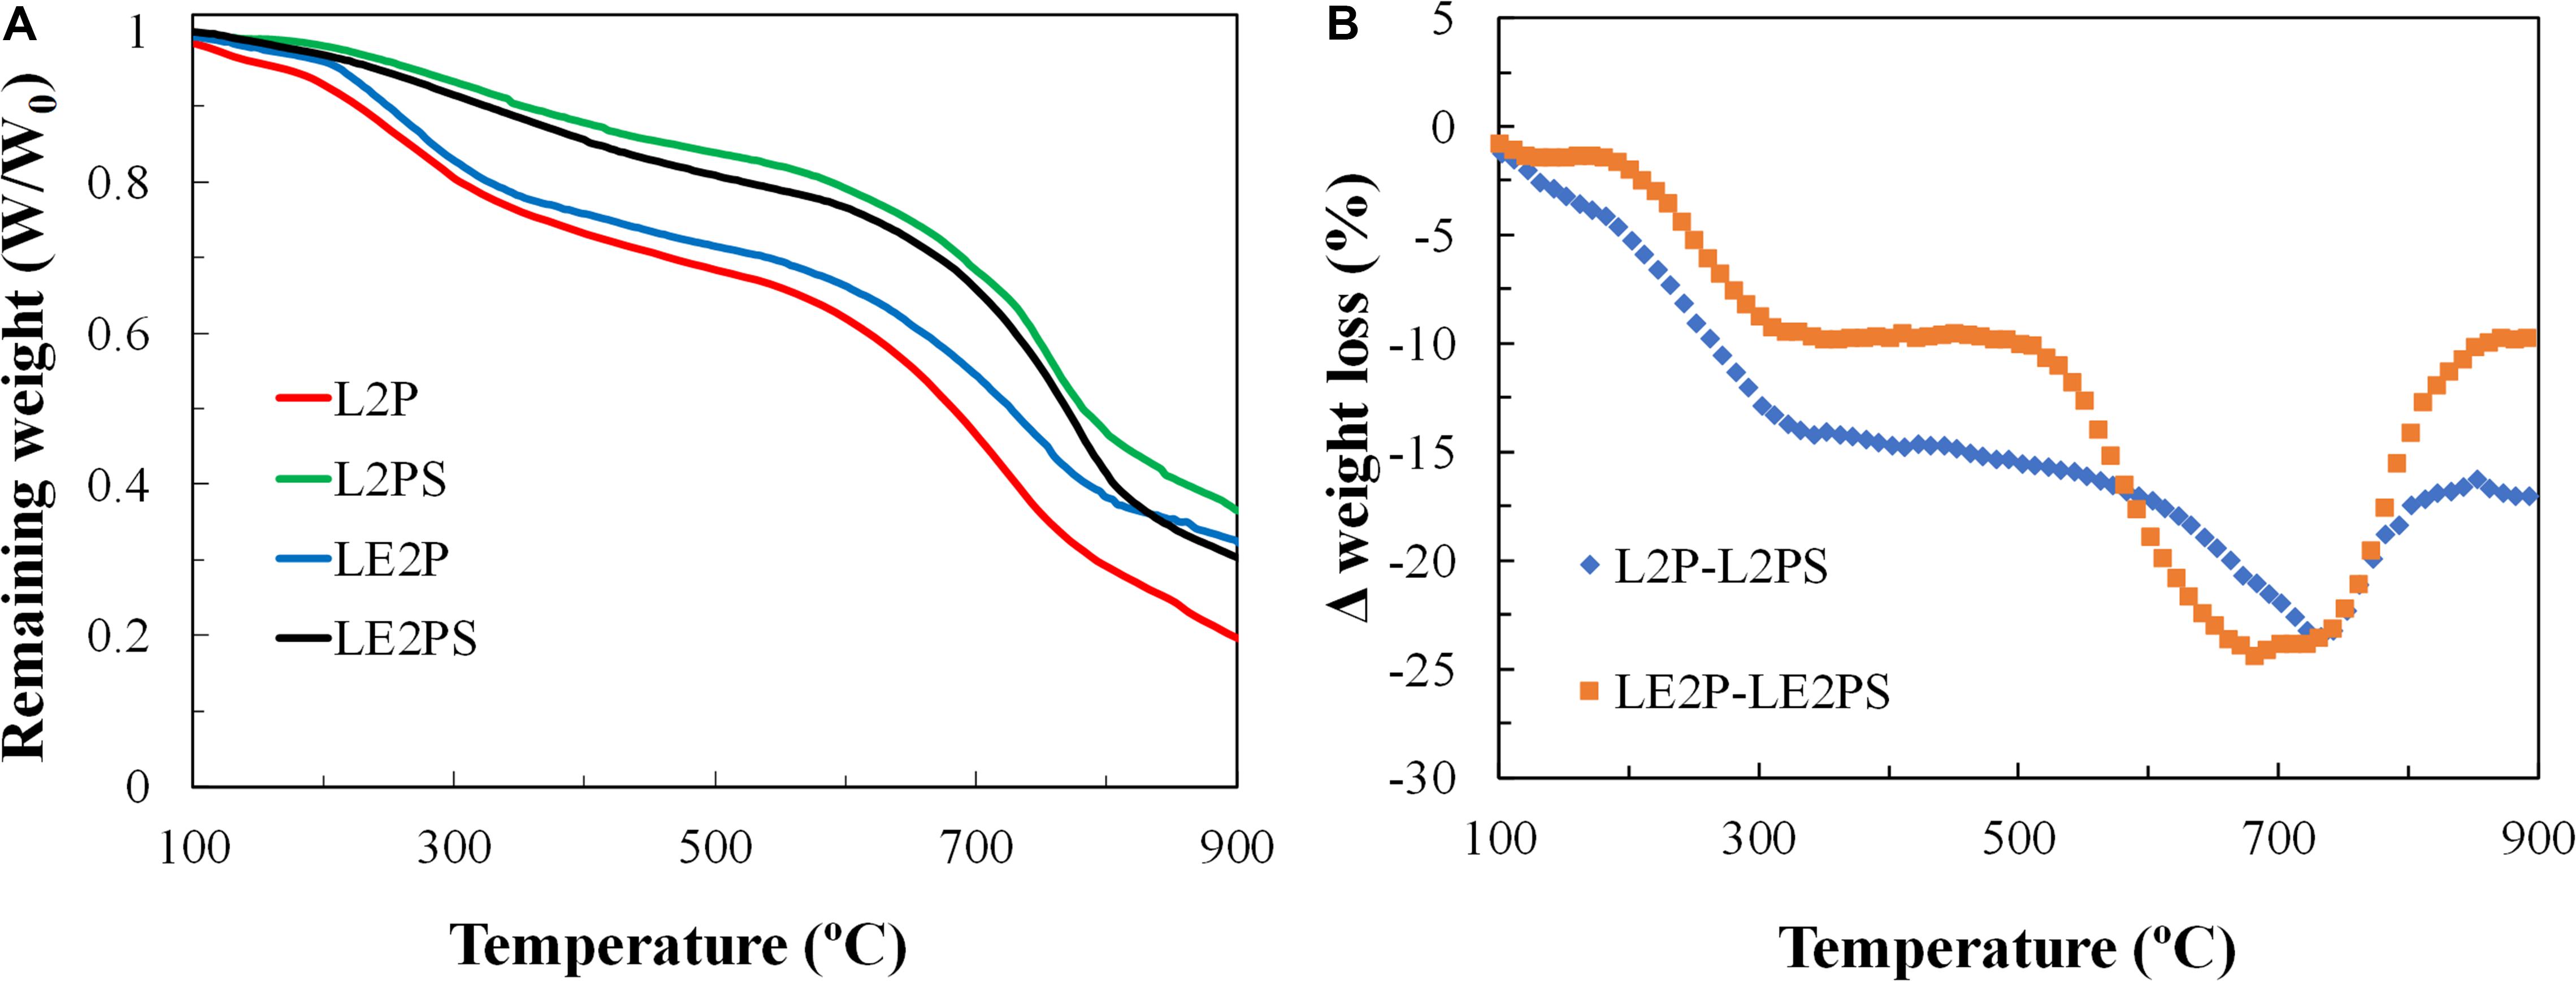
Figure 4. (A) Thermogravimetric analysis in inert atmosphere for different lignin-derived samples; (B) Weight loss differences during TG analyses between the non-treated and low temperature oxidized (air) treated samples.
Between 200 and 500°C a further decrease of mass is observed associated to the release of light compounds from lignin degradation. In this temperature range, crosslinking reactions dominate over bond cleavage and de-polimerization reactions. At 250°C the structures are considered to be small polyaromatic units connected mainly by phosphate and polyphosphate bridges, including polyethylene linkages. As the temperature increases, cyclization and condensation reactions lead to increases in aromaticity and size of the poliaromatic units, enabled by the scission of P-O-C bonds (Jagtoyen and Derbyshire, 1998).
A change in the slope of the weight-loss curve can be also observed at temperatures higher than 500°C, probably associated to volatilization of carbon–oxygen complexes generated by the activation process, and to a lesser extent, to decomposition of phosphorous-compounds (as P2O5), produced by the reaction of phosphoric acid with the carbon matrix (Montané et al., 2005).
The profiles of L2P and LE2P are very similar, suggesting the low impact of using dissolved lignin in ethanol in the thermal decomposition reactions. However, the weight loss curves of the samples treated with air (L2PS and LE2PS) are above those of L2P and LE2P samples. If the difference between the weight loss for a specific temperature of the non-treated and treated samples is represented as a function of temperature (Figure 4B), an important weight loss deviation around 700°C can be noticed for both curves, suggesting that the treatment with air generates significant differences to the samples treated with phosphoric acid. Montané et al. (2005) proposed that the peak observed at 650°C in the DTG curves was attributed to the volatilization of P2O5. On the other hand, Martínez De Yuso et al. (2014) found a band around 800°C, which they associated to the more important crosslinking reactions to produce aromatic units. Therefore, the treatment with air seems to stabilize or increase the number of phosphate and polyphosphate bridges, and/or to increase other crosslinking reactions. With this regard, although the weight loss percentage from 800°C is the same for the samples L2PS and LE2PS (around 10%), the remaining weight is not equal, due to a higher weight loss between 750 and 800°C. The weight loss observed in this range temperature coincides with the higher CO evolution observed in the TPD analysis for the LE2PS400 sample, and it is associated to the higher presence of C-O-PO3 surface groups (Bedia et al., 2009).
Differential scanning calorimetry (DSC) scans of all the lignin-derived samples are shown in Figure 5. Figure 5A shows a broad endothermic peak near 80°C from absorbed moisture for all the impregnated samples. The impregnated lignin L2P also presents a broad endotherm peak around 235°C, which can be associated to the decomposition and depolymerization reactions of lignin. Similarly, Karacan and Soy (2013) related an endothermic peak around 214°C to decomposition and depolymerization reactions of cellulose. Another exothermic peak was observed around 300°C. This peak coincides with a maximum in the CO and CO2 evolution and is due mainly to the crosslinking reactions taking place during the decomposition process (Jagtoyen and Derbyshire, 1998), which could be softened by the endothermic polymerization and condensation reactions that take also place at this temperature range (Zhu et al., 2016). The scan of LE2P is very similar to that of L2P, but a shift of the endothermic peak is observed to 225°C, which suggests an earlier beginning of the decomposition and depolymerization reactions of lignin. In the case of the L2PS and LE2PS samples, the treatment with air results in the reduction of the endothermic peak, probably because the endothermic reaction has already taken place during the treatment with air (at 200°C for 1.5 h). From this temperature, a broad but much less intense exothermic peak can be observed centered on 300°C.
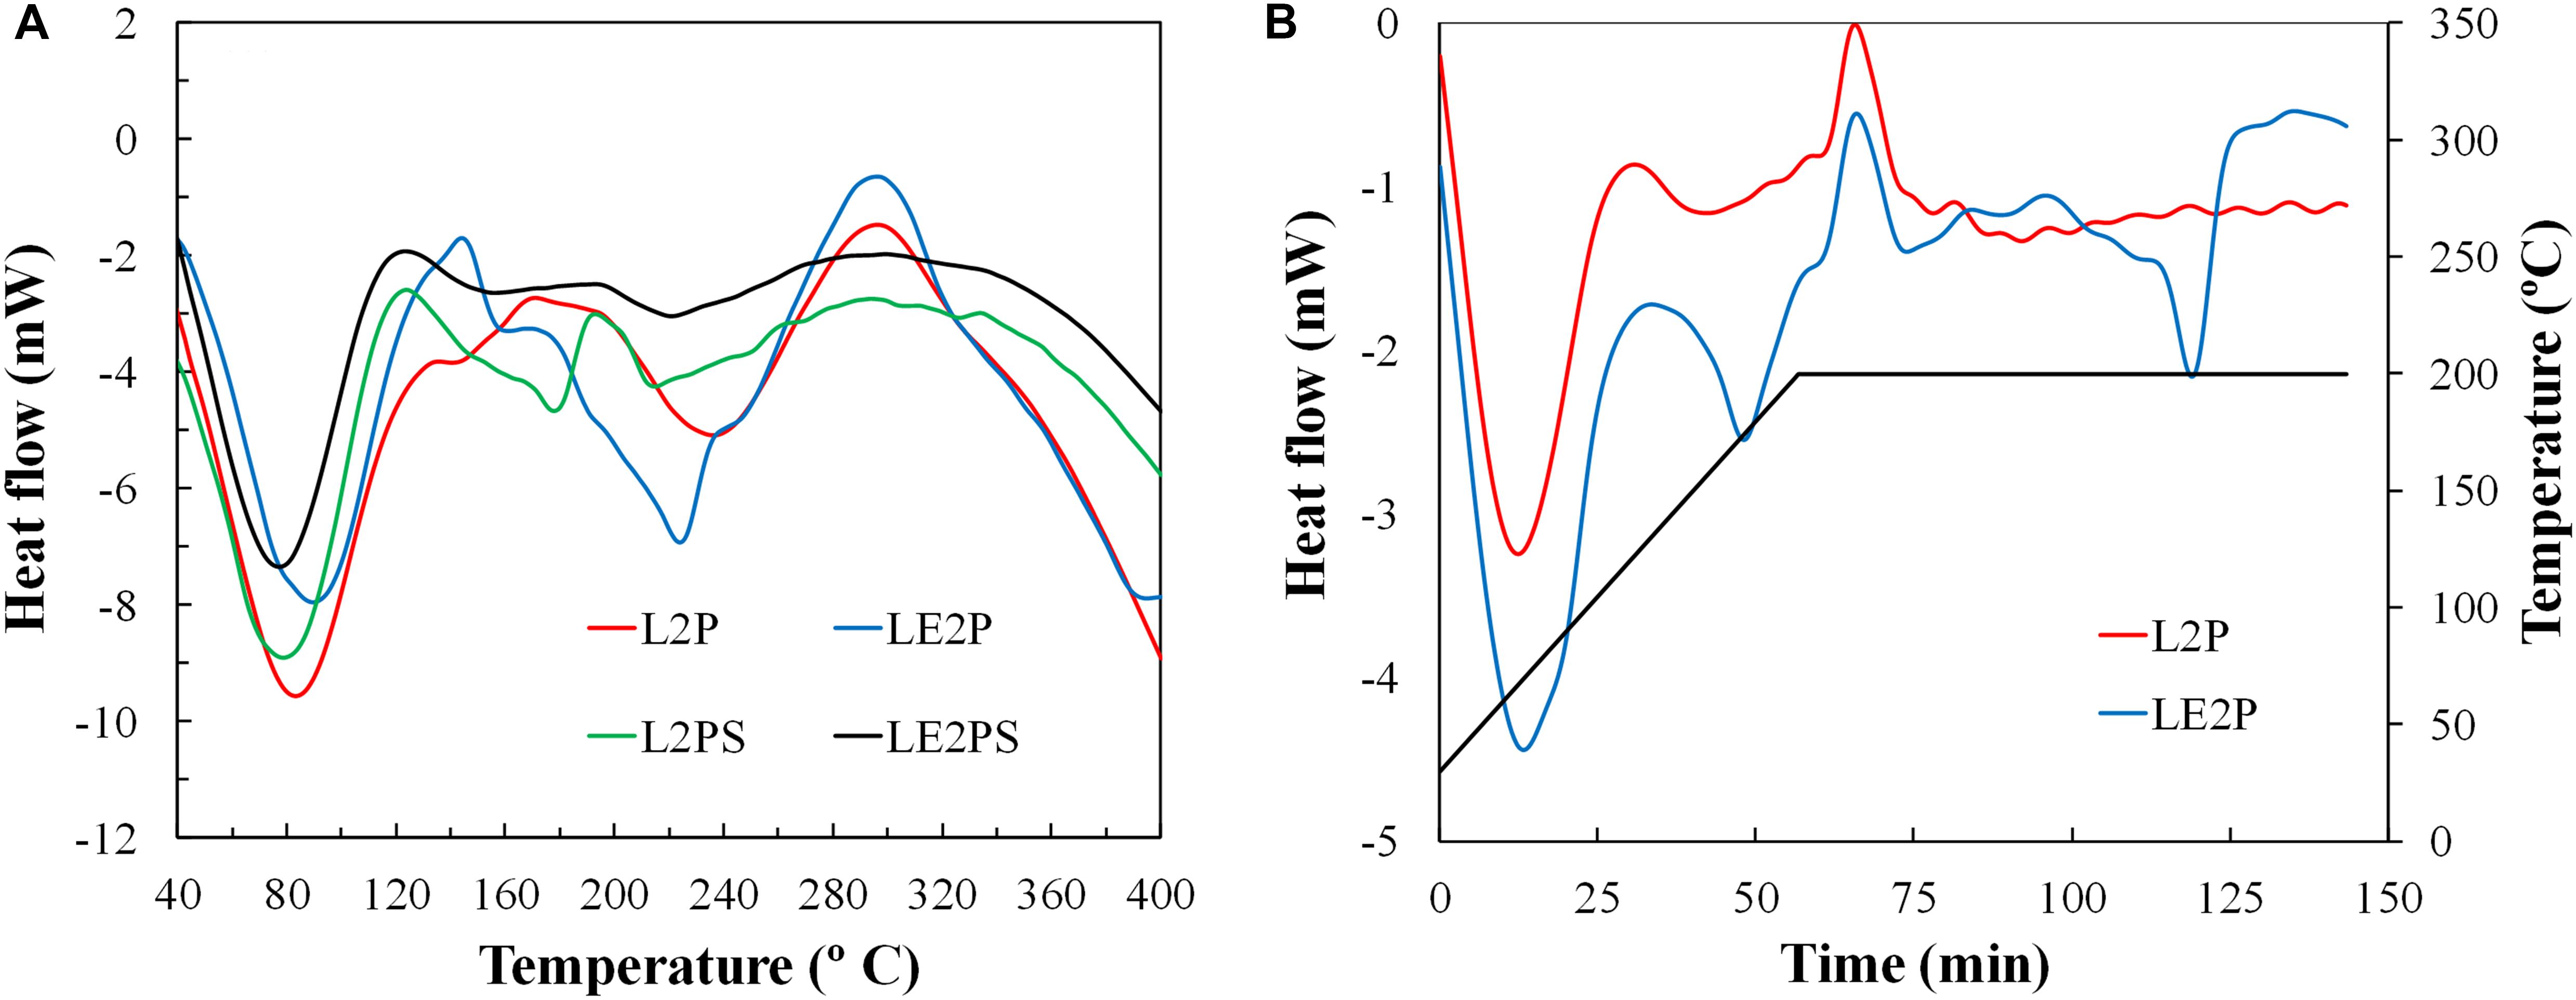
Figure 5. (A) DSC curves during pyrolysis of different lignin-derived samples and (B) DSC curves during treatment of L2P and LE2P with air at 200°C.
A further experiment was carried out trying to simulate the oxidative treatment at 200°C. The corresponding DSC curves are shown in Figure 5B. As can be seen, a sharp exothermic peak appears once the temperature is reached. This exothermic peak could be related to that shown in Figure 5A at 300°C in samples L2P and LE2P, due to different exothermic crosslinking reactions. In this sense, Jagtoyen and Derbyshire (1998) proposed that crosslinking reactions begin to dominate over depolymerization reactions from 200°C. Therefore, if enough time is provided, the reactions could take place at lower temperatures. Another important aspect is the presence of two endothermic peaks only in the sample LE2P. These two peaks could be related to the splitting of the endothermic peak that appears in Figure 5A around 220°C, caused by the superposition of several depolymerization and condensation reactions with different kinetic rates. In this sense, (Montané et al., 2005) already observed with isothermal experiments the existence of several reactions which appears overlapped during DTG analyses of impregnated samples.
Characterization of Activated Carbons
Table 2 shows the yield values of each treatment step and the total yield values for the different prepared activated carbons. As it is well known, phosphoric acid limits the formation of tars during the carbonization treatment, increasing the yield of the remaining solid product (Jagtoyen and Derbyshire, 1998). In this case, the yield of the treatment with air at 200°C is, approximately, 90% for both samples derived from co-solution of lignin and phosphoric acid and impregnated with phosphoric acid. The yield of the activation step (mass of activated sample/mass of impregnated or treated with air sample) was around 75% for samples non-treated with air, and about 85% for samples treated with air. There was approximately a difference of 10%, which practically corresponded to the loss of light hydrocarbons from the lignin degradation that was previously observed during the treatment with air at 200°C. The washing yield (mass of washed sample/mass of activated sample) was around 25%, very similar in all cases, and a total yield of around 60% was obtained for all the activated carbons, with no significant differences observed when lignin was co-dissolved or not with the activated agent and/or when the oxidative stabilization step was or was not performed. The total yield values (mass of activated carbon/mass of lignin) are considerably higher than others reported in the literature for lignin and other lignocellulosic materials (Montané et al., 2005; Puziy et al., 2005; Rosas et al., 2008).
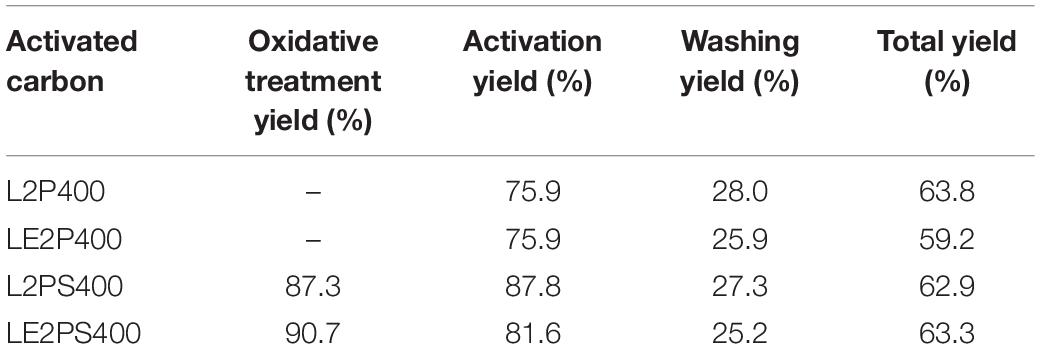
Table 2. Yield values of the lignin activated carbons.
Figure 6 shows the N2 adsorption-desorption isotherms at −196°C of the different activated carbons, prepared at 400°C and with an H3PO4 to lignin mass ratio of 2. The isotherm of the activated carbon L2P400 is a type I isotherm, characteristic of a typical microporous solid, which adsorbs almost all N2 at low relative pressures. No significant changes in the N2 isotherm were observed when lignin was co-dissolved with the activating agent. However, the treatment with air at 200°C produced solids with a remarkable increased N2 adsorbed volume up to 0.4 of relative pressure, which indicated a larger presence of wider microporosity in these carbonaceous solids. This N2 adsorption volume increase was significantly more pronounced when co-solution of lignin and phosphoric acid was carried out previously to the oxidative stabilization step (air at 200°C). The small hysteresis cycle at medium relative pressures shown by the N2 adsorption isotherms indicates the presence (to a lesser extent) of narrow mesopores.
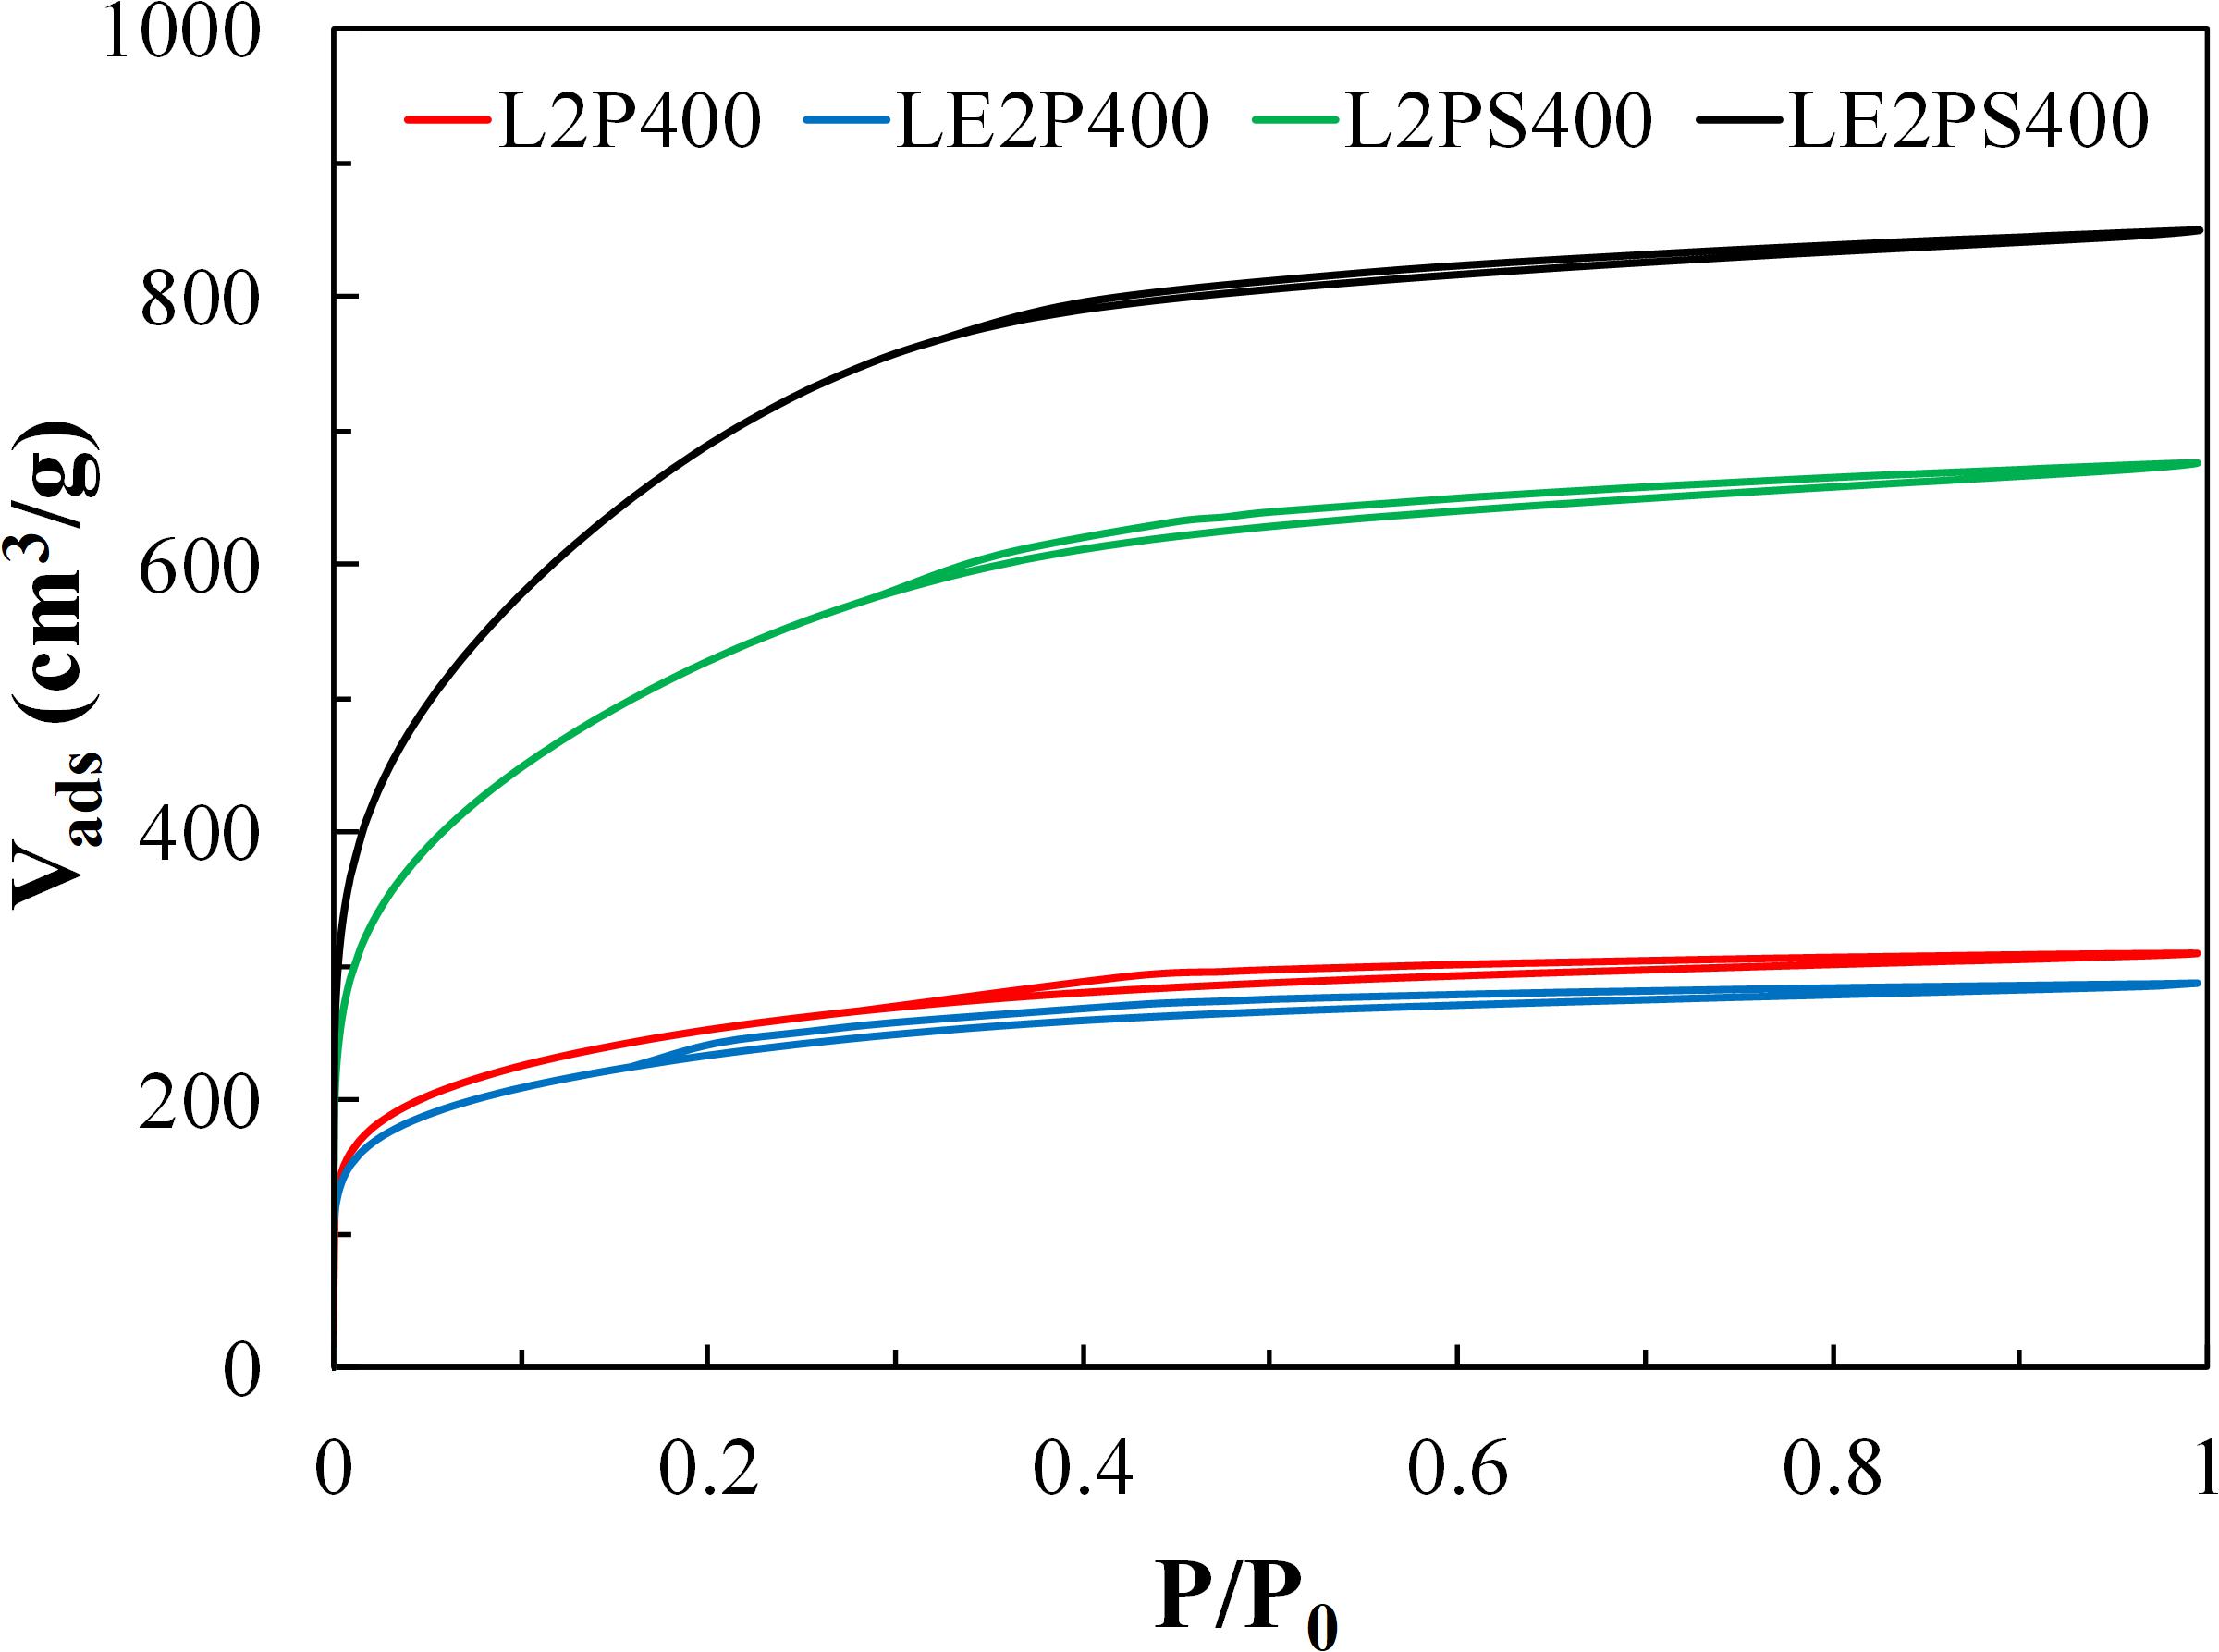
Figure 6. N2 adsorption-desorption isotherms obtained at –196°C of the different activated carbons obtained at 400°C and with H3PO4 to lignin mass ratio of 2.
The textural properties obtained from the N2 and CO2 isotherms of the different activated carbons are summarized in Table 3. The differences between the micropore volumes obtained from N2 (Vt) and CO2 (VDR) isotherms, with higher values for those from N2 ones, confirmed the presence of a wide microporosity for the lignin-derived activated carbons. However, the mesopore volumes are quite low in all the samples. The apparent surface area (ABET) values increased considerably from 912 m2/g for L2P400 to 1937 m2/g for L2PS400, and to 2551 m2/g for LE2PS400. This last value is much higher than others reported in the literature for lignin-derived activated carbons using other activation methods (Rodríguez-Mirasol et al., 1993a, b; Gonzalez-Serrano et al., 1997; Hayashi et al., 2000; Cotoruelo et al., 2007; Babeł and Jurewicz, 2008; Carrott et al., 2008; Sun et al., 2010; Al-Lagtah et al., 2016; Kim et al., 2017; Lin et al., 2019; Rowlandson et al., 2020), including the same activating agent (H3PO4), at similar temperatures and impregnation ratios (Gonzalez-Serrano et al., 2004; Guo and Rockstraw, 2006; Fierro et al., 2007b; Bedia et al., 2010; Rosas et al., 2012). Only a few works reported the preparation of activated carbons from lignin with higher apparent surface areas (∼3000 m2/g) by using KOH activation, but at much higher activation temperatures than those used in this work (Zou and Han, 2001; Fierro et al., 2007a; Li et al., 2014; Fernandez-Ruiz et al., 2018; Han et al., 2019). In the method here proposed, the use of lower activation temperatures would substantially decrease the cost of the obtained activated carbons, without compromising the high development of porosity.
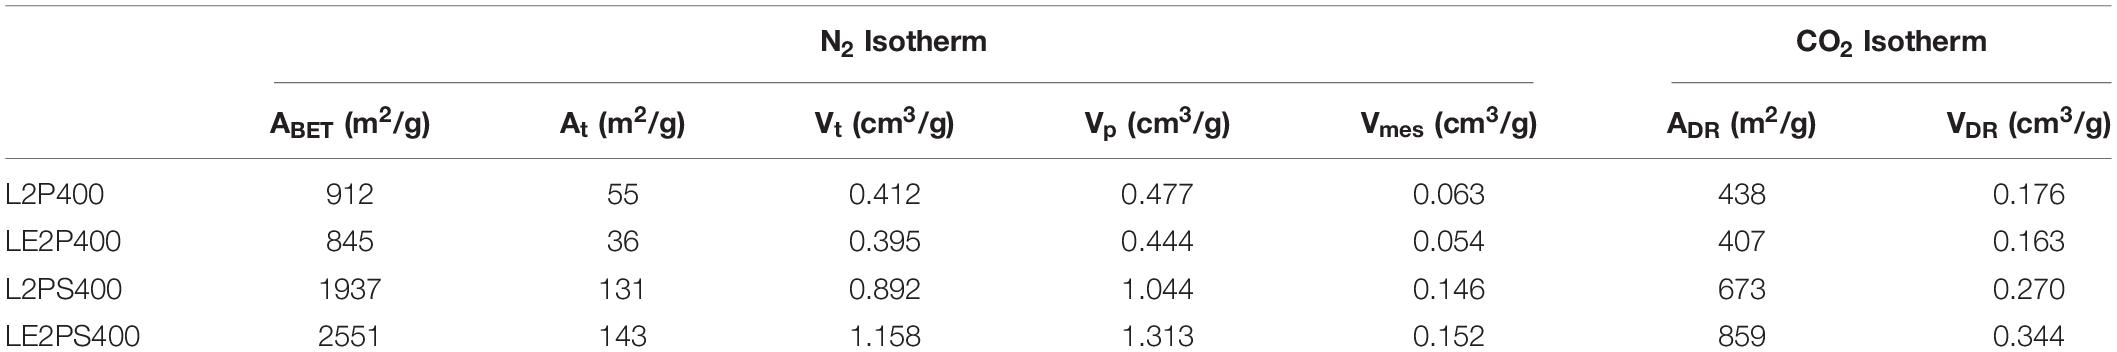
Table 3. Textural properties of the different lignin derived activated carbons obtained from the N2 and CO2 isotherms.
Figure 7 collects the micropore size distribution of the different activated carbons obtained at 400°C and H3PO4 to lignin mass ratio of 2. The activated carbon prepared by direct impregnation of lignin shows a bimodal micropore size distribution, with a main band with a maximum at around 6.7 Å and a second one (shoulder), less intense, with a maximum at around 16 Å, ending at a pore size value of about 40 Å, indicating the presence of narrow mesopores. The micropore size distribution of the activated carbon when lignin was co-dissolved with the activating agent is practically the same as that of the activated carbon prepared by direct impregnation of lignin. However, the treatment with air at 200°C produces a clear change in the bimodal micropore size distribution. This treatment produced an increase of both bands, with the maximum of the first one slightly shifting to higher micropore sizes (from 6.7 to approximately 8.5 Å). However, the increase of the band corresponding to micropores of about 16 Å was proportionally higher than that corresponding to the lower micropore sizes (6.7 to 8.5 Å), even surpassing it in the case of LE2PS400. These results suggest that the treatment with air at 200°C increased the volume of micropores, especially that of the largest pore size (16 Å), and this effect was clearly enhanced by the co-solution of lignin and phosphoric acid. However, this treatment does not appear to greatly affect the micropore (or mesopore) size of the obtained activated carbons.
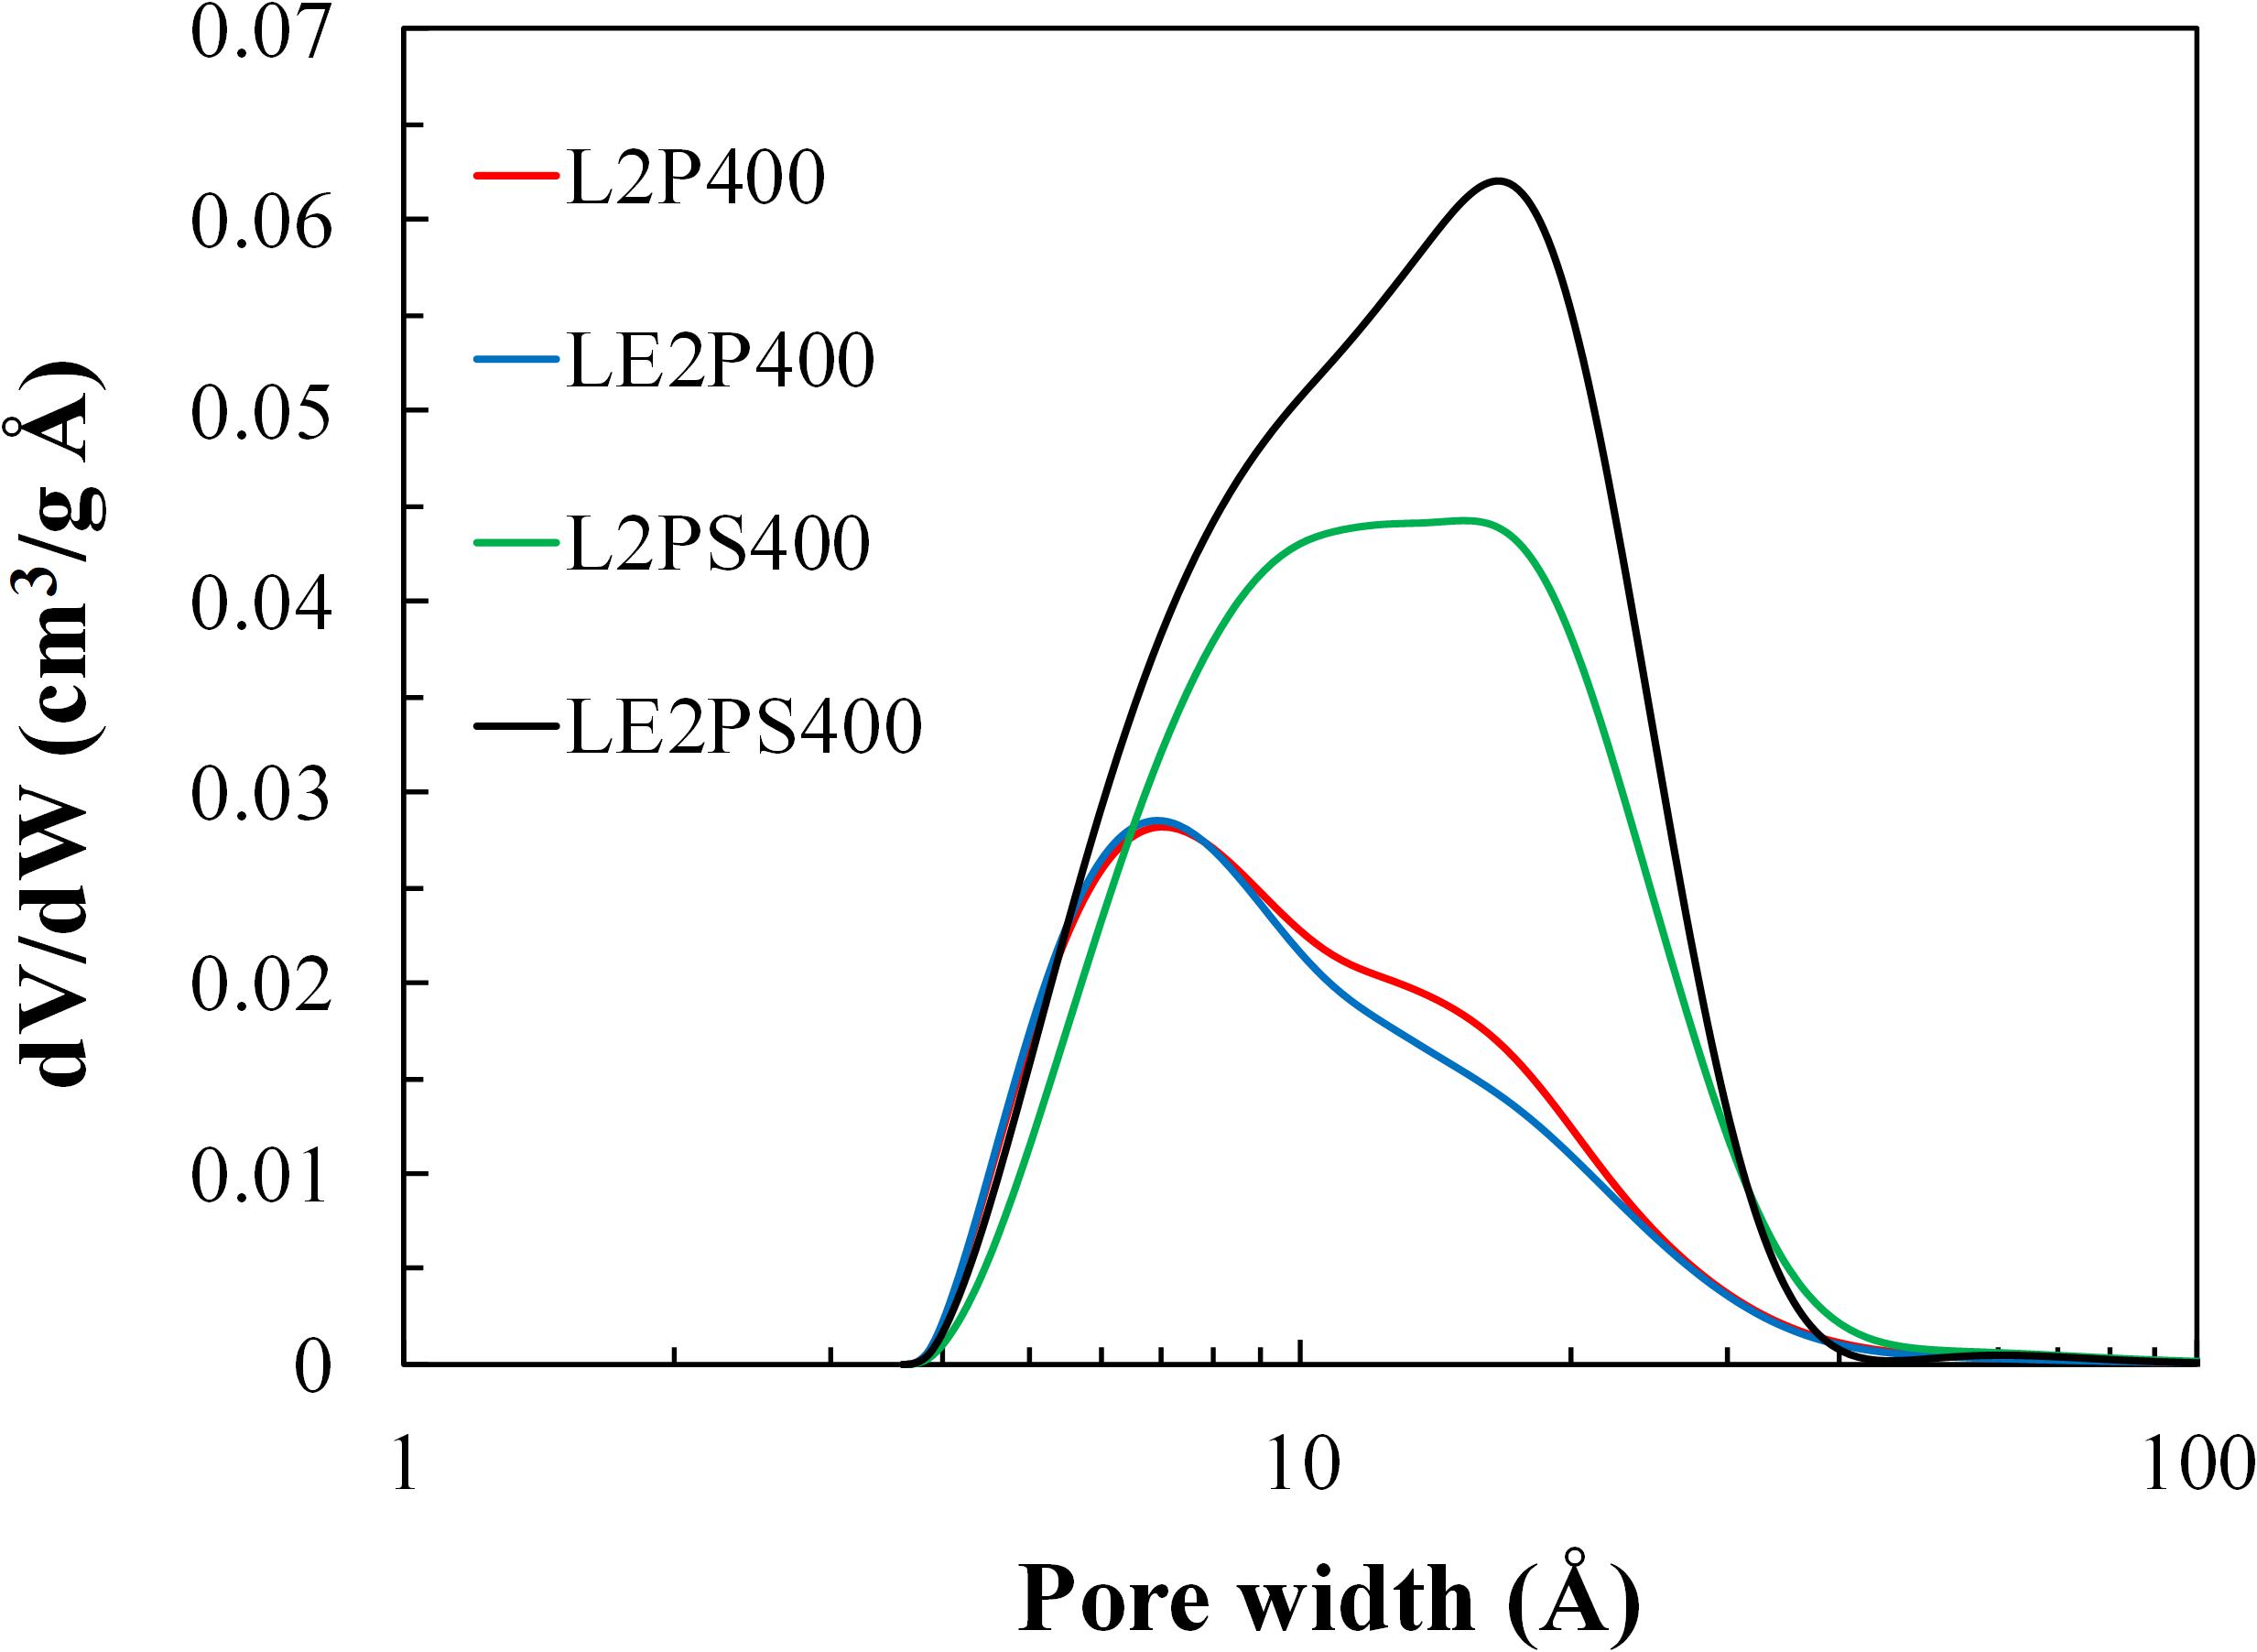
Figure 7. Micropore size distribution of the different activated carbons obtained at 400°C and with H3PO4 to lignin mass ratio of 2.
The present results indicate that the use of co-solution of lignin with phosphoric acid in combination with an oxidative treatment at 200°C provides activated carbons with extremely high specific surface area and a large and wide microporosity. These significant differences in the porous texture seem to be the result of larger and more homogeneous interactions between lignin and the activating agent when they are co-dissolved that may increase the formation of effective phosphate esters, which are the responsible of the cross-linking reactions in the carbonaceous matrix during the oxidative stabilization process (Puziy et al., 2005). To support this hypothesis, TPD (Figure 8) and XPS (not shown) analyses were carried out for the different activated carbons. As it was observed in previous works, activated carbons prepared by chemical activation with phosphoric acid presented most of CO evolution at temperatures higher than 700°C, due to the presence of oxygen-containing P surface groups, which include metaphosphates, mainly as C-O-PO3 groups and C-PO3 groups, which decompose as gaseous CO, producing C-P type surface groups (Bedia et al., 2009; Rosas et al., 2009). In addition, XPS P2p spectra of the different activated carbons, which were very similar to those of the corresponding lignin-derived samples (Figure 3), also evidence the presence of, mainly, C-O-P ones (CO-PO(OH)2 and (C-O)3PO) at 134.2 eV and C-P-O groups (such as C-PO(OH)2 or C2-PO(OH)) at 133 eV. The similarity among the spectra indicated that the contribution of this kind of groups is very similar in the different obtained activated carbons, independently of the preparation method used. In this sense, a similar P surface concentration value of 1.6%wt was obtained for L2P400, L2PS400, and LE2P400. However, the combined effect of the co-solution of lignin and phosphoric acid and the oxidative treatment at low temperature increased this value to 2.4%wt.
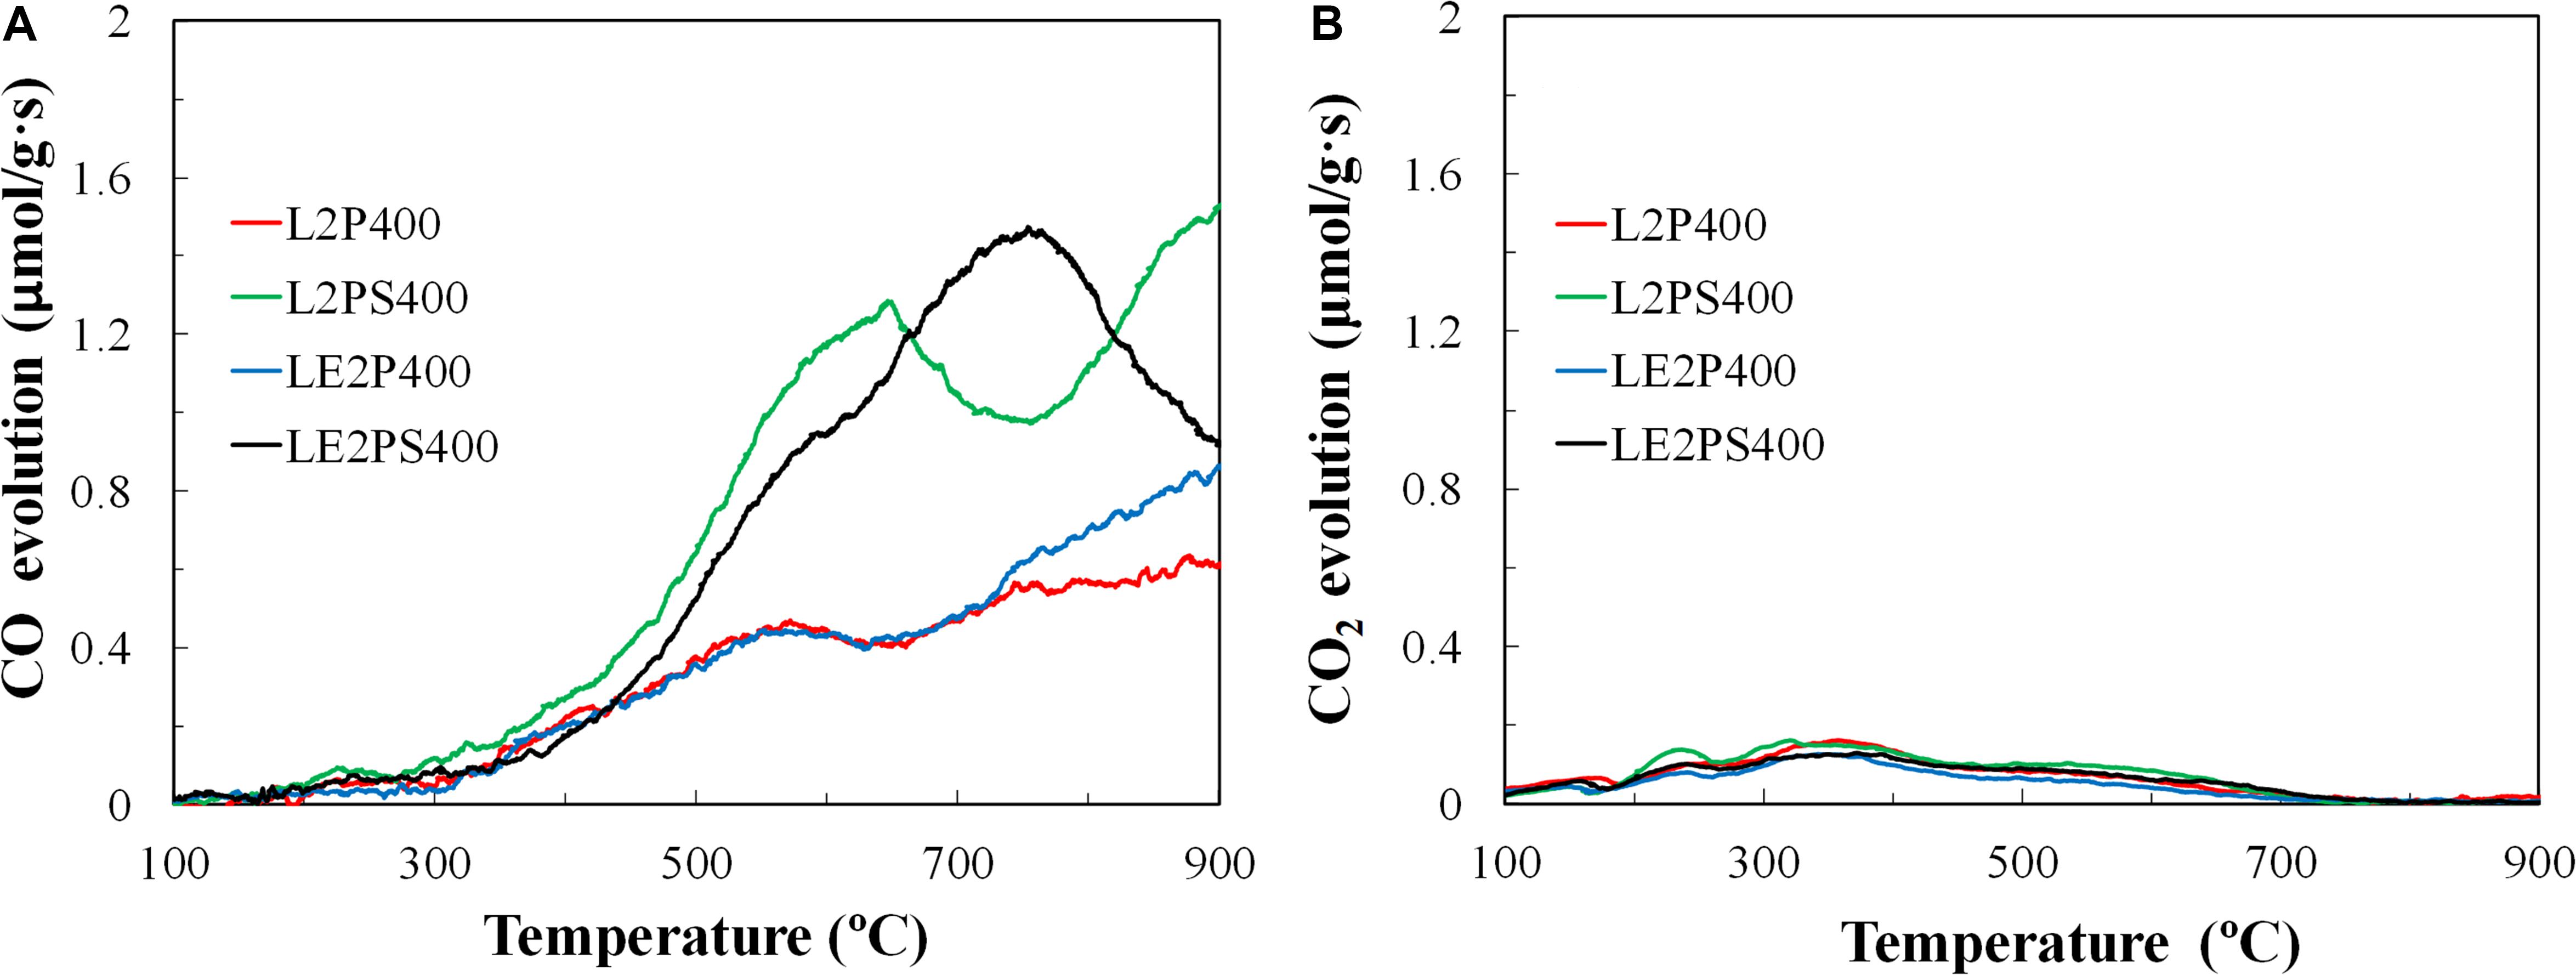
Figure 8. (A) CO and (B) CO2 evolution of the different activated carbons.
TPD CO profiles for the activated carbon prepared from dissolved and not-dissolved lignin are very similar, showing most of their CO release between 700 and 900°C (Figure 8). However, the treatment with air at 200°C and the combined use of this treatment with co-solution of lignin and the activating agent provided a higher release of CO, even at temperatures lower than 700°C. This CO evolution at lower temperatures can be associated to decomposition of mainly phenol and ether surface groups and, to a lesser extent, to anhydride surface groups. As decomposition of this last group also should produce CO2 evolution, the low CO2 evolution for these activated carbons at this temperature range provided evidences of the low presence of anhydride surface groups on those samples. On the other hand, the sample LE2PS400 presented the highest CO evolution between 700 and 800°C, which suggests a higher presence of metaphosphates (C-O-PO3 and/or C-PO3 type) surface groups on this sample (Bedia et al., 2009). These P surface groups, with C-O-P bonds, decompose to gas CO and P surface groups of C-P bond type at these temperatures (Wu and Radovic, 2006). The larger evolution of CO observed in the TPD for LE2PS400 can be associated to a higher generation of phosphate esters during the preparation process, as it was evidenced by FTIR analyses (Figure 2) and by the higher surface P content (2.4%wt) of this activated carbon, revealed by XPS results.
Effect of Temperature of the Oxidative Treatment
Although to our best knowledge the co-solution of the carbon precursor and the activating agent has not been previously reported, some authors have already proposed the activation in two different steps. Toles et al. (1998) analyzed different approaches of acid-activation/oxidation to produce activated carbons with high metals and organics compounds adsorption uptakes. They observed no significant differences on the porosity of samples directly activated in air at 450°C and compared with samples prepared with a further intermediate step at 170°C, obtaining a maximum apparent surface area of ABET = 1662 m2/g. They suggested that the intermediate step was not necessary because the time spent during the ramping stage (averaging approximately 0.8 h) to 450°C was sufficient to allow penetration of the activating agent (phosphoric acid) and any preliminary reactions to take place. Dastgheib and Rockstraw (2001) proposed also a two steps activation process, both of them in air, with the first one up to 215°C, temperature from which ortho-phosphoric acid dehydrates, losing half a molecule of water and forming pyrophosphoric acid, but they do not compare the porosity of activated carbons prepared in other gas atmospheres.
In order to deep in the role of this oxidative treatment, further oxidative treatments were carried out at different temperatures. Table 4 shows the yield values of the lignin derived activated carbons obtained at 400°C and H3PO4/lignin mass ratio of 2, but previously treated at different temperatures under air atmosphere. As can be seen, the yield of the treatment in air decreases as the temperatures increases, due to a higher release of light hydrocarbons and water. The activation and washing yields remain approximately the same regardless of the treatment previously carried out, since the impregnation ratio and the activation temperature is the same in all the samples. Therefore, the total yield values follow the same sequence found for the treatments with air.
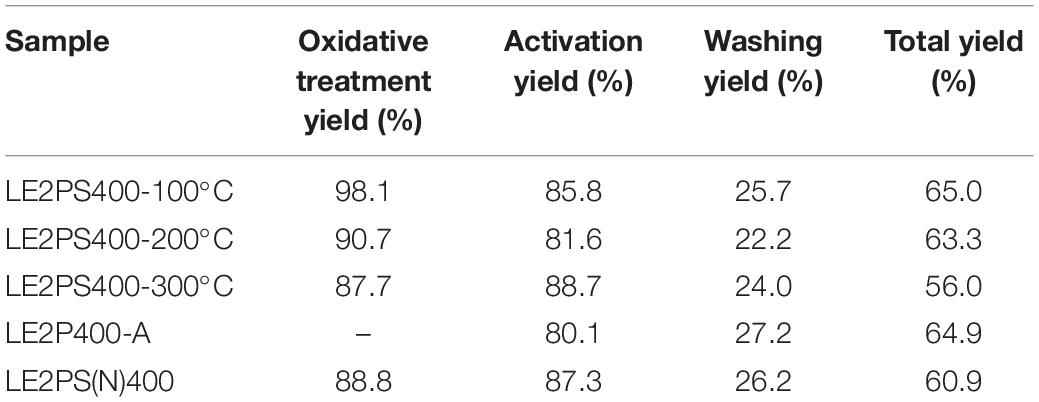
Table 4. Yield values of the lignin-derived activated carbons obtained at 400°C and H3PO4/lignin mass ratio of 2, treated at different temperatures.
Figure 9 shows the N2 adsorption-desorption isotherms at −196°C of the different activated carbons prepared at 400°C and H3PO4/lignin mass ratio of 2, treated at different oxidative temperatures. The isotherms of the series are all of them type I isotherms. The results indicate that the oxidative treatment at 100°C did not generate large porosity development compared to that of the sample without any oxidative treatment. The highest amount of N2 adsorbed volume was observed for the sample treated at 200°C. An increase of this temperature to 300°C slightly reduced the N2 adsorbed volumes. Table 5 collects the textural properties derived from the N2 and CO2 isotherms of the different lignin derived activated carbons obtained at 400°C, a H3PO4/lignin mass ratio of 2 and treated at different oxidative temperatures. As can be seen, the textural properties of the sample treated at 100°C are very similar to those reported in Table 3 for the sample L2P400, which was not submitted to any oxidative treatment. It can also be observed that maximum pore volume (1.31 cm3/g) and apparent surface area (2551 m2/g) were obtained with an oxidative treatment at 200°C, while a relative decrease in the apparent surface area to 2128 m2/g was noticed when the oxidative treatment was performed at 300°C.
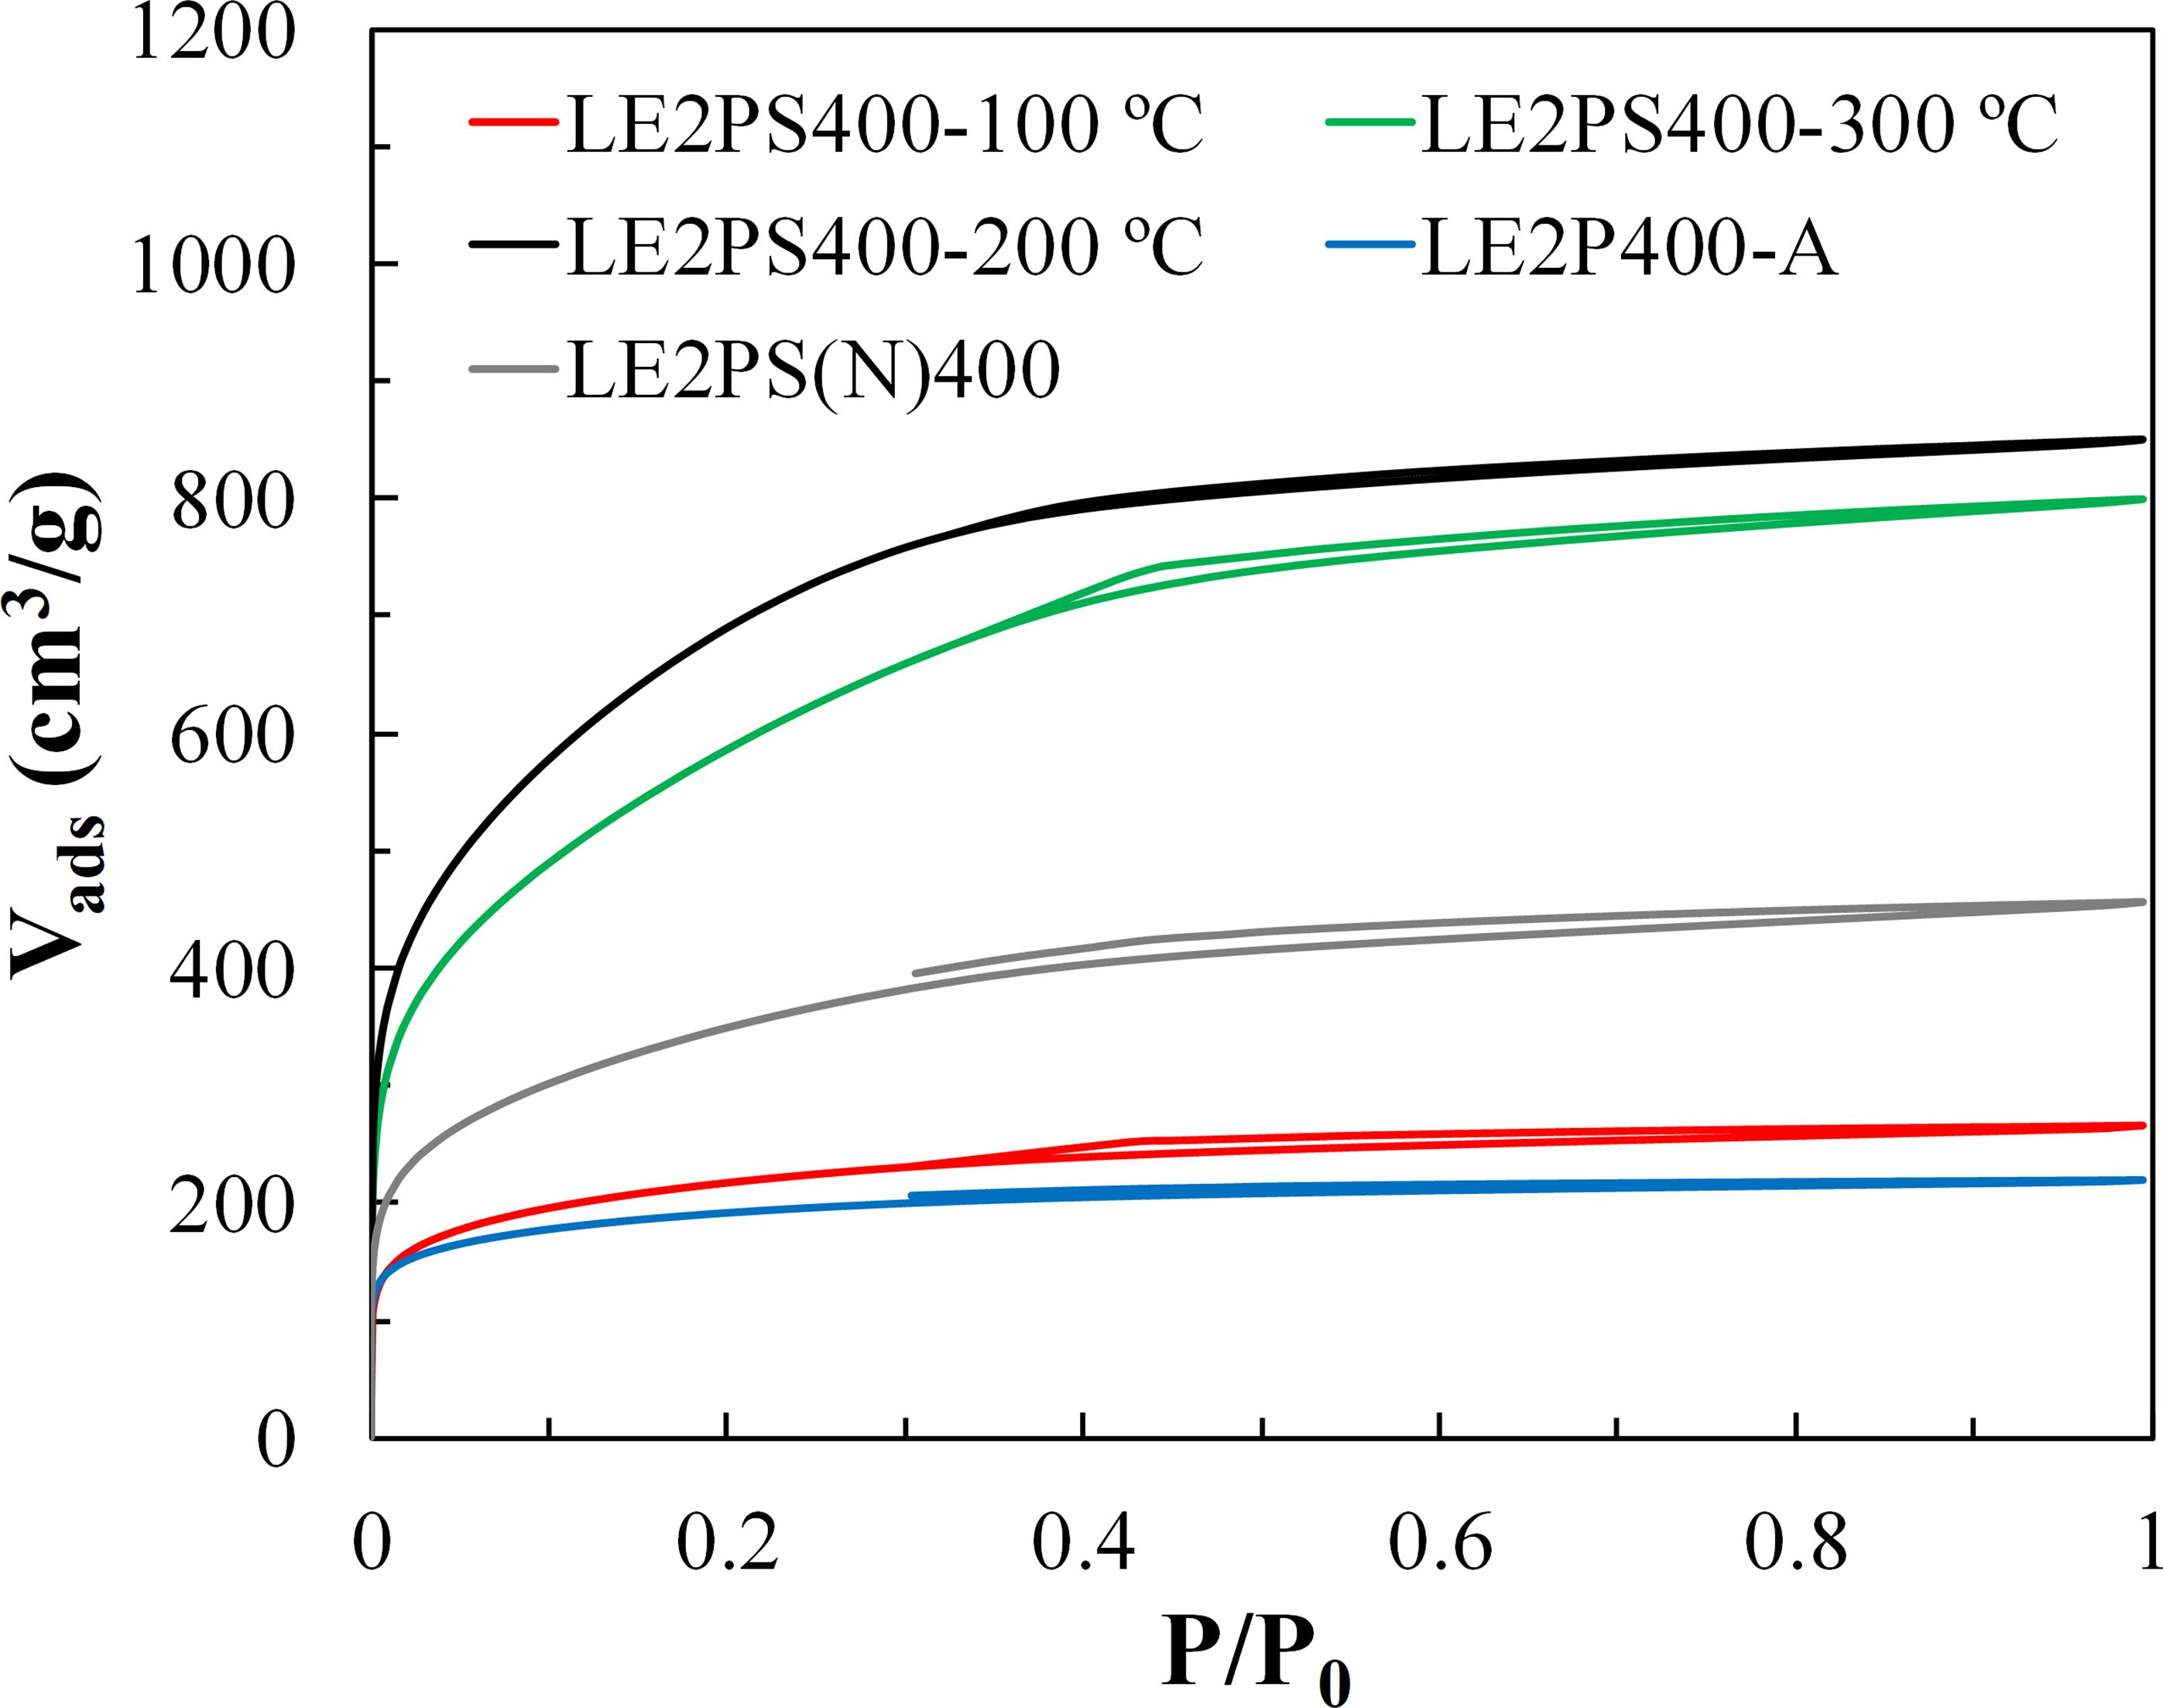
Figure 9. N2 adsorption-desorption isotherms obtained at –196°C of the different activated carbons obtained at 400°C and H3PO4/lignin mass ratio of 2, treated at different temperatures.
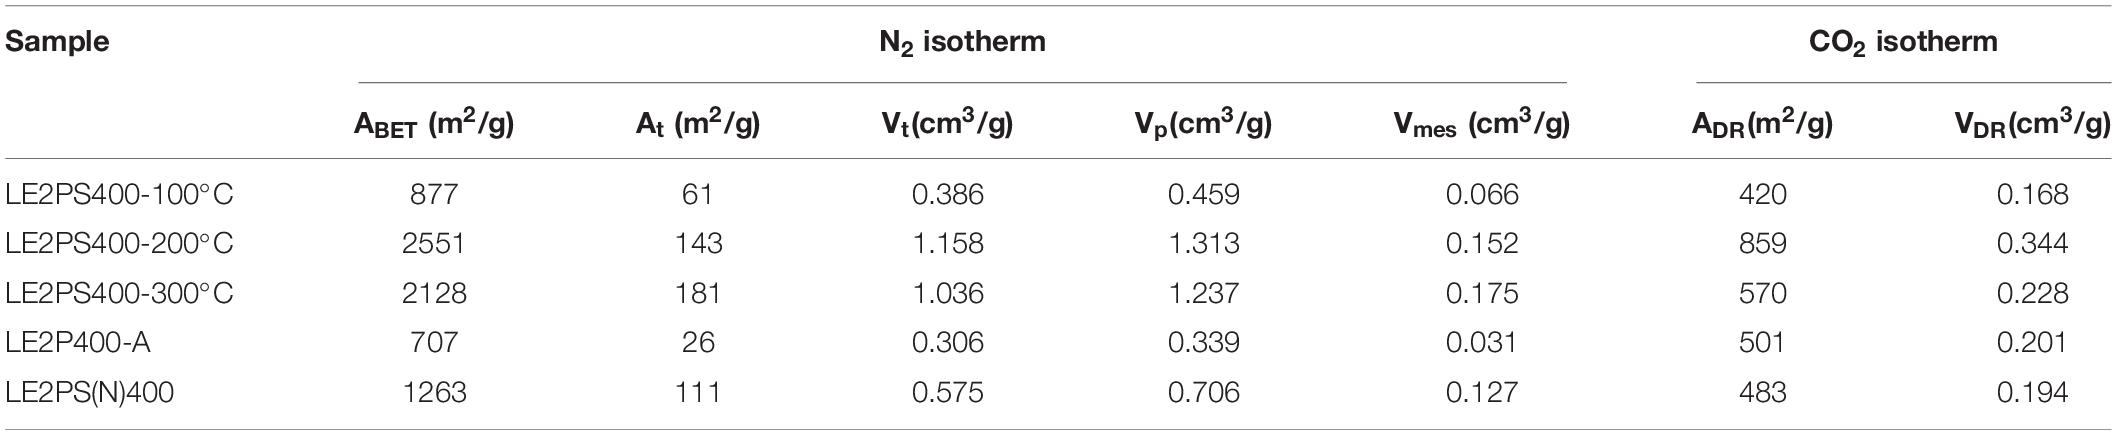
Table 5. Textural properties of the different lignin activated carbons obtained at 400°C and H3PO4/lignin mass ratio of 2, treated at different temperatures under air atmosphere, obtained from the N2 and CO2 isotherms.
The treatment in air at low temperature seems to enhance the formation of phosphate and polyphosphate bridges, which are responsible for connecting and crosslinking the lignin fragments. These phosphorus groups are inserted in the carbon matrix, separating the organic species. These groups generate an expansional process that, after removal of the acid, leaves the matrix in an expanded state, with a high pore development structure. In this case, the highest porosity development is observed when the oxidative treatment is performed at intermediate temperatures (200°C). The treatment at 100°C does not produce any enhancement in the porosity, and at 300°C some reduction begins to be noticed. These differences can be explained, according to the findings of Jagtoyen and Derbyshire (1998) by the fact that bond cleavage reactions that proceed through ionic mechanisms are taking place at low temperature and cross-linking reaction dominates over bond cleavage and de-polymerization reactions from 150°C. Therefore, the results seem to indicate that the presence of oxygen promotes preferentially the cross-linking reactions around 200°C and from this temperature some over-oxidation could take place.
In addition, other experiment was carried out but treating the lignin/H3PO4 samples at 200°C under inert (N2) atmosphere (instead of air), followed by activation also in N2 at 400°C (LE2PS(N)400). The amount of N2 adsorbed volume over the entire range of relative pressure for the sample thus obtained was significantly higher than that observed for the LE2P400 sample, evidencing the presence of larger and wider microporosity. These results suggest that some reactions are being promoted at 200°C even under inert atmosphere, when sufficient time is provided. According to DSC results, it must be related to crosslinking reactions taking place during the decomposition process (Karacan and Soy, 2013) and/or to the polymerization and condensation reaction with H3PO4 (Zhu et al., 2016). Based on these results, it seems that, in agreement with the hypothesis of Toles et al. (1998) there are some kinetic limitations, as can be deduced from the increase of the microporosity with the treatment at 200°C under inert atmosphere, mainly associated to some crosslinking reactions. However, the use of an oxidative atmosphere becomes necessary to boost the porosity development, as pointed out by Dastgheib and Rockstraw (2001), but at adequate experimental conditions, as those previously observed.
In order to provide evidences of a possible over-oxidation of the activated carbon, which avoids the porosity development, a further activation of the LE2P sample at 400°C but directly in air was carried out. The isotherm of the corresponding activated carbon, LE2P400-A, (shown in Figure 9) presented lower N2 adsorption volumes than the ones for the corresponding carbon materials obtained by activation under inert atmosphere. The same tendency was found for the sample L2P also activated in air at 400°C (not shown). In particular, a reduction in the apparent surface area of almost 200 m2/g (Table 5) was observed, suggesting that some over-oxidation has occurred, causing some pores to collapse (Wang et al., 2014). In this line, several authors prepared activated carbons under different gas atmospheres in order to analyze their influence on the porous texture development. However, some discrepancies can be found in these works. Laine et al. (1989) observed an increase of the surface area of activated carbons from coconut shell at 400°C, when forced air was used, varying from 180 (in N2) to 860 (in air) m2/g. Molina-Sabio et al. (1995) suggested that the presence of oxygen at 450°C, at low impregnation ratios (R < 0.32), inhibits the aromatization process, thus reducing the influence of the phosphoric acid in both promoting the development of porosity and reducing the extent of contraction produced during the heat treatment of peach stones. At higher impregnation ratios (R > 0.32), they proposed that the access of air will be more restricted and will have smaller effect on the process. Benaddi et al. (1998) reported very similar micropores volumes and surface areas independently of the gas atmosphere (O2 or N2) used to prepare activated carbons from wood at 480°C. Puziy et al. (2003) associated a maximum of porosity in activated carbons prepared from a styrene–divinylbenzene copolymer in air, at 900°C, to a further air gasification. Wang et al. (2014) mixed ammonium persulfate with phosphoric acid. They proposed that the oxygen generated from decomposition of ammonium persulfate enhanced both the formation of phosphate esters and the formation of CO and CO2 by gasification. At low oxygen dosages, the formation of phosphate esters predominated, hence promoting the crosslinking between phosphoric acid and lignin. They also pointed out that lignin presents higher carbon content than wood and can thus produce more phosphate esters. However, the excessive amount of persulfate leads to over-oxidation and carbon deletion. Furthermore, the over-oxidation also can cause some pores to collapse (Wang et al., 2014).
Based on our results and taking into account the statements of all these authors, it seems that in our experimental conditions, the presence of oxygen at intermediate temperatures, where cross-linking reactions dominate, promote the porosity development due to the creation of more phosphate esters, but at higher temperatures, where the aromatization process preferentially takes place, an excess of oxygen was counter-productive, generating an over-oxidation that would inhibit the increase of the porosity.
This new methodology can be an interesting alternative for the valorization of Alcell lignin into highly porous activated carbons. The high apparent surface area obtained and the presence of surface phosphorus functional groups, which provides to the activated carbons with surface acid character (Valero-Romero et al., 2017) and oxidation resistance (Rosas et al., 2012), open the possibilities for different applications (Puziy et al., 2020). Specifically, these activated carbons can be used in adsorption processes (gas and liquid phases), like adsorbent for basic compounds (Guo et al., 2005; László, 2005; Suhas et al., 2007), in heterogeneous catalytic processes, like catalyst or catalytic support (Bedia et al., 2009, 2010) and even in electrochemistry applications (Hulicova-Jurcakova et al., 2009).
Conclusion
This work analyzes the effect of co-solution of carbon precursor and activating agent on the textural and surface chemistry properties of highly nanoporous activated carbons obtained by chemical activation of Alcell lignin with phosphoric acid. The success of this methodology highlights the possibility of directly using the liquors produced in organosolv process (Alcell) to prepare activated carbons by chemical activation with phosphoric acid. Co-solutions of lignin and phosphoric acid were submitted to a two steps thermal treatment, which consisted of a first oxidative stabilization in air at 200°C, followed by a thermal treatment in N2 at 400°C, where activation of the oxidized lignin with phosphoric acid took place. A lignin-derived activated carbon with very high apparent surface area (2550 m2/g) and pore volume (1.30 cm3/g) was obtained with an initial phosphoric acid to lignin mass ratio of 2. Up to now, this is one of the highest values of apparent surface area reported not only for activated carbons prepared from lignin, but even for porous carbons prepared by chemical activation of other lignocellulosic materials with phosphoric acid. The use of lignin and phosphoric acid solutions provided more homogeneous and effective interactions between the carbon precursor and the activating agent, by the formation of phosphate esters in the lignin matrix, which seems to be a key factor in the subsequent treatments: promoting crosslinking reactions in the carbonaceous matrix during the oxidative treatment in air at 200°C and enhancing the development of a wide porosity during the followed activation thermal treatment.
Data Availability Statement
All datasets generated for this study are included in the article/supplementary material.
Author Contributions
IM and FG-M prepared the activated carbons. IM, FG-M, and JR performed the characterization of the samples and prepared the manuscript. JR, AB, JR-M, and TC developed the synthesis concept and planned the experiments. All authors discussed the result and commented on the manuscript.
Funding
We gratefully thank MICINN and FEDER (Project RTI2018-097555-B-I00) and Junta de Andalucía (Project UMA18-FEDERJA-110) for financial support.
Conflict of Interest
The authors declare that the research was conducted in the absence of any commercial or financial relationships that could be construed as a potential conflict of interest.
References
Al-Lagtah, N. M. A., Al-Muhtaseb, A. H., Ahmad, M. N. M., and Salameh, Y. (2016). Chemical and physical characteristics of optimal synthesised activated carbons from grass-derived sulfonated lignin versus commercial activated carbons. Microporous Mesoporous Mater. 225, 504–514. doi: 10.1016/j.micromeso.2016.01.043
Almendros, G., Martínez, A. T., González, A. E., González-Vila, F. J., Fründ, R., and Lúdemann, H. D. (1992). CPMAS 13C NMR study of lignin preparations from wheat straw transformed by five lignocellulose-degrading fungi. J. Agric. Food Chem. 40, 1297–1302. doi: 10.1021/jf00019a043
Babeł, K., and Jurewicz, K. (2008). KOH activated lignin based nanostructured carbon exhibiting high hydrogen electrosorption. Carbon 46, 1948–1956. doi: 10.1016/j.carbon.2008.08.005
Bedia, J., Rosas, J. M., Márquez, J., Rodríguez-Mirasol, J., and Cordero, T. (2009). Preparation and characterization of carbon based acid catalysts for the dehydration of 2-propanol. Carbon 47, 286–294. doi: 10.1016/j.carbon.2008.10.008
Bedia, J., Rosas, J. M., Rodríguez-Mirasol, J., and Cordero, T. (2010). Pd supported on mesoporous activated carbons with high oxidation resistance as catalysts for toluene oxidation. Appl. Catal. B Environ. 94, 8–18. doi: 10.1016/j.apcatb.2009.10.015
Benaddi, H., Legras, D., Rouzaud, J. N., and Beguin, F. (1998). Influence of the atmosphere in the chemical activation of wood by phosphoric acid. Carbon 36, 306–309. doi: 10.1016/S0008-6223(98)80123-1
Brunauer, S., Emmett, P. H., and Teller, E. (1938). Adsorption of gases in multimolecular layers. J. Am. Chem. Soc. 60, 309–319. doi: 10.1016/j.jhazmat.2010.01.120
Carrott, P. J. M., Suhas, Ribeiro Carrott, M. M. L., Guerrero, C. I., and Delgado, L. A. (2008). Reactivity and porosity development during pyrolysis and physical activation in CO2 or steam of kraft and hydrolytic lignins. J. Anal. Appl. Pyrolysis 82, 264–271. doi: 10.1016/j.jaap.2008.04.004
Cotoruelo, L. M., Marqués, M. D., Díaz, F. J., Rodríguez-Mirasol, J., Cordero, T., and Rodríguez, J. J. (2007). Activated carbons from lignin: their application in liquid phase adsorption. Sep. Sci. Technol. 42, 3363–3389. doi: 10.1080/01496390701626800
Dastgheib, S. A., and Rockstraw, D. A. (2001). Pecan shell activated carbon: synthesis, characterization, and application for the removal of copper from aqueous solution. Carbon 39, 1849–1855. doi: 10.1016/S0008-6223(00)00315-8
Dubinin, M. M., Zaverina, E. D., and Radushkevich, L. V. (1947). Sorption and structure of active carbons I. Adsorption of organic vapors. Zhurnal Fizicheskoi Khimii. 21, 1351–1362.
Espinoza-Acosta, J. L., Torres-Chávez, P. I., Carvajal-Millán, E., Ramírez-Wong, B., Bello-Pérez, L. A., and Montaño-Leyva, B. (2014). Ionic liquids and organic solvents for recovering lignin from lignocellulosic biomass. Bioresources 9, 3660–3687. doi: 10.15376/biores.9.2.3660-3687
Fernandez-Ruiz, C., Bedia, J., Bonal, P., Rodriguez, J. J., and Gómez-Sainero, L. M. (2018). Chloroform conversion into ethane and propane by catalytic hydrodechlorination with Pd supported on activated carbons from lignin. Catal. Sci. Technol. 8, 3926–3935. doi: 10.1039/c8cy00461g
Fierro, V., Torné-Fernández, V., and Celzard, A. (2007a). Methodical study of the chemical activation of Kraft lignin with KOH and NaOH. Microporous Mesoporous Mater. 101, 419–431. doi: 10.1016/j.micromeso.2006.12.004
Fierro, V., Torné-Fernández, V., Celzard, A., and Montané, D. (2007b). Influence of the demineralisation on the chemical activation of Kraft lignin with orthophosphoric acid. J. Hazard. Mater. 149, 126–133. doi: 10.1016/j.jhazmat.2007.03.056
Fiţigău, I. F., Peter, F., and Boeriu, C. G. (2013). Structural analysis of lignins from different sources. World Acad. Sci. Eng. Technol. 7, 98–103.
García-Mateos, F. J., Berenguer, R., Valero-Romero, M. J., Rodríguez-Mirasol, J., and Cordero, T. (2018). Phosphorus functionalization for the rapid preparation of highly nanoporous submicron-diameter carbon fibers by electrospinning of lignin solutions. J. Mater. Chem. A 6, 1219–1233. doi: 10.1039/c7ta08788h
Girard, R. D., and van Heiningen, A. (2000). Delignification rate of White birch chips during etanol-water cooking in a stirred batch reactor with rapid liquor displacement. J. Pulp Pap. Sci. 26, 1–7.
Gonzalez-Serrano, E., Cordero, T., Rodriguez-Mirasol, J., Cotoruelo, L., and Rodriguez, J. J. (2004). Removal of water pollutants with activated carbons prepared from H3PO4 activation of lignin from kraft black liquors. Water Res. 38, 3043–3050. doi: 10.1016/j.watres.2004.04.048
Gonzalez-Serrano, E., Cordero, T., Rodríguez-Mirasol, J., and Rodríguez, J. J. (1997). Development of porosity upon chemical activation of kraft lignin with ZnCl 2. Ind. Eng. Chem. Res. 36, 4832–4838. doi: 10.1021/ie970261q
Guillén, E., Rico, R., López-Romero, J. M., Bedia, J., Rosas, J. M., Rodríguez-Mirasol, J., et al. (2009). Pd-activated carbon catalysts for hydrogenation and Suzuki reactions. Appl. Catal. A Gen. 368, 113–120. doi: 10.1016/j.apcata.2009.08.016
Guo, J., Xu, W. S., Chen, Y. L., and Lua, A. C. (2005). Adsorption of NH 3 onto activated carbon prepared from palm shells impregnated with H 2SO 4. J. Colloid Interface Sci. 281, 285–290. doi: 10.1016/j.jcis.2004.08.101
Guo, Y., and Rockstraw, D. A. (2006). Physical and chemical properties of carbons synthesized from xylan, cellulose, and Kraft lignin by H3PO4 activation. Carbon 44, 1464–1475. doi: 10.1016/j.carbon.2005.12.002
Han, J., Jeong, S. Y., Lee, J. H., Choi, J. W., Lee, J. W., and Roh, K. C. (2019). Structural and electrochemical characteristics of activated carbon derived from lignin-rich residue. ACS Sustain. Chem. Eng. 7, 2471–2482. doi: 10.1021/acssuschemeng.8b05351
Hayashi, J., Kazehaya, A., Muroyama, K., and Watkinson, A. P. (2000). Preparation of activated carbon from lignin by chemical activation. Carbon 38, 1873–1878. doi: 10.1016/S0008-6223(00)00027-0
Higson, A., and Smith, C. (2011). Lignin. York: NNFCC Renewable Chemicals Factsheet The National Non-Food Crops Centre.
Hulicova-Jurcakova, D., Seredych, M., Lu, G. Q., Kodiweera, N. K. A. C., Stallworth, P. E., Greenbaum, S., et al. (2009). Effect of surface phosphorus functionalities of activated carbons containing oxygen and nitrogen on electrochemical capacitance. Carbon 47, 1576–1584. doi: 10.1016/j.carbon.2009.02.006
Jagiello, J., and Olivier, J. P. (2013). 2D-NLDFT adsorption models for carbon slit-shaped pores with surface energetical heterogeneity and geometrical corrugation. Carbon 55, 70–80. doi: 10.1016/j.carbon.2012.12.011
Jagtoyen, M., and Derbyshire, F. (1998). Activated carbons from yellow poplar and white oak by H3PO4 activation. Carbon 36, 1085–1097. doi: 10.1016/S0008-6223(98)00082-7
Jagtoyen, M., Groppo, J., and Derbyshire, F. (1993). Activated carbons from bituminous coals by reaction with H3PO4: the influence of coal cleaning. Fuel Process. Technol. 34, 85–96. doi: 10.1016/0378-3820(93)90093-J
Karacan, I., and Soy, T. (2013). Structure and properties of oxidatively stabilized viscose rayon fibers impregnated with boric acid and phosphoric acid prior to carbonization and activation steps. J. Mater. Sci. 48, 2009–2021. doi: 10.1007/s10853-012-6970-5
Kennedy, L. J., Vijaya, J. J., and Sekaran, G. (2004). Effect of two-stage process on the preparation and characterization of porous carbon composite from rice husk by phosphoric acid activation. Ind. Eng. Chem. Res. 43, 1832–1838. doi: 10.1021/ie034093f
Kim, D., Cheon, J., Kim, J., Hwang, D., Hong, I., Kwon, O. H., et al. (2017). Extraction and characterization of lignin from black liquor and preparation of biomass-based activated carbon therefrom. Carbon Lett. 22, 81–88. doi: 10.5714/CL.2017.22.081
Kubo, S., and Kadla, J. F. (2004). Poly(ethylene oxide)/organosolv lignin blends: relationship between thermal properties, chemical structure, and blend behavior. Macromolecules 37, 6904–6911. doi: 10.1021/ma0490552
Labruquère, S., Pailler, R., Naslain, R., and Desbat, B. (1998). Oxidation inhibition of carbon fibre preforms and C/C composites by H3PO4. J. Eur. Ceram. Soc. 18, 1953–1960. doi: 10.1016/S0955-2219(98)00135-6
Laine, J., Calafat, A., and Labady, M. (1989). Preparation and characterization of activated carbons from coconut shell impregnated with phosphoric acid. Carbon 27, 191–195. doi: 10.1016/0008-6223(89)90123-1
László, K. (2005). Adsorption from aqueous phenol and aniline solutions on activated carbons with different surface chemistry. Colloids Surf. A Physicochem. Eng. Asp. 265, 32–39. doi: 10.1016/j.colsurfa.2004.11.051
Laurichesse, S., and Avérous, L. (2014). Chemical modification of lignins: towards biobased polymers. Prog. Polym. Sci. 39, 1266–1290. doi: 10.1016/j.progpolymsci.2013.11.004
Li, X.-F., Xu, Q., Fu, Y., and Guo, Q.-X. (2014). Preparation and characterization of activated carbon from kraft lignin via KOH activation. Environ. Prog. Sustain. Energy 33, 519–526. doi: 10.1002/ep
Lin, J., Xue, F., and Zhao, G. (2019). Soda lignin-based activated carbon and its adsorption properties. Bioresources 14, 376–386. doi: 10.15376/biores.14.1.376-386
Lippens, B. C., and de Boer, J. H. (1965). Studies on pore systems in catalysts. V. The t method. J. Catal. 4, 319–323. doi: 10.1016/0021-9517(65)90307-6
Martínez De Yuso, A., Rubio, B., and Izquierdo, M. T. (2014). Influence of activation atmosphere used in the chemical activation of almond shell on the characteristics and adsorption performance of activated carbons. Fuel Process. Technol. 119, 74–80. doi: 10.1016/j.fuproc.2013.10.024
Molina-Sabio, M., Caturla, F., and Rodriguez-Reinoso, F. (1995). Influence of the atmosphere used in the carbonization of phosphoric acid impregnated peach stones. Carbon 33, 1180–1182. doi: 10.1016/0008-6223(95)91248-6
Molina-Sabio, M., and Rodríguez-Reinoso, F. (2004). Role of chemical activation in the development of carbon porosity. Colloids Surf. A Physicochem. Eng. Asp. 241, 15–25. doi: 10.1016/j.colsurfa.2004.04.007
Montané, D., Torné-Fernández, V., and Fierro, V. (2005). Activated carbons from lignin: kinetic modeling of the pyrolysis of Kraft lignin activated with phosphoric acid. Chem. Eng. J. 106, 1–12. doi: 10.1016/j.cej.2004.11.001
Moreno-Castilla, C., Carrasco-Marín, F., López-Ramón, M. V., and Alvarez-Merino, M. A. (2001). Chemical and physical activation of olive-mill waste water to produce activated carbons. Carbon 39, 1415–1420. doi: 10.1016/S0008-6223(00)00268-2
Puziy, A. M., Poddubnaya, O. I., Gawdzik, B., and Tascón, J. M. D. (2020). Phosphorus-containing carbons: preparation, properties and utilization. Carbon 157, 796–846. doi: 10.1016/j.carbon.2019.10.018
Puziy, A. M., Poddubnaya, O. I., Martínez-Alonso, A., Suárez-García, F., and Tascón, J. M. D. (2003). Synthetic carbons activated with phosphoric acid III. Carbons prepared in air. Carbon 41, 1181–1191. doi: 10.1016/S0008-6223(03)00031-9
Puziy, A. M., Poddubnaya, O. I., Martínez-Alonso, A., Suárez-García, F., and Tascón, J. M. D. (2005). Surface chemistry of phosphorus-containing carbons of lignocellulosic origin. Carbon 43, 2857–2868. doi: 10.1016/j.carbon.2005.06.014
Puziy, A. M., Poddubnaya, O. I., Socha, R. P., Gurgul, J., and Wisniewski, M. (2008). XPS and NMR studies of phosphoric acid activated carbons. Carbon 46, 2113–2123. doi: 10.1016/j.carbon.2008.09.010
Rodríguez-Mirasol, J., Cordero, T., and Rodríguez, J. J. (1993a). Activated carbons from CO2 partial gasification of eucalyptus kraft lignin. Energy and Fuels 7, 133–138. doi: 10.1021/ef00037a021
Rodríguez-Mirasol, J., Cordero, T., and Rodríguez, J. J. (1993b). Preparation and characterization of activated carbons from eucalyptus kraft lignin. Carbon 31, 87–95. doi: 10.1016/0008-6223(93)90160-C
Rodríguez-Reinoso, F., Molina-Sabio, M., and González, M. T. (1995). The use of steam and CO2 as activating agents in the preparation of activated carbons. Carbon 33, 15–23. doi: 10.1016/0008-6223(94)00100-E
Rosas, J. M., Bedia, J., Rodríguez-Mirasol, J., and Cordero, T. (2008). Preparation of hemp-derived activated carbon monoliths. Adsorption of water vapor. Ind. Eng. Chem. Res. 47, 1288–1296. doi: 10.1021/ie070924w
Rosas, J. M., Bedia, J., Rodríguez-Mirasol, J., and Cordero, T. (2009). HEMP-derived activated carbon fibers by chemical activation with phosphoric acid. Fuel 88, 19–26. doi: 10.1016/j.fuel.2008.08.004
Rosas, J. M., Berenguer, R., Valero-Romero, M. J., Rodríguez-Mirasol, J., and Cordero, T. (2014). Preparation of different carbon materials by thermochemical conversion of lignin. Front. Mater. 1:1. doi: 10.3389/fmats.2014.00029
Rosas, J. M., Ruiz-Rosas, R., Rodríguez-Mirasol, J., and Cordero, T. (2012). Kinetic study of the oxidation resistance of phosphorus-containing activated carbons. Carbon 50, 1523–1537. doi: 10.1016/j.carbon.2011.11.030
Rowlandson, J. L., Edler, K. J., Tian, M., and Ting, V. P. (2020). Toward process-resilient lignin-derived activated carbons for hydrogen storage applications. ACS Sustain. Chem. Eng. 8, 2186–2195. doi: 10.1021/acssuschemeng.9b05869
Ruiz, H. A., Ruzene, D. S., Silva, D. P., Da Silva, F. F. M. I., Vicente, A. A., and Teixeira, J. A. (2011). Development and characterization of an environmentally friendly process sequence (autohydrolysis and organosolv) for wheat straw delignification. Appl. Biochem. Biotechnol. 164, 629–641. doi: 10.1007/s12010-011-9163-9
Smolarski, N. (2012). High-Value Opportunities for Lignin: Unlocking its Potential Lignin potential. Paris: Frost & Sullivan.
Suhas, Carrott, P. J. M., and Ribeiro Carrott, M. M. L. (2007). Lignin–from natural adsorbent to activated carbon: a review. Bioresour. Technol. 98, 2301–2312. doi: 10.1016/j.biortech.2006.08.008
Sun, Y., Wei, J., Wang, Y. S., Yang, G., and Zhang, J. P. (2010). Production of activated carbon by K2CO3activation treatment of cornstalk lignin and its performance in removing phenol and subsequent bioregeneration. Environ. Technol. 31, 53–61. doi: 10.1080/09593330903338411
Sych, N. V., Trofymenko, S. I., Poddubnaya, O. I., Tsyba, M. M., Sapsay, V. I., Klymchuk, D. O., et al. (2012). Porous structure and surface chemistry of phosphoric acid activated carbon from corncob. Appl. Surf. Sci. 261, 75–82. doi: 10.1016/j.apsusc.2012.07.084
Toles, C. A., Marshall, W. E., and Johns, M. M. (1998). Phosphoric acid activation of nutshells for metals and organic remediation: process optimization. J. Chem. Technol. Biotechnol. 72, 255–263. doi: 10.1002/(SICI)1097-4660(199807)72:3<255::AID-JCTB890<3.0.CO;2-P
Valero-Romero, M. J., García-Mateos, F. J., Rodríguez-Mirasol, J., and Cordero, T. (2017). Role of surface phosphorus complexes on the oxidation of porous carbons. Fuel Process. Technol. 157, 116–126. doi: 10.1016/j.fuproc.2016.11.014
Vallejos, M. E., Felissia, F. E., Curvelo, A. A. S., Zambon, M. D., Ramos, L., and Area, M. C. (2011). Chemical and physico-chemical characterization of lignins obtained from ethanol-water fractionation of bagasse. Bioresources 6, 1158–1171.
Wang, Y., Zuo, S., Zhu, Y., Shao, Q., and Ni, Y. (2014). Role of oxidant during phosphoric acid activation of lignocellulosic material. Carbon 66, 734–737. doi: 10.1016/j.carbon.2013.09.048
Wu, X., and Radovic, L. R. (2006). Inhibition of catalytic oxidation of carbon/carbon composites by phosphorus. Carbon 44, 141–151. doi: 10.1016/j.carbon.2005.06.038
Xu, F., Sun, J. X., Sun, R., Fowler, P., and Baird, M. S. (2006). Comparative study of organosolv lignins from wheat straw. Ind. Crops Prod. 23, 180–193. doi: 10.1016/j.indcrop.2005.05.008
Zhu, G. Z., Deng, X. L., Hou, M., Sun, K., Zhang, Y. P., Li, P., et al. (2016). Comparative study on characterization and adsorption properties of activated carbons by phosphoric acid activation from corncob and its acid and alkaline hydrolysis residues. Fuel Process. Technol. 144, 255–261. doi: 10.1016/j.fuproc.2016.01.007
Keywords: Alcell lignin, chemical activation, phosphoric acid, co-solution, activated carbon, phosphate esters, high surface areas
Citation: Moulefera I, García-Mateos FJ, Benyoucef A, Rosas JM, Rodríguez-Mirasol J and Cordero T (2020) Effect of Co-solution of Carbon Precursor and Activating Agent on the Textural Properties of Highly Porous Activated Carbon Obtained by Chemical Activation of Lignin With H3PO4. Front. Mater. 7:153. doi: 10.3389/fmats.2020.00153
Received: 05 March 2020; Accepted: 29 April 2020;
Published: 21 May 2020.
Edited by:
Maria Chiara Bignozzi, University of Bologna, ItalyReviewed by:
Francisco Carrasco-Marín, University of Granada, SpainAlexander M. Puziy, National Academy of Sciences of Ukraine (NAN Ukraine), Ukraine
Copyright © 2020 Moulefera, García-Mateos, Benyoucef, Rosas, Rodríguez-Mirasol and Cordero. This is an open-access article distributed under the terms of the Creative Commons Attribution License (CC BY). The use, distribution or reproduction in other forums is permitted, provided the original author(s) and the copyright owner(s) are credited and that the original publication in this journal is cited, in accordance with accepted academic practice. No use, distribution or reproduction is permitted which does not comply with these terms.
*Correspondence: Juana M. Rosas, am1yb3Nhc0B1bWEuZXM=