 Zongping Chen1,2*
 Yuhan Liang
- 1Key Laboratory of Disaster Prevention and Structure Safety of Chinese Ministry of Education, Guangxi University, Nanning, China
- 2College of Civil Engineering and Architecture, Guangxi University, Nanning, China
This paper presents an investigation on residual properties and axial bearing capacity of steel reinforced recycled aggregate concrete (SRRC) column exposed to elevated temperature. 48 specimens were designed for the static loading test after high temperature exposure. The variables include replacement ratios, designed temperature, target duration, thicknesses of concrete cover, steel ratios and stirrup spacing. From this test, the mass loss ratio and stress load-deformation curve were obtained, and the influences of various parameters on residual bearing capacity were analyzed. ABAQUS was used to calculate the temperature field of specimens to get temperature damage distribution on the cross section concrete. Based on the results from testing and the finite element analysis, a method of calculating the residual bearing capacity of SRRC columns under axial compression after high temperature was presented. It is shown that the bearing capacity of specimens reduced as the heated time and exposure temperature increased while it decreased as the cover thickness and steel ratio decreased. The ductility increased with the increase of steel ratio and stirrup ratio but the opposite result appears if the temperature and coverage of concrete increased. The initial damage value increased as the temperature and fire duration increased; with the increasing of replacement ratio and the decreasing of temperature, the temperature of the cross section would increase gradually. Finally, comprehensive experimental research and numerical simulation analysis results show that the calculation results are in good agreement with the experimental results.
Introduction
With the advancement of modernization, old buildings are gradually replaced by new ones, which leads to a number of construction waste. In order to solve this problem, scientific researchers proposed the use of recycled aggregate concrete, using waste aggregate in new buildings again (Shatarat et al., 2019), which not only alleviates the overexploitation of natural resources, but also protects the environment (Yaragal et al., 2016; Zhu et al., 2018). Research suggests that recycled aggregate concrete has good mechanical properties and deformation capacity, and can be used in building structures, although it has some problems such as brittleness and dispersion of mechanical properties (Xiao et al., 2012; Marques et al., 2013; Ashish and Saini, 2018; Murali et al., 2018; Shatarat et al., 2018).
Various measures have been taken in order to improve the mechanical properties of recycled aggregate concrete members (Tabsh and Abdelfatah, 2009; González Fonteboa et al., 2011; Saha and Rajasekaran, 2016; Djelloul et al., 2018; Marthong et al., 2018). Compared with ordinary reinforced concrete structure, steel reinforcement can effectively improve the bearing capacity and deformation capacity. Therefore, a number of studies were carried out about the application prospects of steel reinforced recycled aggregate concrete (SRRC) members (Chen et al., 2014a, b) worldwide.
Previous research works have been conducted on the interface slip performance of SRRC columns, the flexural and shear properties of SRRC beams, the axial compression, eccentric compression properties and seismic performance of SRRC columns (Ma et al., 2015). Results show that the confining effect of steel reinforcement significantly improves the mechanical properties of recycled aggregate concrete, even if recycled aggregate concrete has mechanical defects with conventional concrete. Therefore, the mechanical properties of SRRC structures and conventional steel reinforced concrete (SRC) structures are similar and the SRRC structures which are reasonably designed can be used in engineering widely (Liu et al., 2019).
With the increase of building height and urban population, fire hazards are more serious. In view of the high temperature post-stress performance of different types of members, relevant experimental studies have been carried out by researchers. Previous studies have shown that the load-carrying capacity and stiffness of conventional SRC members subjected to high temperature can be reduced. This is influenced by many factors such as the size of the elements, loading mechanisms, duration of exposure and furnace settings (Marques et al., 2013).
The materials properties of recycled aggregated makes the behavior of SRRC structures more random under extreme conditions. Studies have been conducted on mechanical properties of recycled concrete materials under high temperature by Zega and Di Maio (2009), revealing that the strength of the recycled aggregate concrete material is seriously degraded due to the high temperature and the strength decreased as the test temperature increased. The fire resistance will directly affect the popularization and application of SRRC structures and the improvement in fire resistance is in great demand. It is necessary to carry out research on the performance of SRRC structures after fire with the further research and the needs of engineering applications.
Test Program
Specimen Detail
A total of 48 specimens of solid-bulb steel recycled aggregate concrete axial compression columns were designed and manufactured in the test. Specimen designation is illustrated as follows. Each label started with SRRAC for specimens, respectively, which was followed by a dash. Each of these letters was followed by a number that was used to specify the value of the given parameter. The dash was followed by a subsequent number [i.e., 0, 30, 50, 70, or 100 (in percent)] that was used to indicate the replacement ratio of the recycled aggregate. The following number (i.e., 20, 200, 300, 400, 500, 600, 700, or 800) were used to represent the test parameters, namely, the maximum temperature during the test, respectively. In addition, the number “20” indicates that the experimental conditions are at normal temperature. Finally, the last number in the specimen designation (i.e., 1, 2, 3, 4, or 5) were used to distinguish five nominally identical specimens.
The section size and the steel distribution form are shown in Figure 1, of which the section steel section specification is I10, I12. The paper initially provides a summary of the experimental program, including specimen properties and the testing procedure. Following this, the results of the experimental program are presented. Finally, a detailed discussion on the results of the experimental study is provided: where the influence of the replacement percentage of recycled aggregates (0, 30, 50, 70, 100%), the maximum temperature during the test (the maximum temperature at room temperature, 200, 300, 400, 500, 600, 700, 800°C), the constant heating time (10, 60, 180 min), the thickness of cover concrete (30, 40, 50 mm), the steel ratio (4.41, 5.59%), the spacing of stirrups (100, 150 mm), and the length of the side of the stirrups (160, 180, 200 mm). Details of these specimens are given in Table 1.
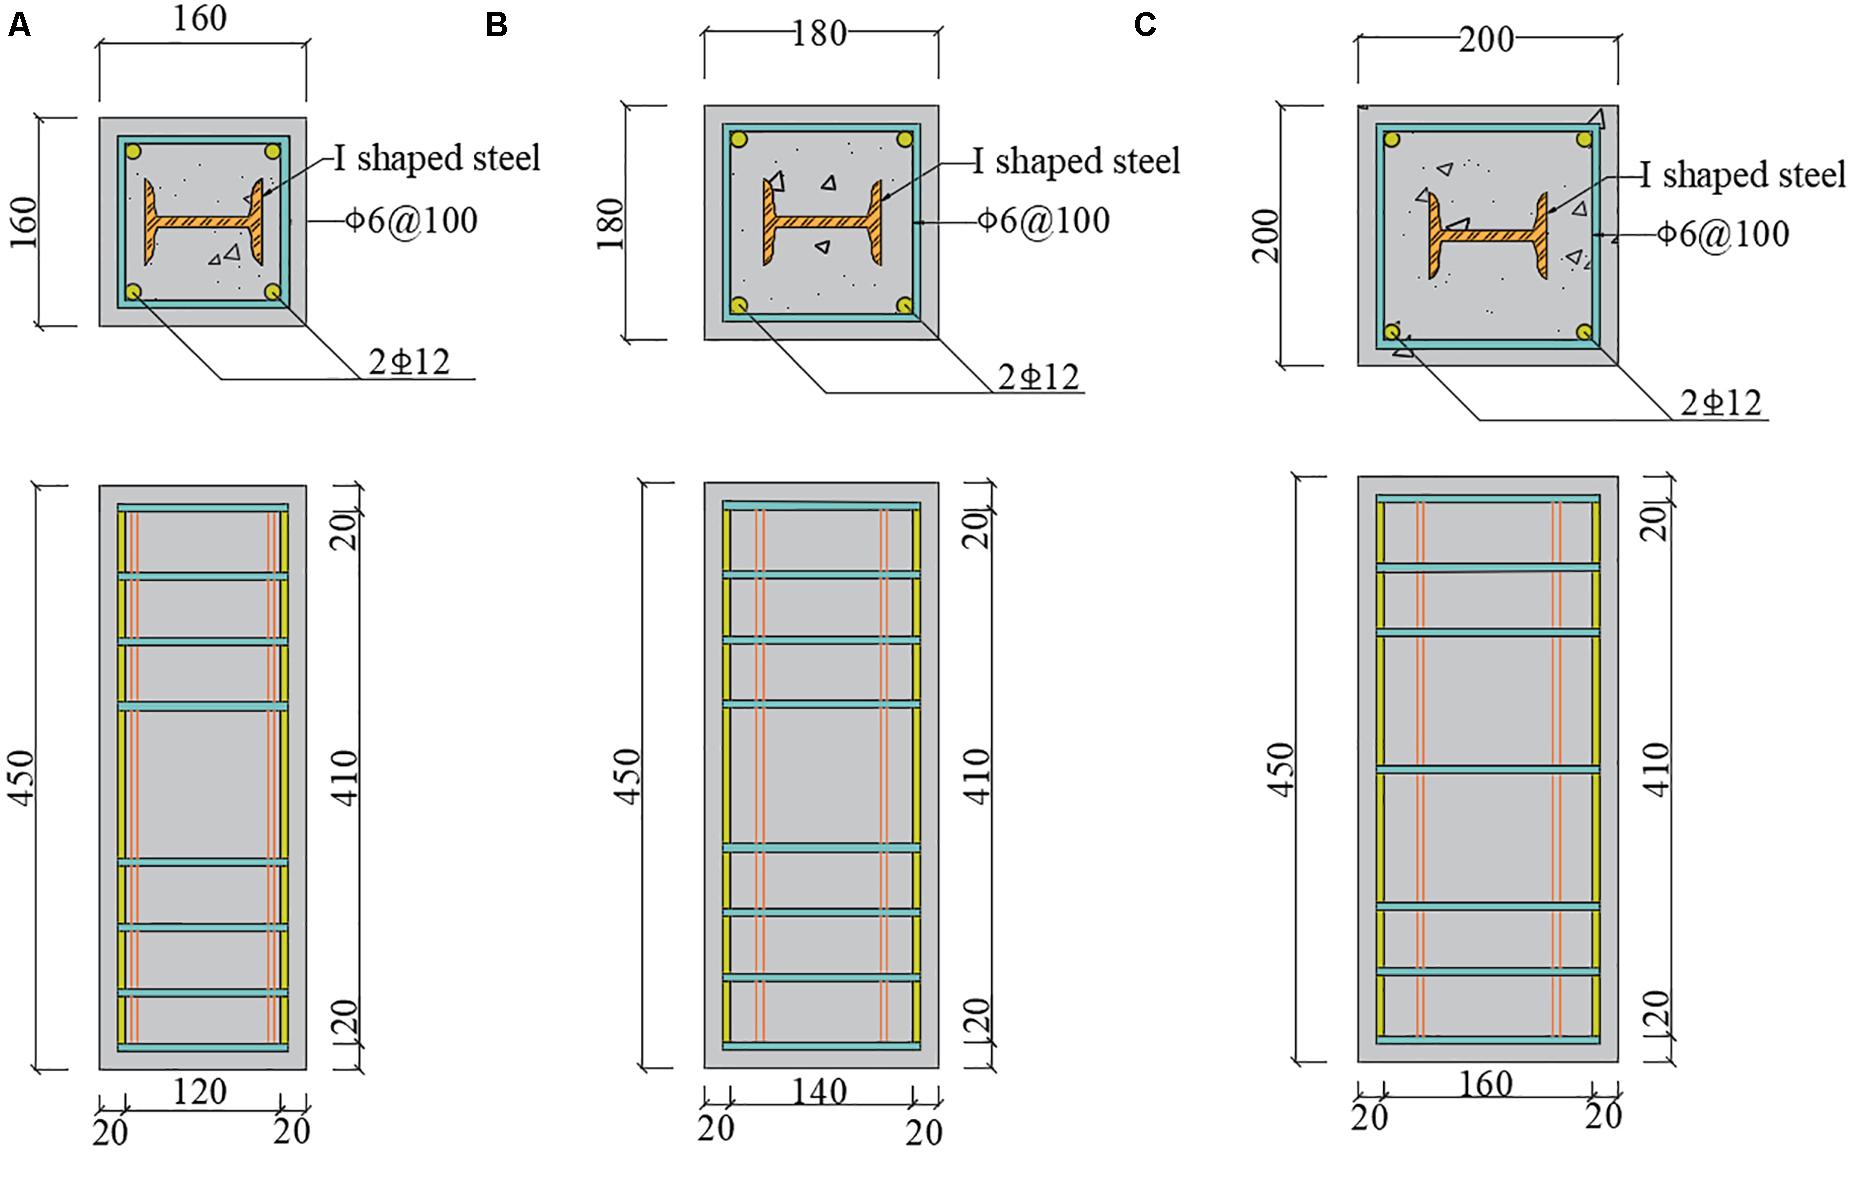
Figure 1. Section size and steel layout of specimens. (A) C = 160, (B) C = 180, (C) C = 200.
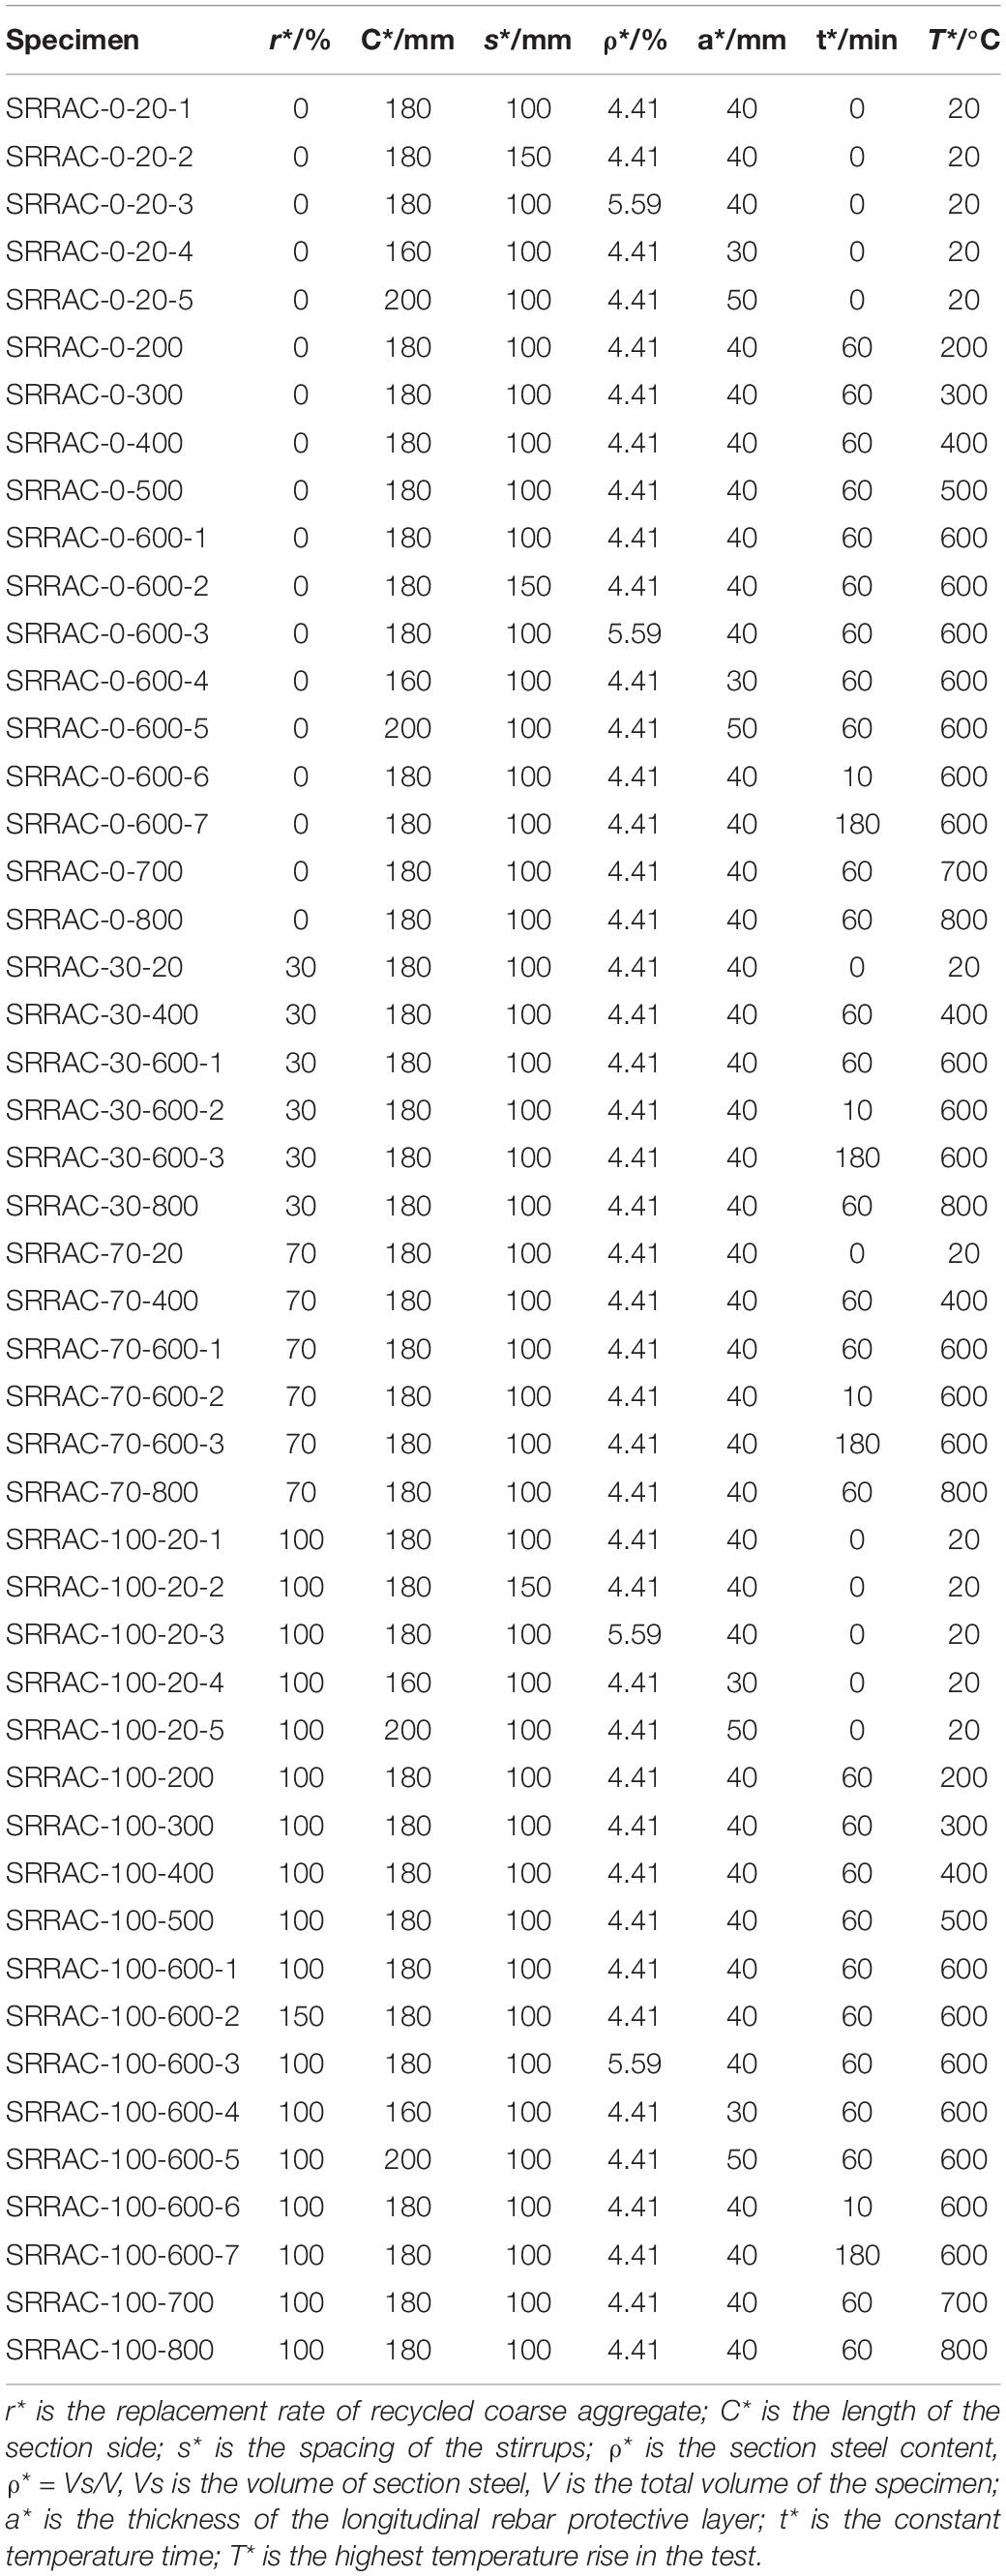
Table 1. Design parameters of specimens.
Materials
(a) Ordinary Portland cement with a 28-day compressive strength of 32.5 MPa.
(b) Well-graded small and medium-size river sand.
(c) Mixing water with urban tap water.
(d) Two types of coarse aggregate: crushed rock aggregate (CRA) and recycled crushed rock aggregate (RCRA). They all had a maximum size of 20 mm and a minimum size of 5 mm. The crushed waste concrete was collected from concrete blocks produced in the laboratory with a target strength of 30 MPa.
All recycled aggregate concrete were produced by jaw crusher, which was then sieved and cleaned under the same conditions as the natural coarse aggregate.
As shown in Table 2, the test water-cement ratio was 0.43 and the sand ratio was 32%. Shaped steel and structural steel reinforcement were used in the SRC columns. Three different types of shaped steel were selected, as well as two types of steel rebar, whose manufacturer supplied properties and is summarized in Table 3. Steel coupons were preserved for tensile test after having experienced high temperature with columns.
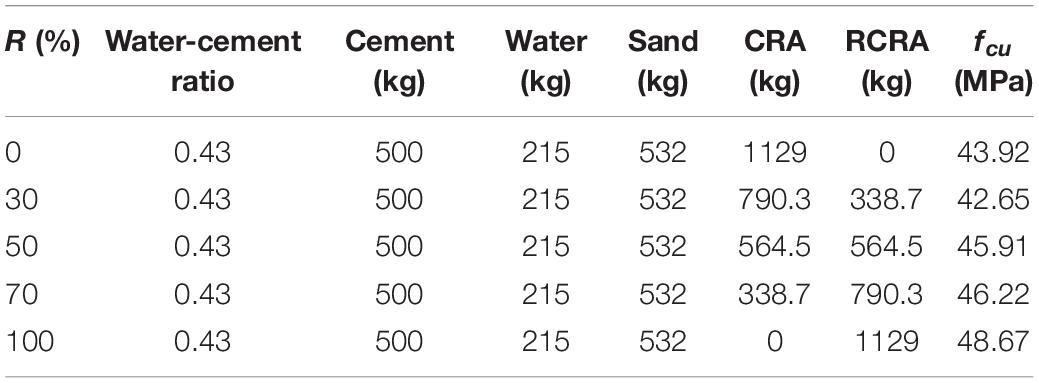
Table 2. Mix proportions and strength of recycled aggregate concrete.
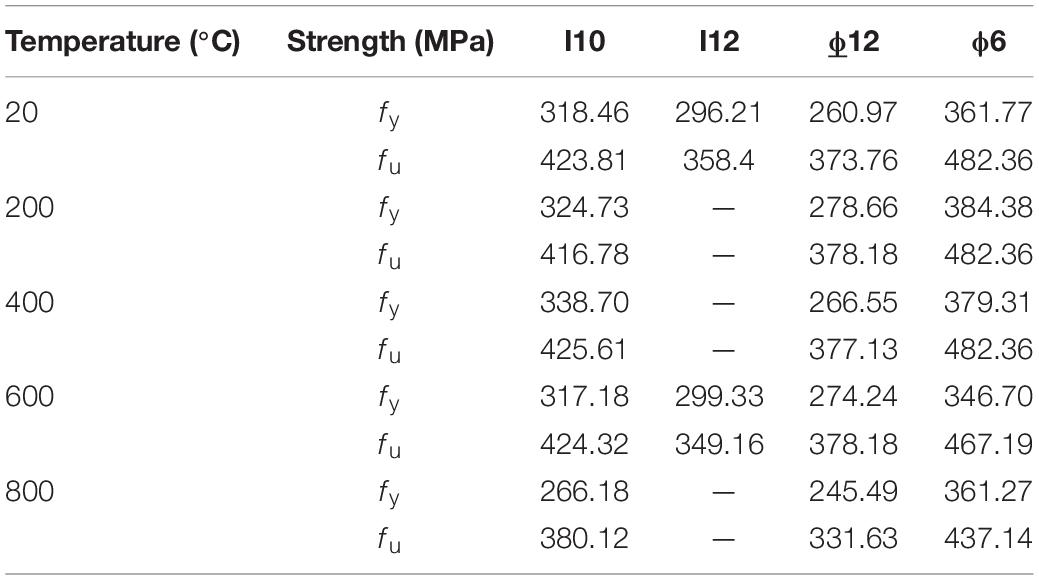
Table 3. Steel mechanical properties at different temperature.
Instrumentation and Testing
Heat treatment of specimens was carried out in a RX3-45-9 electric oven, which has an automated device to control the temperature rising rate and all the specimens which were exposed to fire on its four surfaces (upright placing) in the furnace. According to the equipment’s performance parameter, the heating rate was 10°C/min, when it reached the target temperature for each group of specimens, the temperature would be automatically constant. The rated power of the machine was 45 kW, the maximum temperature that can be reached 950°C. Considering the effects of maximum temperature and target duration separately, samples were heated in batches to obtain different temperature fields. In addition, the flame-retardant coating was brushed in the upper and lower ends and the end 80 mm of the specimen before heating to simulate the heating of beam column joints in actual fire. As provided in Figure 2A. It can be seen from Figure 2A that the temperature curves of 600 and 800°C have a sudden drop, which is caused by an unexpected power failure during the test. There was no thermocouple in the specimen, so the heating curve was collected according to the temperature in the furnace.
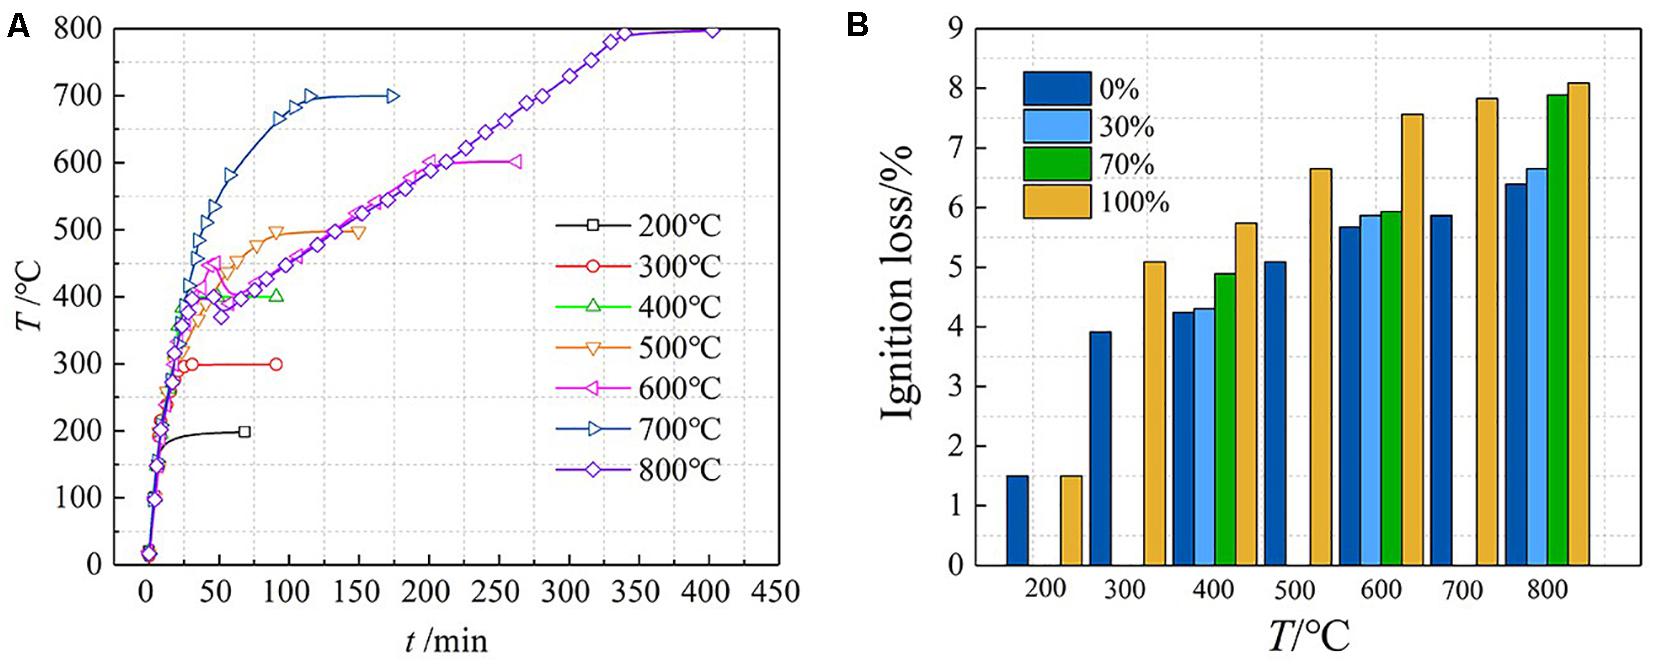
Figure 2. Heating curves and ignition loss of specimens. (A) Heating curves, (B) Ignition loss of specimens.
Test Setup and Loading Process
After being exposed to high temperatures, specimens were then cooled naturally to room temperature in the opened furnace. The RMT-201 rock and concrete mechanical test system was used to carry out static loading test on the specimens after high temperature, and axial pressure was applied on the specimens. The loading rate was 0.01 mm/s and the load-deformation curve of the specimen was obtained by the data logger of the device itself.
Test Results and Discussion
Phenomenon After Elevated Temperatures
Compared with the reference specimen, a color change was witnessed on the surface of the specimens after fire. The unheated specimen (T = 20°C) was gray white beige with no crack on the surface; when T = 200°C, the specimen was darker and greenish gray with no crack on the surface of the concrete; when T = 500°C, the specimen became taupe and a crack appeared on the concrete. As the temperature rose, the color of the concrete gradually turned dark and a small amount of temperature crack appeared on the concrete surface. When T = 800°C, the specimen turned ash black and concrete peeling appeared on the surface and the width and depth of the crack developed wider. The cracks of the concrete and the exterior color of specimens after elevated temperatures were illustrated in Figure 3.
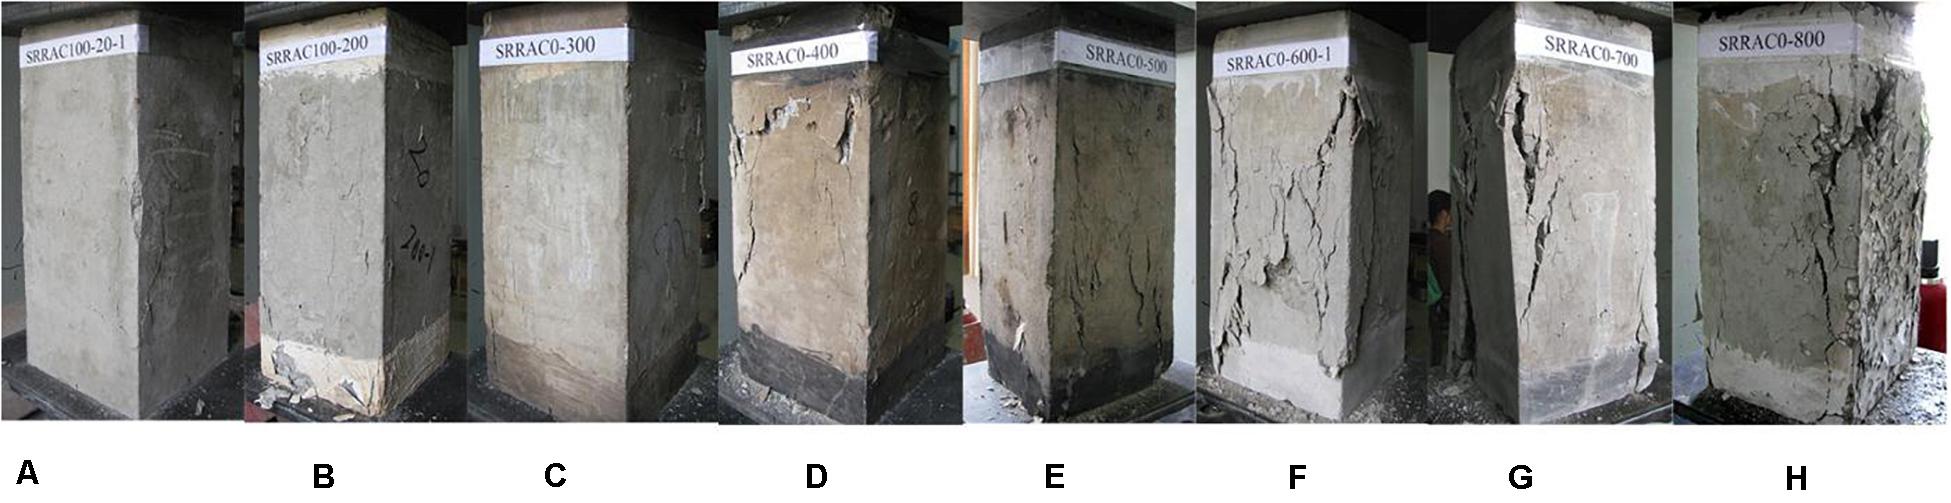
Figure 3. Peak load failure appearance and exterior color of specimens after elevated temperatures. (A) 20°C, (B) 200°C, (C) 300°C, (D) 400°C, (E) 500°C, (F) 600°C, (G) 700°C, (H) 800°C.
In the heating process, water vapor started at about 300°C and last about 40 min. Damage observations of specimens varied from different target temperatures as presented in Table 4.
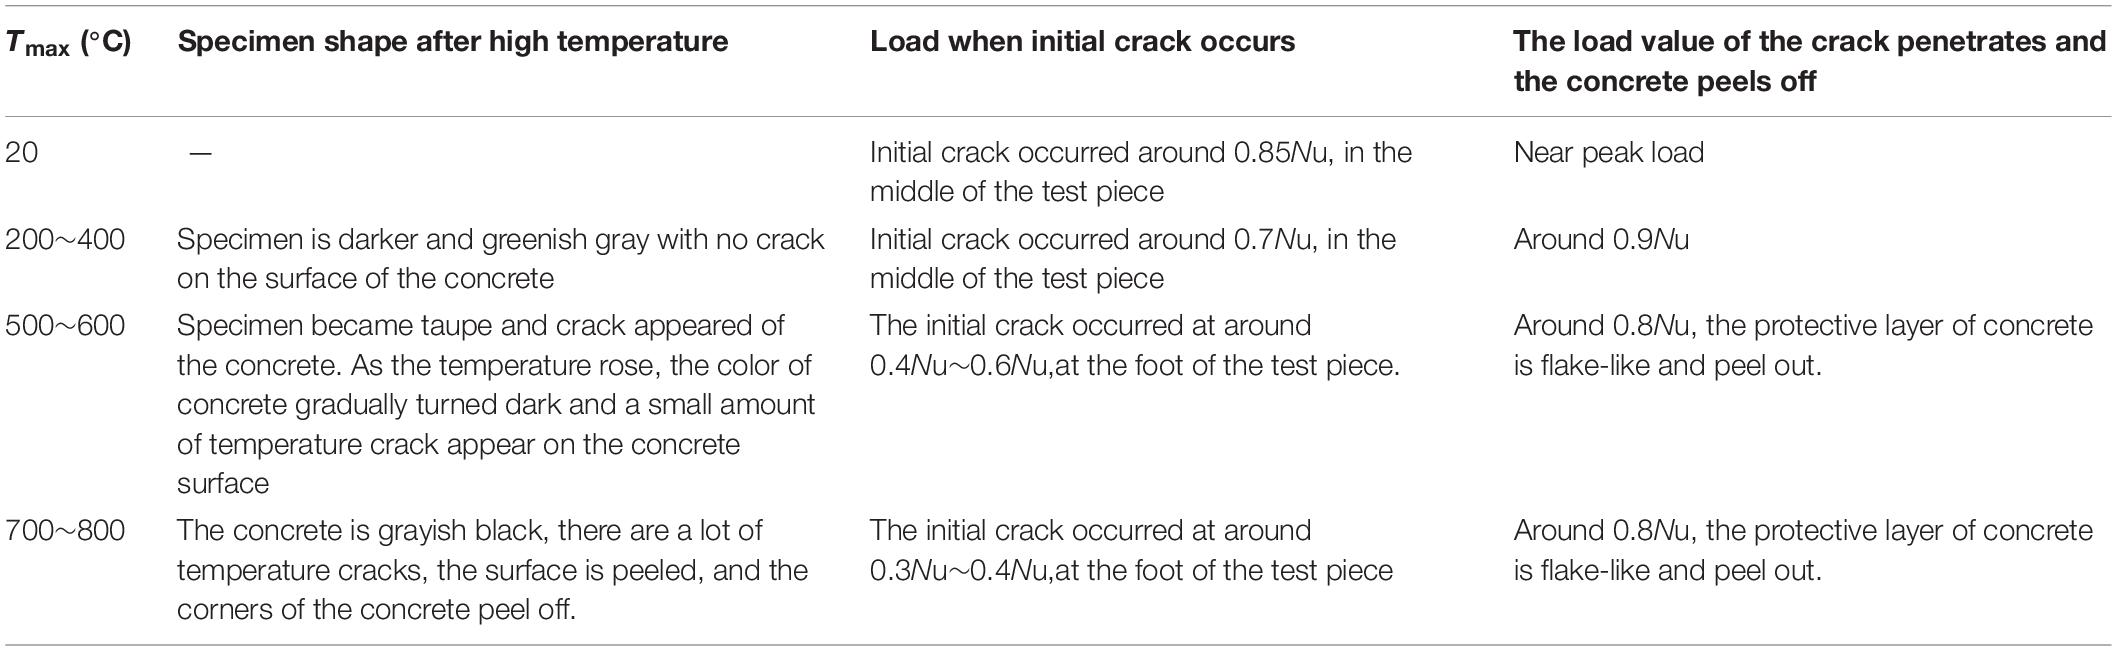
Table 4. Phenomenon and failure process of specimens.
Mass Loss Ratio
Generally, after a building is exposed to a fire, by digging a certain amount of concrete on the surface of the fired and unfired components, the concrete loss on ignition is calculated. Based on the amount of loss on concrete, the highest fire temperature experienced by a structural member can be estimated.
By measuring the weight of specimens before and after fire treatment, mass loss ratio (I) is acquired. The calculating formulas is:
where I is ignition loss of specimens, W is the weight of specimens before temperature exposures and Wf is the weight after fire treatment.
Figure 2B shows the ignition loss of the test pieces at different temperatures. It can be seen from the figure that the ignition loss of the test piece is between 1.5 and 8.0%, which is mainly related to the replacement ratio and the maximum temperature. Ignition loss increased with the increase of either replacement ratio or target temperature. The main reason for this phenomenon is that when concrete is subjected to high temperature, the hydrates generated by cement hydration will decompose and lose crystal water. When the replacement rate is higher, more cement and mortar are required, and at the same time, waste cement slurry is attached to the surface of the recycled aggregate, which results in greater loss of crystal water. The macro performance is that the higher the substitution rate, the greater the loss on ignition.
Destruction Morphology and Load-Displacement Curve
Test observation showed that recycled steel-reinforced concrete columns and ordinary steel-concrete columns shared similar failure appearance that was mainly affected by target temperatures.
The failure process and failure appearance were only significantly affected by target temperatures. The load-displacement curves all include elastic stage, crack stage and failure stage. The specimens morphology and axial compression failure process after high temperature are listed in Table 4. In general, the specimens experienced more and earlier damage at higher temperature. When the target temperature was over 500°C, premature concrete spalling happened in addition to corner damage, which indicates the ineffective contribution of cover concrete to bearing capacity. This phenomenon indicates that the concrete at the protective layer of the steel bar does not contribute significantly to the bearing capacity of the specimen under this condition. The damage form of each test piece is shown in Figure 3.
Figure 4 is the axial load-displacement process curve during the loading of the test pieces. The flattening of the curve is due to the combination of rising section stiffness and peak load. Some specimens experienced elastic phase, stiffness strengthening phase, elastoplastic phase, descending phase and residual phase during the stress process. The characteristics of each stage are as follows:
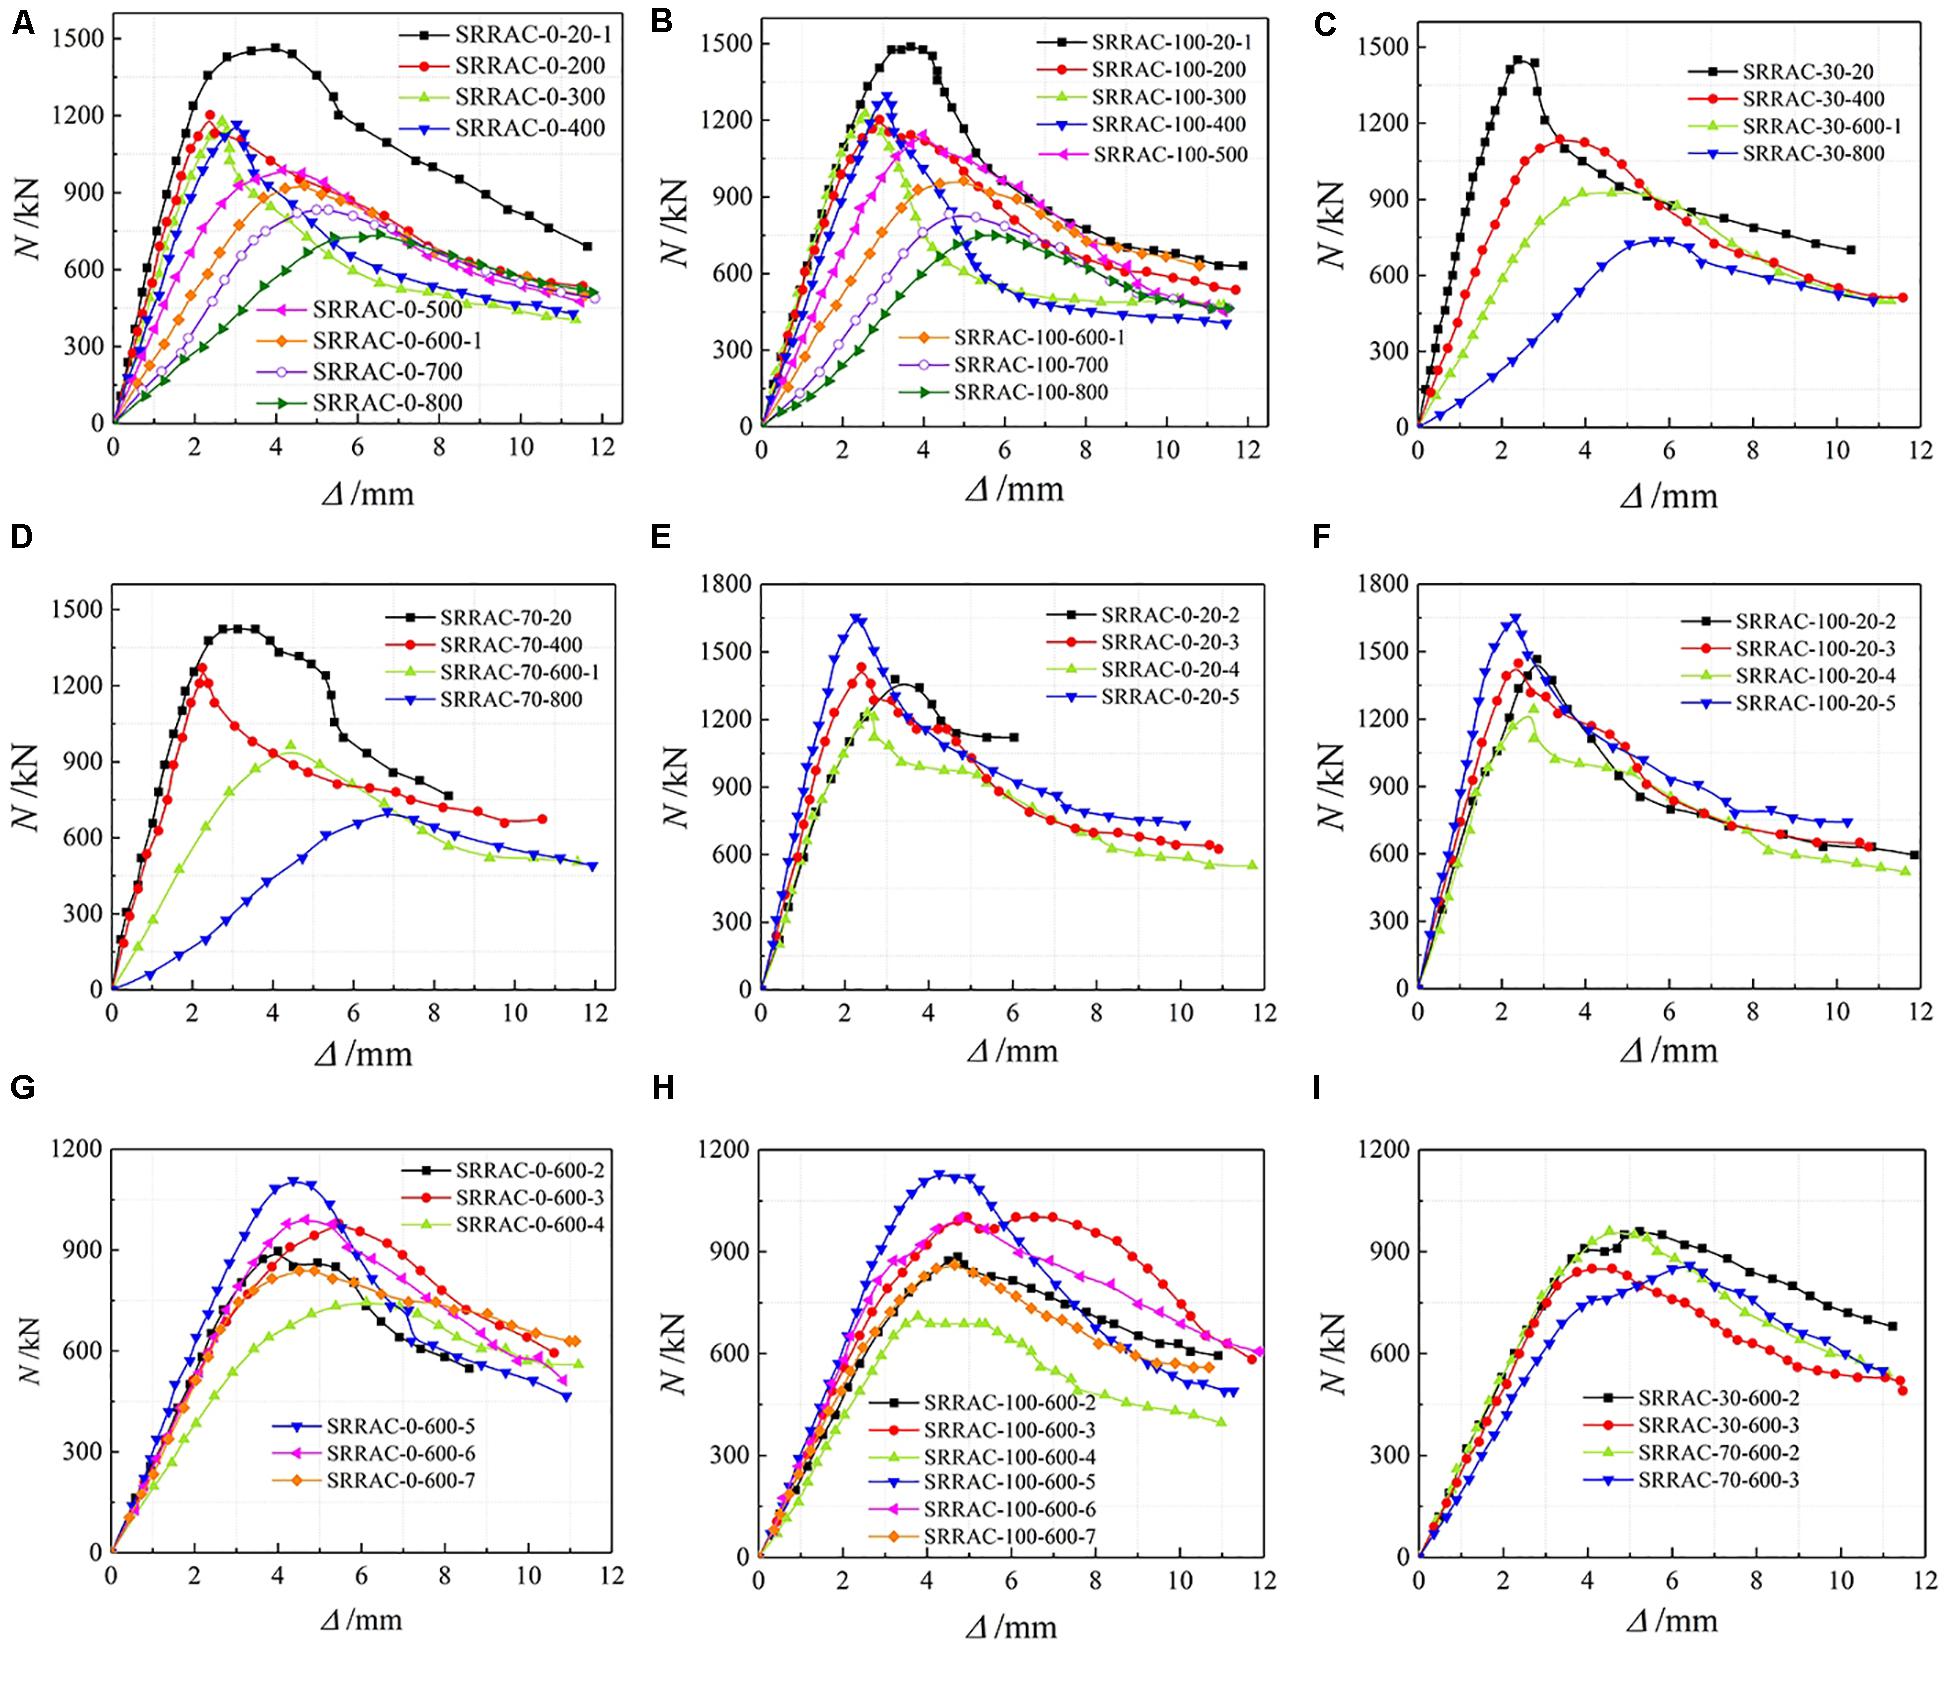
Figure 4. Load-deformation curves of specimens. (A) r = 0%, (B) r = 100%, (C) r = 30%, (D) r = 70%, (E) r = 0%, Tmax = 20°C, (F) r = 30%, Tmax = 20°C, (G) r = 0%, Tmax = 600°C, (H) r = 100%, Tmax = 600°C, (I) r = 30%, 70%, Tmax = 600°C.
(1) Elastic stage. Both steel and concrete experienced elastic deformation in coordination and no damage was exhibited.
(2) The elastoplastic stage. Before peak load was reached, concrete damage was observed and the load-displacement curve exhibited nonlinear characteristics with stiffness reducing. In this stage, debonding gaps were also observed, which indicated debonding and slipping between concrete and steel.
(3) Stiffness strengthening stage. Some of the specimens under target temperature over 600°C exhibited re-increasing stiffness in the end of the elastoplastic stage under peak load was reached. In this paper, this was named as stiffness strengthening. One of the most possible reasons was evaporation of large amount of free water in internal void which led to space in the concrete. This allowed the concrete to be compacted in the loading test so that the strength could be increased.
(4) Post-peak stage. After peak load was reached, the damage of cover concrete disabled its load capability. However, specimens with higher target temperatures exhibited higher ductility, which indicated insignificant influence of fire treatment on deformation capability of SRRC.
(5) Residual stage. This was the last phase in loading when load capacity had reached to the lowest level and exhibited inconsiderable variation as deformation increased. The load was mainly undertaken by the steel and the concrete in the core area.
According to the test load-displacement whole process curve obtained by the test, the characteristic parameters including the peak load, the axial compression stiffness, the damage value and the ductility coefficient can be obtained, as shown in Table 5. It can be seen from the table that, similar to ordinary SRC columns, the bearing capacity and axial compression stiffness of the SRC after high temperature have different degrees of degradation.
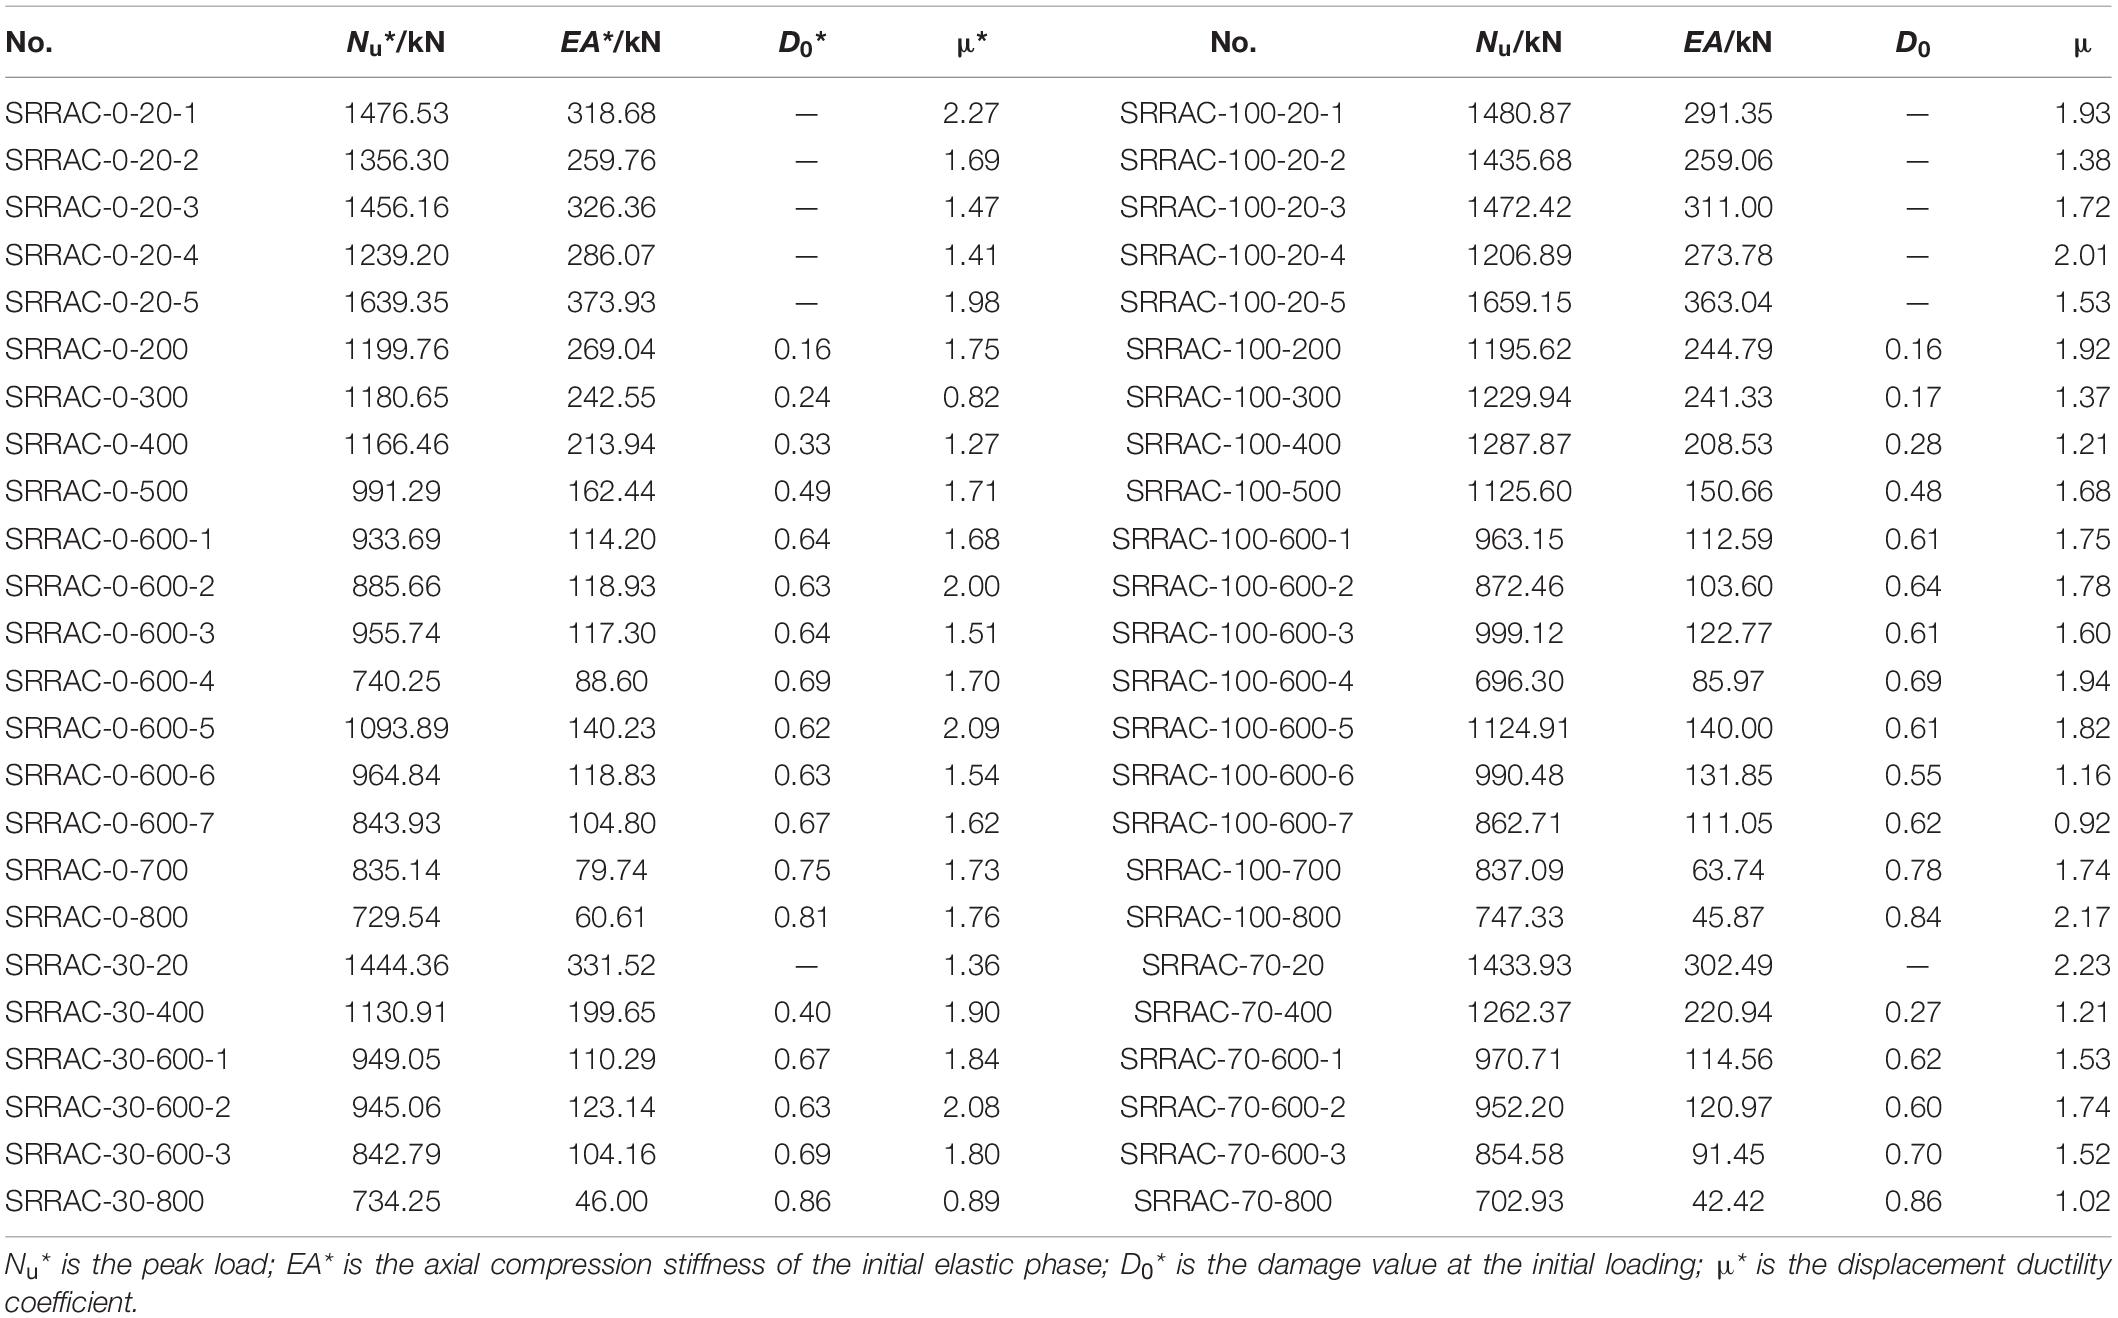
Table 5. Mechanical performance index of specimens.
Mechanical Performance Degradation Analysis
Residual Bearing Capacity
The ratio of the residual bearing capacity Nu(Tmax) of the specimens after different temperatures to the bearing capacity Nu of the specimens which were under the normal temperature in the same condition taken as the characteristic parameter.
Figure 5A shows the effect of temperature on the residual bearing capacity. It can be seen from the figure that when Tmax ≤ 400°C, the residual bearing capacity changed slightly, it was about 0.8 Nu. When Tmax > 400°C, the residual bearing capacity gradually decreased with the increase of temperature. When Tmax = 600°C, the residual bearing capacity was (0.63∼0.68) Nu. When Tmax = 600°C, the residual bearing capacity was (0.63∼0.68) Nu; while Tmax = 800°C, its value was only (0.49∼0.51) Nu. Degradation law of residual bearing capacity of steel recycled aggregate concrete columns with temperature after high temperature were similar to that of ordinary SRC columns. From the results, the replacement ratio had no significant effect on the remaining bearing capacity.
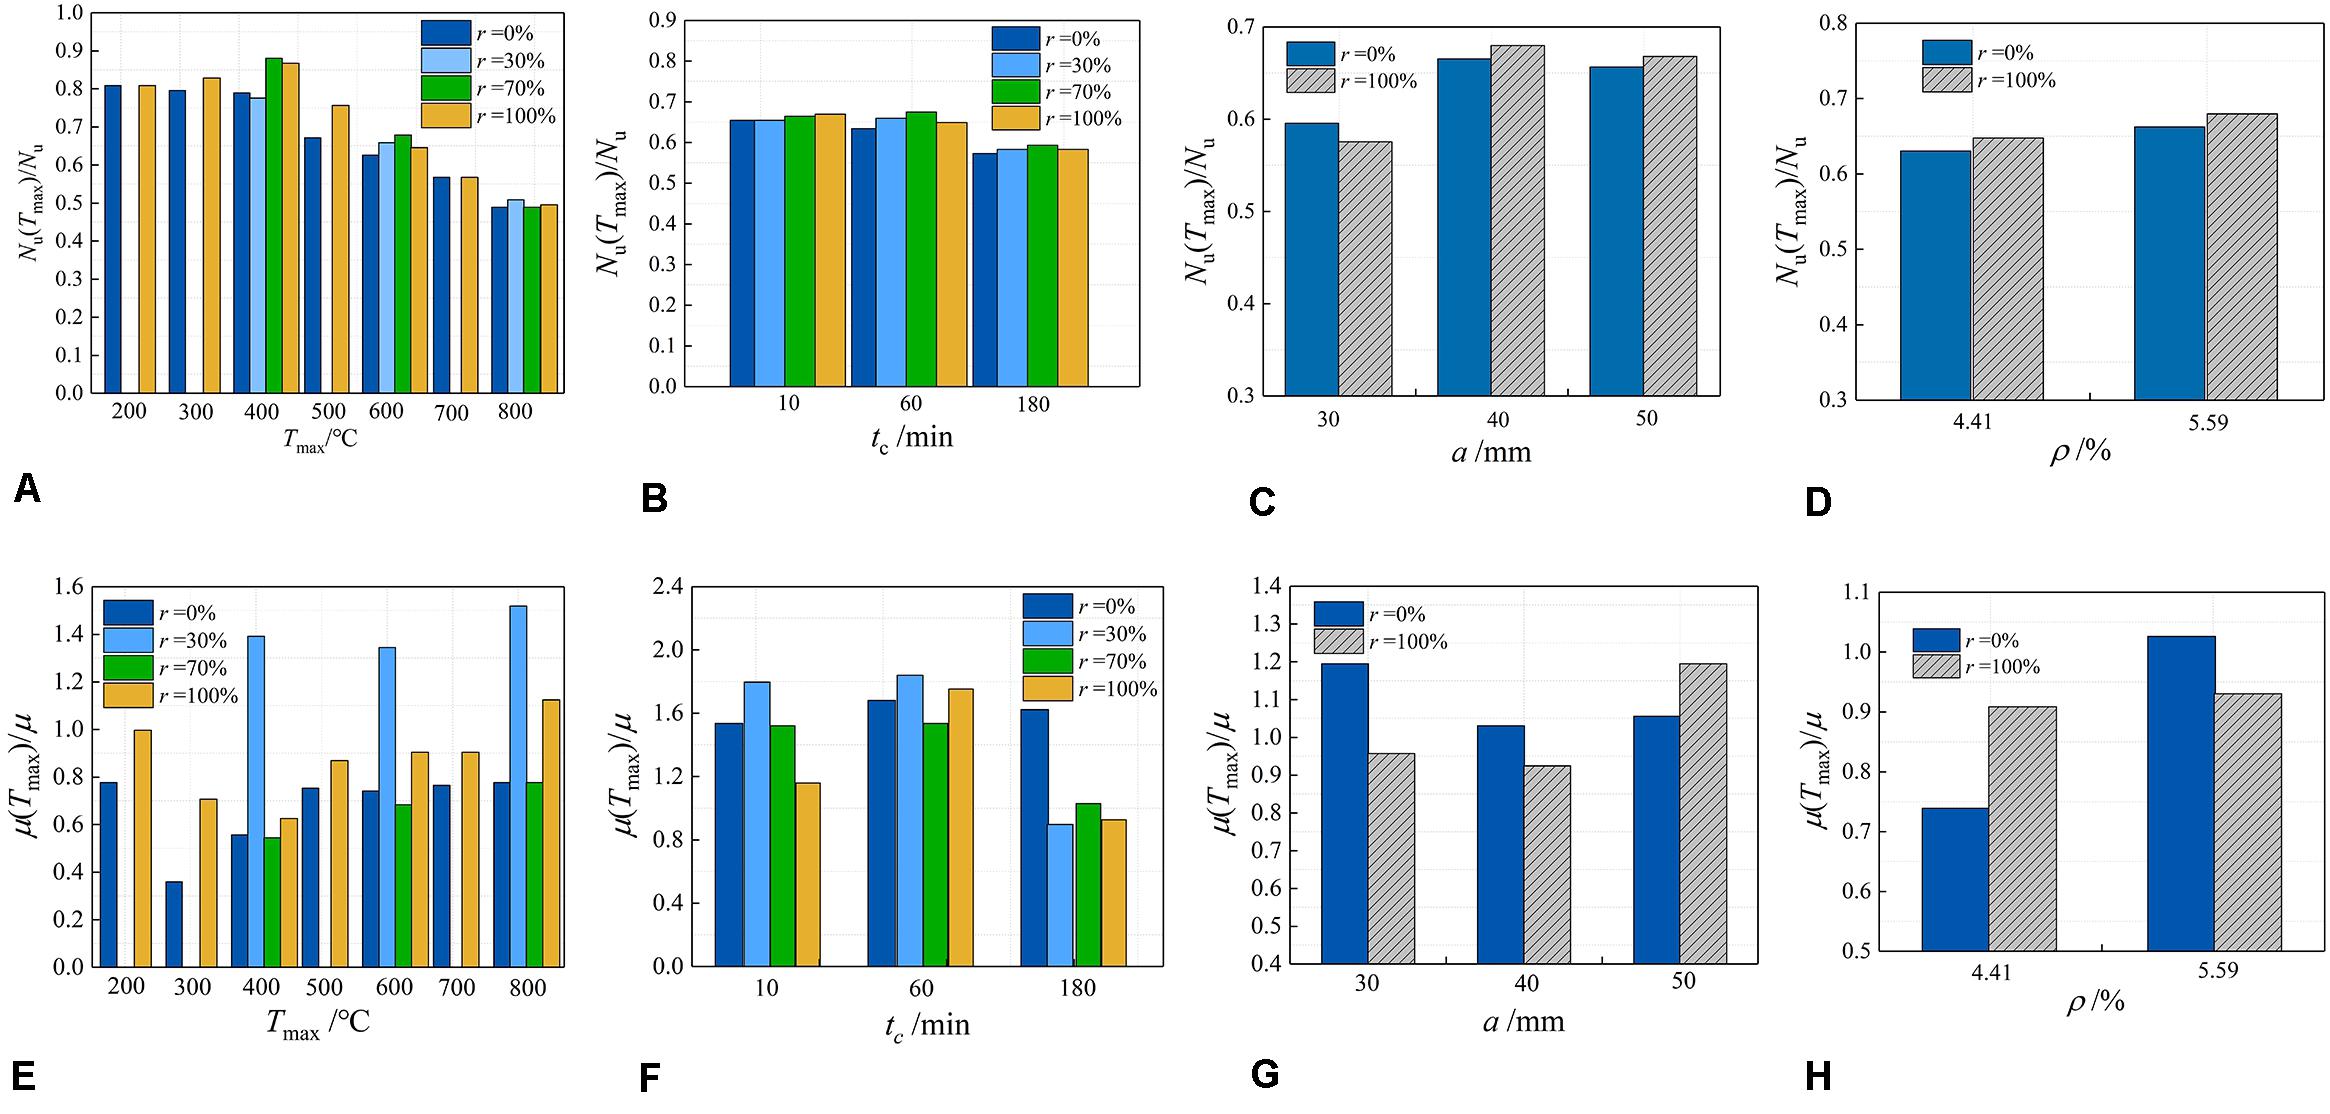
Figure 5. Effect of the influencing factors on bearing capacity and ductility. (A) Effect of temperature on bearing capacity. (B) Effect of fire duration on bearing capacity. (C) Effect of cover concrete thickness on bearing capacity. (D) Effect of steel ratio on bearing capacity. (E) Effect of temperature on ductility. (F) Effect of fire duration on ductility. (G) Effect of cover thickness on ductility. (H) Effect of steel ratio on ductility.
Figure 5B shows the effect of different constant temperature times on the residual bearing capacity of the specimen after heating to 600°C. It can be seen from the figure that as the constant temperature time increased, the residual bearing capacity showed a downward trend. The temperature of constant temperature 10 min and constant temperature 60 min were close to each other. This was because the temperature rise process was slower in this test, so the effect of constant temperature time was not significant in a short time. But for the specimens with a constant temperature of 180 min, the residual bearing capacity decreased significantly. The law reflected by this phenomenon of SRRCS was similar to that of ordinary reinforced concrete columns. The change of the replacement ratio had little effect on the residual bearing capacity.
Figure 5C shows the influence of the thickness of the steel reinforced cover concrete on the residual bearing capacity. As the thickness of concrete cover increases, the residual bearing capacity gradually increases. However, through the experiment, we can conclude that when the thickness of the concrete cover is smaller, the change of the residual bearing capacity is more significant with the increase of the thickness. This is because the greater the thickness of the protective layer, the lower the internal temperature of the test piece, which plays a significant role in protecting the core concrete and steel.
The residual bearing capacity of the recycled SRC specimens with the aggregate replacement rate of 100% and the ordinary SRC specimens with the replacement ratio of 0% were compared in Figure 5D. It can be seen from the figure that the residual bearing capacity increased as the steel content increased. While in the same steel ratio, the former residual bearing capacity was higher than the latter.
Ductility
The displacement ductility coefficient is used to reflect the inelastic deformation ability of the member and its expression is:
where Δu is the ultimate displacement, and the displacement value corresponding to the peak load falling to 85% is taken; Δy is the yield displacement.
Refer to the Universal Yield Moment Method by Guo (2014) to determine the Y point as the yield point and the corresponding displacement as the yield displacement Δy; U point is the limit point, and the corresponding displacement is the limit displacement Δu.
Table 5 lists the displacement ductility coefficient values of each test piece calculated according to Eq. (2). Figure 5E indicating the effect of the highest temperature on the displacement ductility coefficient of the specimens. It can be seen from the figure that with the increase of temperature, the displacement ductility coefficient of the specimen generally decreased first and then increases. When the temperature was 300°C, the displacement ductility coefficient was the smallest value, which means that the ductility of the component was the worst at this temperature.
Figure 5F shows the effect of different constant temperature time on the displacement ductility coefficient after the maximum temperature of the experiment was 600°C. It can be seen from the figure as the constant temperature time increases, the displacement ductility decreases. The increase in the constant temperature time leads to an increase in the depth of concrete damage, which reduces the strength of the steel and thus the ductility. With the increase of constant temperature, the uncured cement clinker gradually decreases, and the continuous evaporation of water in the cement slurry makes the strength of the concrete gradually decrease.
Figure 5G shows the effect of the thickness of the SRC protective layer on the displacement ductility coefficient. It can be seen from the figure that as the thickness of the protective layer increased, the displacement ductility decreased first and then increased. This was because when the protective layer was thin, the displacement ductility was mainly affected by the steel content of the test pieces. For test pieces of the same side length, the steel content decreased as the thickness of the protective layer increased, thereby reducing ductility. However, when the protective layer was thick, the ductility was mainly affected by the degree of deterioration of the core concrete of the test pieces; the ductility of the test pieces increased as the relative deterioration of the concrete in the core zone decreased.
It can be seen from Figure 5H that the influence of the steel content on the displacement ductility coefficient was that the steel content was higher and the ductility was better but the effect of the replacement ratio was not obvious. The main reason for this phenomenon is that with the increase of steel content, the restraining effect of section steel on the concrete in the core area is enhanced, and the brittleness of the recycled aggregate concrete is improved. The increase in the steel content also increases the axial deformation capacity of the reinforcing member.
Damage
In order to quantitatively describe the damage degree of the specimen after high temperature and the damage development process during the loading process, according to the theory of continuous damage mechanics (Chen et al., 2018a, b; Yan et al., 2019), the damage field variable D is introduced to describe the damage degree of the specimen after fire.
S and S∗, respectively, indicated the area size before and after the damage in the n-direction of the normal of the unit. D was the local damage mechanics variable relative to the n-direction; When D = 0, it means lossless state, when D = 1, it means complete destruction. Since σ ⋅ S = σ∗ ⋅ S∗, σ, and σ∗ were the effective stresses in the n-direction before and after the damage, respectively. According to the strain equivalent hypothesis, there is the following formula:
Where E0 is the elastic modulus under lossless condition; E∗ is the effective secant modulus after damage.
Due to the effect of high temperature, each test piece produced different degrees of initial damage before loading. The initial damage value D0 was listed in Table 5. It can be seen from the table that as the temperature increased and the fire time increased, the initial damage value of test pieces gradually increased. This is because the increase in temperature and fire specimens will cause the combined water in the concrete material and the loss of water in the hydrate, and at the same time the chemical bonds in most of the cementitious substances are destroyed, exacerbating the deterioration of the concrete. When Tmax = 200°C, the value of D0 was about 0.16; When Tmax = 600°C, it was 0.55∼0.70; When Tmax = 800°C, the value reached 0.81∼0.86. During the loading process, as the load increased, the degree of damage of test pieces continued to increase. According to the measured load-deformation curve, the damage evolution process of each specimen at tc = 60 min and B = 180 mm at different temperatures can be obtained, as shown in Figure 6.
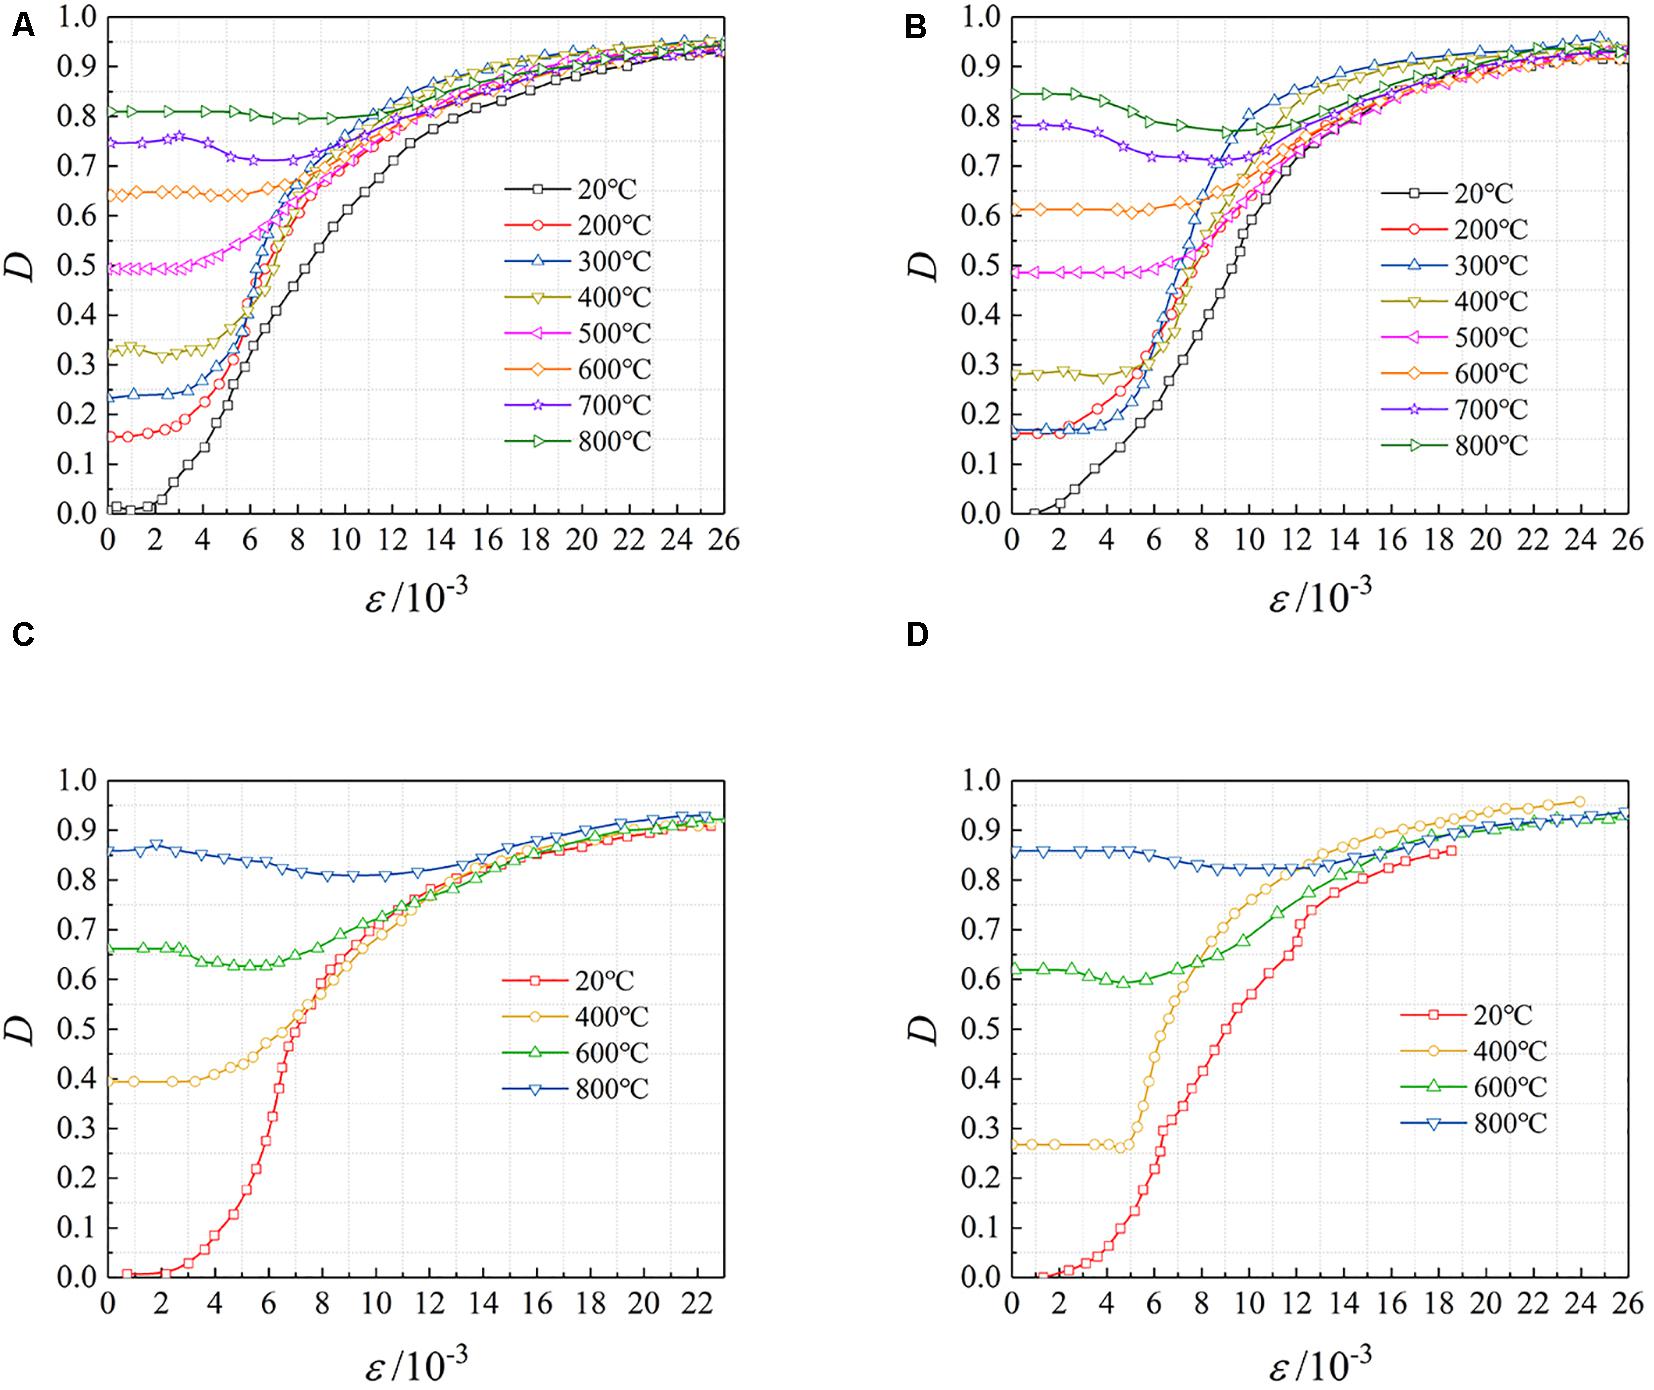
Figure 6. Damage evolutions of specimens after different temperatures. (A) r = 0%, (B) r = 100%, (C) r = 30%, (D) r = 70%.
The four diagrams of Figure 6 are the damage evolution process of the specimens with the replacement rates of 0, 100, 30, and 70%, respectively. It can be seen from Figure 6 that due to the presence of initial damage, damage development tended to slow as the highest temperature rises during the test. Determine the average strain ε according to the measured load-deformation curve of the test pieces. When the average strain ε was less than 0.002, the test pieces were in the elastic stage, there was basically free from damage and the D value was close to zero. When the average strain ε was between 0.002 and 0.004, the damage begins to occur at a slower rate. When the average strain ε was between 0.004 and 0.012, the maximum experimental temperature did not exceed 600°C, the damage value increased rapidly, mainly manifested by the rapid extension of concrete cracks and concrete flaking. However, for the test pieces with the experimental temperature higher than 600°C, the damage value first decreased and then rose, which means that test pieces entered the stiffness strengthening stage. When the average strain ε was more than 0.012, the samples entered the residual phase, and the damage value D gradually became stable.
Temperature Field of Sections
In order to better reveal the temperature field distribution in the section of the recycled steel concrete column after high temperature, the ABAQUS finite element software was used to numerically simulate the temperature field of the recycled steel concrete column under fire. The component was exposed to fire on four sides, so the upper and lower surfaces were adiabatic surfaces. The temperature was applied according to the rising-temperature curve in the furnace and the room temperature was usually set as 20°C. The boundary condition was a third type of boundary and the influence of the reinforcement on the temperature field was ignored. Steel and recycled aggregate concrete used 8-node continuous diffusion three-dimensional solid heat conduction unit DC3D8, regardless of the contact thermal resistance between the two sections. The thermal conductivity and specific heat capacity of steel were calculated using the European standard En 1994-1-2 (2004) formula, the mass density was 7850 kg/m3. The mass density, thermal conductivity and specific heat capacity of recycled aggregate concrete were calculated according to Huang (2006); the convective heat transfer coefficient was 25W/m2°C and the comprehensive radiation coefficient was taken as 0.5.
The reinforced fully-recycled aggregate concrete column specimens that four-sided fire were designed as Bian (2012) (section size of the test piece was 450 mm × 450 mm, height was 3640 mm, [[Au Query:]]longitudinal reinforcement was 8B20, stirrup was A10 @ 150, concrete strength was C30, the rate of coarse aggregate replacement was 100%; the heating process used the ISO 843 (1980) standard heating curve and the heating time was 120 min. The cross-sectional form, measurement point arrangement and temperature field were shown in Figure 7A and the common concrete columns that in Han and Song (2012) to ventilate the model of the specimens (section size of the test piece was 300 mm × 300 mm, height was 3810 mm, longitudinal ribs were 4B18, and profile steel was HE200B. The heating process adopted the ISO 843 standard heating curve and the heating time was 160 min. The cross-section form, measurement point arrangement and temperature field were shown in Figure 7B.) The comparison curves between the calculated results and the experimental results were shown in Figures 7C,D, respectively. It can be seen from the figure that the numerical calculation results were in good agreement with the experimental results so the model can be used to analyze the temperature field of steel residual concrete columns.
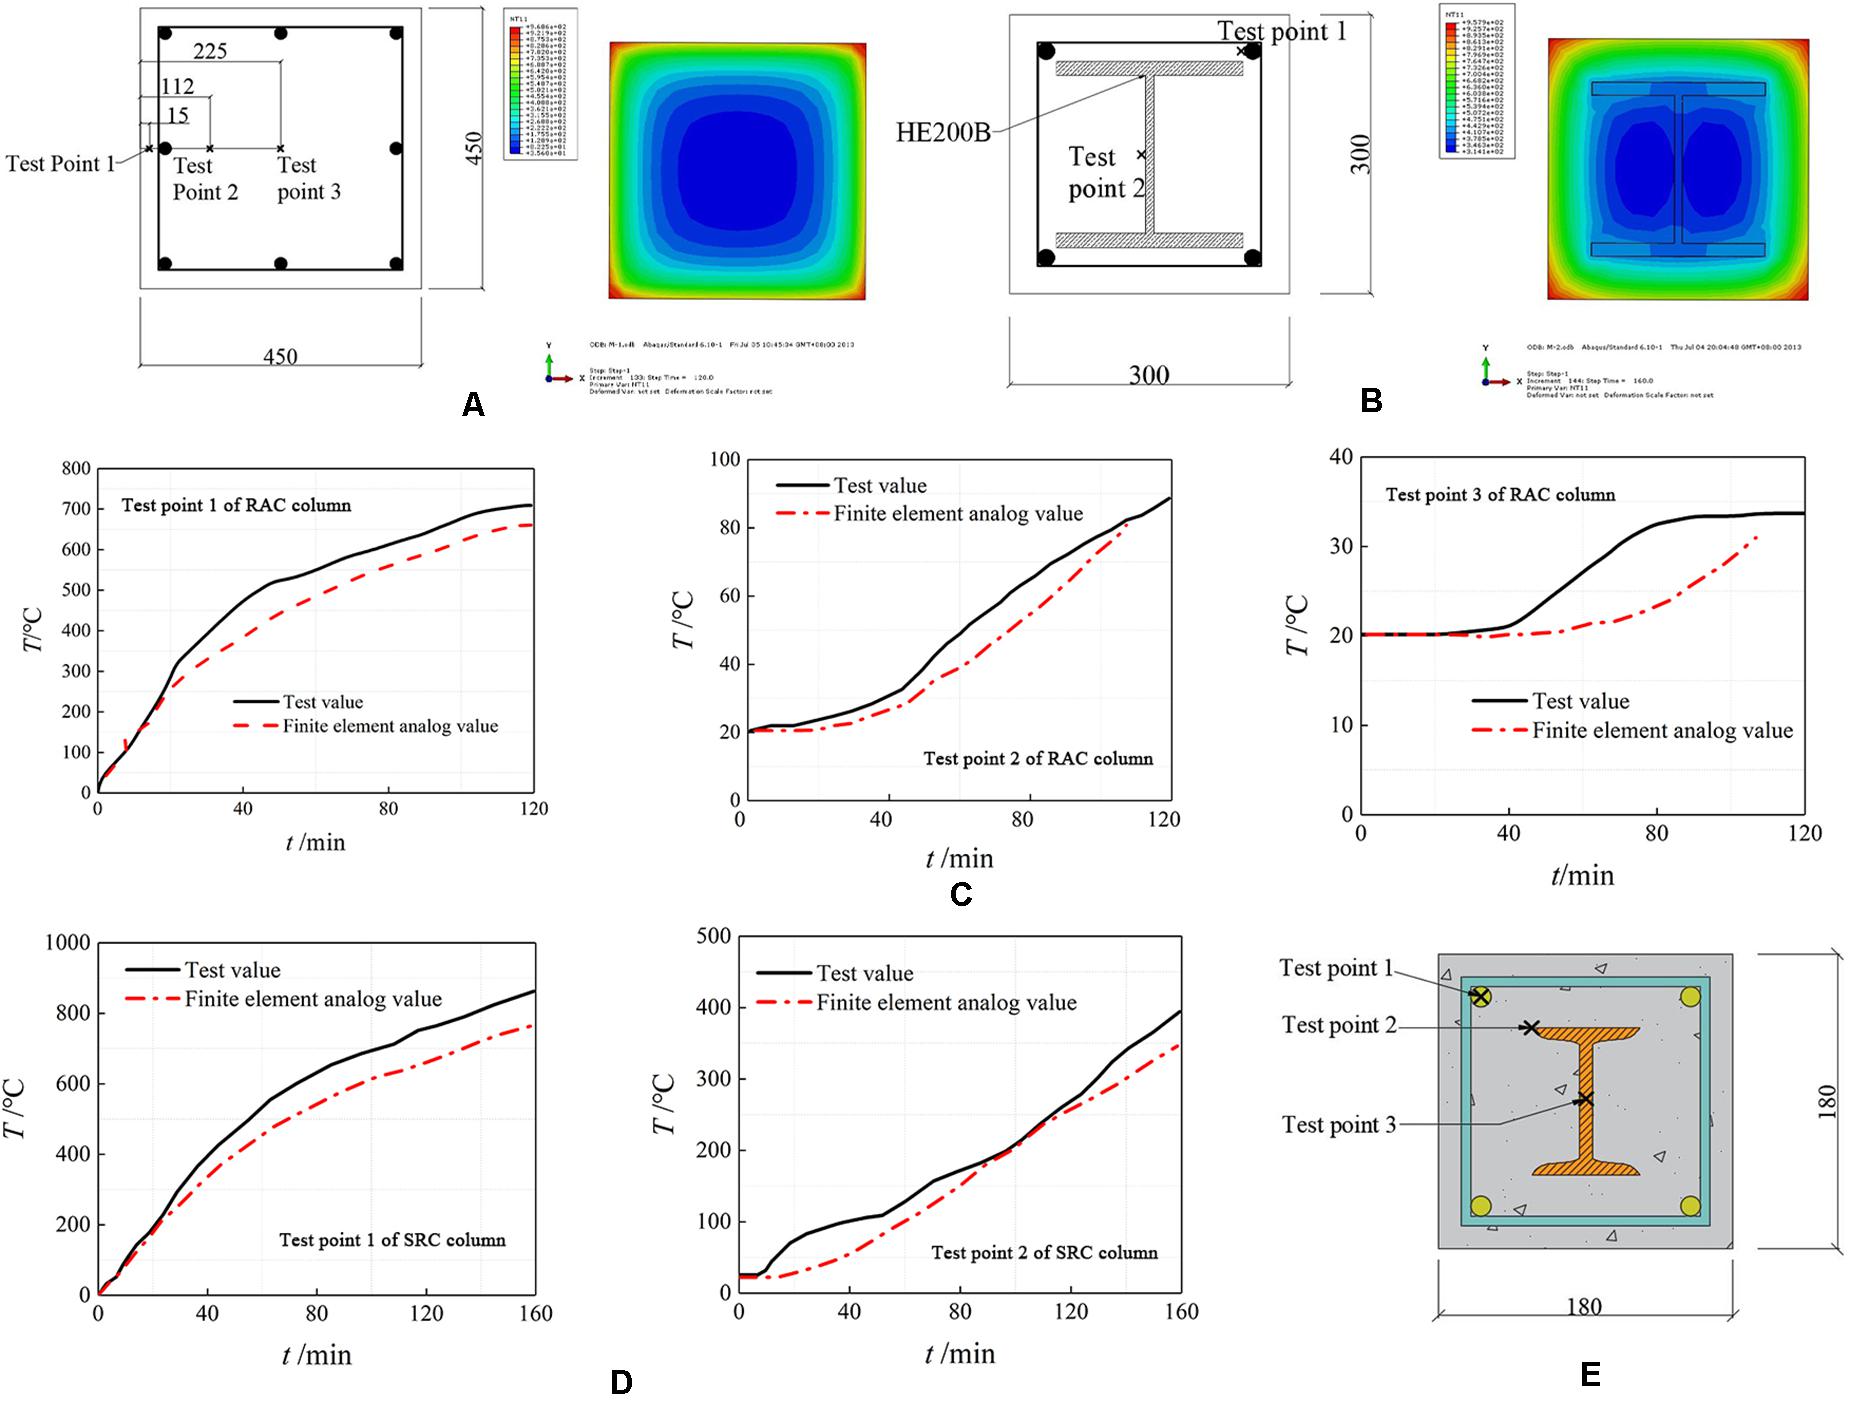
Figure 7. Measure point arrangement and comparison of test and calculation temperature. (A) Section size, measure point arrangement and temperature field of RAC column. (B) Section size and measure point arrangement and temperature field calculation results of SRC column. (C) Comparison of test and calculation temperature of RAC column. (D) Comparison of test and calculation temperature of SRC column. (E) Measure point arrangement of specimens.
The above models were used to calculate 22 typical specimen sections of temperature fields and the cross-section measurement points were arranged as shown in Figure 7E, where point 1 was the position of the longitudinal reinforcement, point 2 was the edge of the steel flange and point 3 was the geometric center of section.
The maximum temperature of each measuring point is shown in Table 6. As can be seen from the table, the temperature at measurement point 1 (at the longitudinal rib) is much higher than the temperature at measurement point 2 (at the edge of the steel flange) and measurement point 3 (at the geometric center of the cross section) due to the closer to the specimen surface. The temperature between point 2 and measurement point 3 is relatively close, which indicates that the existence of section steel has a great influence on the temperature of the section. The maximum cross-section temperature gradually increased with the increase of the maximum temperature while gradually decreased with the increase of the replacement ratio.
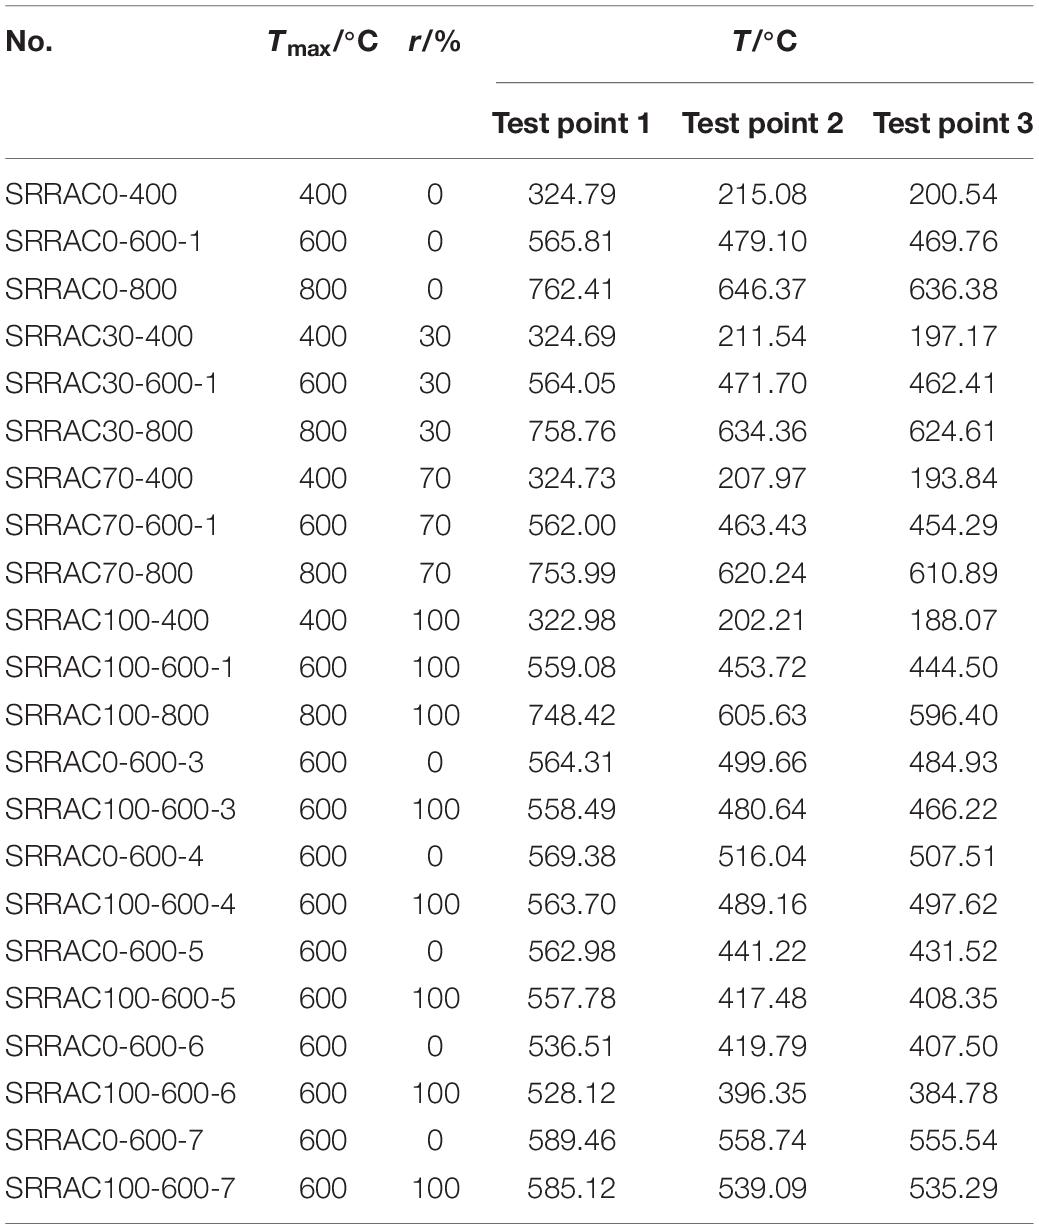
Table 6. The highest temperature of different measure point.
Prediction of Residual Bearing Capacity
Basic Assumption
The calculation was carried out on ultimate axial bearing capacity of steel-recycled aggregate concrete after exposure to high temperature. The section temperature field of the members under different heating curves was calculated by finite element software and the following basic assumptions were made:
(1) The steel and steel bars have a uniform temperature distribution.
(2) The steel is coordinated with the deformation of the concrete.
(3) Regardless of the contribution of the cover concrete of the steel bar to the bearing capacity, it is considered that the inner edge of the stirrup is the control point of the section failure. In the limit state, the concrete protective layer of the steel bar does not reach the peak stress, and the contribution of the concrete to the bearing capacity is neglected because the concrete is seriously damaged after high temperature.
(4) In the limit state, except for the protective layer, the compressive strength of the concrete at different points of the cross section is not the same but they all reach their respective compressive strength, and the shaped steels and steel bars reach the yield strength.
Residual Bearing Capacity Calculation
After fire treatment, the concrete strength fc was unevenly distributed along the section and the axial force of the concrete part is reached when the limit state is reached.
Where: fc(x,y) is the concrete strength distribution function of the section. It is difficult to obtain fc(x,y) due to the uncertainty of the actual fire heating curve, the variability of the structural space and the variability of the thermal properties of the material. According to the actual temperature field, the fc(x,y) function was distributed as a slightly convex curved truncated pyramid. To simplify the calculation, the cross section of the fc(x,y) distribution was approximately equivalent to the equivalent section of the linear truncated quadrilateral pyramid, as shown in Figure 8.
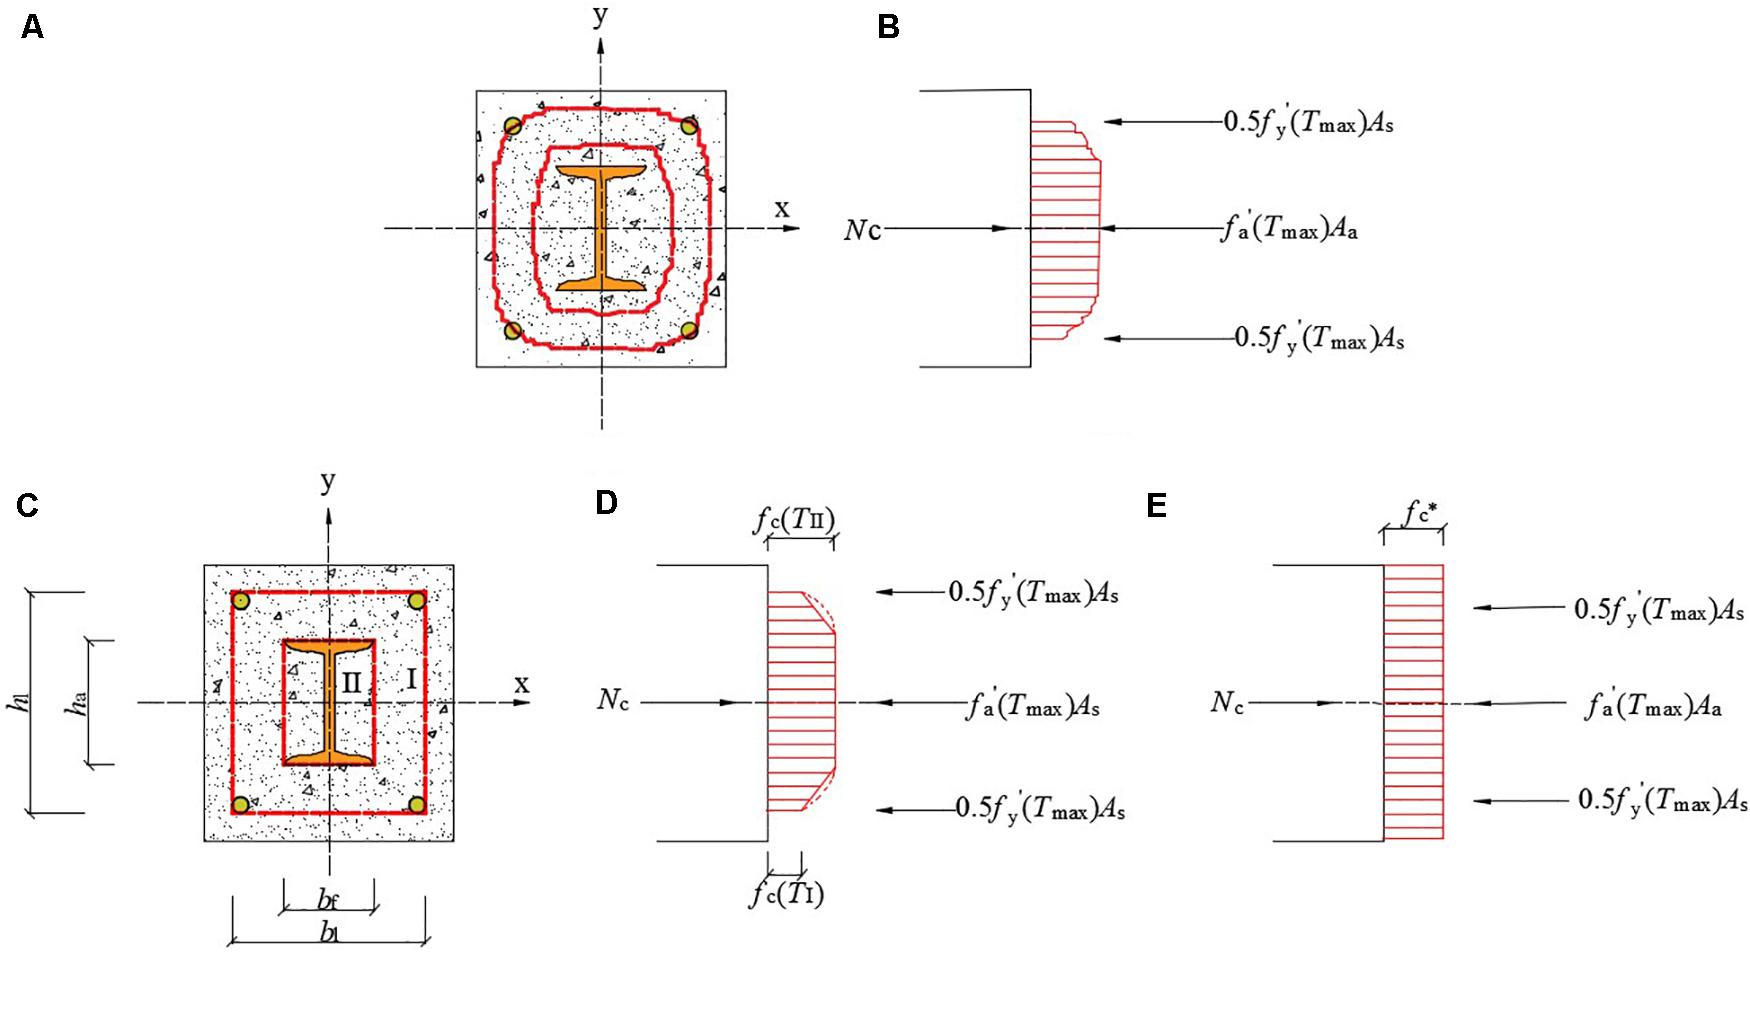
Figure 8. Equivalent section. (A) Cross section equal strength curve.(B) Actual intensity distribution. (C) Sectional equivalent intensity curve equivalent diagram. (D) Truncated quadrilateral pyramid. (E) Prismatic equivalent section diagram.
As can be seen from Figure 8,
Where, TI and TII were the highest temperatures in Zones I and II, respectively, fc(TI) was the compressive strength of recycled aggregate concrete in Zone I, MPa, using the compressive strength value of recycled aggregate concrete corresponding to TI, which was obtained by literature in Cai and Cai (2000), MPa; fc(TII) was the compressive strength of recycled aggregate concrete in Zone II, taking the strength value of recycled aggregate concrete corresponding to TII, MPa; Ac was the net cross-sectional area of the concrete, mm2; Aa was the full-section area of the shaped steel, mm2. bI was the cross-sectional width of the concrete surrounded by the inner surface of the stirrup, mm; hI was the height of the concrete section surrounded by the inner surface of the stirrup, mm; bf was the width of the profiled steel flange, mm; ha was the height of the section of the profiled steel, mm.
According to the principle of load equivalent, the equivalent section of the truncated quadrangular pyramid was further equivalent to the equivalent section of the prism, as shown in Figure 8, the following formula:
Replace fc∗ in the above formula with kcfc:
Where f∗c was the compressive strength of the prismatic equivalent section concrete, MPa; fc was the compressive strength of recycled aggregate concrete at room temperature, MPa; kc was the concrete strength reduction factor.
According to the superposition principle, the calculation formula of the normal section bearing capacity of the axially compressed members of steel-reinforced concrete was obtained.
Where f′y(Tmax) was the compressive yield strength of the steel bar after high temperature, corresponding to the highest temperature experienced by the position of the steel bar, MPa; f′a(Tmax) was the compressive yield strength of the shaped steel after high temperature, corresponding to the highest temperature experienced by the position of the steel, MPa; φ was the stability factor, refer to GB50010-2010 (2010) “Concrete Structure Design Specification.”
Calculate the test piece in this paper using Eq. (10) and compare it with the measured value of the test. The comparison results are shown in Figure 9. As can be seen from the figure, the average of the ratio of the calculated value to the measured value is 0.995, the variance was 0.0134, and the coefficient of variation was 0.1163. The experimental value agreed well with the calculated value.
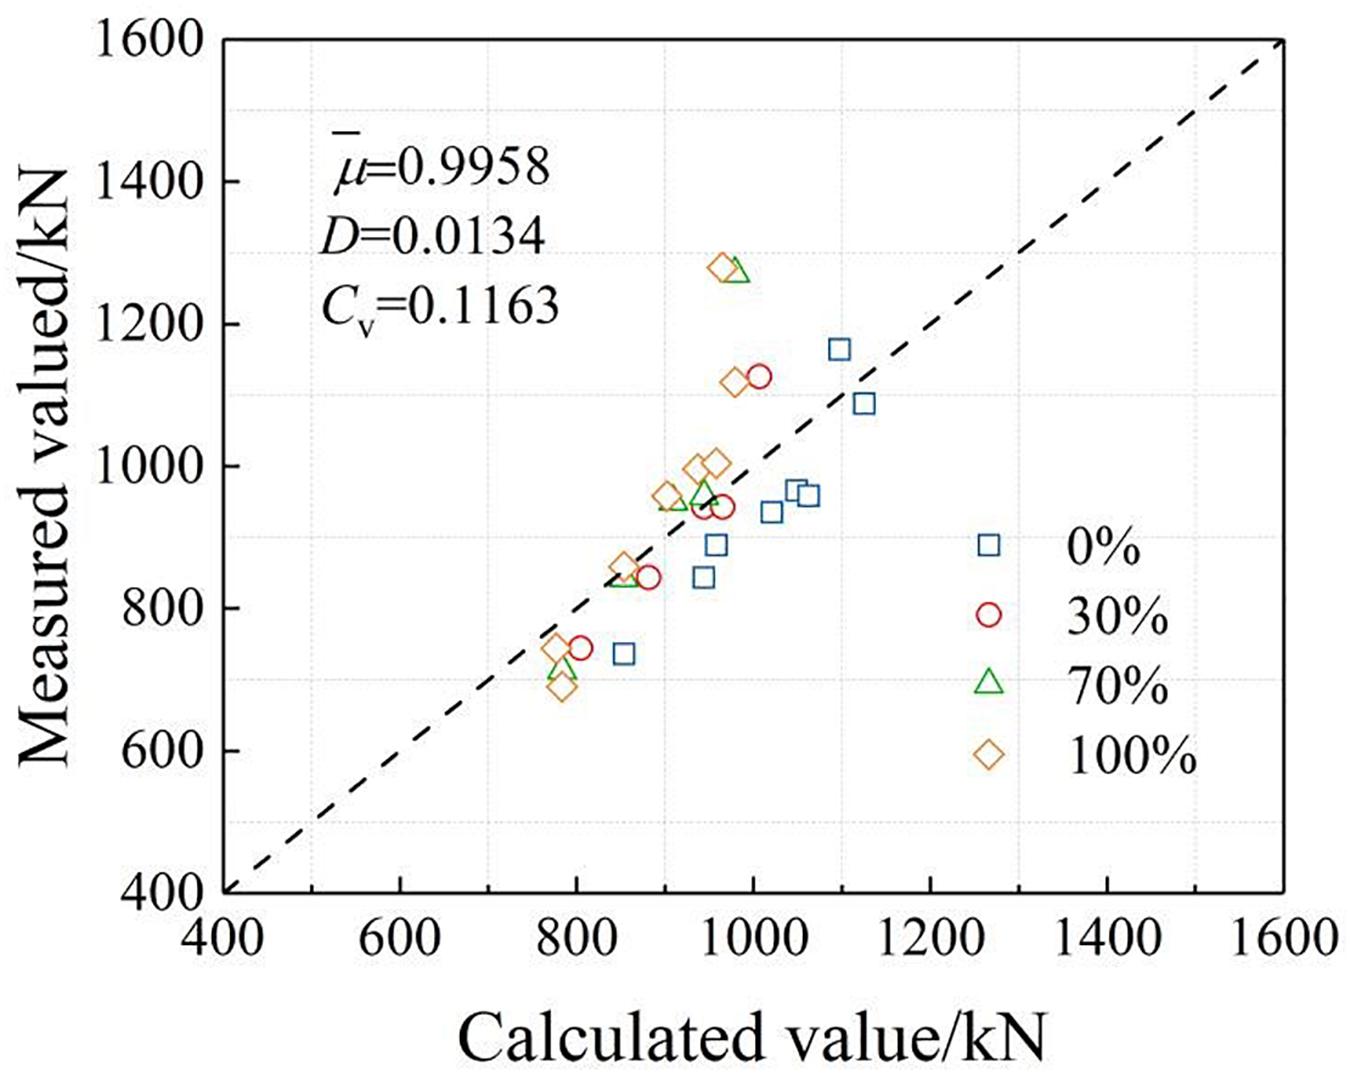
Figure 9. Comparison of calculated and measured of specimens.
Conclusion
The effects of replacement ratio, temperature, heated time, thicknesses of cover concrete, steel ratios and stirrup spacing on residual bearing strength of SRRC column after elevated temperatures were investigated. The specimens were designed and tested under static loading. From the experimental investigated, the following conclusions can be drawn:
(1) Under the test conditions of this article, the mass loss rate of the test piece is 1.5–8.0%, and it increases as the temperature and replacement ratio increase. Higher substitution rate means more cement and mortar, and the increase of temperature accelerates the decomposition of hydrate in cement and loses the crystal water. Therefore, the increase in burning loss rate is a result of the combined effect of substitution rate and temperature.
(2) The failure process of the SRRC column after high temperature includes the elastic stage, the stiffness strengthening section, the elastoplastic stage, the descending stage and the residual stage, which are similar to those of ordinary SRC columns.
(3) The residual bearing strength of the SRRC column after high temperature increases as the thickness of the cover concrete and the steel ratio increase. This is because the greater the thickness of the protective layer, the lower the internal temperature of the test piece, which plays a significant role in protecting the core concrete and steel. Furthermore, the test temperature and heated time can aggrandize the damage value of specimens. The main cause of high temperature damage to components is the severe damage to concrete microstructure. The increase in temperature and heating time will lead to the loss of bound water in the concrete material and water in the hydrate, and small voids appear in the material, thereby exacerbating the deterioration of the concrete.
(4) As the temperature and the thickness of cover concrete increase, the ductility decreases first and then increases. What’s more, the ductility decreases as the heated time increases and it increases as the steel ratio increases. The increase in the fire time leads to an increase in the depth of concrete damage, which reduces the strength of the steel and thus the ductility.
(5) The cross-section temperature decreases with the increase of the replacement ratio, but it increases gradually with the increase of temperature. The section steel has a great influence on the temperature distribution of the cross section of test pieces. This is because the thermal conductivity coefficients of steel and concrete are different. The smaller the heat capacity of the steel, the faster the heat conduction in the cross section. At the same time, the section steel in the concrete occupies a larger section. The section steel will absorb a lot of heat in the concrete.
(6) The calculation method of the residual bearing capacity of the SRRC column after high temperature is proposed and the calculated results agree well with the experimental results.
Data Availability Statement
All datasets generated for this study are included in the article/supplementary material.
Author Contributions
ZC conceived the experiments. YL wrote the initial draft of the manuscript. LM and MB analyzed the data and wrote the final manuscript. All authors contributed to the article and approved the submitted version.
Conflict of Interest
The authors declare that the research was conducted in the absence of any commercial or financial relationships that could be construed as a potential conflict of interest.
References
Ashish, D. K., and Saini, P. (2018). Successive recycled coarse aggregate effect on mechanical behavior and microstructural characteristics of concrete. J. Comp. Conc. 21, 39–46. doi: 10.12989/cac.2018.21.1.039
Bian, J. H. (2012). Experimental and Theoretical Analysis on Fire Resistant Performance Of Recycled Concrete Columns. Ph.D. Dissertation. Beijing: Beijing University of Technology.
Cai, S. W., and Cai, M. (2000). Damage and Fracture of Concrete. Beijing: Beijing China Communication Press.
Chen, Y., He, K., Han, S. H., and Wei, J. (2018a). Experimental investigation of square concrete filled stainless steel tubular stub columns after exposure to elevated temperatures. J. Thin Wall. Struct. 130, 12–31. doi: 10.1016/j.tws.2018.05.007
Chen, Z. P., Liu, X., and Zhou, W. X. (2018b). Residual bond behavior of high strength concrete-filled square steel tube after elevated temperatures. J. Steel Comp. Struct. 27, 509–523. doi: 10.12989/scs.2018.27.4.509
Chen, Z. P., Chen, J. R., and Xue, J. Y. (2014a). Experimental study on mechanical behavior of steel and recycled concrete after high temperature. J. Indus. Constr. 11, 1–4. doi: 10.13204/j.gyjz201411001
Chen, Z. P., Xu, J. J., and Xue, J. Y. (2014b). Performance and calculations of recycled aggregate concrete-filled steel tubular (RACFST) short columns under axial compression. J. Int. J. Steel Struct. 14, 31–42. doi: 10.1007/s13296-014-1005-5
Djelloul, O. K., Menadi, B., Wardeh, G., and Kenai, S. (2018). Performance of self-compacting concrete made with coarse and fine recycled concrete aggregates and ground granulated blast-furnace slag. J. Adv. Conc. Constr. 6, 103–121. doi: 10.12989/acc.2018.6.2.103
En 1994-1-2 (2004). Design of Composite Steel and Concrete Structures. Part 1-2: General Rules-Structural Fire Design. Brussels: European Committee for Standardization.
GB50010-2010 (2010). Code for Design of Concrete Structures. Beijing: China Academy of Building Research.
González Fonteboa, B., Martínez, A. F., Diego, C. L., and Seara-Paz, S. (2011). Stress-strain relationship in axial compression for concrete using recycled saturated coarse aggregate. J. Constr. Build. Mater. 25, 2335–2342. doi: 10.1016/j.conbuildmat.2010.11.031
Han, L. H., and Song, T. Y. (2012). Fire Safety Design Theory of Steel-Concrete Composite Structures. Beijing: Science Press.
Huang, Y. B. (2006). Research on the Thermal Properties of Recycled Concrete. Ph.D. Dissertation. Shanghai: Tongji University.
Liu, C., Fan, J. C., Bai, G. L., Quan, Z., Fu, G., Zhu, C., et al. (2019). Cyclic load tests and seismic performance of recycled aggregate concrete (RAC) columns. J. Constr. Build. Mater. 195, 682–694. doi: 10.1016/j.conbuildmat.2018.10.078
Ma, H., Xue, J. Y., Liu, Y. H., and Zhang, X. (2015). Cyclic loading tests and shear strength of steel reinforced recycled concrete short columns. J. Eng. Struct. 92, 55–68. doi: 10.1016/j.engstruct.2015.03.009
Marques, A. M., Correia, J. R., and de Brito, J. (2013). Post-fire residual mechanical properties of concrete made with recycled rubber aggregate. J. Fire Saf. J. 58, 49–57. doi: 10.1016/j.firesaf.2013.02.002
Marthong, C., Pyrbot, R. N., Tron, S. L., Mawroh, L.-I. D., Choudhury, S. A., and Bharti, G. S. (2018). Micro-concrete composites for strengthening of RC frame made of recycled aggregate concrete. J. Comp. Conc. 22, 461–468. doi: 10.12989/cac.2018.22.5.461
Murali, G., Indhumathi, T., Karthikeyan, K., and Ramkumar, V. R. (2018). Analysis of flexural fatigue failure of concrete made with 100% coarse recycled and natural aggregates. J. Comp. Conc. 21, 291–298. doi: 10.12989/cac.2018.21.3.291
Saha, S., and Rajasekaran, C. (2016). Mechanical properties of recycled aggregate concrete produced with Portland Pozzolana Cement. J. Adv. Conc. Constr. 4, 27–35. doi: 10.12989/acc.2016.4.1.027
Shatarat, N., Abed, A. A., Hasan, K., and Abdel Jaber, M. (2019). Investigation of axial compressive behavior of reinforced concrete columns using recycled coarse aggregate and recycled asphalt pavement aggregate. J. Constr. Build. Mater. 217, 384–393. doi: 10.1016/j.conbuildmat.2019.05.085
Shatarat, N. K., Katkhuda, H. N., Hyari, K. H., and Asi, I. (2018). Effect of using recycled coarse aggregate and recycled asphalt pavement on the properties of pervious concrete. J. Struct. Eng. Mech. 67, 283–290. doi: 10.12989/sem.2018.67.3.283
Tabsh, S. W., and Abdelfatah, A. S. (2009). Influence of recycled concrete aggregates on strength properties of concrete. J. Constr. Build. Mater. 23, 1163–1167. doi: 10.1016/j.conbuildmat.2008.06.007
Xiao, J. Z., Li, W. G., and Poon, C. S. (2012). Recent studies on mechanical properties of recycled aggregate concrete in China - a review. J. China Technol. 55, 1463–1480. doi: 10.1007/s11431-012-4786-89
Yan, L. L., Liang, J. F., and Zhao, Y. G. (2019). Effect of high temperature on the bond performance between steel bars and recycled aggregate concrete. J. Comp. Conc. 23, 155–160. doi: 10.12989/cac.2019.23.3.155
Yaragal, S. C., Teja, D. C., and Shaffi, M. (2016). Performance studies on concrete with recycled coarse aggregates. J. Adv. Conc. Constr. 4, 263–281. doi: 10.12989/acc.2016.4.4.263
Zega, C. J., and Di Maio, A. A. (2009). Recycled concrete made with different natural coarse aggregates exposed to high temperature. J. Constr. Build. Mater. 23, 2047–2052. doi: 10.1016/j.conbuildmat.2008.08.017
Keywords: structural steel reinforced, recycled aggregate concrete column, fire test, static test, axial compression, bearing capacity
Citation: Chen Z, Liang Y, Mo L and Ban M (2020) Residual Properties and Axial Bearing Capacity of Steel Reinforced Recycled Aggregate Concrete Column Exposed to Elevated Temperatures. Front. Mater. 7:187. doi: 10.3389/fmats.2020.00187
Received: 19 December 2019; Accepted: 22 May 2020;
Published: 04 August 2020.
Edited by:
Guangming Chen, South China University of Technology, ChinaReviewed by:
Wit Stefan Derkowski, Cracow University of Technology, PolandMing Xiang Xiong, Guangzhou University, China
Copyright © 2020 Chen, Liang, Mo and Ban. This is an open-access article distributed under the terms of the Creative Commons Attribution License (CC BY). The use, distribution or reproduction in other forums is permitted, provided the original author(s) and the copyright owner(s) are credited and that the original publication in this journal is cited, in accordance with accepted academic practice. No use, distribution or reproduction is permitted which does not comply with these terms.
*Correspondence: Zongping Chen, enBjaGVuQGd4dS5lZHUuY24=