 Ruoyu Zhong
 Wen Deng
- Department of Civil, Architectural and Environmental Engineering, Missouri University of Science and Technology, Rolla, MO, United States
Fiber-optic sensor has drawn wide attention in the non-destructive testing and evaluation of civil engineering materials due to its high accuracy and resolution as well as cost-efficiency. Currently, using optical fiber as the temperature sensor is proposed to conduct the thermal integrity profiling (TIP) of concrete structures. However, concrete is not a thermally homogeneous material as assumed in current studies of concrete TIP. Its essential components, such as aggregates may cause thermal inhomogeneity problems when implementing fiber-optic sensors for TIP. In this paper, we use the concrete structures with different grades of aggregates to conduct numerical simulation for non-destructive thermal testing. The goal is to investigate how the thermal inhomogeneity caused by aggregates would influence the testing result. Firstly, we establish three concrete structure models with three different grades of aggregates based on the scenarios where these concrete structures will be used. Then, we numerically simulate the thermal process on these models and extract the temperature at the location where optical fiber would be installed. The influence caused by the inhomogeneity of aggregate size and distribution as well as the possible method to minimize the effect are evaluated in the paper. Overall, aggregates of concrete have a significant influence on the accuracy of TIP analysis, and defects could be veiled if no proper treatment to the data is implemented for TIP analysis.
Introduction
Concrete is one of the most important civil engineering materials across the world. From residential houses to transportation superstructures, numerous concrete structures are constructed and maintained every day. A key indicator of the structural safety is the integrity of the concrete. Thus, the integrity of the concrete structure should be monitored from its construction process throughout its service time. During the construction process, concrete could be foiled due to inappropriate procedures, especially for a cast-in-site concrete shaft. Concrete shafts, which bear and transfer the loading to the ground, play an important role in superstructure construction. However, slump, soft soil, misplacement of rebar cage, and other multiple factors could cause defects when pouring the concrete (O'Neill, 1991). 15% of 5,000 to 10,000 tested concrete shafts had the indication of potential defects, and 5% of the tested shafts showed indisputable defect signals (Klingmüller and Kirsch, 2004; Brown and Schindler, 2007). Defects cannot be prevented during the construction completely since the excavation and concrete pouring are both blind processes. Thus, the integrity test to determine whether defects exist within the concrete shaft is critical for the evaluation of concrete structural safety. On the other hand, the concrete structure could be intact after construction, but it would still degrade over time. For example, during a fire hazard, extreme high temperature could cause cracking of the concrete, which leads to degradation of mechanical property and integrity of concrete structures (Kodur and Sultan, 2003; Kodur et al., 2009). An appropriate method of monitoring concrete structures helps evaluation of remaining capacity.
Recently, the thermographic approach for the material integrity and damage analysis becomes promising as the non-destructive testing technique (Ciampa et al., 2018; Wang et al., 2018, 2019). The current state of practice in thermal integrity analysis of civil engineering materials is to measure temperature using thermocouples or infrared probes, then estimate the temperature distributions within the structures. However, these methods are usually costly, time-consuming, easily affected by electromagnetic interference, moisture, and unanticipated junction problems (Smalcerz and Przylucki, 2013). Recent studies in thermographic approach has aroused interest of using optical fiber as an alternative for the concrete material integrity testing and monitoring due to its durability, accuracy, immunity to electromagnetic interference, resistance to harsh environment and cost-efficiency. Zhong et al. (2018) as the first explored using the optical fiber in thermal integrity profiling (TIP) for drilled shafts to acquire higher resolution spatial data. TIP, as a non-destructive method, makes use of cement hydration heat to test the integrity of a concrete shaft. Any defect such as inclusion and necking, will be shown as temperature anomaly in temperature measurement (Mullins, 2010, 2013; Johnson, 2016). Compared to the conventional method by using cross-hole sonic logging or sonic pulse echo, the TIP can cover a larger area and provide a more comprehensive result. However, the accuracy of the TIP is limited by the number of sensors when using thermocouples or access tubes within the concrete shaft when using infrared probes. Thus, it was proposed to use Rayleigh scattering within optical fiber to replace thermocouples or thermal probes to improve data quality (Zhong et al., 2018). The optical fibers can be wrapped spirally around the rebar cage due to its flexibility which reduces horizontal interval significantly and provides a more comprehensive temperature distribution within the concrete shaft. On the other hand, Bao et al. (2017) proposed using pulse pre-pump Brillouin optical time domain analysis (PPP-BOTDA) as a temperature sensing method to measure spatially-distributed temperatures in reinforced concrete specimens exposed to fire. The remaining capacity of a concrete structure can be evaluated through thermo-mechanical analysis when the temperature distributions in situ are known (Usmani et al., 2001).
However, none of above fiber-optic based thermal integrity research took the influence of thermal inhomogeneity caused by concrete aggregates into account. Concrete is a multi-components composite material, which consists of aggregate and cement. Up to 60–80% of the volume of concrete is aggregate. Generally, aggregates are classified into two groups: fine-grained aggregates with grain size smaller than 4.75 mm and coarse aggregates with grain size larger than 4.75 mm. Due to economic reasons, lower usage of cement is preferred in order to lower the cost, which requires the aggregates to consist of a range of sizes rather than a uniform size. While this fulfills the economic and mechanical purpose, a range of sizes of aggregate introduces material-heterogeneity to concrete. Various sizes of aggregates cause variation in bulk composition which leads to macro heterogeneity in concrete (Kreijger, 1990). Properties of concrete are related to the size, geometry, and distribution of aggregates (Shahbazi and Rasoolan, 2017). The properties differences between cement and aggregates, like thermal conductivity and heat capacity, cause uneven temperature distribution after heated. Since the thermal integrity testing method relies on temperature anomalies to identify defects that exist or occur within the concrete structure, the variation of temperature caused by random aggregate distribution may lead to an overestimation or a misjudgement of defects. However, the uniform fine-grained aggregate was adopted when testing the feasibility of fiber-optic sensor applications in the laboratory integrity test. While the test results were promising, the specimens were less realistic. The influence of aggregates should be tested thoroughly before introducing fiber-optic sensor into real applications to avoid any misjudgement of defects.
The objective of this paper is to investigate the influence of thermal inhomogeneity caused by concrete aggregates on the fiber-optic based thermal integrity analysis of concrete structures. To remain problem focused, the superiority of fiber-optic sensor with applications in non-destructive thermal testing over other thermographic approaches will not be discussed. In this study, two engineering scenarios are analyzed: the concrete beam exposed to fire hazards and the concrete shaft installation. Three concrete structure models are established, two of which are for concrete beams and one is for concrete shaft. Each model has different sizes of aggregates randomly distributed within the structures. The size of aggregates is based on the scenarios these concrete structures will be poured. We simulate the thermal testing on these models and extract the temperature at the location where optical fibers would be installed. The influence caused by the thermal inhomogeneity of concrete aggregates with different sizes and distribution is investigated, and the method used to minimize the effect is also proposed in this paper.
Methodology
Governing Equation
The thermal integrity testing method for either concrete beams or concrete shafts predicts the existence of crack or the defect shape of foiled concrete structure based on the temperature distribution inside the material. We makes use of finite element method based commercial software COMSOL Multiphysics® to simulate the temperature distribution within concrete structures. The governing equation of heat transfer process in solid is:
where T is the temperature; Q is the heat generation rate of the material; Cp is the heat capacity of the material; k is the thermal conductivity of the material; ρ is the density of the material.
Heat Transfer in Air
In beam models, concrete beams are not directly heated by an internal heat source such as the hydration process but heated in a fire hazard scenario as an external heat source. The heat source is set with a certain distance away from the concrete beam. Thus, the heat transfer is not limited to a conduction which is the primary heat transfer way within a solid object. Conduction and radiation in air are two primary ways to transfer heat from the source to concrete beams. Conduction and radiation in air can be determined by Equations (2–7):
where u represents the velocity of the fluid; Nu represents the Nusselt number; Qp represents the pressure work; Qvd represents the viscous dissipation; n represents the refractive index; ε represents the emissivity of the surface. G represents surface irradiation; Gamb represents ambient irradiation; Gext represents external irradiation; Gm represents mutual surface irradiation; Famb represents ambient view factor; eb represents blackbody total emissive power; J represents the surface radiosity; σ represents Stefan-Boltzmann constant.
Heat Generation
In the drilled shaft model, the hydration heat generated during the concrete curing process is the key to the TIP test. Thus, it is necessary to determine the heat generation of concrete before simulation. The gross heat production and generation rate are two significant factors of temperature distribution. Two factors together determine the temperature of the shaft and the performance of TIP. Both factors are related to the ingredient of cement. Changing the proportion of cement would generate a different amount of heat. The total heat production can be calculated by Equations (8–10), (Schindler and Folliard, 2005):
where p with different subscripts represents the weight fraction of each compound; Q with different subscripts represents the heat generated according to each compound of the concrete. The subscript represents the name of each compound. The chemical composition of cement and fly ash are usually available from the supplier.
The rate of hydration can be calculated using the following equations provided by Schindler and Folliard (2005):
where α(t) represents the degree of hydration of cement at time t; and w/cm is a water-cement ratio; β and τ are determined by the cementitious constituent fractions. According to ASTM D7949-14, the recommended timing to perform TIP would be 12 h after concrete pouring until the number of days equivalent to foundation diameter in meters divided by 0.3 m.
Heat Transfer in Soil
Heat is dissipated into surrounding soil after the heat is generated due to the hydration process. Since the predominant material in soil is solid, conduction plays the most important role in heat dissipation in the shaft simulation. Aside from the temperature and density of the material, two factors control the conduction process: thermal conductivity and heat capacity.
Soil is a composite material consisting of solid, air, and water. The effective thermal conductivity depends on the constitution of soil and the thermal conductivity of each phase. The thermal conductivity can be calculated by Equation (15), (Liu et al., 2002; Barry-Macaulay et al., 2013; Sáez Blázquez et al., 2017):
where k with subscripts represents the thermal conductivity of each phase of soil; n represents porosity; Sw represents the degree of saturation. The subscript s denotes solid phase; w denotes water phase; a denotes air phase.
The shape of void inside of soil has an effect on heat transfer as well. To take that effect into account, the shape factor is introduced into the equation. Now the equation becomes:
The temperature of the soil is assumed to be the same among the three phases. The heat required to raise the temperature of soil one degree can be calculated by the sum of three phases: Csms + Cwmw + Cgma. The total mass of the soil is: ms + mw + ma. Therefore, the effective heat capacity of soil can be calculated as follow:
where C with subscripts represents the heat capacity of each phase of soil; m with subscripts represents the mass of each phase of soil.
Considering that the mass of air is negligible, the equation can be simplified as:
where w is the water content.
Aggregate Distribution
The aggregate distribution method used in the simulation is referenced to Qian et al. (2016). Concrete is considered as a composite geometrical structure where aggregates such as sands and gravels are embedded in a mortar matrix. Although using non-spherical particles is more realistic, the temperature fluctuation caused by the shape of aggregates is less significant compared to other factors such as size and distribution. To simplify the calculation, thermal inhomogeneity caused by the shape of aggregates is not considered. Spherical shape aggregates are adopted in this study. An aggregate particle is generated with a random radius at each time. The radius is determined by a pseudo-random number generator within a given radius range. Then, the aggregate particles are placed at a random coordinate within a given range of coordinates which is the size of the model. The key algorithm required in the particle placing procedure is to check whether aggregate particles are overlapped. Since the shape of the particle is not considered, the overlap algorithm simply consists of equations to check whether the distance between particles and the distance between particle and boundaries are smaller than zero. A variable is assigned to count the failure of placement. When the total amount of aggregate for a certain radius range is reached or the failure count exceeds the limit, the next radius range would be used for a new round of placement. The placement procedure will stop after all radius ranges are finished. The flow chart in Figure 1 demonstrates the procedure of aggregate placement.
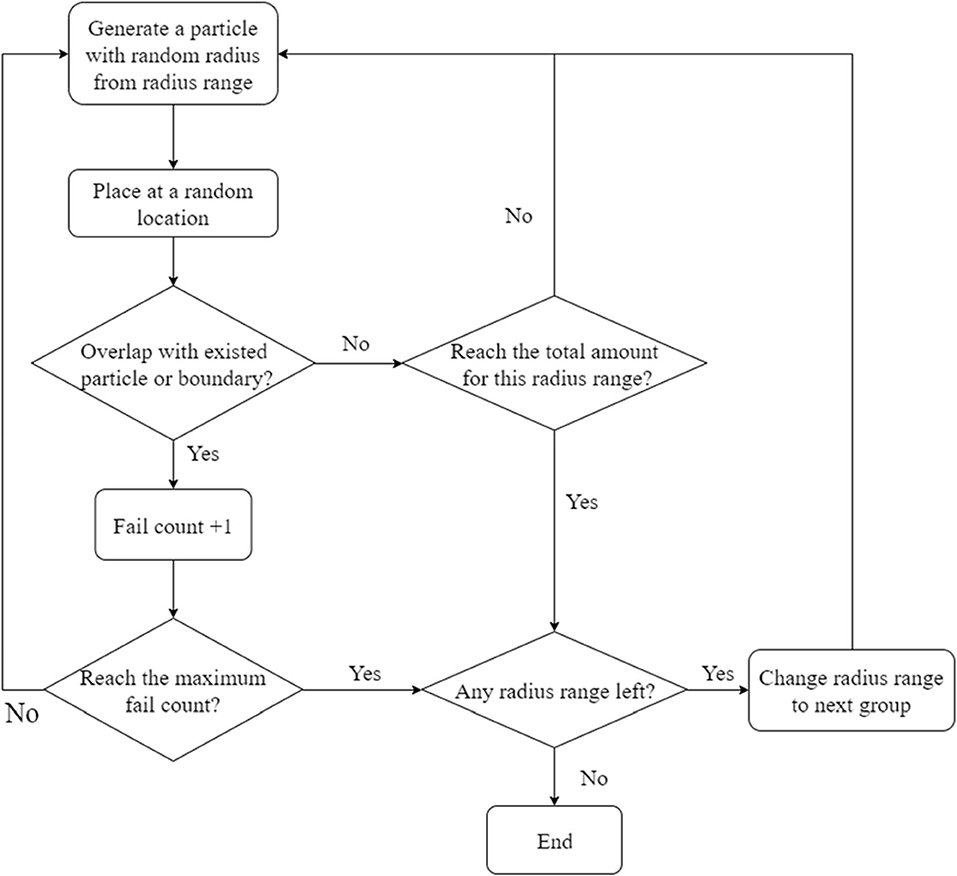
Figure 1. Flow chart of aggregate placement.
Simulation Parameters and Model for Beam
To simulate the temperature distribution within the beam exposed to a fire hazard environment, a two-dimensional (2-D) model is established. The model is shown in Figure 2. The reason for adopting a 2-D model rather than a three-dimensional (3-D) model is that the computation stress using a 3-D model is too high. Since we mainly focus on vertical heat transfer, to simplify the model without loss of generality, a 2-D model is employed. The size of the model is 610 × 152 mm. The model consists of three elements: gravel, sand, and cement. The aggregates particles are input to the model following the procedures illustrated in Figure 1. The circles with multiple colors represent aggregates, and each color represents a radius range. The gray section represents the cement surrounding aggregates. The small gap between aggregate represents the location of the fiber optic sensor. Rebar is not established in this model since the main focus is the effect of aggregate. Although is not shown in the figure, the beam model is surrounded by air with default properties in COMSOL. The heat source is set at the bottom of the air section to simulate fire. The heart rate is set at several given rates. Temperature distribution data is acquired at the gap with a space interval of 1 cm. The properties of each component can be found in Table 1, and the heat rate and duration can be found in Table 2.
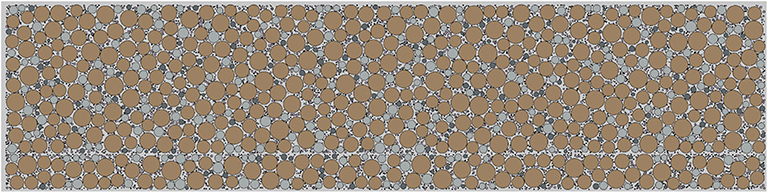
Figure 2. Demonstration of aggregates distribution within a 2-D beam. A void gap line represents the location of optical fiber placed in the beam. Different colors of the aggregates represent certain size ranges.
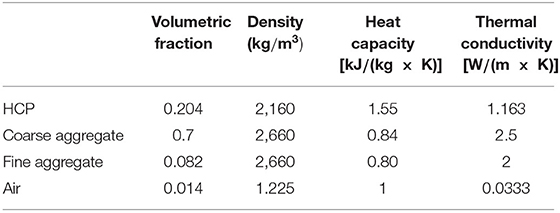
Table 1. Properties of each component in beam model.
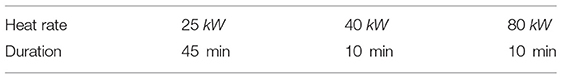
Table 2. Heat rate and duration.
Simulation Parameters and Model for Shaft
To simulate the temperature evolution and distribution within the shaft, a 3-D model is established as shown in Figure 3. Figure 3 shows the composition of a concrete shaft model. We made two simplifications to the model. Firstly, the rebar cage is not reconstructed in the model. Rebar has relatively low heat capacity and high thermal conductivity, and the heat that transfers into rebar cage is negligible. Moreover, the volume of the rebar cage is relatively small compared to the concrete shaft. Therefore, to simplify the model, no rebar cage geometry is input to the model. However, it is still necessary to point out the location of the rebar cage. Secondly, aggregates of which diameter is smaller than 5 mm are removed due to the high requirement of computational resources for 3-D simulation. According to our preliminary study, the influence of thermal inhomogeneity caused by small aggregates on the integrity analysis is relatively insignificant. Therefore, in our simulation, the volume ratio of aggregates actually cannot reach 60% or above. Since our goal is not to study the mechanical properties of concrete but the thermal process within the concrete, current packing of aggregates by neglecting the small aggregates can still meet the goal of the study.
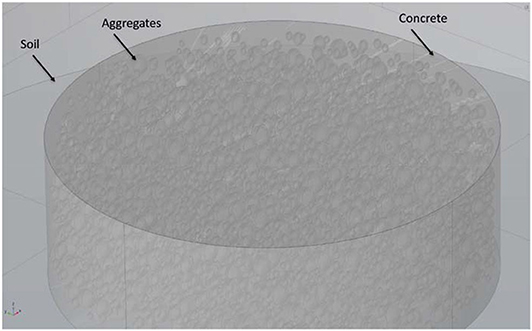
Figure 3. Shaft-soil model. Aggregates are embedded in the concrete shaft.
In the paper proposed using fiber-optic sensor as means to acquire temperature distribution data for TIP, the optical fiber is proposed to be wrapped spirally around rebar cage (Zhong et al., 2018). In the realistic scenario, the optical fiber is wrapped on the outside of rebar cage before the rebar cage is placed into the drilled pit and location of the optical fiber relative to rebar cage is calibrated. The location of the rebar cage in the model is where the temperature distribution data would be extracted. Optical fiber is not input to the geometry for a similar reason. The properties of concrete can be found in Table 1. The properties of soil can be found in Table 3. The flow chart of simulation is given in Figure 4.
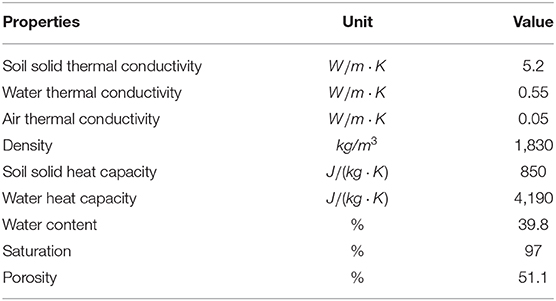
Table 3. Soil properties.
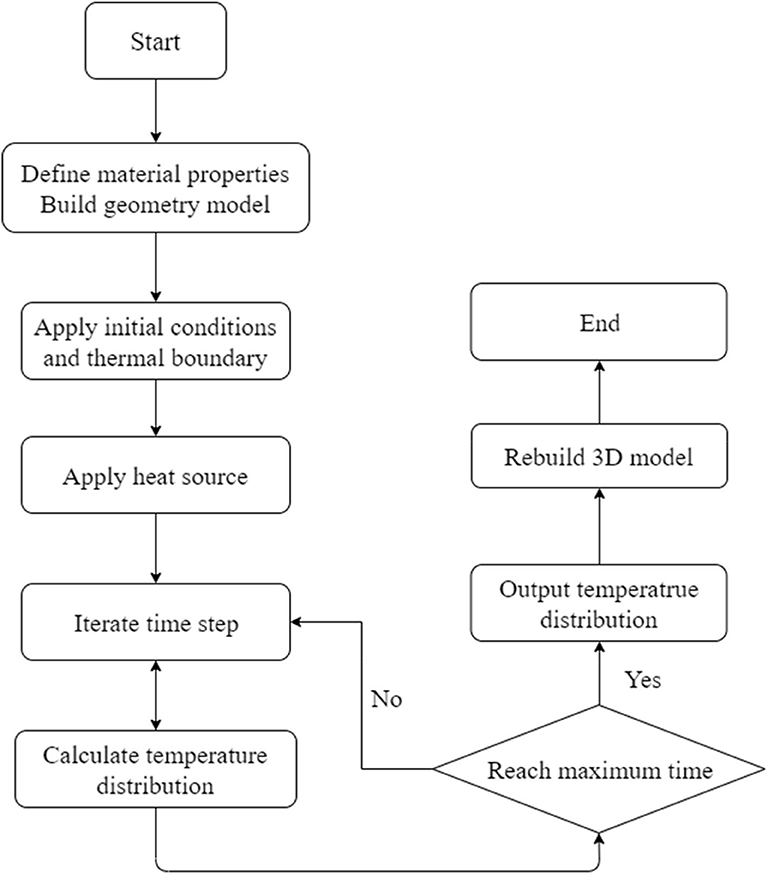
Figure 4. Simulation flow chart (Zhong et al., 2018).
Results and Discussion
The simulation results of two beam-models and one shaft model are presented in this section along with the discussion of the influence of thermal inhomogeneity caused by aggregates. First, we present the result of a beam model of self-consolidating concrete (SCC) following with another model of conventional concrete (CC). Then, the results from a concrete shaft model with maximum grain size of 80 mm and minimum grain size of 5 mm are presented. The influence of aggregates on thermal integrity analysis is discussed separately in the other section.
Results of SCC Beam
SCC is a type of concrete of which predominant aggregate type is the fine aggregate. This type of concrete sacrifices economic efficiency for higher workability. Its high workability gives it the ability to flow into intricate spaces and congested reinforcement. Moreover, SCC does not require vibrators to compact concrete which improves safety and reduces noise at the site. Since SCC has wide applications in the construction, SCC would be a standard material to study the influence of aggregates on the thermal integrity analysis with relatively small-size aggregates.
The SCC in the simulation has a maximum grain size of 12 mm. The beam model is heated at the given heat rate as given in Table 2. After 65 min of heating and crack occurs, temperature data are extracted at the location of the virtual fiber-optic sensor. Since our main focus is not the temperature distribution of the whole beam structure, only temperature distribution at a straight-line direction is extracted. Temperature distribution data along the fiber-optic sensor are shown in Figure 5.
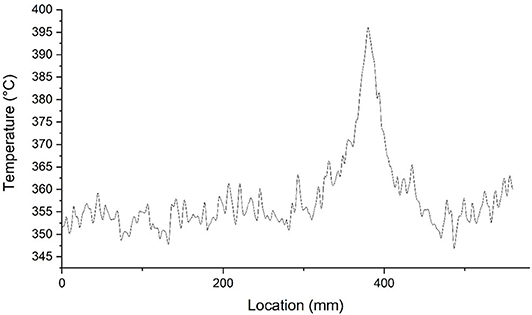
Figure 5. Temperature distribution of beam model I for SCC.
As shown in Figure 5, the temperature data plot has a main peak along with multiple minor fluctuations at other locations. The main peak, according to the paper published by Bao et al. (2017), indicates the location of cracks which occurred due to extremely high temperatures. The predominant heat transfer way in concrete is conduction before a crack appears. However, after crack appears, the void space in the crack is filled with hot air, which means the predominant heat transfer at that location would be convection in the air and radiation. The heat transfer at crack location has higher efficiency compared with the intact concrete cover. Therefore, the temperature rises dramatically around the crack and the fiber-optic sensor can catch this temperature change. The temperature fluctuation shown in Figure 5 demonstrates the thermal inhomogeneity of concrete caused by the aggregate distribution. Assuming that concrete is homogeneous, temperature distribution should be a flat line along the intact concrete cover. However, the thermal properties of cement are not the same as those of aggregates. Moreover, the spatial distribution of aggregates is not perfect uniform. These two factors make the heat conduction has a different rate in different directions, resulting in temperature fluctuation. The temperature increment is distinct compared to the fluctuation. This is because the size of the crack is considerably larger than the maximum grain size and the grain size is relatively small in SCC. The temperature increment due to cracking outgrows the effect caused by the thermal inhomogeneity due to aggregates. In the case of SCC, the influence of aggregates on the thermal integrity analysis is relatively insignificant.
Results of CC Beam
Compared to SCC beam, CC beam is more commonly used. The second case uses CC as a study example. The maximum grain size in the CC is 26 mm. In this model, the CC beam is heated at the same condition as in the SCC model, and the temperature is also extracted at the same location at different time. The temperature data are shown in Figure 6A. The temperature fluctuation is considerably pronounced compared to the SCC model. The effect of aggregates increases with the increment of the maximum size of the aggregates. The fluctuation is almost twice as the one in the SCC model. The location of cracks is pointed in Figure 6A, and almost undetectable from the data. On the one hand, the size of the crack is slightly smaller compared to the SCC model, which decreases the increment caused by crack. On the other hand, the larger fluctuation due to larger aggregates makes it harder to distinguish the thermal effect due to the crack from the temperature fluctuation due to the thermal inhomogeneity. These two factors together result in a non-distinctive temperature increment as shown in Figure 6A. The existence of coarse aggregates could be problematic for the application of the fiber-optic sensor in concrete structures exposed to fire hazards.
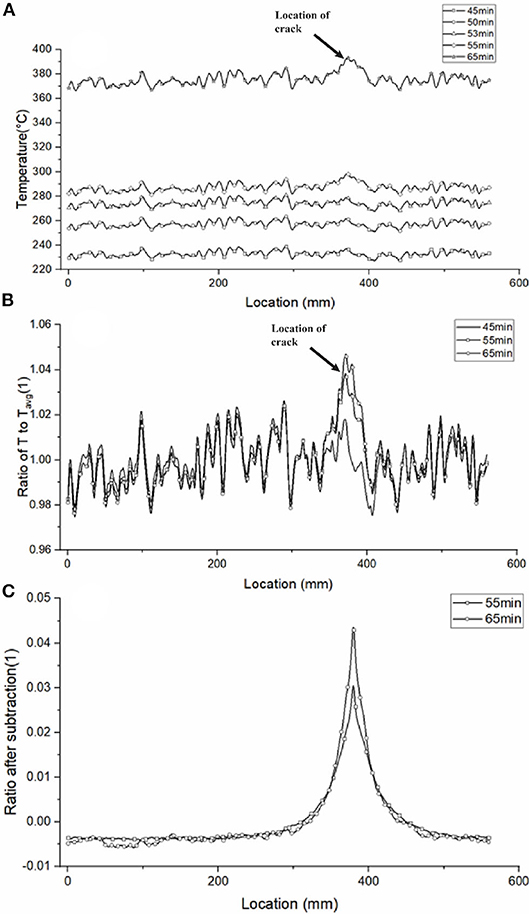
Figure 6. (A) Temperature distribution of beam model II, (B) normalized temperature by Tavg, and (C) normalized temperature after subtraction of temporal temperature data.
Although the location of defects cannot be detected based on the data at a certain time, there could be still a solution to that problem. It should be noted that cracks are not naturally existed in the concrete structure. The crack in the model usually develops due to the exposure to extremely high temperatures. Therefore, we can make use of the temporal temperature logging to solve this problem of non-distinguishable data. Firstly, we divide temperature data into groups based on the time collected. Then we divide the temperature data at each group by the average temperature (Tavg) of that group. The outcome is shown in Figure 6B. We have a more direct comparison of temperature distribution at a different time compared to Figure 6A. The temperature increment caused by cracking can easily be detected with the help of reference data of intact concrete. The temperature distribution of a damaged concrete outside of the damaged region is lower than the intact concrete beam. This is because the temperature increment caused by crack rises the average temperature, which leads to a lower ratio at the intact region. By subtracting the reference data from each group, we can further diminish the effect of thermal inhomogeneity caused by aggregates. The result is shown in Figure 6C. The only peak in Figure 6C is the temperature increment caused by crack. The intact region has an almost flat line by diminishing the effect of aggregates. Therefore, this method can be further used to detect the cracking of CC beam when the concrete structure is exposed to fire hazards.
Shaft Model
The maximum grain size used in the current production shafts could be as large as 160 mm. Although 40 mm may be the most common case for concrete shaft, the maximum size used in the shaft model is 80 mm to better study the influence of larger aggregates. To simulate the TIP test of concrete shaft, we establish a 6-foot concrete shaft with a longitudinal length of 1 m. Since the temperature anomaly is only restricted in the vicinity of the defect region, only part of the concrete shaft nearby the defect is simulated in the model to save the computational resources. The model geometry is shown in Figure 3. To simulate the inclusion defect in the concrete shaft, a 15×15×10 inch sand block as inclusion defect is placed at the edge of concrete shaft in the circumferential direction. The concrete shaft would generate heat during the curing process. Any location that has a shortage of concrete would generate less heat and be recognized as a thermal sink region at the plot. We simulate the 5-day curing process starting from pouring with 1-day interval. The temperature on the third day is recorded. The result is shown in Figure 7.
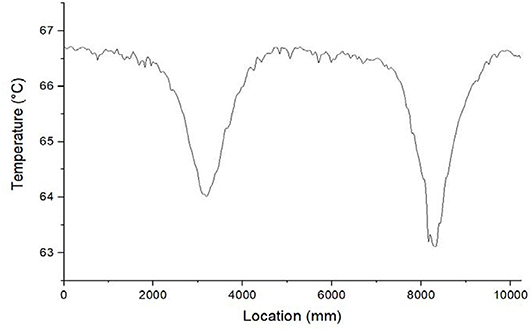
Figure 7. Third-day temperature distribution for concrete shaft with coarse aggregates. The x-axis is the corresponding length of optical fiber spirally wrapped on the rebar cage.
The fiber-optic sensor is wrapped around a rebar cage spirally, and the sensor may pass the defective region several times. Each local minimum on the temperature plot represents the location of the defective region. As shown in the Figure 7, two local minima indicate the fiber-optic sensor passes the defective region for two times. The location that measures the local minimum temperature represents the spot that is closest to the center of the anomaly. Even though it is not pronounced, temperature fluctuations can be found in the plot. The temperature anomalies outgrows the fluctuation even more than the case of SCC beam. The explanation would be that the defect size is much greater than the maximum size of aggregates. If we consider that each aggregate as a small inclusion, and the sand block as a single large inclusion, and temperature will change according to the size of inclusion. The ability to detect anomaly in the concrete shaft or other structure would be affected by aggregates only when the size of anomaly is comparable or smaller than the maximum size of aggregates. By considering the required detectable defects of concrete shaft installation, it can be concluded that the influence of thermal inhomogeneity caused by aggregates is insignificant to practical application of fiber-optic based TIP of concrete shafts.
Conclusion
Within this paper, it is demonstrated that the thermal inhomogeneity due to the aggregates could cause temperature fluctuation during the non-destructive thermal integrity testing. This fluctuation may conceal the temperature anomaly caused by the damaged or defective region which is the essential mechanism for non-destructive thermal integrity testing. The larger the maximum aggregate size is, the larger the fluctuation would be due to thermal property contrast between aggregates and concrete cement. The ability to detect damaged or defective region in the concrete shaft or other structure could be affected by aggregates when the size of defects is comparable or smaller than the maximum size of aggregates. For the case of SCC beam and concrete shaft as we study in this paper, the influence of aggregate on the thermal integrity analysis is insignificant.
Even though temperature anomaly due to defects might be veiled by temperature fluctuation due to thermal inhomogeneity caused by aggregates, with proper treatment provided within this paper, the effect of aggregates can still be diminished by using the temperature data of intact structure as a reference.
The result indicates that the aggregates could have significant influence on the thermal integrity analysis of concrete structures when pouring with CC. However, proper treatment of the temperature data can diminish such an influence.
All of current conclusions are based on our explorative numerical simulation, the further verification by laboratory and in situ testing is suggested in the future study.
Data Availability Statement
The raw data supporting the conclusions of this article will be made available by the authors, without undue reservation.
Author Contributions
RZ conducted the research and wrote the paper. WD funded and supervised the research and edited the paper. All authors contributed to the article and approved the submitted version.
Conflict of Interest
The authors declare that the research was conducted in the absence of any commercial or financial relationships that could be construed as a potential conflict of interest.
Acknowledgments
The support of this research was provided by the Geotechnical Engineering program of Missouri University of Science and Technology. The authors would like to thank the Associate Editor Dr. Antonio Caggiano and two reviewers for their constructive comments to improve the early version of this paper.
References
Bao, Y., Hoehler, M. S., Smith, C. M., Bundy, M., and Chen, G. (2017). Temperature measurement and damage detection in concrete beams exposed to fire using PPP-BOTDA based fiber optic sensors. Smart Mater. Struct. 26:105034. doi: 10.1088/1361-665X/aa89a9
Barry-Macaulay, D., Bouazza, A., Singh, R. M., Wang, B., and Ranjith, P. (2013). Thermal conductivity of soils and rocks from the Melbourne (Australia) region. Eng. Geol. 164, 131–138. doi: 10.1016/j.enggeo.2013.06.014
Brown, D., and Schindler, A. (2007). “High performance concrete and drilled shaft construction,” in Contemporary Issues in Deep Foundations, eds W. Camp, R. Castelli, D. F. Laefer, and S. Paikowsky (Denver, CO: American Society of Civil Engineers), 1–12. doi: 10.1061/40902(221)31
Ciampa, F., Mahmoodi, P., Pinto, F., and Meo, M. (2018). Recent advances in active infrared thermography for non-destructive testing of aerospace components. Sensors 18:609. doi: 10.3390/s18020609
Johnson, K. R. (2016). Analyzing thermal integrity profiling data for drilled shaft evaluation. DFI J. 10, 25–33. doi: 10.1080/19375247.2016.1169361
Klingmüller, O., and Kirsch, F. (2004). “A quality and safetyissue for cast-in-place piles-25 years of experience with low-strain integrity testing in Germany: from scientific peculiarity to day-to-day practice,” in Current Practices and Future Trends in Deep Foundations, eds J. A. DiMaggio, and M. H. Hussein (Los Angeles, CA: American Society of Civil Engineers), 202–221. doi: 10.1061/40743(142)12
Kodur, V., Dwaikat, M., and Raut, N. (2009). Macroscopic FE model for tracing the fire response of reinforced concrete structures. Eng. Struct. 31, 2368–2379. doi: 10.1016/j.engstruct.2009.05.018
Kodur, V., and Sultan, M. (2003). Effect of temperature on thermal properties of high-strength concrete. J. Mater. Civ. Eng. 15, 101–107. doi: 10.1061/(ASCE)0899-1561(2003)15:2(101)
Kreijger, P. (1990). “Inhomogeneity in concrete and its effect on degradation: a review of technology,” in Protection of Concrete: Proceedings of the International Conference, University of Dundee, September 1990 (Dundee: CRC Press).
Liu, W., He, P., and Zhang, Z. (2002). A calculation method of thermal conductivity of soils. J. Glaciol. Geocryol. 24, 770–773. Available online at: http://www.bcdt.ac.cn/EN/Y2002/V24/I6/770
Mullins, G. (2010). Thermal integrity profiling of drilled shafts. DFI J. 4, 54–64. doi: 10.1179/dfi.2010.010
Mullins, G. (2013). Advancements in drilled shaft construction, design, and quality assurance: the value of research. Int. J. Pavement Res. Technol. 6, 93–99. doi: 10.6135/ijprt.org.tw/2013.6(2).93
O'Neill, M. W. (1991). Construction practices and defects in drilled shafts. Transp. Res. Rec. 1331, 6–14.
Qian, Z., Garboczi, E., Ye, G., and Schlangen, E. (2016). Anm: a geometrical model for the composite structure of mortar and concrete using real-shape particles. Mater. Struct. 49, 149–158. doi: 10.1617/s11527-014-0482-5
Sáez Blázquez, C., Farfán Martín, A., Martín Nieto, I., and Gonzalez-Aguilera, D. (2017). Measuring of thermal conductivities of soils and rocks to be used in the calculation of a geothermal installation. Energies 10:795. doi: 10.3390/en10060795
Schindler, A. K., and Folliard, K. J. (2005). Heat of hydration models for cementitious materials. ACI Mater. J. 102:24. doi: 10.14359/14246
Shahbazi, S., and Rasoolan, I. (2017). Meso-scale finite element modeling of non-homogeneous three-phase concrete. Case Stud. Constr. Mater. 6, 29–42. doi: 10.1016/j.cscm.2016.10.002
Smalcerz, A., and Przylucki, R. (2013). Impact of electromagnetic field upon temperature measurement of induction heated charges. Int. J. Thermophys. 34, 667–679. doi: 10.1007/s10765-013-1423-1
Usmani, A., Rotter, J., Lamont, S., Sanad, A., and Gillie, M. (2001). Fundamental principles of structural behaviour under thermal effects. Fire Saf. J. 36, 721–744. doi: 10.1016/S0379-7112(01)00037-6
Wang, Z., Tian, G., Meo, M., and Ciampa, F. (2018). Image processing based quantitative damage evaluation in composites with long pulse thermography. NDT&E Int. 99, 93–104. doi: 10.1016/j.ndteint.2018.07.004
Wang, Z., Zhu, J., Tian, G., and Ciampa, F. (2019). Comparative analysis of eddy current pulsed thermography and long pulse thermography for damage detection in metals and composites. NDT&E Int. 107:102155. doi: 10.1016/j.ndteint.2019.102155
Keywords: fiber-optic sensing, drilled shaft, concrete beam, thermal integrity profiling, concrete aggregates
Citation: Zhong R and Deng W (2020) Influence of Aggregates in Concrete on Fiber-Optic Based Thermal Integrity Profiling Analysis of Concrete Structures. Front. Mater. 7:227. doi: 10.3389/fmats.2020.00227
Received: 03 April 2020; Accepted: 22 June 2020;
Published: 13 August 2020.
Edited by:
Antonio Caggiano, Darmstadt University of Technology, GermanyCopyright © 2020 Zhong and Deng. This is an open-access article distributed under the terms of the Creative Commons Attribution License (CC BY). The use, distribution or reproduction in other forums is permitted, provided the original author(s) and the copyright owner(s) are credited and that the original publication in this journal is cited, in accordance with accepted academic practice. No use, distribution or reproduction is permitted which does not comply with these terms.
*Correspondence: Wen Deng, d2VuZGVuZ0Btc3QuZWR1