 Oleg Stryzhyboroda
 Victor T. Witusiewicz
 Sergej Gein
 Daniel Röhrens
 Ulrike Hecht
- Access e.V., Aachen, Germany
In this paper we present and discuss phase equilibria in the quaternary Al–Cr–Fe–Ni and the quinary Al–Co–Cr–Fe–Ni alloy systems based on experimental data from DTA/DSC, SEM/EDS, and SEM/EBSD on as-cast and isothermally annealed samples. These data as well as literature data were used for developing a new Al–Co–Cr–Fe–Ni thermodynamic description by the CALPHAD approach. Considerable efforts in this direction have been made already and commercial databases for high entropy alloys are available, e.g., TCHEA4 and PanHEA. We focus on comparing our new thermodynamic database with computations using TCHEA4 for two section planes, i.e., quaternary AlxCrFe2Ni2 and quinary AlxCoCrFeNi, where x is the stochiometric coefficient. According to our new thermodynamic description a single-phase field BCC-B2 is stable over a wider temperature range in both section planes, giving rise to dual-phase microstructures along solid state phase transformation pathways. In the section plane AlxCoCrFeNi the two-phase field BCC-B2 + σ predicted by the new database is stable between 600 and 800°C, while in TCHEA4 this phase field extends to nearly 1000°C. Furthermore, our new database showed that the solidification interval with primary BCC-B2 phase in quinary as well as quaternary section planes is narrow, being in a good agreement with presented micro-segregation measurements. Additionally, computed phase fields and phase-field boundaries in the quinary section plane correspond well to the experimental results reported in the literature.
Introduction
High entropy alloys (HEAs) and, in particular, alloys from the Al–(Co)–Cr–Fe–Ni alloy system have been subject to numerous investigations due to promising mechanical, magnetic and electrochemical properties (Butler and Weaver, 2016; Gao et al., 2016; Chen et al., 2017; Shi et al., 2017). It was shown that in this alloy system the chemical composition can be adjusted to obtain materials with face centered cubic (FCC) or body centered cubic (BCC) majority phases (Wang et al., 2012, 2014; Yang et al., 2015). However, in the last few years research focused on dual-phase materials (FCC + BCC) (Dong et al., 2016; Ghassemali et al., 2017; Lim et al., 2017) and even dual phase eutectics (EHEA). Good examples for these two types of dual phase materials are the alloys Al0.7CoCrFeNi with duplex Widmanstätten microstructure (Leo et al., 2017; Rao et al., 2017; Gwalani et al., 2019), and AlCoCrFeNi2.1 with a lamellar eutectic microstructure (Lu et al., 2014; Wani et al., 2016; Nagase et al., 2017).
Microstructure and property characterization have progressed significantly for as-cast HEAs and EHEAs including knowledge about solid-state phase transformations along distinct processing routes. Some of them e.g., additive manufacturing, may involve high cooling rates thus leading to non-equilibrium microstructures which can be further optimized through heat treatment schemes. For both alloy design and processing technologies it is therefore important to rely on critically assessed thermodynamic background information.
The challenge with the thermodynamic modeling relates to the fact that the high entropy compositional range involves equiatomic or near equiatomic alloy compositions which have been avoided so far in classical CALPHAD databases. In fact, the databases were designed for alloy families with a well-defined major component e.g., steel, Ni-based superalloys etc. Nonetheless, the CALPHAD approach remains the only efficient tool for the construction of thermodynamic databases. Based on CALPHAD two thermodynamic descriptions were proposed for the quinary alloy system Al–Co–Cr–Fe–Ni being included in high entropy multi-component databases, i.e., TCHEA1 through TCHEA4 (Chen et al., 2018; Thermo-Calc Software, 2020) by Thermo-Calc AB1 and PanHEA (CompuTherm Plc, 2020) by CompuTherm Plc.2
Prediction of phase equilibria for alloys form the Al–(Co)–Cr–Fe–Ni system differ widely in the currently available or published database versions and certainly differ from experimental observations. Necessarily over time these databases will constantly improve both in terms of accuracy and scope. Improvements will also be provided by academic research groups mainly for less ample sub-systems e.g., quaternary and quinary alloy systems. The focus on these sub-systems is essential because simple extrapolations from ternary sub-systems to multicomponent systems may not be straightforward or even problematic as already discussed by Gorsse and Senkov (2018).
In this work we present research results on thermodynamic equilibria in the system Al–Co–Cr–Fe–Ni including key experimental data for selected alloys and annealing conditions as well as a thermodynamic description based on CALPHAD modeling. For selected section planes through the compositional space we will also compare the new description with TCHEA4 results and refer to Zhang et al. (2016) for comparison with PanHEA. The section planes at case are AlxCoCrFeNi and AlxCrFe2Ni2.
Experimental Methods
To support CALPHAD modeling and complement available literature data we produced a series of experimental alloys using the arc melter MAM-1 (Edmund Bühler GmbH) to melt small 15 g samples from mixtures of high purity elements (>99.9%). The melting process was carried out on a water-cooled copper hearth under Ar atmosphere. Each sample was flipped and re-melted at least three times to ensure chemical homogeneity. To reduce the amount of residual oxygen, the melting chamber was vacuumized and consequently fleshed with Ar at least 3 times before each melting process. Table 1 list the chemical compositions of the samples measured by energy dispersive X-ray spectrometry (EDS).
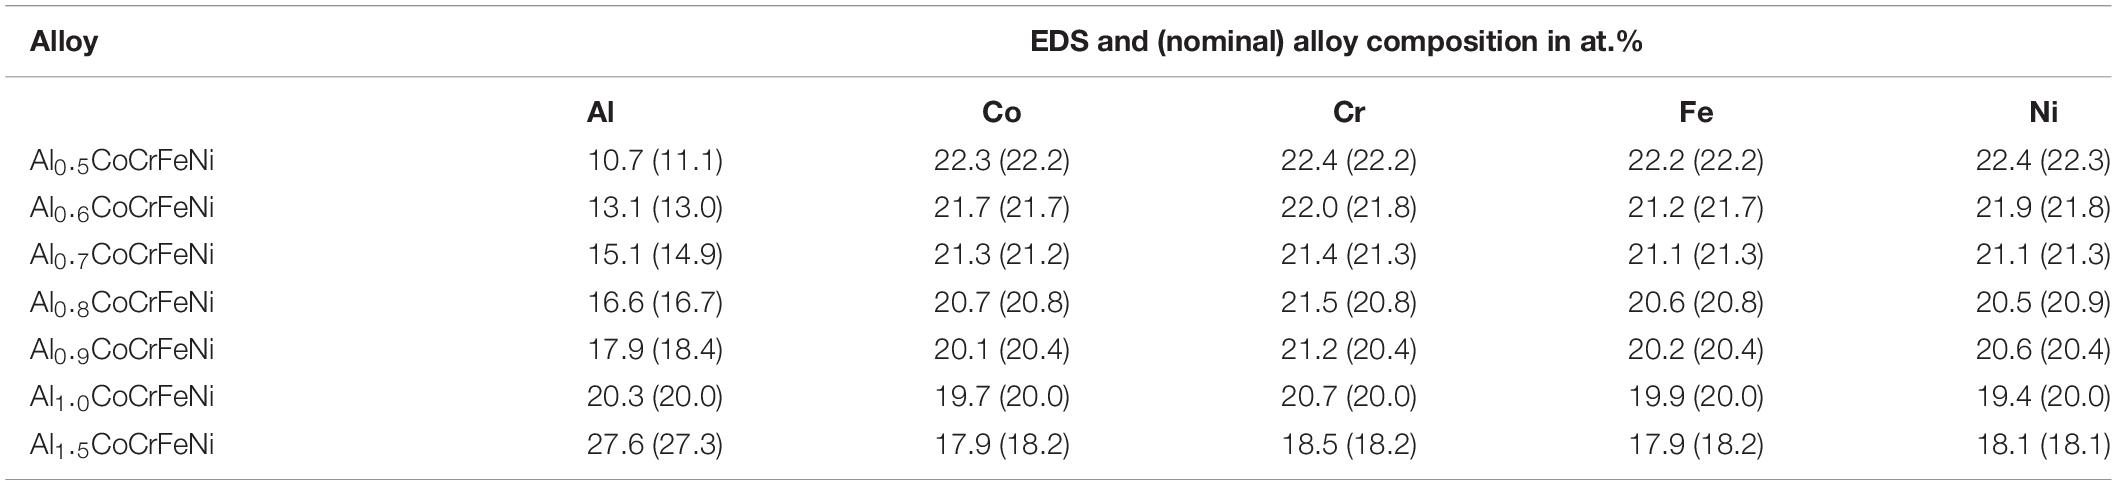
Table 1. Integral chemical composition of the AlxCoCrFeNi alloys measured by EDS.
The samples were cut in four pieces for isothermal annealing treatments which were performed in a tube furnace RHTC 20-230/15 (Nabertherm GmbH) under high purity Ar atmosphere. The annealing temperatures were 750, 1000, and 1300°C for 48, 24, and 6 h respectively, followed by water quenching (WQ). From these annealing conditions we will mainly report the results for 1300°C/6 h/WQ as well as selected key observations from other annealing temperatures specifically defined in the process of database optimization.
Differential thermal analyses (DTA) were performed with heating and cooling rates of 20 K/min on as-cast samples in alumina crucibles under high purity Ar atmosphere. These measurements were conducted in a high temperature differential scanning calorimeter type Pegasus DSC 404 F3 (NETZSCH-Gerätebau GmbH) operated in DTA mode with two different sensors, i.e., DSC-cp and DSC-DTA both with an S-type thermocouple. Calibration runs were performed using In, Sn, Al, Ag, Au, and Ni from NETZSCH calibration set. The DTA curves were processed according to guidelines of the National Institute of Standards and Technology (NIST) (Boettinger et al., 2006). The first detectable deviation of the peak from the baseline was chosen as the onset of a phase transformation. The end of a phase transformation was defined as corresponding to the inflection point at the return side of the peak.
Microstructural analysis was carried out by scanning electron microscopy (SEM) including EDS and backscattered electron diffraction (EBSD). The specimens were prepared by standard grinding and polishing steps with a final step of vibratory polishing in a Vibromet device (Buehler). SEM/EDS and SEM/EBSD were performed using a ZEISS-Gemini Leo 1550 (Carl Zeiss AG) microscope equipped with EDS and EBSD detectors and the INCA Analysis software (Oxford Instruments Plc). EDS measurements were conducted using an accelerating voltage of 15 kV and a working distance of 10 mm. The EBSD measurements were performed mainly in mapping mode under an accelerating voltage of 25 kV and the working distance of around 16 mm.
Key Experimental Results
Phase Transformation Temperatures From Differential Thermal Analysis (DTA)
Differential thermal analysis measurements were conducted on as-cast samples. Thus, the micro-segregation inherited from solidification and potentially metastable microstructures are expected to affect the measured phase transformation temperatures upon heating, specifically in the low temperature range, e.g., below 1000°C. Above this temperature diffusion is considered fast enough to homogenize the samples. Expectedly, solidus and liquidus temperatures are more accurately detected.
Figure 1A shows the DTA heating curves for the AlxCoCrFeNi HEA alloys listed in Table 1 in the region of solid-state transformations. The associated endothermic peaks are labeled P1 through P3. Melting peaks are shown in Figure 1B labeled P4. Based on microstructure analysis and information from literature we identified the phase transformations corresponding to the individual peaks P1, P2, and P3 as follows. Peak P1 represents the dissolution of the ordered FCC-L12 phase which is present as needle-like precipitates and stable up to 500–620°C depending on the alloy composition.
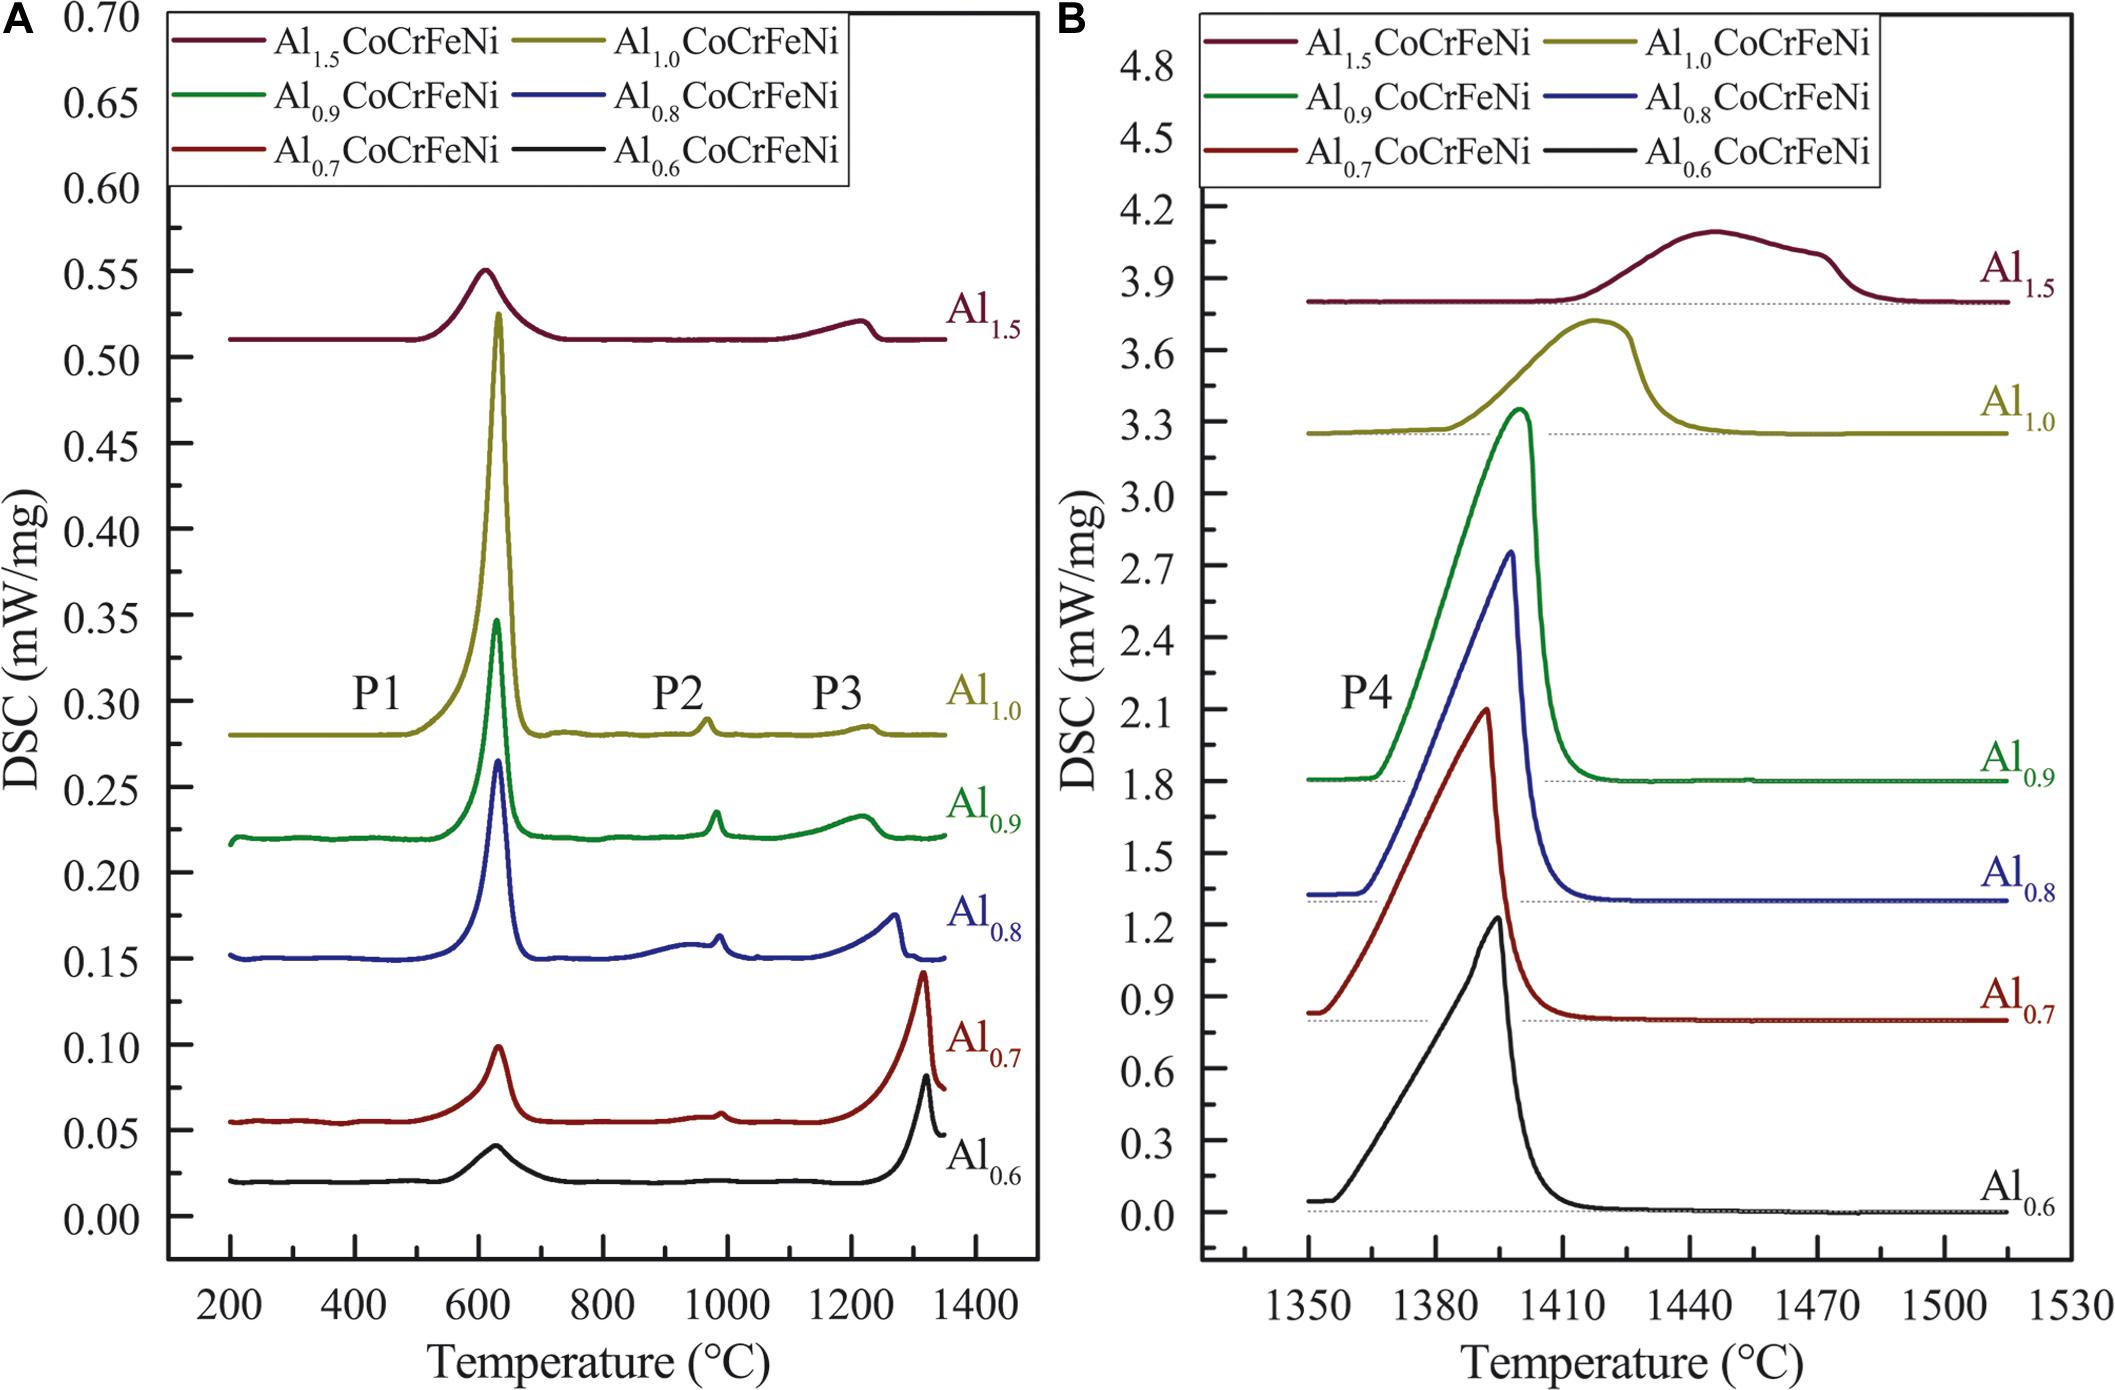
Figure 1. DSC curves for AlxCoCrFeNi alloys (x = 0.6, 0.7, 0.8, 0.9, 1.0, and 1.5) in solid state (A) and in the range of melting (B) upon heating with heating rate of 20 K/min.
Peak P2 around 1000°C is associated with the complete dissolution of the σ-phase. The chromium bonded in σ-phase will be redistributed into the disordered solid solution phases FCC-A1 and/or BCC-A2. Noteworthy alloy Al1.5CoCrFeNi shows no σ-phase dissolution in this temperature range.
Peak P3 strongly depends on the alloy composition: for x ≥ 1.0, P3 is attributed to the dissolution of the disordered BCC-A2 phase; for 0.8 ≥ x ≥ 1.0, P3 is attributed to the dissolution of the disordered solid-solution phases BCC-A2 and FCC-A1. Finally, for 0.4 ≥ x ≥ 0.7, P3 is attributed to early stages of melting where the disordered solid-solution phases are in equilibrium with the first liquid. These distinctions are made in fact with preliminary knowledge from the thermodynamic computations as well as microstructure information from heat treated specimens. It is noteworthy to see that for x = 0.6 and x = 0.7 but not for x = 0.8 the P3 peaks do not return to the baseline meaning that the P3 corresponds to the solidus temperature of these alloys.
Peak P4 in all the alloys is associated with bulk melting. The broad shape of peak P4 for x = 1.0 and x = 1.5 is attributed to the latent heat consumed when partition coefficients are greater than 1 as discussed by NIST (Boettinger et al., 2006).
Microstructure Analysis After Isothermal Annealing Experiments
This section mainly describes the microstructural features of AlxCoCrFeNi samples after annealing at 1300°C/6 h/WQ. Additional information is provided for two dual phase alloys after annealing at 900°C/24 h/WQ (Al0.8CoCrFeNi and Al0.7CoCrFeNi) mainly with respect to the phase fraction of σ. Furthermore, annealing at 1180°C and 1000°C for alloy Al0.8CoCrFeNi provided insight into the location of the binodal line which marks the transition from a compositionally modulated BCC (BCC-A2 + BCC-B2) to a compositionally homogeneous BCC-B2. Indeed, the location of the binodal line in composition and temperature space is one of the critical and most interesting aspects of the Al–(Co)–Cr–Fe–Ni HEA system. We will discuss this in due details in section “Conclusions.”
To our best knowledge only few experimental data are available in literature on phase equilibria at temperatures ranging from 1200°C to solidus. Indeed, the stability range of single BCC-B2 phase is at debate. Work from Munitz et al. (2016) show that the BCC-B2 is stable as single phase at 1200°C in alloy Al1.0CoCrFeNi. Recently, Aizenshtein et al. (2020) verified experimentally that single BCC-B2 phase is stable at 1300°C in alloy Al2.75CoCrFeNi while it coexists with BCC-A2 at 1200°C. The research reported in Abuzaid and Sehitoglu (2018) shows that Al0.6CoCrFeNi alloy is dual phase BCC-A2 + BCC-B2 at 1300°C as retained after WQ. However, information is lacking with respect to BCC-B2 phase stability at high temperatures and as function of the Al content. In our annealing series at 1300°C we aimed at screening a wider composition range with a small increment of the Al content e.g., AlxCoCrFeNi alloys (x = 0.6, 0.7, 0.8, 0.9, and 1.0). The main results are displayed in Figure 2 showing SEM microstructures at 1000x and 5000x magnification along with phase maps acquired by EBSD.
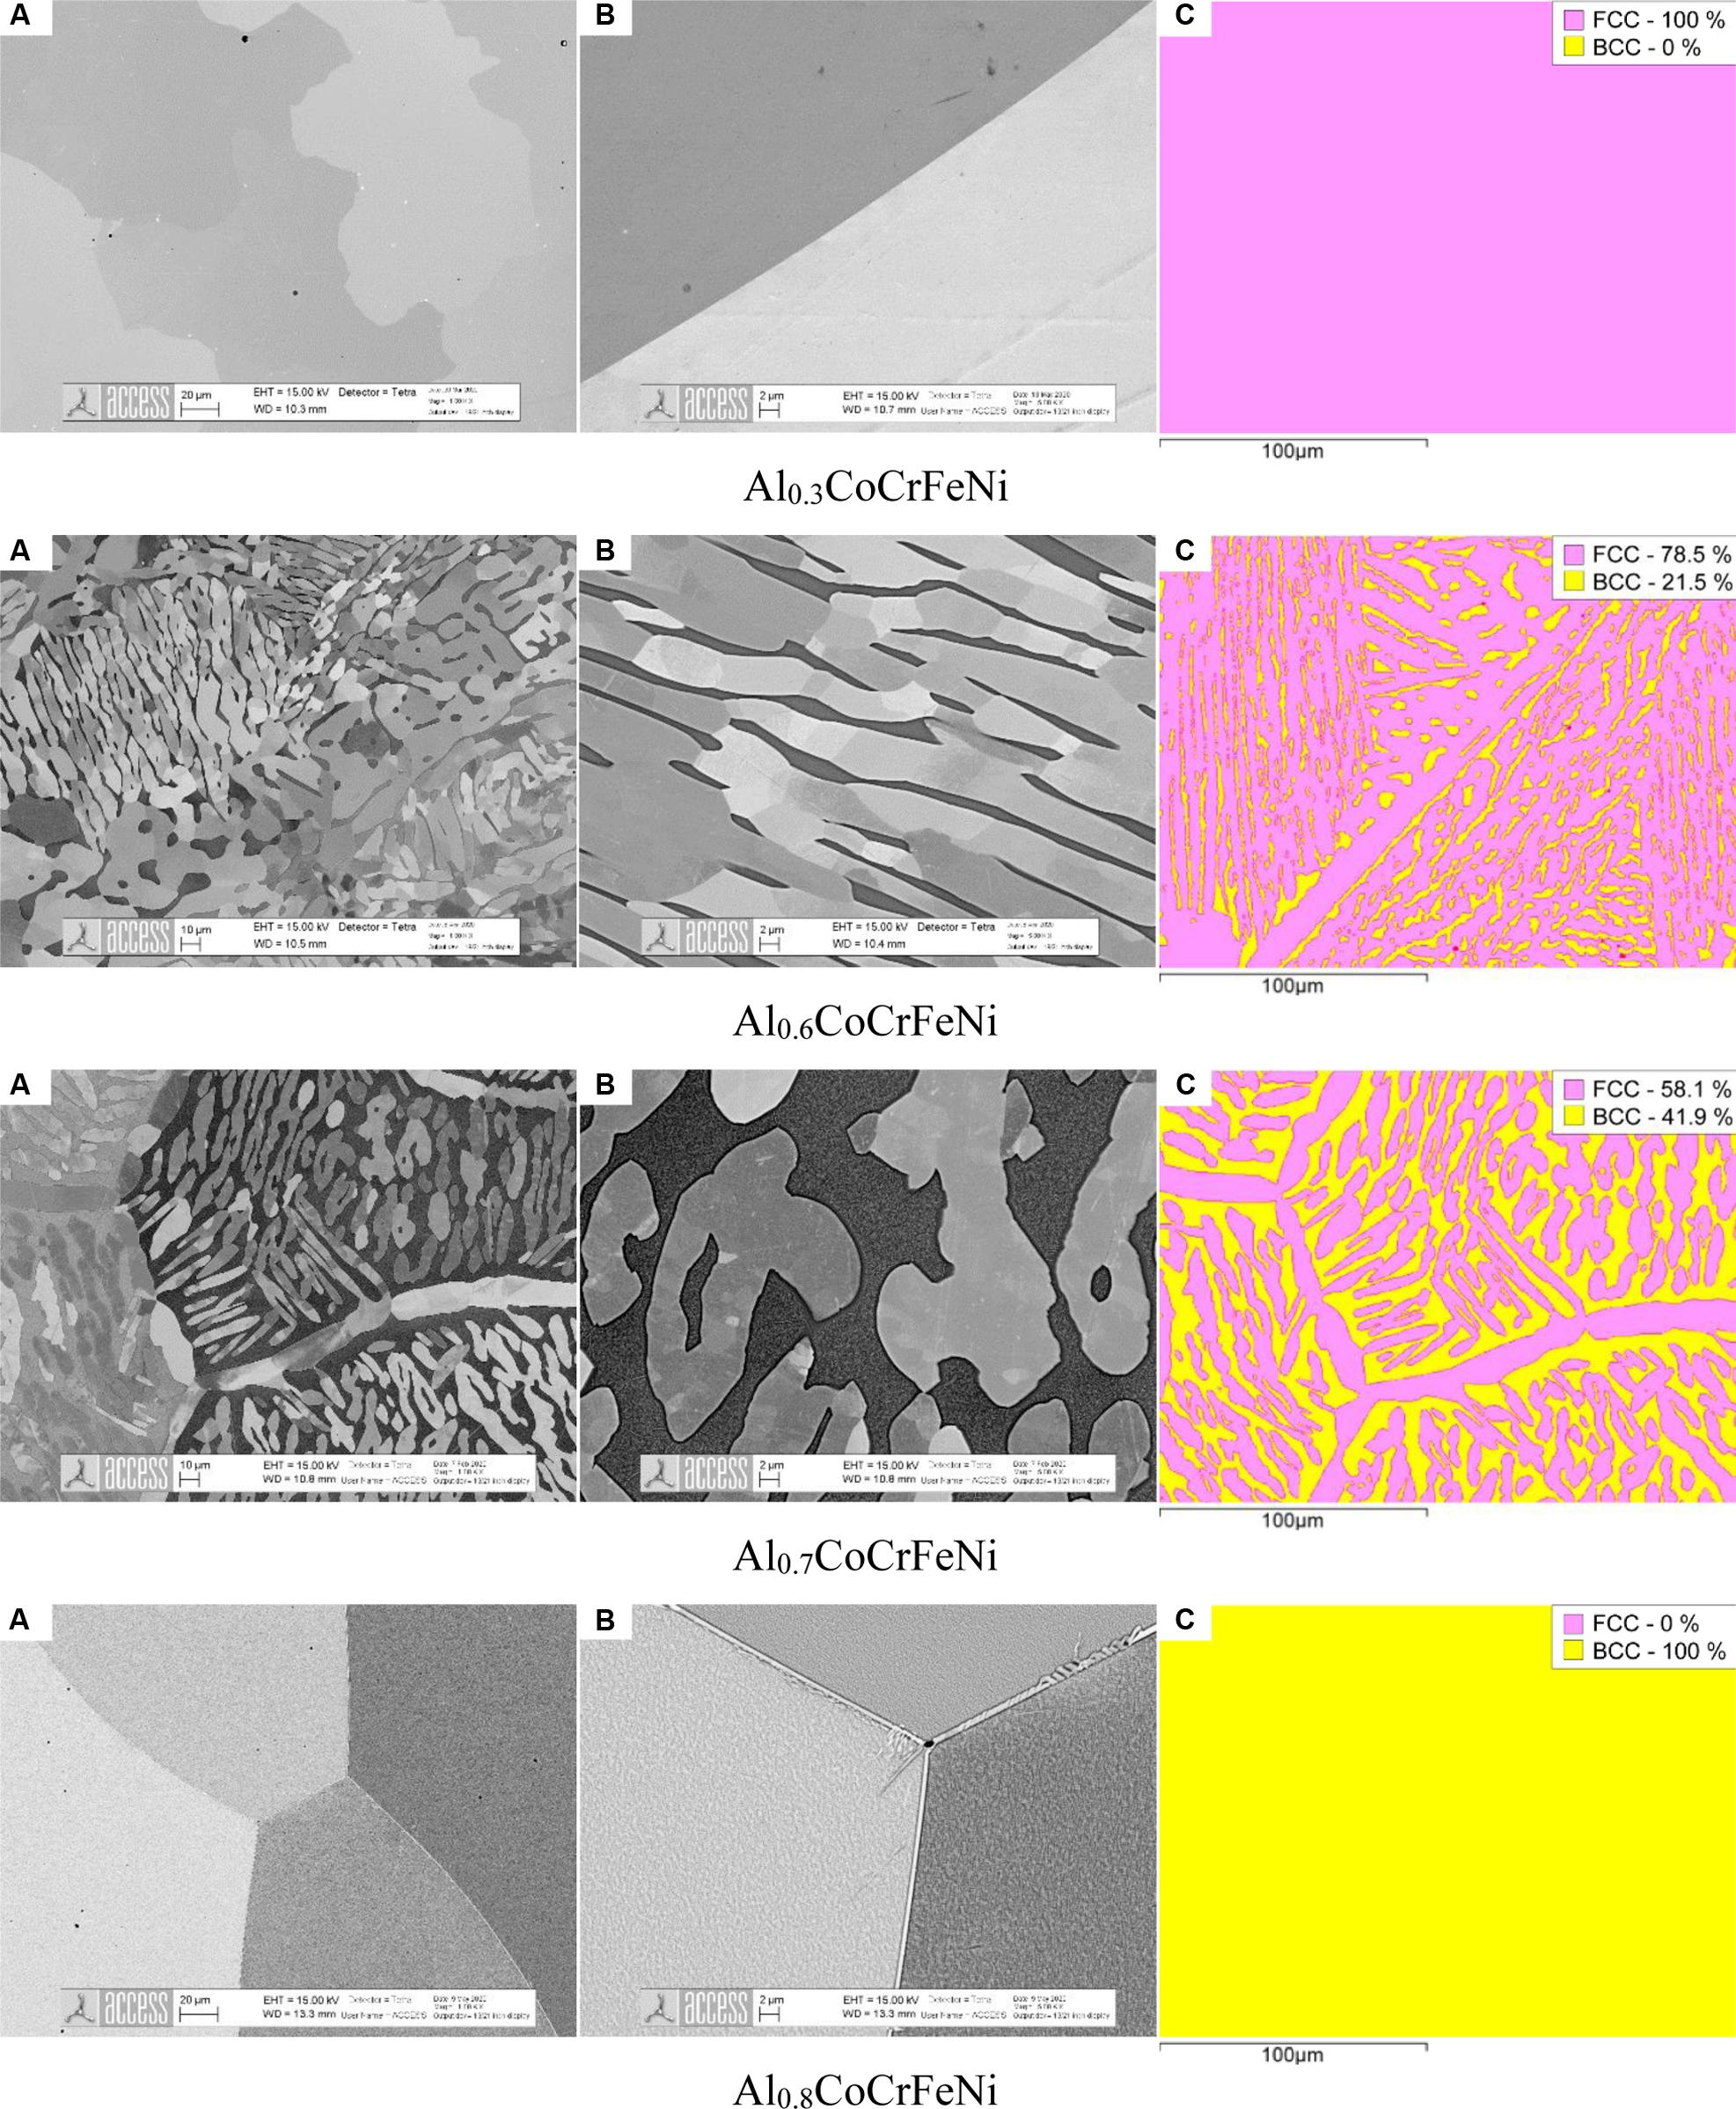
Figure 2. Microstructures (A) of AlxCoCrFeNi samples (x = 0.3, 0.6, 0.7, 0.8) after annealing at 1300°C for 6 h followed by water quenching. (B) is a magnified area of interest from (A). The EBSD phase maps show the measured phase fractions in (C). Note that the BCC-B2 phase (dark) in Al0.7CoCrFeNi is spinodally decomposed into BCC-A2 + BCC-B2. The spinodal wavelength suggests that decomposition occurred during the water quenching process.
Alloy Al0.3CoCrFeNi shows a single-phase FCC-A1 microstructure. Grain boundaries are not decorated by BCC-B2 precipitates.
Alloys Al0.6CoCrFeNi and Al0.7CoCrFeNi are dual phase composed of FCC-A1 Widmanstätten laths inside the BCC-B2 parent grains. Grain boundaries in both alloys are decorated by FCC-A1 films. However, in Al0.6CoCrFeNi but not in Al0.7CoCrFeNi we also observe FCC dendrites close to grain boundary regions. The two samples are very different with respect to the phase fraction of BCC-B2 being 21.5% in Al0.6CoCrFeNi and 42% in Al0.7CoCrFeNi. In both alloys the BCC-B2 phase is clearly decomposed into nanoscale constituent phases as a consequence of the spinodal decomposition upon quenching. Decomposition of BCC-B2 during quenching has already been reported by Munitz et al. (2016) in alloy Al1.0CoCrFeNi to lead to an extremely fine spinodal decomposition wavelength.
Alloy Al0.8CoCrFeNi displays a single-phase BCC-B2 structure at 1300°C. As before, upon quenching a spinodal structure with extremely fine wavelength formed. Some grain boundaries are decorated by thin FCC-A1 films and it is unclear whether these films formed during annealing or upon quenching. Irrespective of this detail we conclude that for x = 0.8 the sample is in nearly 100% BCC-B2 state at 1300°C. Very similar microstructures were obtained in alloys x = 0.9 and x = 1.0. Hence, alloy Al0.8CoCrFeNi almost exactly corresponds to the boundary between BCC-B2 + FCC-A1 and single BCC-B2 at 1300°C.
Figures 3A,B show SEM microstructures of the Al0.8CoCrFeNi alloy annealed at 1000°C/24 h and 1180°C/30 min followed by water quenching, respectively. Both microstructures consist of three phases i.e., FCC-A1 + BCC-A2 + BCC-B2 with vermicular morphology of FCC-A1 phase. The EBSD analysis of the samples confirmed that σ-phase did not form at these temperatures. The microstructure of the samples differs in an important detail: the spinodal structure (BCC-A2 + BCC-B2) is severely coarsened after annealing at 1000°C. On the contrary, in the sample annealed at 1180°C the spinodal structure (BCC-A2 + BCC-B2) is ultrafine which indicates that it has formed upon quenching. This means that the alloy Al0.8CoCrFeNi is above the binodal line at T = 1180°C but below the binodal line at T = 1000°C.
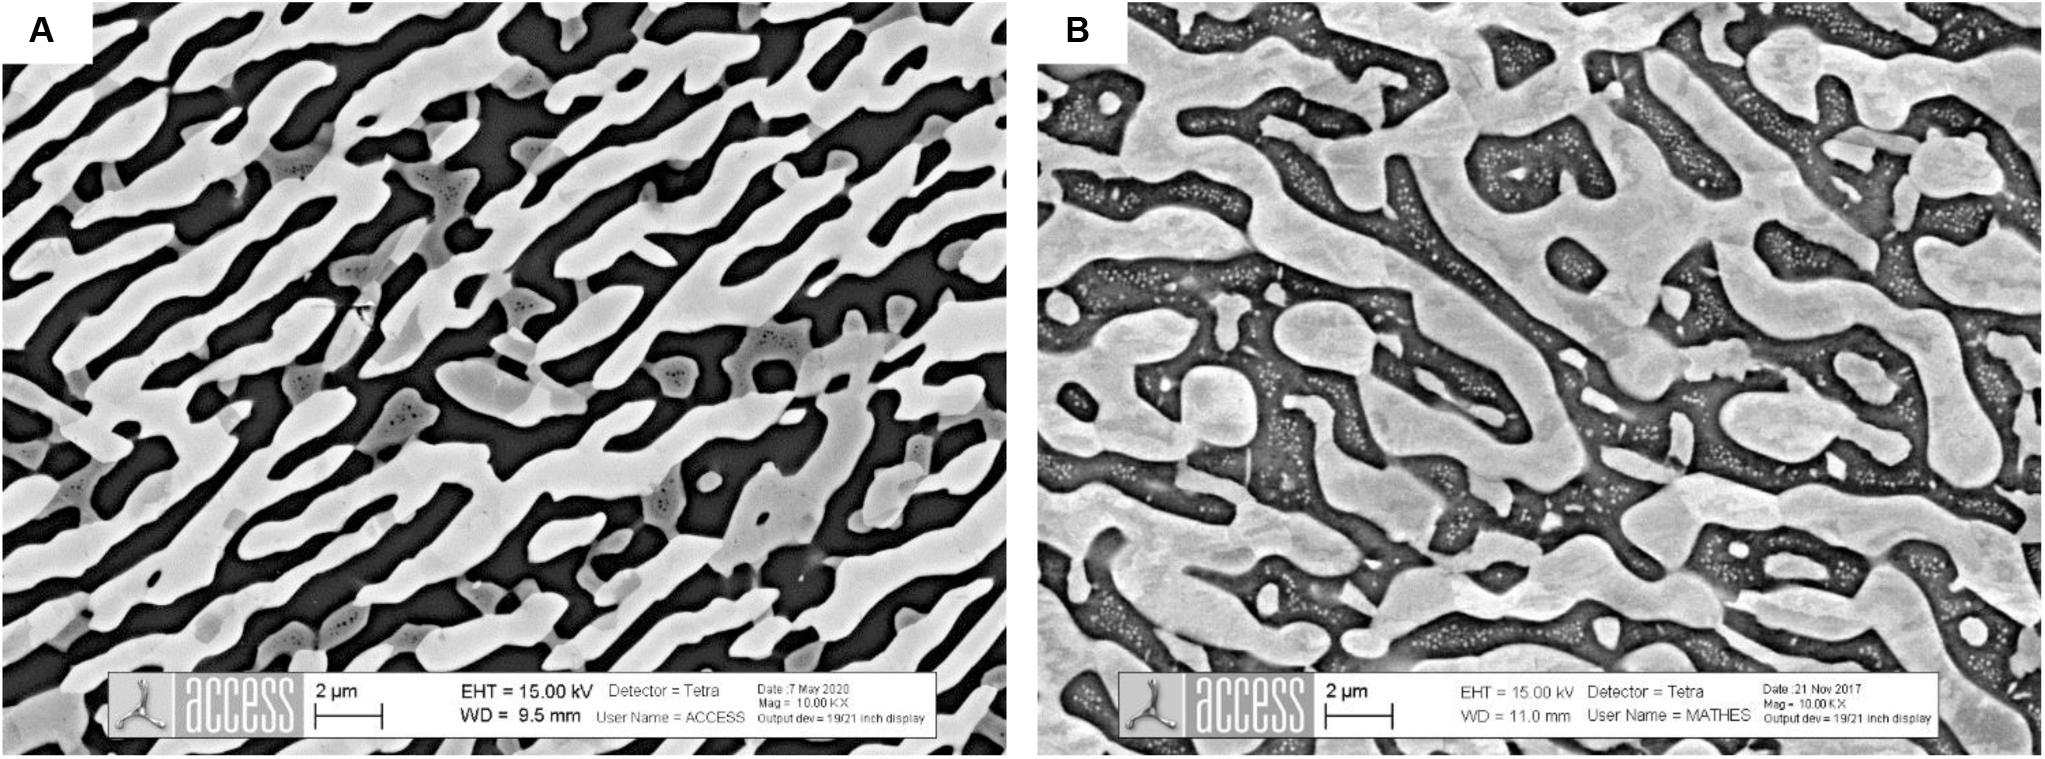
Figure 3. Microstructure of Al0.8CoCrFeNi after annealing at 1000°C/24 h (A) followed by water quenching. In (A) the microstructure shows three phases: black phase – BCC-B2, dark gray – BCC-A2 and light gray – FCC-A1. The two phases BCC-A2 and BCC-B2 coarsen significantly such that initial spinodal structure cannot be distinguished. In (B) the microstructure of Al0.8CoCrFeNi after annealing at 1180°C/30 min is composed of two phases, while the third phase BCC-A2 with nano-size spherical shape formed by spinodal decomposition upon quenching.
Further annealing experiments were performed at 900°C/24 h/WQ to verify the composition and phase fraction of σ-phase in alloys Al0.7CoCrFeNi and Al0.8CoCrFeNi. For these alloy compositions we expected the maximum of the “σ-bell.” We present SEM microstructures along with EBSD maps in Figures 4, 5. Both samples display a three-phase microstructure consisting of FCC-A1, BCC-B2 and σ phases. The σ-phase fraction ranges around 7 area% in Al0.7CoCrFeNi and around 20 area % in Al0.8CoCrFeNi. Without showing experimental data, we note that the σ-phase fraction in alloy Al0.7CoCrFeNi annealed at 1000°C is ≤1 area%. Its fraction may further increase after longer annealing time. Therefore, the data were not used for database optimization. Instead, only the chemical composition of the σ-phase was used as an input for CALPHAD modeling.
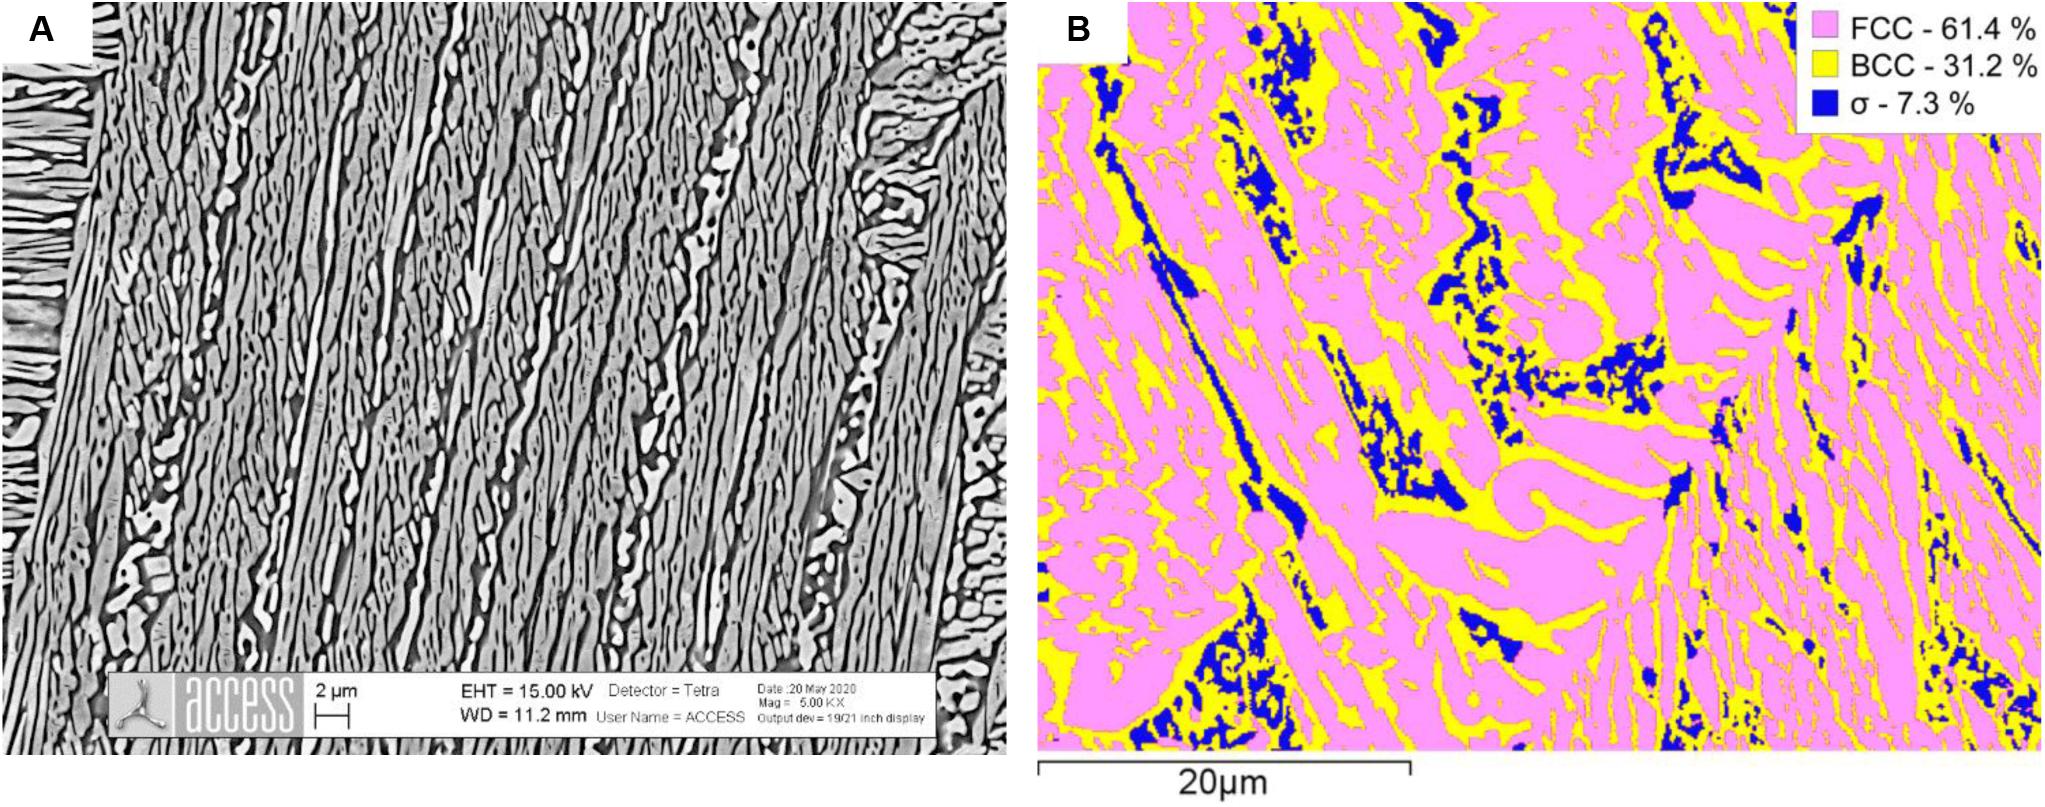
Figure 4. SEM image of the microstructure of Al0.7CoCrFeNi after annealing at 900°C/24 h followed by water quenching (A) and EBSD phase map with phase fractions (B) given in the legend.
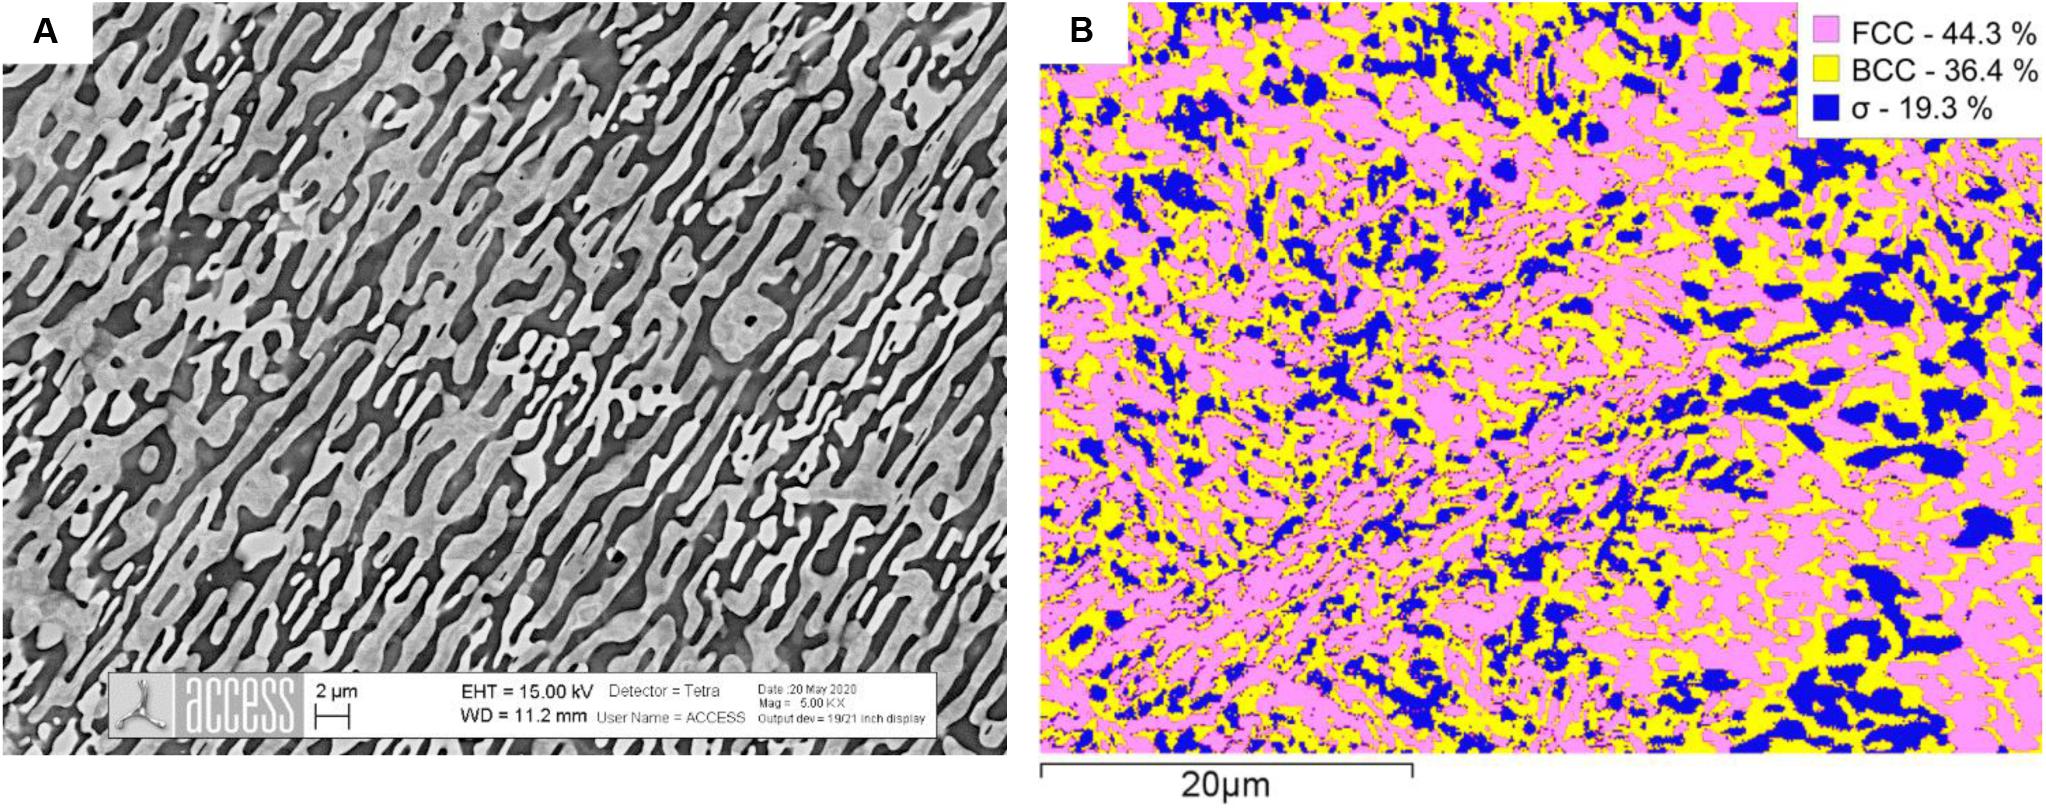
Figure 5. SEM image of the microstructure of Al0.8CoCrFeNi after annealing at 900°C/24 h followed by water quenching (A) and EBSD phase map with phase fractions (B) given in the legend.
CALPHAD Database Optimization and Computed Phase Equilibria
The CALPHAD-based thermodynamic description of the quaternary and quinary Al–(Co)–Cr–Fe–Ni alloy systems was optimized based on the key experiments conducted within the scope of the present study as well as experimental data presented in literature. The PARROT module embedded in the Thermo-Calc software was used to optimize the Gibbs energy functions of individual phases in the HEA system. Sub-lattice models were selected as follows: for BCC and FCC ordered and disordered phases we used three sub-lattice models with the third sub-lattice being occupied by vacancies only; for the σ-phase we used a three sub-lattice model with the following sub-lattice occupation – (Al, Co%, Fe%, Ni)8:(Al, Co%, Cr%, Fe%, Ni)18:(Cr)4.
The available thermodynamic descriptions of the binary, ternary as well as quaternary Al–Co–Cr–Ni (Gheno et al., 2015) sub-systems were included for the extrapolation to the quinary system. Ternary and quaternary systems with incomplete thermodynamic description or descriptions with incompatible sub-lattice models were re-modeled and optimized. In total, the extrapolation toward quinary Al–Co–Cr–Fe–Ni system requires the reliable thermodynamic description of 10 binary, 10 ternary, and 5 quaternary sub-systems. The description of the ternary sub-system Al–Fe–Ni from Zhang et al. (2009) had to be modified with the respect to phase equilibria between liquid and BCC-B2, BCC-A2, FCC-A1, and FCC-L12. The quaternary system Al–Fe–Cr–Ni was fully reoptimized and will be presented elsewhere in due details. In the course of the optimization we introduced quaternary and even quinary interaction parameters for the phases with a broad homogeneity range i.e., liquid and BCC-A2, BCC-B2, FCC-A1, FCC-L12 and σ-phase.
Phase equilibria computed with the new thermodynamic database are displayed in Figure 6. Shown are selected sections through the quaternary and quinary composition space, featuring the dependency of phase equilibria on the aluminium content for AlxCrFe2Ni2 and AlxCoCrFeNi alloys. For comparison, the same section planes were calculated with the database TCHEA4. For convenience in all diagrams the boundary of phase regions containing BCC-A2 in various equilibria is represented as bold black line. We highlighted this boundary because in wide parts it corresponds to the binodal line leading to spinodal decomposition of BCC-B2 into Fe, Cr-rich and Al, Ni-rich phases. Note that the Fe, Cr-rich phase (BCC-A2) is disordered. Interestingly in the quinary system the binodal line coincides with the order-disorder transition while in the quaternary system the order-disorder transition can be distinguished, being represented by dotted line.
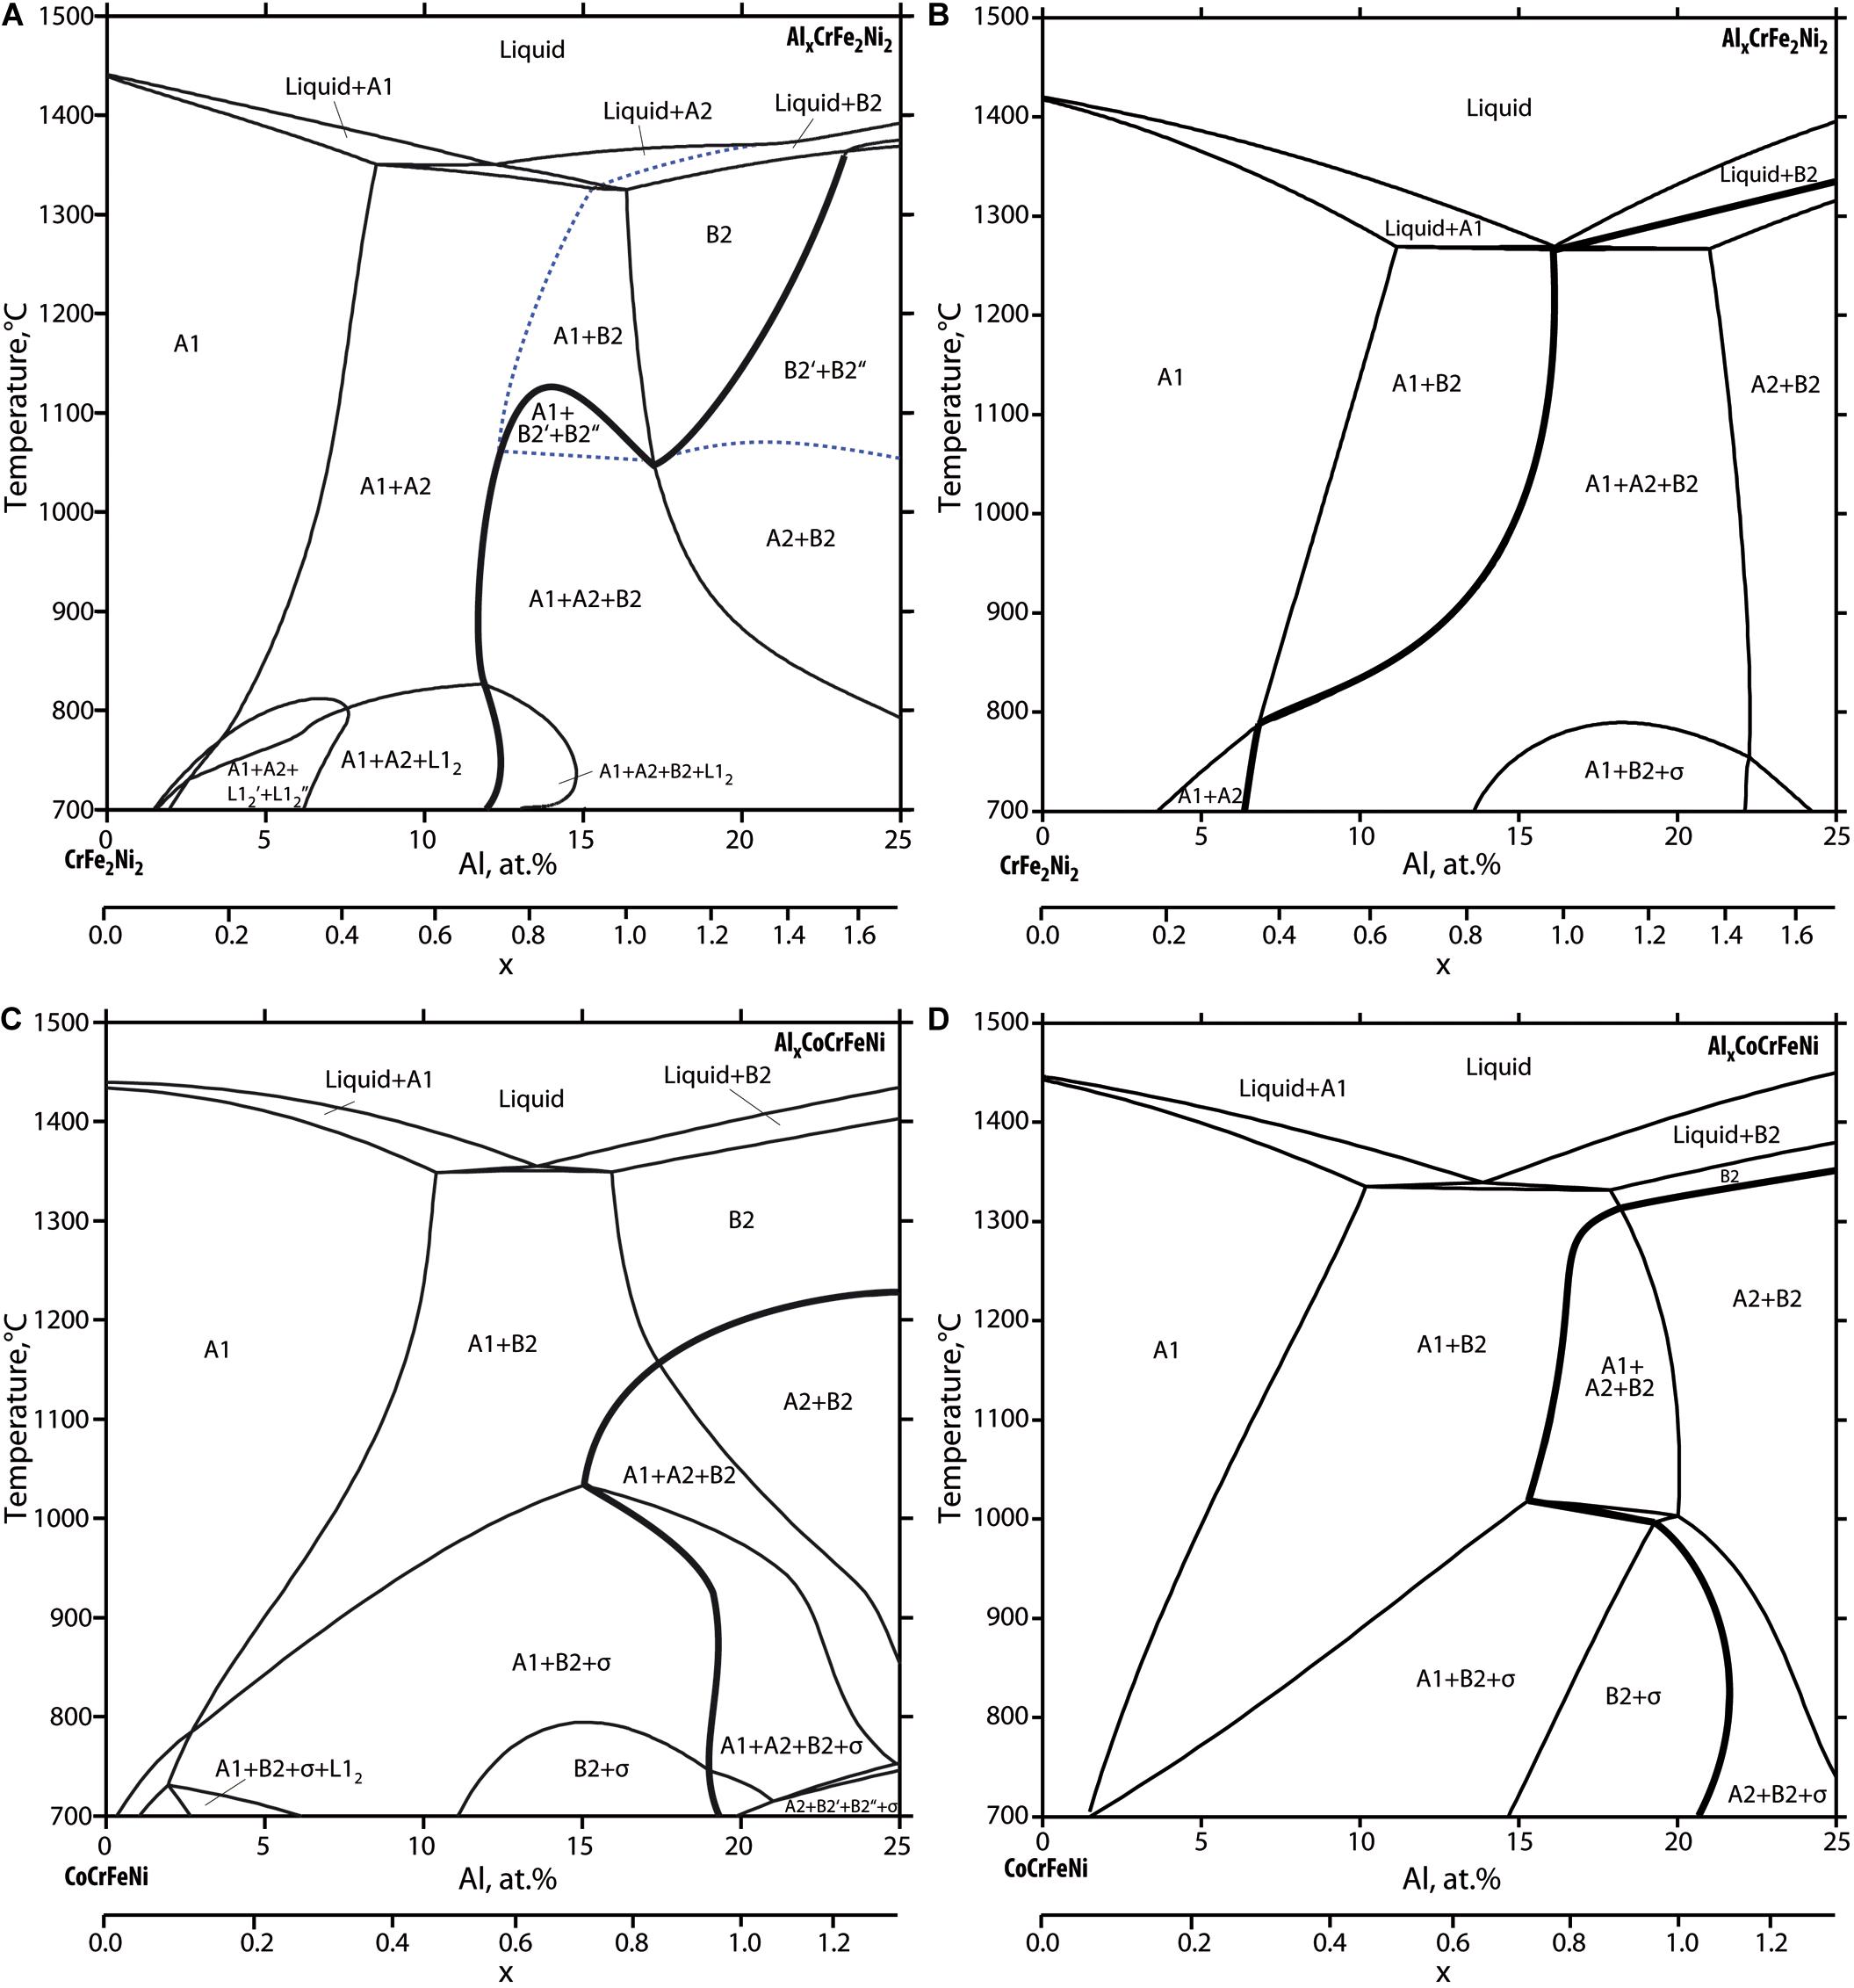
Figure 6. Quaternary AlxCrFe2Ni2 and quinary AlxCoCrFeNi section planes computed with the new thermodynamic description (A,C) and compared to TCHEA4 (B,D). The binodal line is highlighted (bold line). BCC-A2/BCC-B2 order-disorder boundary is plotted with dashed line. Except for liquid and σ-phase, the phases are labeled following Strukturbericht designation.
In the following we describe the main differences between the newly developed database and TCHEA4:
1. in the quinary sections (see Figures 6A,B), the BCC-B2 phase is more stable, opening a large BCC-B2 single phase region down to temperatures of around 1100°C. Also, the phase boundary BCC-B2/FCC-A1 is shifted to lower Al content at high temperatures. As a consequence, the three-phase field FCC-A1 + BCC-A2 + BCC-B2 appears only at temperatures below 1100°C. This is a key feature to explain the experimental observations described in section “Microstructure analysis after isothermal annealing experiments” relating to phase equilibria and microstructural features in alloy Al0.8CoCrFeNi annealed at 1300°C and at 1180°C respectively (see Figures 2, 3B).
2. the comparison of the quinary sections further reveals that according to TCHEA4 there is an extended two-phase field “BCC-B2 + σ” which encompasses alloys between 15 and 20 at.% Al reaching up to 1000°C. In the new thermodynamic description this two-field is stable only in the temperature range from 600 to 800°C. Instead, the three-phase field FCC-A1 + BCC-B2 + σ and the four-phase field FCC-A1 + BCC-A2 + BCC-B2 + σ are more extended. This is in agreement with experimental observations obtained by annealing experiments at 900°C for alloys Al0.7CoCrFeNi and Al0.8CoCrFeNi (see Figures 4, 5).
3. in the quaternary section AlxCrFe2Ni2 (see Figures 6C,D) the new thermodynamic description shows the similar extended stability of single-phase BCC-B2 as discussed in (1). This is essential to describe the experimentally observed Widmanstätten and vermicular dual phase microstructures as described in Hecht et al. (unpublished) “The BCC-FCC phase transformation pathways and crystal orientation relationships in dual phase materials from Al–(Co)–Cr–Fe–Ni alloys,” submitted for publication in the same topic edition. Furthermore, the liquidus surface differs considerably including melting temperatures. BCC-A2 appears in equilibrium with liquid for small range of alloy compositions followed by a distinct order-disorder transition which does not coincide with the binodal line. Consequently, the FCC-A1 + BCC-B2 phase field predicted by TCHEA4 is confined to a narrow composition range while FCC-A1 + BCC-A2 field is extend up to solidus temperatures. Further differences relate to the stability range of FCC-L12 and σ-phase which need further validations.
Figure 7A picks up the quinary section plane AlxCoCrFeNi in more detail down to lower temperatures including experimental data points form DSC/DTA analysis which originate from own experiments [see section “Phase transformation temperatures from differential thermal analysis (DTA)”] and from literature as shown in the legend. Most literature data and own measurements related to solidus temperatures for liquid + BCC-B2 equilibria are lower than computed values. This needs further attention either with respect to modeling or to experimental conditions. We performed segregation measurements (see Figure 8) to provide more insight into the melting interval but further DTA experiments are needed, especially for homogenized samples which do not show segregation inherited from solidification.
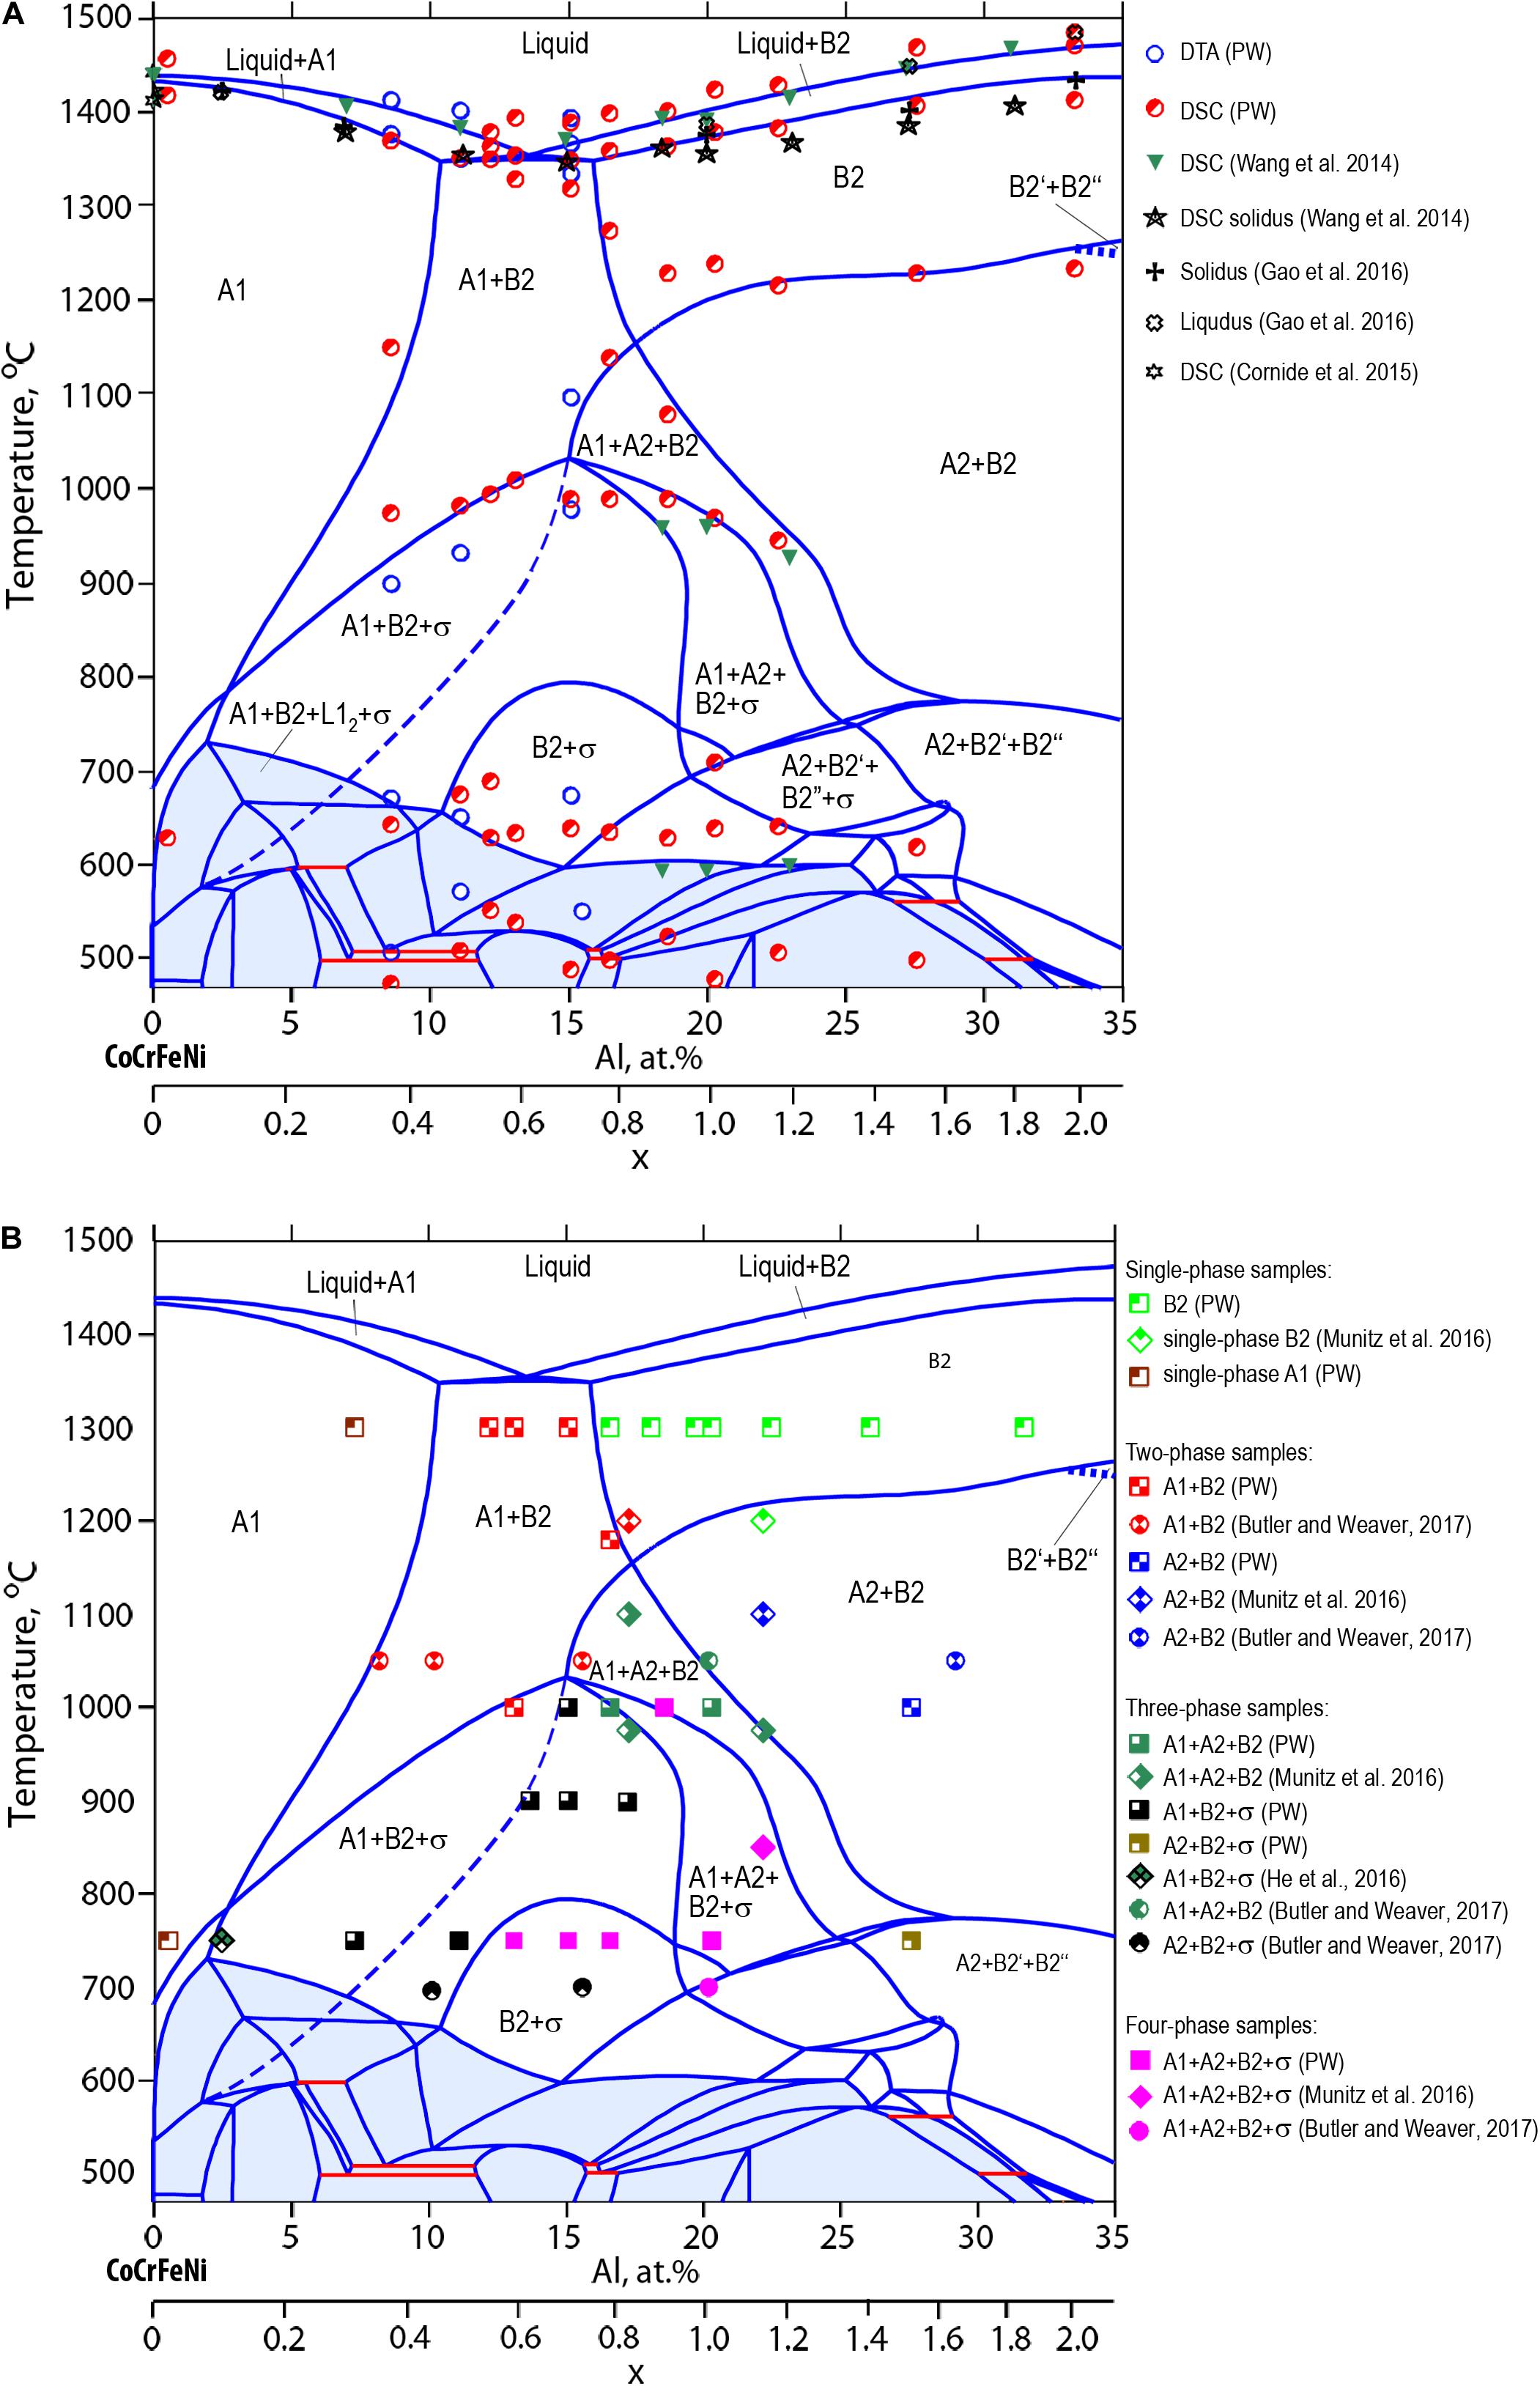
Figure 7. Quinary section plane for AlxCoCrFeNi alloys superimposed with DSC/DTA data points (A) and the equilibrium phases identified after annealing at 750, 1000, and 1300°C (B). Our experimental results (PW) as well as results from the literature are included in the legend.
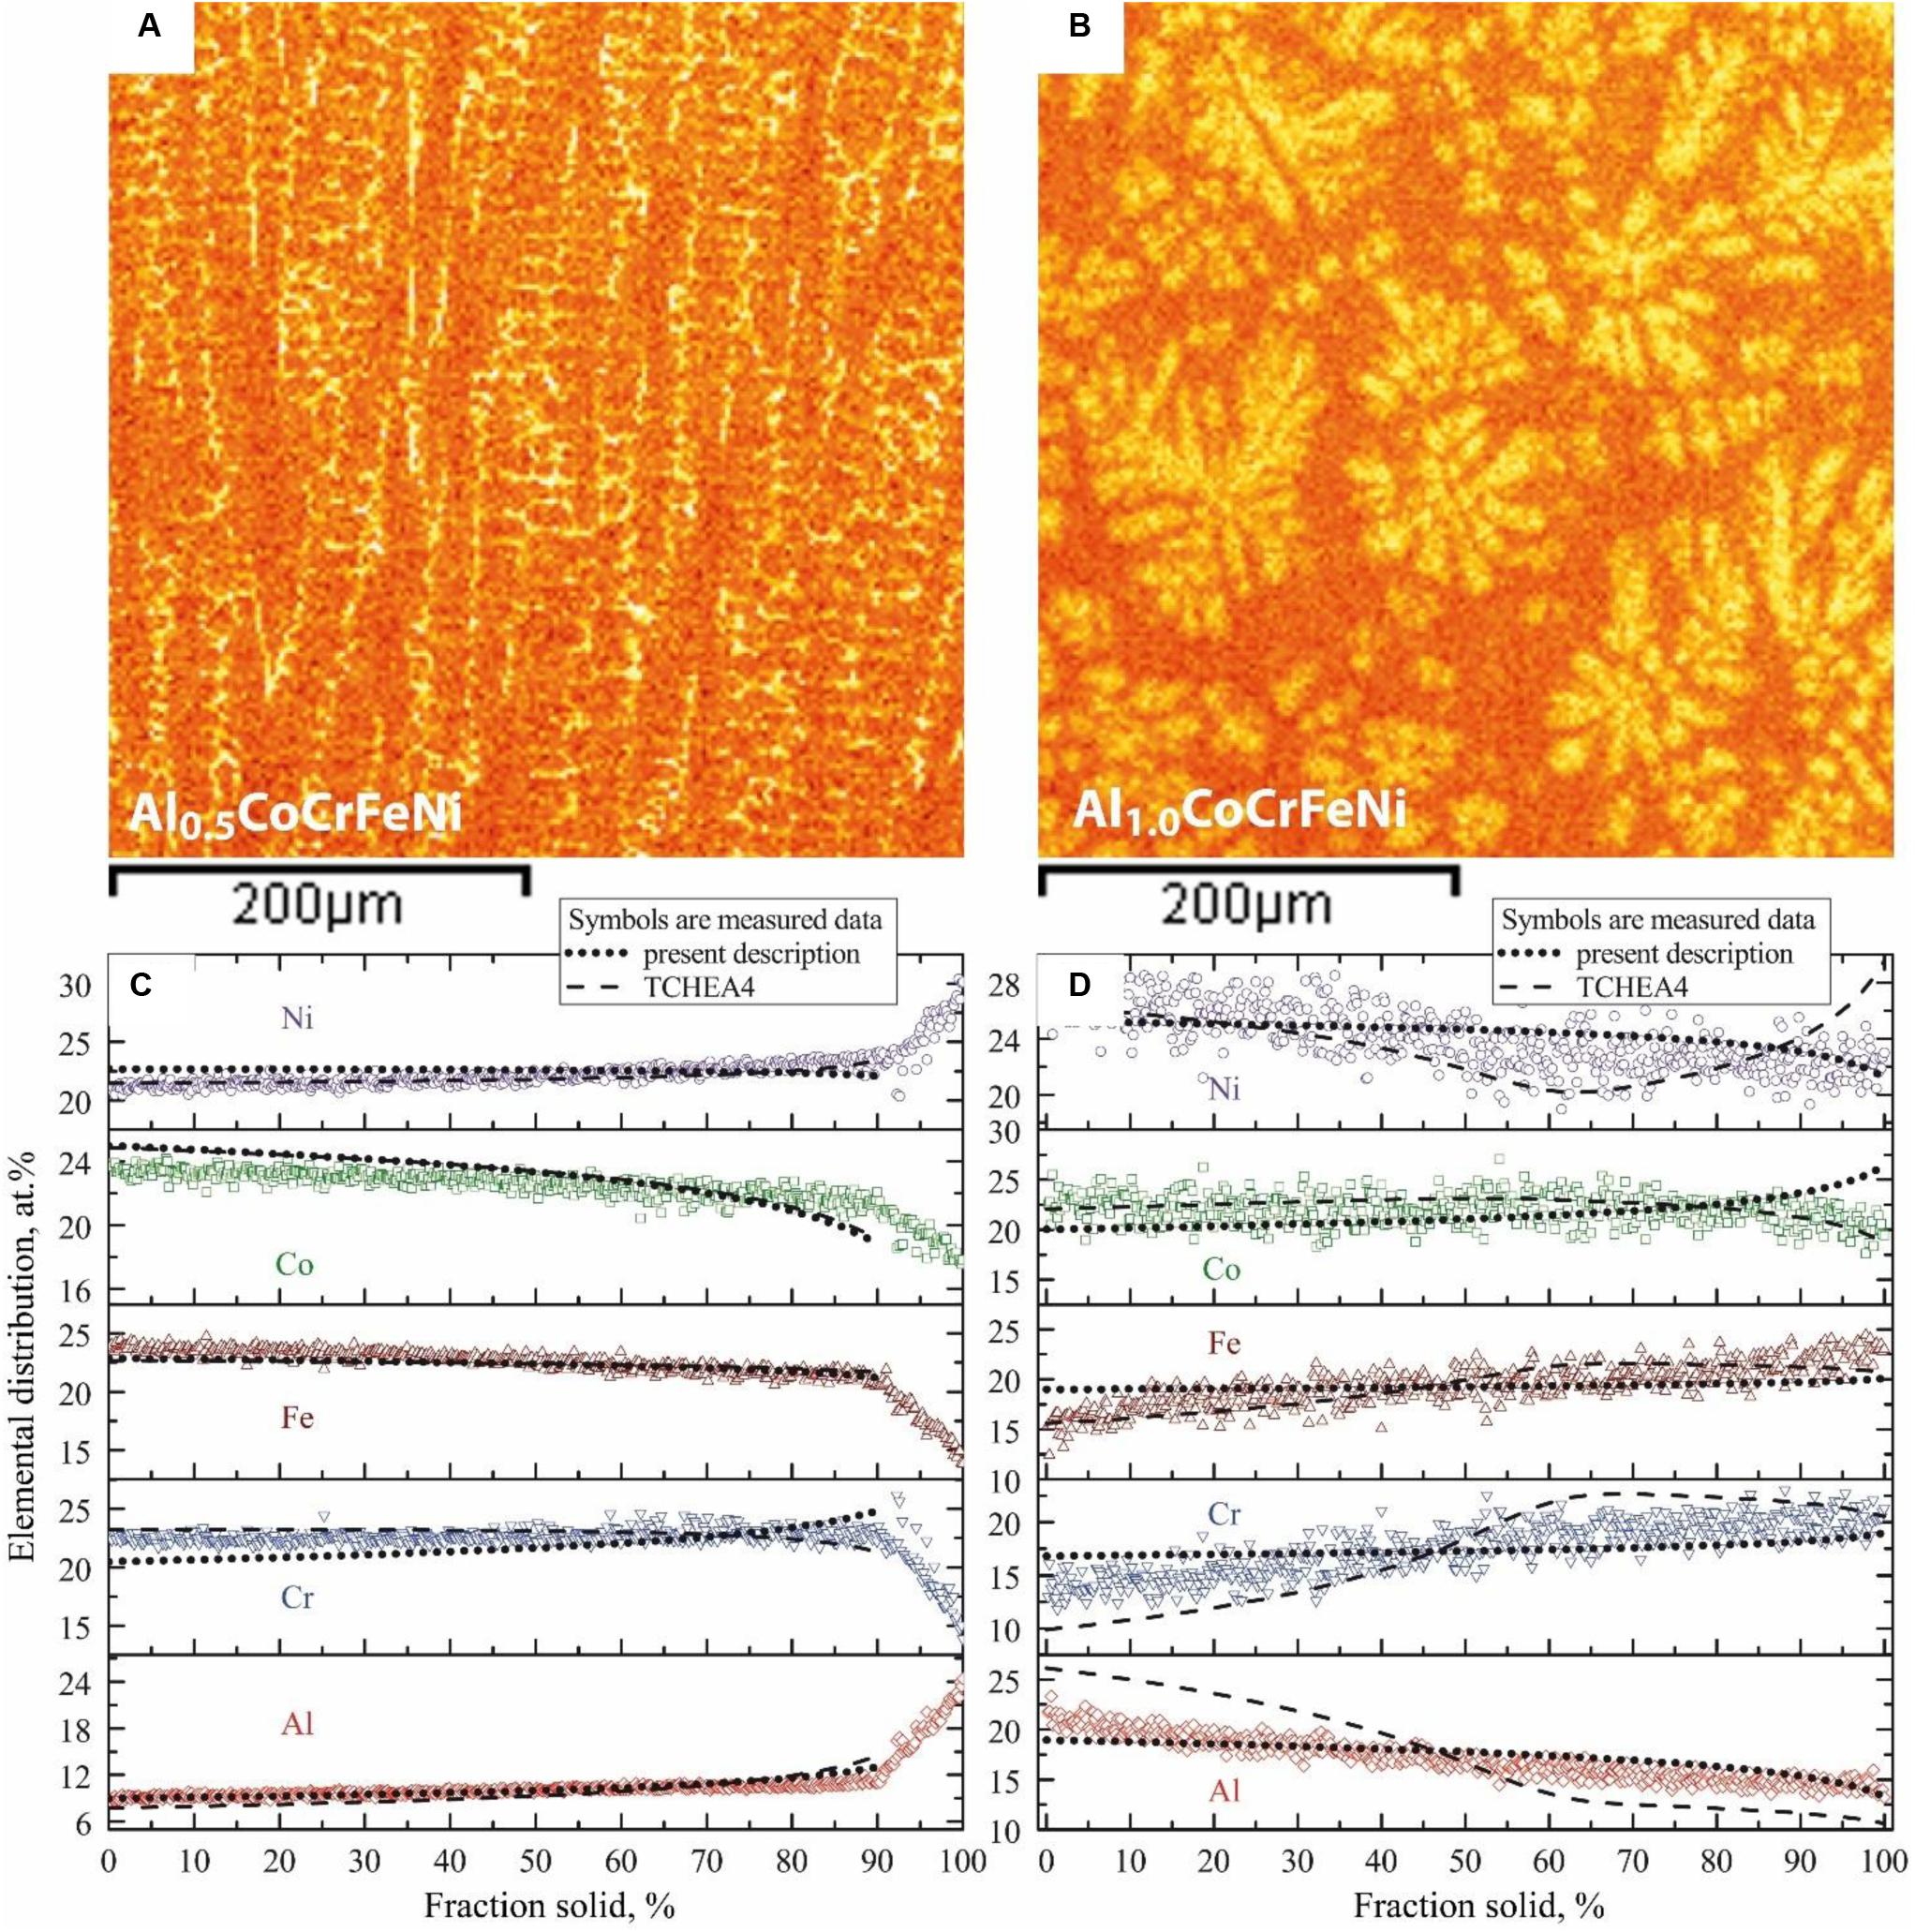
Figure 8. EDS elemental distribution as well as micro-segregation profiles from EDS grid measurements and weighted interval rank sorting (WIRS) in alloys Al0.5CoCrFeNi (A,C) and Al1.0CoCrFeNi (B,D). The measurements are compared to computations using Scheil simulation of solidification. Simulation results with present description are represented by dotted line, while TCHEA4 results are represented by dashed line.
In Figure 7B the quinary section plane AlxCoCrFeNi is re-plotted and contains experimental data points which represent the equilibrium phases obtained from a series of isothermal annealing experiments. The experimental results from Munitz et al. (2016), Butler and Weaver (2017), and He et al. (2017) are included. The symbols superimposed on the section plane are selected such that the degree of filling corresponds to the number of experimentally identified phase irrespective of the symbol’s shape. For examples, a square symbol filled in a quarter area represents a single-phase microstructure, while full symbols are four phased microstructures. The shaded area below 700°C represents the region in which the FCC-L12 phase participates in all phase equilibria. The stability limit of all the FCC-L12 phase fields agrees well with the experimental results of isothermal annealing presented in Gwalani et al. (2016, 2017) and Jones et al. (2016). Due to significantly slower rates of phase transformation and equilibration of the microstructure at low temperatures, the phase fields encapsulated by the shaded area were not experimentally verified in the present work.
Figure 7B allows drawing the following conclusions:
The samples with Al concentration between 10 at.% and 20 at.% annealed at 750°C/48 h show four-phase microstructures i.e., FCC-A1 + BCC-A2 + BCC-B2 + σ. However, the quinary section plane shows that at 750°C these alloy compositions are located in either two- or three phase fields in which BCC-A2 and/or FCC-A1 phases are not present. The difference between the annealed samples and the predictions of the new database is related to non-equilibrium state of the microstructure. Indeed, under conditions when the annealing times are not sufficient to achieve full equilibrium, the BCC-A2 and/or FCC-A1 phases do not transform fully into σ-phase. This is attributed to the slow kinetics of σ-phase formation, possibly also affected by slower diffusion in HEA alloys. As a result, the position of the BCC-A2 phase boundary as well as stability range of σ-phase below 1000°C becomes dependent on the annealing time. A dashed line in the quinary section plane shows the shift of the BCC-A2 phase boundary when σ-phase is suspended. This indicates that experimental microstructures did not reach full equilibrium. This is in agreement with results reported by Butler and Weaver (2017) on isothermal annealing of the Al0.7CoCrFeNi alloy at 700°C for a duration of 1000 h. They report three phase microstructures FCC-A1 + BCC-B2 + σ meaning that the samples are closer to equilibrium compared to our samples. Nonetheless, the two-phase BCC-B2 + σ field is not reached.
At the annealing temperature of 900°C, the microstructure of the Al0.7CoCrFeNi and Al0.8CoCrFeNi consists of three phases i.e., FCC-A1 + BCC-B2 + σ, in agreement with the computed section plane. At this temperature the BCC-A2 fully transformed into σ-phase.
From all the compositions annealed at 1000°C, a small fraction of σ-phase (0.8 area%) was detected only in Al0.7CoCrFeNi alloy. As a result, the highest point of the “σ-bell” in terms of temperature was modeled at this alloy composition. Such position of σ boundary agrees with experimental results presented in Munitz et al. (2016) where AlCoCrFeNi was annealed at 975, 1100, and 1200°C. The authors considered dendritic (DC) and inter-dendritic (ID) regions as two separate alloy compositions. Additionally, the results of Butler and Weaver (2017) were included for Al0.7CoCrFeNi annealed at 1050°C/520 h. The reported microstructure is at the border of the computed three-phase field i.e., FCC-A1 + BCC-A2 + BCC-B2 and the neighboring two-phase field FCC-A1 + BCC-B2. Very likely it is in the two-phase field because the authors discussed in detail the formation of BCC-A2 nano-precipitates within the BCC-B2 matrix. Likely the precipitates formed upon spinodal decomposition during quenching, otherwise they should be coarse given the annealing temperature and time. Similar quenching effects were observed in Al0.8CoCrFeNi annealed at 1180°C as was discussed in section “Microstructure analysis after isothermal annealing experiments.”
Data from annealing at 1300°C/6 h clearly show the limits of the FCC-A1 + BCC-B2 phase field. Starting from Al0.8CoCrFeNi and up to Al2.0CoCrFeNi the microstructure is single-phase BCC-B2.
As mentioned before, we questioned the width of the solidification interval related to liquid + BCC-B2 equilibria. In the proposed thermodynamic description this interval is narrow and should lead to less severe micro-segregation compared to a wide interval. To address this issue in the Al–Co–Cr–Fe–Ni system we used grid statistical EDS analysis of micro-segregation in as-cast samples together with the weighted interval rank sorting (WIRS) procedure described by Ganesan et al. (2005) for multicomponent systems. For the analysis two alloy compositions were selected, i.e., Al0.5CoCrFeNi and Al1.0CoCrFeNi and the samples were produced by arc melting. These alloys solidified with primary FCC-A1 or BCC-B2 phase, respectively. EDS measurements were performed on as-cast specimens using equidistant grids with a spacing of 20 μm. A total of 540 grid points was acquired. The compositional differences measured in the grid allow estimating the segregation amplitude, while the WIRS ranking procedure allows plotting the element distribution as a function of the primary phase fraction in the course of solidification. The ranked element distribution plots can be compared to composition profiles from Scheil simulation of solidification. Both databases were used for this comparison.
Figures 8A,B show EDS elemental maps (only Al) in the region of interest where the EDS grid were placed. They qualitatively show that Al partitions to the last solid, i.e., inter-dendritic regions, in alloy Al0.5CoCrFeNi while the opposite is true for alloy Al1.0CoCrFeNi. The experimental segregation profiles evaluated for each element by grid EDS are plotted in Figures 8C,D. Segregation profiles from Scheil simulations are superimposed as dashed and dotted lines. The simulation was done with all phases suspended except liquid and primary phases, i.e., FCC-A1 or BCC-B2. This constraint was applied both to the new thermodynamic description and to TCHEA4. Furthermore, for Al0.5CoCrFeNi alloy the Scheil calculations were terminated at fraction solid of 0.9. Such limitation is based on the experimental segregation profiles showing that at this fraction solid the secondary phase, i.e., BCC-B2, emerged along the solidification path. Hence, the slope of the profiles in Al0.5CoCrFeNi alloy becomes rapidly steeper due to different solubility of the elements in FCC-A1 and BCC-B2. Since alloy Al1.0CoCrFeNi solidified fully with BCC-B2, no constrain was applied.
Generally, the trends of the experimental segregation profiles for Al0.5CoCrFeNi alloy are reproduced well both by the proposed thermodynamic description and TCHEA4. Stronger discrepancies are observed for the Al1.0CoCrFeNi alloy. Specifically, the Scheil profiles for Cr and Al computed by TCHEA4 deviate strongly from the experimental data points especially at low fraction solid, i.e., starting with much higher Al content. This indicates that the width of the solidification interval is overestimated in TCHEA4. Furthermore, the Scheil profiles for Ni, Cr, and Al show unexpected behavior with changing slopes. Especially for Al and Cr, the amplitudes of the sinusoidal curve are high, extending beyond the measured segregation range.
Conclusion
In this work we presented phase equilibria in the Al–Co–Cr–Fe–Ni HEA system from annealing experiments and CALPHAD modeling of the quinary alloy system.
In the first part we described DTA/DSC measurements and microstructures obtained by isothermal annealing for a series of AlxCoCrFeNi samples with 0.3 < x < 1.5. Main attention was given to isothermal annealing at 1300°C/6 h, followed by water quenching. We showed that at 1300°C the microstructure of Al0.7CoCrFeNi alloy consists of two phases i.e., BCC-B2 and FCC-A1, while alloy Al0.8CoCrFeNi is already in the single BCC-B2 phase field. Further key insights were obtained from other annealing conditions as follows:
1. At 1180°C the alloy Al0.8CoCrFeNi consists of two phases FCC-A1 and BCC-B2 and does not contain BCC-A2. This phase is formed upon quenching only, meaning that the binodal temperature marking the co-existence of BCC-A2 and BCC-B2 in this alloy must be below 1180°C.
2. Isothermal annealing experiments at 1000 and 900°C allowed concluding about the extent of the σ-bell in the system. The σ-phase is not present above 1000°C.
In the second part we presented computational results from an own thermodynamic database for the quinary Al–Co–Cr–Fe–Ni alloy system developed by the CALPHAD approach on the basis of the experimental results and data from literature. We compared quaternary and quinary section planes i.e., AlxCrFe2Ni2 and AlxCoCrFeNi to computations performed with the TCHEA4 database from Thermo-Calc AB. The computations differ substantially in terms of phase fields and boundaries of the phase fields. The main findings are listed below:
1. According to our new thermodynamic description a rather wide single-phase field BCC-B2 is present in both section planes, giving rise to dual-phase microstructures along solid state phase transformation pathways. The BCC-B2 phase undergoes spinodal decomposition when cooled below the binodal line. The binodal line intersects other phase field boundaries, and as a consequence more complex solid-state transformations are expected and have been observed for appropriate alloy compositions. Further points of interest are the extent of phase fields which contain the σ-phase. The σ-phase reaches a maximum stability for the Al0.7CoCrFeNi alloy composition being stable up to 1000°C. According to our new description the two-phase field (BCC-B2 + σ) predicted with TCHEA4 in AlxCoCrFeNi is found only between 600 and 800°C and instead we see a four-phase field FCC-A1 + BCC-A2 + BCC-B2 + σ and a three phase field FCC-A1 + BCC-B2 + σ in the respective compositional range. Last but not least our database predicts the FCC-L12 phase to be stable below 700°C for a wide range of alloy compositions.
2. Equilibria with the liquid phase involve liquid + FCC-A1, liquid + BCC-B2 and in AlxCrFe2Ni2 also a narrow region where BCC-A2 is the primary phase. We attempted to estimate the micro-segregation inherited from solidification and compare it to element distribution profiles computed in Scheil approximation for the alloys Al0.5CoCrFeNi and Al1.0CoCrFeNi, respectively. We showed that both databases can reproduce the experimental segregation profiles for alloy Al0.5CoCrFeNi. Our own database performs better than TCHEA4 for the alloy Al1.0CoCrFeNi, suggesting that the equilibrium solidification interval of alloys with primary BCC-B2 is indeed narrow.
Future research on thermodynamic equilibria is requested in several directions, mainly to verify phase field boundaries in these and other section planes. In an upcoming publication we will present interesting section planes to guide experiment design. Further validations will have to include phase equilibria for specified alloys as function of temperature, including the phase fractions and phase compositions for temperatures of interest.
Data Availability Statement
The raw data supporting the conclusions of this article will be made available by the authors, without undue reservation.
Author Contributions
OS carried out the experimental work presented in the manuscript including production, isothermal annealing, SEM investigations, and EBSD analysis of the samples. VW developed and optimized the thermodynamic database for quinary Al–Co–Cr–Fe–Ni alloy system. UH performed the EDS measurements of the segregation profiles in the as-cast alloys, assisted with post-processing of the measured data, and actively participated and coordinated the discussion of the experimental results and development of the database. SG and DR provided the additional experimental results for optimization and verification of the quaternary Al–Cr–Fe–Ni section. All authors contributed to the article and approved the submitted version.
Conflict of Interest
The authors declare that the research was conducted in the absence of any commercial or financial relationships that could be construed as a potential conflict of interest.
Funding
The research was supported by the German Federal Ministry for Education and Research (BMBF) under grant number 03XP0163A in the frame of the M-era.Net Joint Call 2017, Project NADEA (no. 5129). Further, the European Funds for Regional Development [German: Europäischer Fond für regionale Entwicklung (EFRE)], and the LeitmarktAgentur. NRW supported the research under the grant number EFRE0800625 in the frame of the HEW-Form project.
Footnotes
- ^ https://www.thermocalc.com/products-services/databases/thermodynamic/
- ^ https://computherm.com/?docs=pandat-database-manual/database-manual/panhea
References
Abuzaid, W., and Sehitoglu, H. (2018). Plastic strain partitioning in dual phase Al13CoCrFeNi high entropy alloy. Mater. Sci. Eng. A 720, 238–247. doi: 10.1016/j.msea.2018.02.044
Aizenshtein, M., Strumza, E., Brosh, E., and Hayun, S. (2020). Precipitation kinetics, microstructure, and equilibrium state of A2 and B2 phases in multicomponent Al2.75CoCrFeNi alloy. J. Mater. Sci. 55, 7016–7028. doi: 10.1007/s10853-020-04487-9
Boettinger, W. J., Kattner, U. R., Moon, K. W., and Perepezko, J. H. (2006). DTA and Heat-flux DSC Measurements of Alloy Melting and Freezing. Washington: U.S. Government Printing Office.
Butler, T. M., and Weaver, M. L. (2016). Influence of annealing on the microstructures and oxidation behaviors of Al8(CoCrFeNi)92, Al15(CoCrFeNi)85, and Al30(CoCrFeNi)70 high-entropy alloys. Metals 6:222. doi: 10.3390/met6090222
Butler, T. M., and Weaver, M. L. (2017). Investigation of the phase stabilities in AlNiCoCrFe high entropy alloys. J. Alloy Compd. 691, 119–129. doi: 10.1016/j.jallcom.2016.08.121
Chen, H. L., Mao, H., and Chen, Q. (2018). Database development and Calphad calculations for high entropy alloys: challenges, strategies, and tips. Mater. Chem. Phys. 210, 279–290. doi: 10.1016/j.matchemphys.2017.07.082
Chen, X., Qi, J. Q., Sui, Y. W., He, Y. Z., Wei, F. X., Meng, Q. K., et al. (2017). Effects of aluminum on microstructure and compressive properties of Al-Cr-Fe-Ni eutectic multi-component alloys. Mater. Sci. Eng. A 681, 25–31. doi: 10.1016/j.msea.2016.11.019
CompuTherm Plc (2020). PanHEA. Available online at: https://computherm.com/?docs=pandat-database-manual/database-manual/panhea (accessed May 20, 2020).
Dong, Y., Gao, X., Lu, Y., Wang, T., and Li, T. (2016). A multi-component AlCrFe2Ni2 with excellent mechanical properties. Mater. Lett. 169, 62–64. doi: 10.1016/j.matlet.2016.01.096
Ganesan, M., Dye, D., and Lee, P. D. (2005). Technique for characterizing microsegregation in multicomponent alloys and its application to single-crystal superalloy castings. Metall. Mater. Trans. A 36, 2191–2204. doi: 10.1007/s11661-005-0338-2
Gao, M. C., Yeh, J. W., Liaw, P. K., and Zhang, Y. (2016). High-Entropy Alloys: Fundamentals and Applications. Cham: Springer.
Ghassemali, E., Sonkusare, R., Biswas, K., and Gurao, N. P. (2017). In-situ study of crack initiation and propagation in a dual phase AlCoCrFeNi high entropy alloy. J. Alloys Compd. 710, 539–546. doi: 10.1016/j.jallcom.2017.03.307
Gheno, T., Liu, X. L., Lindwall, G., Liu, Z. K., and Gleeson, B. (2015). Experimental study and thermodynamic modeling of the Al-Co-Cr-Ni system. Sci. Technol. Adv. Mater. 16:5. doi: 10.1088/1468-6996/16/5/055001
Gorsse, S., and Senkov, O. N. (2018). About the Reliability of CALPHAD Predictions in Multicomponent Systems. Entropy 20:899. doi: 10.3390/e20120899
Gwalani, B., Gangireddy, S., Zheng, Y., Soni, V., Mishra, R. S., and Banerjee, R. (2019). Influence of ordered L12 precipitation on strain-rate dependent mechanical behavior in a eutectic high entropy alloy. Sci. Rep. 9:6371. doi: 10.1038/s41598-019-42870-y
Gwalani, B., Soni, V., Choudhuri, D., Lee, M., Hwang, J. Y., Nam, S. J., et al. (2016). Stability of ordered L12 and B2 precipitates in face centered cubic based high entropy alloys - Al0.3CoFeCrNi and Al0.3CuFeCrNi2. Scr. Mater. 123, 130–134. doi: 10.1016/j.scriptamat.2016.06.019
Gwalani, B., Soni, V., Lee, B., Mantri, S., Ren, Y., and Banerjee, R. (2017). Optimizing the coupled effects of Hall-Petch and precipitation strengthening in a Al0.3CoCrFeNi high entropy alloy. Mater. Des. 121, 254–260. doi: 10.1016/j.matdes.2017.02.072
He, F., Wang, Z., Wu, Q., Li, J., Wang, J., and Liu, C. T. (2017). Phase separation of metastable CoCrFeNi high entropy alloy at intermediate temperatures. Scr. Mater. 126, 15–19. doi: 10.1016/j.scriptamat.2016.08.008
Jones, N. G., Izzo, R., Mignanelli, P. M., Christofidou, K. A., and Stone, H. J. (2016). Phase evolution in an Al0.5CrFeCoNiCu high entropy alloy. Intermetallics 71, 43–50. doi: 10.1016/j.intermet.2015.12.001
Leo, T. H., Ocelík, V., and De Hosson, J. T. M. (2017). Orientation Relationships in Al0.7CoCrFeNi High-Entropy Alloy. Microsc. Microanal. 23:905. doi: 10.1017/S1431927617012442
Lim, K. R., Lee, K. S., Lee, J. S., Kim, J. Y., Chang, H. J., and Na, Y. S. (2017). Dual-phase high-entropy alloys for high-temperature structural applications. J. Alloys Compd. 728, 1235–1238. doi: 10.1016/j.jallcom.2017.09.089
Lu, Y., Dong, Y., Guo, S., Jiang, L., Kang, H., Wang, T., et al. (2014). A promising new class of high-temperature alloys: eutectic high-entropy alloys. Sci. Rep. 4:6200. doi: 10.1038/srep06200
Munitz, A., Salhov, S., Hayun, S., and Frage, N. (2016). Heat treatment impacts the micro-structure and mechanical properties of AlCoCrFeNi high entropy alloy. J. Alloys Compd. 683, 221–230. doi: 10.1016/j.jallcom.2016.05.034
Nagase, T., Takemura, M., Matsumuro, M., and Maruyama, T. (2017). Solidification microstructure of AlCoCrFeNi2.1 eutectic high entropy alloy ingots. Mater. Trans. 59:2. doi: 10.11279/jfes.89.119
Rao, J. C., Diao, H. Y., Ocelík, V., Vainchtein, D., Zhang, C., and Kuo, C. (2017). Secondary phases in AlxCoCrFeNi high-entropy alloys: an in-situ TEM heating study and thermodynamic appraisal. Acta Mater. 131, 206–220. doi: 10.1016/j.actamat.2017.03.066
Shi, Y., Yang, B., Xie, X., Brechtl, J., Dahmend, K. A., and Liaw, P. K. (2017). Corrosion of AlxCoCrFeNi high-entropy alloys: al-content and potential scan-rate dependent pitting behavior. Corros Sci. 119, 33–45. doi: 10.1016/j.corsci.2017.02.019
Thermo-Calc Software (2020). TCHEA4. Available online at: https://www.thermocalc.com/products-services/databases/thermodynamic/ (accessed May 20, 2020).
Wang, W. R., Wang, W. L., Wang, S. C., Tsai, Y. C., Lai, C. H., and Yeh, J. W. (2012). Effects of Al addition on the microstructure and mechanical property of AlxCoCrFeNi high-entropy alloys. Intermetallics 26, 44–51. doi: 10.1016/j.intermet.2012.03.005
Wang, W. R., Wang, W. L., and Yeh, J. W. (2014). Phases, microstructure and mechanical properties of AlxCoCrFeNi high-entropy alloys at elevated temperatures. J. Alloys Compd. 589, 143–152. doi: 10.1016/j.jallcom.2013.11.084
Wani, I. S., Bhattacharjee, T., Sheikh, S., Lu, Y. P., Chatterjee, S., Bhattacharjee, P. P., et al. (2016). Ultrafine-grained AlCoCrFeNi2.1 eutectic high-entropy alloy. Mater. Res. Lett. 4, 174–179. doi: 10.1080/21663831.2016.1160451
Yang, T., Xia, S., Liu, S., Wang, C., Liu, S., Zhang, Y., et al. (2015). Effects of Al addition on microstructure and mechanical properties of AlxCoCrFeNi high-entropy alloy. Mater. Sci. Eng. A 26, 44–51. doi: 10.1016/j.msea.2015.09.034
Zhang, C., Zhang, F., Diao, D., Gao, M. C., Tang, Z., and Poplawsky, J. D. (2016). Understanding phase stability of Al-Co-Cr-Fe-Ni high entropy alloys. Mater. Des. 109, 425–433. doi: 10.1016/j.matdes.2016.07.073
Keywords: high entropy alloys, thermodynamic database, CALPHAD, quaternary alloys, quinary alloys, phase diagram
Citation: Stryzhyboroda O, Witusiewicz VT, Gein S, Röhrens D and Hecht U (2020) Phase Equilibria in the Al–Co–Cr–Fe–Ni High Entropy Alloy System: Thermodynamic Description and Experimental Study. Front. Mater. 7:270. doi: 10.3389/fmats.2020.00270
Received: 31 May 2020; Accepted: 20 July 2020;
Published: 06 August 2020.
Edited by:
Liqiang Wang, Shanghai Jiao Tong University, ChinaReviewed by:
Yiping Lu, Dalian University of Technology, ChinaLigang Zhang, Central South University, China
Copyright © 2020 Stryzhyboroda, Witusiewicz, Gein, Röhrens and Hecht. This is an open-access article distributed under the terms of the Creative Commons Attribution License (CC BY). The use, distribution or reproduction in other forums is permitted, provided the original author(s) and the copyright owner(s) are credited and that the original publication in this journal is cited, in accordance with accepted academic practice. No use, distribution or reproduction is permitted which does not comply with these terms.
*Correspondence: Oleg Stryzhyboroda, by5zdHJ5emh5Ym9yb2RhQGFjY2Vzcy10ZWNobm9sb2d5LmRl